1
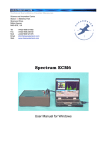
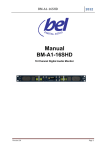
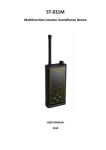
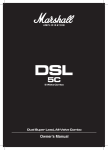
SHEARWATER TSCM Technical Surveillance Counter Measures
Technical Surveillance Counter Measures
Science and Innovation Centre
Station X, Bletchley Park
Sherwood Drive
Milton Keynes
MK3 6DS, UK
Tel
Fax Mob Email
Web +44(0)1908 677062
+44(0)1908 230732
+44(0)7836 521376
[email protected]
www.shearwatertscm.com
Merlin
User Manual for Windows
CONTENTS
Overview of Merlin ....................................................................................................3
Quick start ................................................................................................................6
First Scan ............................................................................................................7
Hit% Graph ...............................................................................................................9
Your Second Scan ..................................................................................................10
Screen shots from your second scan. ..............................................................12
Viewing and Locking out Scan Data .......................................................................13
Comparing Scan Data Files ....................................................................................15
Loading A Previously Saved Data File ..............................................................16
Program in Detail ....................................................................................................17
Main Data screen ..............................................................................................17
Entering Scan Data ...........................................................................................18
Spatial RF Scan ................................................................................................18
Scan menu ........................................................................................................19
Stop Scan .........................................................................................................19
Standard Scan ..................................................................................................19
Hold on active frequency ..................................................................................19
Resume when cleared ......................................................................................19
Resume when cleared and after delay .............................................................19
Resume after delay ..........................................................................................19
Possible Threat Warning.........................................................................................19
Spectrum Analyser .................................................................................................21
Manual Tuning ........................................................................................................22
Frequency Spectrum: Scanned Graph ...................................................................23
Individual Frequency Graph....................................................................................24
Selecting Frequencies ............................................................................................25
Frequency Breakdown Graph .................................................................................26
Save Data ...............................................................................................................27
Load Data ...............................................................................................................27
Comparing Data......................................................................................................27
Program Configuration ...........................................................................................29
Radio Settings ..................................................................................................29
Signal Settings ..................................................................................................30
Scanner Options ...............................................................................................31
Spectrum Analyser Settings .............................................................................32
Default Data Folder ..........................................................................................32
Auto-save Settings ...........................................................................................32
Video Demodulation ...............................................................................................33
Specifications..........................................................................................................35
Welcome to the Merlin Manual for Windows™ Operating Systems.
Overview of Merlin
The complete Merlin system assembled and operational
The Merlin unit
Laptop Computer
The laptop is a key part running alongside the
Merlin ECM unit
Merlin Assembly
The antenna/lid in a vertical position
Merlin main panel
The Control Panel of the Merlin showing the Volume Control, Line-In, Headphone socket,
DC in (Power) socket, Power switch, Fuse and USB sockets.
System Security
Dongle – This is the term for the security key. This is a device that contains vital licence
information. Without this device the software will not open, and it is not possible to operate
the system at all. It is therefore essential that the Dongle is not lost, and in the event that
the laptop is stolen, or there is any attempt to copy the software, the software is secure.
The Dongle (not in use)
Assembly
Place the WB2001 antenna in the stand and
connect the UHF lead (gold SMA connector).
The HF lead (black) is then connected to the tripod
mounted HF antenna.
Connect the grey RS232 connector to the laptop
serial port.
Dongle inserted in to the PC card.
Note: Please ensure the Dongle is always plugged in to the socket labelled DONGLE.
When the Dongle is operational the dongles internal light will be lit either Red or Green.
Quick start
Switch on the computer.
Locate and run the Merlin ECM program by clicking Start > Programs > Shearwater ECM >
Merlin ECM, or click the icon on the desktop.
You should now be viewing the Main Screen:
Screen shot of the Main Screen
First Scan
Go to File, and select New Scan to start your new scan:
Enter the Clients Name, Location and Plot number. Type in the Start Frequency and leave
the Step Rate at Large. Type in the Finish Frequency and click OK. You should now see the
start, finish and centre frequencies, as well as any other data.
Go to Scan and select Standard Scan to start your scan. Once you have sufficient results,
go Scan > Stop Scan to stop your current scan. You should see your results on the
computer monitor similar to this:
If your computer monitor doesn’t show this, you may not have bar chart view selected. For
a display in Bar, go to View and select Bar Graph.
You can now zoom in by double-clicking on any area of your scan. Then press Alt and Z
together and use the up and down arrows to control the zoom level.
When in the Frequency Zoom window you can listen to a frequency by double clicking on
its signal. The Select Frequency window will display.
Adjust the volume to a comfortable level by using the volume control on the Merlin and/or
the headphones. When you have finished listening to the frequency, you can exit this
window by clicking on either close or the X in the top right hand corner.
While in the Frequency Zoom window you can experiment with the mouse by double
clicking on individual frequencies on the graph or dragging the scroll bar under the graph.
Note: To exit the Frequency Zoom window, just click on the ‘Exit Zoom’ button near the
bottom right hand corner.
Hit% Graph
Once you have acquired more than one Pass, a graph of Hit% (activity) will be available. To
view this, go to View and select Hit% Graph.
The graph should look something like this:
Once in this view you still have the same options available to you.
Your Second Scan
Now we’ll try a different scan, go to File and select New Scan to enter new scan data.
Enter the Clients Name, Location, and Plot Number. Key in the Start Frequency as 153
MHz and a Finish Frequency of 155.5 MHz. Select a Step Rate of Small then click OK.
Now start the scan, press Alt-S then S again for a Standard Scan.
Use the view tab to change between Signal% (the signal strength of each frequency), Hit%
(how active each frequency is) and Signal dB (shows the decibels of each frequency)
graphs. Now switch between Line and Bar graphs.
You can set a warning triggered by the Signal% and Hit% when they exceed a chosen
percentage, to configure this go to Tools then Configurations and select Signal Settings and
choose when you want the warnings to be displayed.
A warning for signal strength will begin when a signal strength over your percentage
appears. Once the set number of passes have completed, the High Hit% warning will come
into force and show frequencies which have been active for most of the passes; you can
set the number of passes in the same dialog box. When both warnings are in place on any
one frequency, a ‘Possible Threat Warning’ is displayed.
Note: You will have to turn some of these settings on, because the default settings are off.
After 10 passes have completed, stop the scan and return to the main data screen. Go to
File and select Save File As, choose a filename and save file.
Screen shots from your second scan.
(Signal% graph)
(Hit% graph)
(Signal dB graph)
Note: The Signal dB graph is only available as a ‘Line Graph’ view.
Viewing and Locking out Scan Data
Locking out non-threat signals is a method of refining a scan in order to detect, more
readily, new signals of interest.
Upon viewing the scan data, double-click a frequency to zoom in on it, then double-click
again to listen to the frequency. If there is no threat then lock this data out by pressing the
Lock out button.
To lock out frequencies quicker, just right click on a frequency in the Frequency Zoom
window.
The red circle with a white line shows that this signal is now locked out. You can unlock it at
any time by double-clicking on the frequency and pressing the Unlock button.
Return to the Main data screen by pressing ESC twice.
Save the file again with the same filename, and if prompted, say yes to overwrite.
Go to Scan > Standard Scan to resume the scan. Select No to resuming the scan. It will
start a new scan using the last frequency settings.
Stop the scan after another 10 passes and then save with a different filename. (ie
Secondscan2.scn)
Comparing Scan Data Files
Go to Tools and select Compare Scan Files and you will be asked to choose two files for
comparing.
If you had entered a Client name this will have been used to create a folder, with an (.ECM)
suffix, for your results, if not, they will be in your default folder.
Using the Browse buttons will ease the selection of similar scans. The program will now
compare the two files.
The differences are shown in the ‘Difference Detail’ box at the top, to listen to one of these,
click on the frequency and press the ‘Monitor’ button.
You can fine-tune the frequency using the arrows above and below each number in the
manual tune window.
You can also see the number of different frequencies in a small box on the right of your
screen.
To print in text or graph form, go to the Report tab at the top and choose your desired
format. Cross off the window and you will return to the Main Data screen.
Loading A Previously Saved Data File
To reload a file which has previously been saved, go to File and select Open File… and
choose the file you wish to load.
Program in Detail
Main Data screen
The Main data screen is the main display for all the data.
From the top left, you have boxes for Clients’ Name, Scan Location, Plot No., and a date/
time stamp.
At the bottom you have boxes for Step Rate, Pass No., Bandwidth, Scan Mode, Graph
Increments, Time Started and Time Finished.
Also, when you scan, in the black boxes below the graph area, will see the Start Frequency,
Mid Frequency and the Finish Frequency.
You can choose to have a black or a white background with the check box towards the right
of the screen.
Note: Until you’ve made a scan, all boxes apart from the date/time will remain empty.
Entering Scan Data
When starting a new scan, you will be asked to enter the scan data, such as Scan Mode,
the Start Frequency, Finish Frequency and Client details.
Spatial RF Scan
Select Standard Scan.
Enter the Clients Name, this is the name of the company/person you are scanning for.
Now enter the Current location, this will be the town or city in which you are performing the
analysis.
Key in the Plot number, which will be used for the filename, and will be placed in a folder of
the same name as the Clients name (see above).
You can now enter the start frequency (from 100 kHz and 2981.28 MHz)
Next you Select the Step Rate, either Large or Small. If you wanted to scan the frequencies
quickly then select Large, but it will not have as many individual frequencies initially
selected.
Then enter the finishing frequency (from 18.72 MHz higher than the start frequency and
3000 MHz).
Note: At the bottom of the New Scan screen, you will see three pre-programmed scans
(100kHz > 3000MHz @ Large, 100kHz > 30MHz @ Large and 100kHz > 3MHz @ Small).
When the scan data is entered, press OK to continue.
Scan menu
•
•
•
•
•
•
Stop scan
Standard Scan (no stopping)
Hold on active frequency
Resume when cleared
Resume when cleared and after delay
Resume after delay
•
Auto-save data (selected by default)
Only available when scan is stopped
Stop Scan
Scan > Stop Scan (only available when scanning)
Stops any scan currently in progress
Standard Scan
Scan > Standard Scan
Starts a standard scan with no stopping, using the data you input when on the New Scan
window, such as Start Frequency, Finish Frequency and Step Rate.
The scan will not stop, if you require selection of a frequency: first stop the scan by
pressing Stop Scan (see above)
Note: The scan will stop if there is High Hit% and a High Signal% when Possible Threat
warning is enabled.
Hold on active frequency
Scan > Hold on active frequency
Starts a scan which goes from the lowest to the highest frequency, during this scan, if a
signal is passed which breaks the Signal threshold, it will display an Active frequency
window, you can choose to lock out, resume or stop scan.
Note: If you are getting a lot of high Hit% then increase the Signal Threshold for the
frequency.
Resume when cleared
Scan > Resume when cleared
This scan will ascend through the frequencies, and does the same as above, but when a
signal is cleared the scan will continue.
Resume when cleared and after delay
Scan > Resume when cleared and after delay
Does the same again, but if a cleared signal becomes active within 5 seconds, the process
is repeated.
Resume after delay
Scan > Resume After Delay
Stops scan when an active frequency is found, then continues after a 5 second delay even
if the frequency is still active.
Possible Threat Warning
This is an automatic warning facility. It responds to a combination of High Signal% and High
Hit%. There are no fixed parameters for this they have to be selected to match the criteria
for the particular locality.
The Signal% is a figure in addition to the threshold level, thus being relative to the threshold
level across the entire band of the receiver.
The default setting will assist in evaluating the required values for a specific task.
When a frequency is a High Hit% and High Signal%, the Possible Threat window will be
displayed and an alarm will sound.
Note: The Possible Threat Warning is not selected by default, it must be turned on in Tools
> Configuration > Signal Settings, you can then choose when it comes on and choose if an
alarm is sounded. See page 30
The warning sound can be changed as there are several different alarm.wav files available
from the menu.
Spectrum Analyser
The Spectrum Analyser is used to interrogate the radio frequency spectrum closely.
When you have one pass completed, you will see a green line (showing the actual trace)
and a red line (showing memory). The memory trace can be removed by un-checking the
box on the right hand side.
Enter a different Center Frequency by clicking in the middle box. Press enter to accept the
new entered data.
You can also change the Step Rate during a scan. Hold ALT+H to hold a scan and click the
resume button to resume it.
Changing the Step rate will automatically alter the other settings, including the bandwidth
and the spectrum size. i.e. reducing the step rate will result in a corresponding reduction in
the overall bandwidth scanned. (see below)
Step Rate
IF Bandwidth
Spectrum Display Size
Large
Wide
48.0000MHz
Small
Medium
1.5000MHz
Manual Tuning
With manual tuning, you can tune more precisely, using smaller increments with the arrows
above and below the numbers (top left of screen). You can also use the Auto Step buttons
on the right to scan at increments. This will scan indefinitely, up or down, as you set. (press
Stop to end scanning).
You can also change the frequency by clicking directly onto a displayed green number. A
drop down menu will appear and the required number can be selected by clicking on it.
You have the audio (FM, NFM, SFM, WAM, AM, NAM, LSB, USB and CW) and video (FM,
AM, Invert and De-Emphasis) options available, as in select frequency mode.
Frequency Spectrum: Scanned Graph
This graph shows all the frequencies that have been scanned, and can allow for close
inspection of a frequency.
Underneath the graph are the Start and Finish frequencies, then in the middle is the
frequency your cursor is currently on or the centre frequency if your mouse is out of the
Graph area.
Individual Frequency Graph
This graph displays the individual frequencies, which can be closely inspected by double
clicking on a selected signal.
Again, at the top of the screen is displayed the Clients Name, Location, and Plot Number.
The middle of the screen is the main graph display.
Selecting Frequencies
After double-clicking on a frequency, a box will be displayed with the frequency you’ve
selected.
Depending on the signal percentage, the signal will range from red to yellow: yellow being
for the strongest signal, and red for a signal below the threshold.
Just press Close or press the <Esc> key, to exit this view.
Frequency Breakdown Graph
Pressing Breakdown from the ‘Select Frequency’ window will display the Real Time
Frequency Breakdown window.
This continually scans a small band of frequencies on and about the selected frequency,
and updates accordingly.
When you select Hold, you can listen to the individual frequencies, and scan through them
by moving the mouse cursor left or right on the graph. Just press Resume again to start
scanning.
Just press Close or <Esc> to return to the Select Frequency window.
Save Data
To save a file click File and select Save. You should now enter a filename for your file, and
press ok to save.
Load Data
To load data previously saved, go to File and select Open File, then choose the file you
want, and press OK. When it is loaded you will be back at the main data screen.
Comparing Data
This part of the program is for comparing data between two files. This is used to pinpoint
frequencies that may have been overlooked, by being able to view additions and omissions
If you selected a Client name this will have been used to create a folder, with an (.ECM)
suffix, for your results, if not, they will be in your default folder.
Using the Browse buttons will ease the selection of similar scans. The program will now
compare the two files.
The differences are shown in the ‘Difference Detail’ box at the top, to listen to one of these,
click on the frequency and press the ‘Monitor’ button.
You can fine-tune the frequency using the arrows above and below each number in the
manual tune window.
You can also see the number of different frequencies in a small box on the right of your
screen.
To print in text or graph form, go to the Report tab at the top and choose your desired
format. Cross off the window and you will return to the Main Data screen.
Program Configuration
Access these settings by clicking Tools and selecting Configurations.
Radio Settings
Starting from the top, you can see a ‘Use Radio Receiver’ check-box this will be ticked by
default. To stop communication with the radio, untick this box.
With the next box, you can choose the Radio Communications port, COM1, COM2, COM3,
COM4, COM5, COM6, COM7, COM8, COM9, COM10, COM11 and COM12.
Below that, you will see another check-box, labelled ‘Use Wideband Antenna’. If this is
ticked, only the antenna connected to the UHF/VHF, connection will be employed. If it is left
un-ticked then you can change the frequency that the VHF/UHF antenna is selected. Below
this frequency the HF/VHF antenna will be selected.
The 10db attenuator need only be switched on if operations are being carried out in a very
strong radio frequency environment.
Signal Settings
On the left, you have a choice of selecting the threshold levels for particular areas on the
spectrum:
0 MHz
3 MHz
40 MHz
390 MHz
1000 MHz
–
–
–
–
–
3 MHz
40 MHz
390 MHz
1000 MHz
3000 MHz
The threshold (or squelch) is the level of signal deemed to be that transition between low
signal, of little interest and a higher signal which is being sought.
The threshold level can be set globally, or over the five individual bands.
On the right side, are two frames, the first for High Signal% warning, and the second for
High Hit% warning.
You can choose to have a Possible Threat Warning. This will display when both the High
Signal% and High Hit% levels are encountered.
You can choose the alarm sound played when the Possible Threat Warning is displayed, it
will be set to the default sound (alarm.wav). There are several alarm files to choose from
the menu.
Scanner Options
WARNING: Changing these settings, will seriously affect the program performance!
Firstly choose between scan receiver modes: FM (press ALT+F), WAM (press ALT+W).
The next setting is for how many times the signal is sampled. There is also a check-box to
choose whether to bypass the locked-out frequencies.
The default settings are:
Scan Receiver Mode: FM
Signal Sampled: 1
Bypass Locked-out Frequencies: ticked
Spectrum Analyser Settings
The options here are to change the default Centre Frequency and the Step Rate.
Reducing the Step Rate correspondingly reduces the bandwidth scanned.
Default Data Folder
With this you can choose which folder is automatically selected to save the data files in.
Auto-save Settings
Here you can choose to enable auto-save periodically and choose how often you want this
to occur. You can also set the prefix for the filename.
This facility is well suited for unattended operation and attaining a history of spectral
activity.
Video Demodulation
When you are tuned to a frequency, it can be analysed for video content. Tick the Video
Mode box then Click on the Video Capture button the Video Capture window will open.
There is a possibility that the frequency needs fine tuning. Click the Tuning button in the
Select Frequency window the Manual Radio Tuning window should display.
Click the Tuning buttons above and below the displayed frequency until a clear picture is
received. Also try to get a clear picture by selecting between AM and FM, or Invert the
image or apply De-Emphasis.
As a guide, UK broadcast TV is normal AM with De-emphasis, as is most broadcast TV.
PAL transmissions will be seen as transmitted, SECAM and NTSC display in monochrome,
and although it may not lock fully, will give a good indication as to what they are.
Clandestine video transmissions are most likely to be FM, and may be inverted.
Specifications
Frequency coverage
100 kHz – 3000 MHz
Receive modes
AM, FM, USB, LSB & CW
Nominal filter bandwidths
Small & Large
Dimensions
Weight
Main Unit
330 x 250 x 90
4 kilos
Transport Case
620 x 490 x 215
14.5 kilos complete
system.
Designed and manufactured by
SHEARWATER TSCM
Station X
Innovation Centre
Bletchley Park
Sherwood Drive
Milton Keynes
MK3 6DS
United Kingdom
Tel: (IDD 44) (0)1908 677062 Fax: (0)1908 230732
Email: [email protected] Web: www.shearwatertscm.com