1
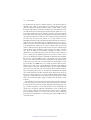
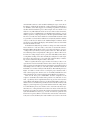
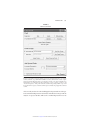
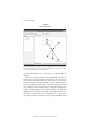
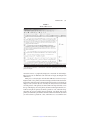
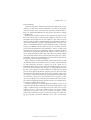
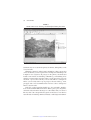
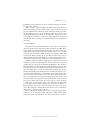
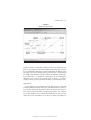
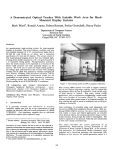
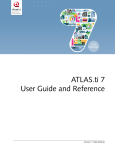
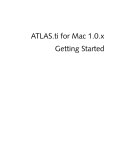
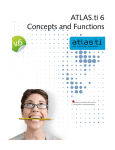
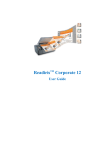
FIELD METHODS 10.1177/1525822X04269174 REVIEW ESSAYS REVIEW ESSAYS NVivo 2.0 and ATLAS.ti 5.0: A Comparative Review of Two Popular Qualitative Data-Analysis Programs ATLAS.ti 5.0, developed by Scientific Software Development. Thousand Oaks, London: Sage. 2004. NVivo 2.0, developed by Qualitative Solutions & Research. Thousand Oaks, London: Sage. 2002. DOI: 10.1177/1525822X04269174 ATLAS.ti 5.0 and NVivo 2.0 are among the best available and potentially most useful qualitative data analysis (QDA) tools. Both products enable the researcher to associate codes or labels with chunks of text, sounds, pictures, or video; to search these codes for patterns; and to construct classifications of codes that reflect testable models of the conceptual structure of the underlying data. Both are tremendously flexible programs that can be readily applied in a wide range of applications. Both also are Microsoft Windows-based products; neither program is available for the Mac OS. 1 This review examines the latest versions of these products. My remarks are aimed at prospective new users who need to decide which product may be best suited for the research tasks they have in mind. To a certain extent, this examination also revisits my comparative review (Lewis 1998) of ATLAS.ti 4.0 and NUD•IST 4.0, the latter of which can be viewed as the forerunner of NVivo. One thing I did not like about NUD•IST 4.0 and ATLAS.ti 4.0 (Lewis 1998) was that they only worked directly with a limited range of data file types. Both programs, for example, required the researcher to convert text files to ASCII or ANSI file formats before inputting them, which meant, of course, that the section and other formatting were stripped away from a text file before it was imported, a process that also made it difficult to import such things as tables and footnotes. As if this were not enough, there was the furField Methods, Vol. 16, No. 4, November 2004 439–469 © 2004 Sage Publications 439 Downloaded from fmx.sagepub.com at SAGE Publications on April 20, 2015 440 FIELD METHODS ther problem that the objective of QDA software is, after all, the analysis of qualitative data, which are nearly always more than just lines of text. Such data also include photographs, drawings, videos, sounds, smells—you get the picture. Although it has long been evident to users and software developers alike that the perfect QDA program would somehow enable one to capture nontext information, store it, compare it, classify it, integrate it with the textual data, and do all the other data management and, most importantly of all, analytical tasks that one must do in such a study, developers understand far better than users that such software is not easily written. In 1998, NUD•IST 4.0 had the facility to link nontextual data with the textual data in a study (Lewis 1998), but all this really accomplished was to give one a placeholder, a virtual note or memorandum, that other data exist that are important to the study but that could not be accessed or coded by direct means in the software. ATLAS.ti 4 was superior in this area because users could also input and code WAV-format sound files and several types of graphics and video files. Now, in 2004, the data-handling capabilities of NVivo 2.0 and ATLAS.ti 5.0 are significantly improved. To test these programs, I threw at them a complex data set. Pulled together from one of my current research projects, an ethnohistorical study of small Mysore kingdoms in South India, the test data comprised 8MB of letters, memoranda, and reports written between 1798 and 1805, which were transcribed from the original manuscripts and saved as rich-text or rtf-format files; five photographs saved as jpg-format files; two HTML files, one a simple one with no more than formatted text, the other a more complex Web page with twelve embedded jpgformat graphics; and, just to make things harder, an mp3-format sound file and a mov-format video file.2 The text documents alone would be challenging for any QDA software; they are transcriptions of handwritten documents and contain marginalia and other comments about changes in the “hand” of the writer, erasures, strikeovers, even notes about the quality and watermark of the paper on which the writer wrote. Many of these documents also contain tables, a few of which are quite complex, and most, if not all of them, contain footnotes. The following sections examine the major features, strengths, and weaknesses of both programs. The main areas addressed include: ease of installation, help for new users, interface design, inputting and managing data, coding, searches and queries, and creating models of data relationships. To anticipate my conclusions, ATLAS.ti 5.0 and NVivo 2.0 are excellent products that show significant improvements from earlier versions. Although their capabilities continue to converge with each new release, ATLAS.ti impresses me more than NVivo as a general-purpose QDA workhorse. Read on to find out why.3 Downloaded from fmx.sagepub.com at SAGE Publications on April 20, 2015 REVIEW ESSAYS 441 NVIVO 2.0 QSR International currently markets two QDA software products— NVivo and NUD•IST, the latter of which was QSR International’s first QDA package. A brief comparison of these products can be found on the QSR International Web site at http://www.qsrinternational.com/products/ productoverview/comparison.htm. Given my experience with older versions of NUD•IST (Lewis 1998), I view NVivo as an enhanced version of that product. I also believe that most users will find NVivo to be a better value than NUD•IST. Setting Up NVivo 2.0 arrives in the familiar, industry standard, shrink-wrapped box containing a CD-ROM, two manuals, and a couple of printed forms, including a software license and a product-maintenance agreement that you can purchase on an annual basis. The maintenance agreement bears looking into since product support will otherwise be limited. Depending on when your NVivo box was printed, you many find that QSR International gives conflicting information about the minimum specifications for NVivo 2.0. The outside of the box I received for this review states that the minimum system platform is Microsoft Windows 98 with 32MB RAM and 50MB of hard disk space. The company’s Web site, however, makes no mention of Windows 98 and gives the minimum as Microsoft Windows ME with 64MB RAM and 40–125MB of hard disk space. When asked about this discrepancy, a company representative noted that, while NVivo 2.0 will run on Windows 98, QSR no longer provides support for their product on this operating system. The same representative also pointed me to a helpful Web page in the product FAQ that details the currently supported operating systems and configurations (http://www.qsrinternational.com/ support/faq/FAQ/Platform.htm). The boxes currently shipping with the product no longer mention Windows 98. The NVivo manuals, both of which were written by Lyn Richards, a cofounder of QSR International, support the product well. The fifty-twopage Getting Started in NVivo (Richards 2002a) is the obvious place for a new user to start. It offers the reader a twelve-step guide to NVivo’s main features and does a very good job of it. The other manual, titled Using NVivo in Qualitative Research (Richards 2002b), follows the same twelve-step format as the Getting Started guide but covers these steps in greater detail, taking 165 pages to do so. As I learned NVivo’s capabilities, I found myself refer- Downloaded from fmx.sagepub.com at SAGE Publications on April 20, 2015 442 FIELD METHODS ring more often to the Getting Started guide for answers than to the Using NVivo manual because the latter is designed to be both a user manual and an introduction to qualitative data analysis, which means you sometimes have to hunt around in it for program-specific answers. Both manuals are, however, well-organized and follow the same chapter format. The Getting Started manual includes more screen shots of the program in use, which I always find helpful; it is also better edited. The Using NVivo manual contains several sections with glaring typographical errors and editorial lapses (e.g., on pp. 10–11, a three-sentence passage is repeated almost word for word a quarter of a page later). The online help facility is extensive, well-designed, and offers more detailed information than either of the printed manuals. There are also several online tutorials, each of which is aimed at a different set of tasks or level of proficiency in the use of the product. Taken as a whole, NVivo’s documentation is reasonably comparable to that of ATLAS.ti. The main manuals for both products take slightly different approaches, but the user is well served in each case. As with every major software product on the market today, QSR International’s Web site (http://www.qsrinternational.com) offers additional information and help. There is also a mailing list; to subscribe to the QSR forum, send the message SUBSCRIBE qsr-forum your_first_name your_last_name to [email protected]. Lyn Richards and others have done a particularly fine job of bringing NVivo and other QSR products to the attention of researchers (and prospective customers) by publishing QDA textbooks that feature this software (e.g., Bazeley and Richards 2000; Gibbs 2002; Morse and Richards 2002). QSR International also recently supported a conference that yielded a Qualitative Research Journal special issue, titled “Teaching Qualitative Research with QSR Software” (Singh 2003). This kind of support has been a smart business move on the part of QSR International because it helps build the market and sell their products at the same time. Inputting and Managing Data When you start NVivo, you are presented with a small window called the Launch Pad, which is essentially a button pad of four basic choices: create a new project, open an existing project, open a tutorial, or exit the program. Simple but direct. Clicking on any choice other than exiting the program takes you to more screens that help you set up your project or choose an existing project or tutorial. NVivo allows the user a lot of control over the creation of a new project; it can be given a title and summary description in several Downloaded from fmx.sagepub.com at SAGE Publications on April 20, 2015 REVIEW ESSAYS 443 FIGURE 1 NVivo Project Pad NOTE: The Project Pad is the default interface for accessing NVivo’s main functions. From it, you can create, explore, or browse documents or nodes and create or explore the document or node sets or their attributes. convenient ways, and a password can be assigned to control access to the database. Just do not forget the password or your NVivo project is toast because there is no backdoor by which it can be retrieved (i.e., write down the password and keep it in a safe place). Once you have created or chosen a project, you are presented with NVivo’s default main screen, the Project Pad (see Figure 1), which organizes NVivo’s most common tasks into a series of button panels. Advanced NVivo users will probably want to turn off the Project Pad and work from the alternative main interface, which retains the menu bar of the Project Pad and adds floating document and node browsers (see Figures 2 and 3). What kind of qualitative data can NVivo 2.0 handle? One can easily import or create ASCII or ANSI text (i.e., plain text) and rich-text format4 Downloaded from fmx.sagepub.com at SAGE Publications on April 20, 2015 444 FIELD METHODS FIGURE 2 NVivo Document Explorer NOTE: Using this well-designed Windows Explorer-like interface, you can create, search, classify, and analyze project documents easily. The leftmost panel of the Explorer window shows the documents and document sets that have been incorporated into the study. The rightmost window shows the title and other basic characteristics of each document. (*.rtf) text files.5 The rich-text capability is a real plus. What it means is that if, for example, you are working with a set of transcribed interviews that have been formatted nicely in a word-processing package that can also save its files in rtf-format, you can import them easily into NVivo and have the result look like it does in the word-processing software that created it. There is, however, far more at issue here than pretty formatting. If you have been smart and used your word processor’s “style sheets”6 facility to format your text file, NVivo can use the assigned styles as an implicit outline of the structure of your documents to ease the task of autocoding and defining the scope of searches. Unfortunately, this only works for rich-text text. Although NVivo can handle texts in non-Roman characters, such as Chinese and Japanese, it cannot import rich-text files that contain tables or graphics of any kind, nor can NVivo (or ATLAS.ti) import the footnotes in these documents. When I attempted to import the rtf-format test data used for this review, NVivo rejected out of hand all the files with tables.7 The workaround I found was to convert the tables to text before saving to rtf-format the files of which they were a part. I could then import and, more important, code the entire docu- Downloaded from fmx.sagepub.com at SAGE Publications on April 20, 2015 REVIEW ESSAYS 445 FIGURE 3 NVivo Node Explorer NOTE: Employing the same interface as the Document Explorer, the Node Explorer offers a node-centered perspective of the project documents. The leftmost panel shows the free, tree, and case nodes that have been created in the study. The number in parentheses is the number of nodes assigned to a given nodal category. The rightmost panel shows a list of the free nodes in the project, the number of document passages to which each node has been coded, and other details specific to each node. ment directly. NVivo also turned away two additional text files because, according to the NVivo error message, both contained “an embedded object that can not [sic] be imported.”8 On inspection, both files proved to contain only text. On a hunch, I opened and saved the problem rtf-format files in Sun’s StarOffice 6.0,9 which is often good at stripping away Microsoft artifacts from HTML files, and tried importing the files into NVivo again. It worked this time. ATLAS.ti 5.0 imported the same two files without a murmur of concern, which makes me think that there is either a glitch in NVivo’s implementation of the rtf-format specifications or these specifications have changed a little since 2002, when NVivo 2.0 was released. NVivo and ATLAS.ti are strikingly different in how they handle nontext data. NVivo’s approach is to enable the researcher to work indirectly with tables, pictures, sounds, video, or HTML files. Its manual recommends that users save tables, audio, pictures, and any other nontextual data as separate files in their respective formats and then include them in a project’s database as “proxy files” or “DataBites,” both of which enable the user to access the Downloaded from fmx.sagepub.com at SAGE Publications on April 20, 2015 446 FIELD METHODS external data by opening it in the application that created it. For example, let us say I have a set of photographs of mud brick granaries that I want to include in my NVivo database. It is impossible to view or code these pictures directly in NVivo, but I can make a proxy file for each picture, which creates a text document in the database and links it to the photo. I can then add the salient information, including relevant coding, about each picture in the proxy document. A company representative reports that NVivo’s indirect approach for working with nontext qualitative data works well for many users. I see it more as a product shortcoming that significantly narrows the field of potential NVivo applications, and I recommend that prospective NVivo users give careful thought to their need for these capabilities. Coding Nodes The large tabs at the top of the Project Pad (see Figure 1) identify documents and nodes, NVivo’s two main working frameworks. Both documents and nodes can be created, explored, or browsed. The Document and Node Explorers (see Figures 2 and 3) mimic the logic and interface of Microsoft Windows Explorer (a core utility application that gives users a graphical tree diagram of the locations and properties of files), and most of NVivo’s analytical capabilities can be accessed from these Explorers. Whereas the Explorers enable the user to examine and manage hierarchical trees of documents and nodes, Document and Node Browsers display individual documents and nodes, and coded passages in the documents. The Node Browser is a powerful tool for displaying, coding, and “recontextualizing” data (Richards 2002b:84–85) that enables the researcher to focus attention on the material coded at particular nodes and reassess or change the coding. Documents also can be edited (or created) in NVivo and the changes saved without affecting existing coding of the document. Memos that, if used effectively, greatly help self-document a project as it develops, can be attached to just about anything in a NVivo database. I could, for example, cut and paste the lost footnotes from the test documents from the original wordprocessing files to memos attached to the same respective target passages in my project documents. Two other important components of the Project Pad are tabs for editing and exploring sets and attributes of the documents and nodes in a project (see Figure 1). For the test data, NVivo groups such things as the documents written by a particular person or nodes pertaining to military stores. For example, the left panel of the Document Explorer in Figure 2 illustrates the use of sets to organize the Mysore test data documents according to particular reports Downloaded from fmx.sagepub.com at SAGE Publications on April 20, 2015 REVIEW ESSAYS 447 and chiefdoms. Such sets can be useful for defining the scope of searches of the database or filtering the documents or nodes included or excluded from a set. Attributes, as the name suggests, are such things as qualities or states that describe entities included in a project. For example, were we to define a case node for every individual who wrote at least one of the test data documents, and then associate each individual’s age, English language fluency, years of military experience, religious preference, and other personal attributes with his or her case node, these data would be associated with all documents coded to a particular case node. NVivo attributes are analytically useful in a number of ways, not the least of which are the Attribute Explorer windows, which give the user a spreadsheet-like display of the attribute values associated with selected documents or nodes. To understand readily the logic of NVivo’s design, one must note the difference between a code and a node, as the terms are used in this software. Richards (2002a:30) described a node as a location and coding as a process: “coding is the way in which you store pointers to the text.” The node, therefore, holds the pointers assigned by the coding process. NVivo offers excellent tools for coding and gives users a great deal of flexibility in how this is accomplished. Coding can be done manually by reading the text and assigning nodes to selected passages, or it can be done automatically by constructing searches and then saving the results as new nodes. NVivo recognizes three basic types of nodes: free nodes (or codes or concepts that have not been formally related to other codes in the project), tree nodes (or groups of nodes that have been organized into a formal hierarchical relationship), and case nodes (or codes that organize information about the individual cases or units of analysis in the database). The Node Explorer (see Figure 3) is NVivo’s main tool for accessing the project database from a node-centered perspective. From it, one can essentially undertake the same analytical tasks that one can do from the Document Explorer (see Figure 2). Gone for the most part is NUD•IST’s obsessive emphasis on the sequences of numbers that indicated the position of each branch of a tree node, a peculiarity that I complained about in my previous review (Lewis 1998). While such number sequences are still around in NVivo 2.0 (recognizable as the sets of numbers in parentheses before node titles in many node displays), you no longer have to pay much attention to them in coding, which is no small blessing in my view. Nodes can be created, moved about, organized into sets, or merged with no more than a few mouse clicks and some thought given to what you are doing. If your data are rtf-format text files with style sheet-delimited sections (e.g., sections for interview questions and interviewee responses), NVivo’s Section Coder can be used to code automatically each section, whether by the order in which each section occurs in the Downloaded from fmx.sagepub.com at SAGE Publications on April 20, 2015 448 FIELD METHODS text or by each unique heading. It is a useful feature, especially for interviewbased projects, and one for which there is no direct counterpart in ATLAS.ti. Searches and Assays Like its forerunner NUD•IST, NVivo excels at searching and the use of searches for autocoding patterns in texts. Figure 4 shows a simple example in the Search Tool window that uses wildcards to search for words and parts of words that contain the string “gate.” The search criteria are set to examine all documents for this string and to assign paragraphs within which the string occurs to the node “Gateways.” Although I created a free node called Gateways before performing this search, I could have created it on the fly within the search specification, or merged the result of this search with existing passages that had been coded against Gateways. More complex searches are as easy to specify and perform as the simple ones. You can search nodes (e.g., identify the document sections that have been coded for “Dhoondia life”), attributes (e.g., identify the documents written by adult females), Boolean expressions (e.g., identify the passages in which granaries are mentioned but not powder magazines), and proximity searches (e.g., identify the passages in which the strings “cannon” or “cannons” are in the same paragraph as “fortification walls” and “expense magazine” and contained in a document written by Colin Mackenzie). Sets can be used to efficiently define the scope of searches. As with other kinds of searches, the results are returned as new or existing nodes. As coding progresses, the Show and Assay tools and profile tables become useful. The Show Tool, which is accessed from the Project Pad or by right-clicking on an item in one of the Explorer windows, gives details about the nodes and documents that relate to the selected document or node. The Assay Tool operates on documents or nodes and is used to create two-way tables, each cell of which displays the count or frequency with which the compared items are coded on the selected documents or nodes. Profile tables are superficially similar to assay tables but are based on counts of characters or text passages that have been coded on nodes, documents, or by the values of a selected attribute. Assay and profile tables can be exported as tabseparated text files and SPSS *.dat-format files. Creating Models NVivo and ATLAS.ti have largely converged in how they handle the interpretive networks or models that may emerge from the analysis of a set of documents. The hierarchical network bias that dominated NUD•IST 4.0 (Lewis 1998) has also been lessened. The Model Explorer (see Figure 5) pro- Downloaded from fmx.sagepub.com at SAGE Publications on April 20, 2015 REVIEW ESSAYS 449 FIGURE 4 NVivo Search Tool NOTE: Autocoding by searches is well-organized in NVivo. The three-part Search Tool enables the user to specify the search target with great precision (and imprecision in the case of fuzzy searches), define the scope within which to limit the searches, and how much context to capture with each search hit. The figure shows a search for the text string “gate” using a wildcard search (which, in this case, returned passages that contained gate, “gates,” “gateway,” “gateways,” and “Voocharanaugatecara,” among other words that contain the target string) within a scope of all the documents in the project, and with search hits spread to include the paragraph that contained each hit. vides an easily used set of tools to build graphical representations of the patterns and relationships between documents and nodes that emerge from the analysis of a project database. This tool is a marked improvement over its Downloaded from fmx.sagepub.com at SAGE Publications on April 20, 2015 450 FIELD METHODS FIGURE 5 NVivo Model Explorer NOTE: Models of possible data relationships are easily created and modified. The left panel shows a list of all models created in the present project. The main work space is the right window, in which graphical representations of possible relationships between documents, nodes, memos, sets, and even other models are created and modified. counterpart in NUD•IST and is comparable to the Network Editor in ATLAS.ti. Figure 5 shows a simple model of a relationship in the Mysore test data set between the types of storage facilities found in forts, the carts that were the main means by which these facilities were filled, and a 1798 report on the condition of forts that lay along possible lines of advance of East India Company forces into Mysore from their bases on the Tamil coast. The documents, nodes, attributes, sets, and other elements in a model can be added in several ways, perhaps the easiest of which is simply to drag them from an Explorer window to the Model Explorer. Once added, relationships are signified by adding links between elements. For example, I added links to show that “circular mud,” “rectangular mud,” and “rectangular masonry” are types of storage facilities (see Figure 5). Interpretive text tags that visually illustrate this Downloaded from fmx.sagepub.com at SAGE Publications on April 20, 2015 REVIEW ESSAYS 451 relationship can be added to the link lines by right-clicking on each line and typing the label text in the link line properties window. Model elements can be grouped; style formats can be created and applied; you can even create separate model representations of a data set as discrete layers, which is a handy feature when you want to consider different interpretations of the same data. And, as you might expect, you can browse or code nodes and show documents coded at nodes and memos by simply right-clicking on a model element and choosing the action you wish NVivo to perform. In sum, NVivo 2.0 offers researchers an easy-to-use, flexible environment within which to organize, classify, code, and search for patterns in textual data. The interface and data-handling capabilities are much improved over NUD•IST. NVivo 2.0 is an excellent choice of QDA software for interviews and other text-based projects. Its greatest weakness is its inability to import, code, and search nontext data by direct means in a project database; this cannot help but limit its utility as a general purpose QDA tool. ATLAS.TI 5.0 In my earlier review (Lewis 1998), ATLAS.ti emerged as the clear winner in the overall product comparison. ATLAS.ti 5.0, which was released June 15, 2004, builds on this success. Thomas Muhr and the Scientific Software Development team worked hard to produce a program that could be the new standard against which such products are measured. Although NVivo 2.0 is tough competition in some areas, ATLAS.ti 5.0 is an outstanding product. Setting Up The recommended system configuration to run ATLAS.ti 5.0 is a Pentium/AMD 900 MHz or greater machine with Microsoft Windows 2000 or XP, 256 MB or more RAM, and 45 MB hard drive space. The minimum configuration is a Pentium/AMD 133 MHz machine with Microsoft Windows 98SE, 64 MB RAM, and 25 MB of available hard disk space. Packaging information for the new ATLAS.ti 5.0 was not yet available when this review was prepared. ATLAS.ti 5.0 ships with two excellent manuals that meet the same high standards as the software application itself. Like its NVivo counterpart, the thirty-page Quick Tour for Beginners manual provides the basic training that most users will need to turn to first. With it in hand, the new user will be quickly oriented to the program’s basic features and how to use them. The much heftier User’s Guide and Reference (417 pages) manual delivers just Downloaded from fmx.sagepub.com at SAGE Publications on April 20, 2015 452 FIELD METHODS what its title suggests. It is an exhaustive, well-written guide to ATLAS.ti’s capabilities, which also includes considerable helpful advice for users upgrading from ATLAS.ti 4. Unlike the Using NVivo manual, the ATLAS.ti User’s Guide and Reference does not attempt to teach the basics of qualitative data analysis at the same time. The CD-ROM version of ATLAS.ti 5.0, which will be available by the time this review appears in print, will include several online movies that guide the beginning user through the basic features of the ATLAS.ti 4.2 version of the program. I was skeptical of this approach when I first encountered it with ATLAS.ti 4.1, but, after trying it, I realized that it can be quite effective. An online version of the tutorial, updated for version 5.0, is planned. If the manuals, the help file, or the tutorials are not enough, there is always the ATLAS.ti home page at http://www.atlasti.com, which has links to many excellent examples of the program’s capabilities, and the ATLAS.ti mailing list (send the message SUB ATLAS-TI first_name last_name your_institution to [email protected]). Inputting and Managing Data One of the most impressive strengths of ATLAS.ti 5.0 is the range of data file types that you can import and work with directly. Your primary documents are in Chinese or Hebrew characters? No problem. As with NVivo, the text does not have to be in transliterated into Roman characters and it does not have to scan from left to right. Pining away to code 3,000 sound bites from the evening news or hundreds of photographs of traffic accident scenes? No problem here either. ATLAS.ti 5.0 imports Microsoft Word and Works, Windows Write, and WordPerfect files, along with ASCII or ANSI text files, and files saved as rtf-format; Microsoft Excel and Lotus 1-2-3 spreadsheets; Microsoft PowerPoint; HTML; sound files (*.au, *.snd, *.mp3, *.wav formats); video files (*.avi, *.mpg, *.mov, *.qt, *.wmv); and many graphics file formats (the list of importable file formats depends on the Media Control Interface drivers installed on your computer). These capabilities alone make ATLAS.ti warrant serious attention by every QDA researcher. When you start the ATLAS.ti application, you are presented with the concept of a “Hermeneutic Unit,” perhaps the most unintuitive concept in the entire program. Hermeneutic Unit (HU) is Scientific Software Development jargon for “project” or “database.” Regardless of what you call it, the HU contains all the primary documents (texts, graphics, HTML, videos, or sound files) for a given project. Within each primary document, the analyst can select specific quotations and assign codes, the latter of which can be grouped into families. Quotations and coded objects can be further docu- Downloaded from fmx.sagepub.com at SAGE Publications on April 20, 2015 REVIEW ESSAYS 453 FIGURE 6 ATLAS.ti Main Screen NOTE: Passages of the primary document open in the left window have been assigned codes, each of which are indicated by a code label and a vertical bar spanning the passage in the right panel of the display. mented in memos or graphically displayed as networks of relationships. These main parts of ATLAS.ti work well and are largely unchanged from ATLAS.ti 4. Most project activity begins and ends with ATLAS.ti’s main screen (see Figure 6). The active primary document is displayed in the leftmost window. To the right of the primary document window is the margin area in which one displays codes (or other objects) created by the analyst and associated with selected portions of the primary document. The four drop-down lists across the top of the display, above the primary document and margin windows, are, from left to right, the primary document, quotation, code, and memo dropdown lists. To open an existing primary document, you simply click on the primary document drop-down list to unroll it and then click on the document you want to browse; quotations, codes, and memos are accessed in the same Downloaded from fmx.sagepub.com at SAGE Publications on April 20, 2015 454 FIELD METHODS way from their respective drop-down lists. The topmost row of buttons performs major program functions, while the column of buttons that runs down the left side of the screen activates particular features associated with the display, coding, and analysis of project documents. I tested the ease of data input in ATLAS.ti by importing the same Mysore test data set that I used for NVivo. Although ATLAS.ti can import Microsoft Word files in their native *.doc format, I elected to import them as rtf-format files because the latter can be edited in ATLAS.ti. The program imported the test files without so much as a murmur of complaint. In general, the rtfformat text files were imported with better results than the same files in NVivo, but neither program can handle footnotes. Unlike NVivo, ATLAS.ti imported rtf-format files containing a mix of text, tables, and photos with a high degree of success. It also imported Microsoft Excel spreadsheets, several jpg-format photos, HTML files, and an mp3-format rap tune called “Welcome to India” without a hitch. It would be astounding if ATLAS.ti could import such a diverse collection of file types without any problems bubbling to the surface, and, sure enough, there were a few. One consistent problem was ATLAS.ti’s inability to wordwrap long strings of text in the cells of imported tables. According to the ATLAS.ti 5.0 “readme” file that describes the product’s main features, the way a document displays in Microsoft WordPad is generally what you should expect to see in ATLAS.ti. Sure enough, WordPad has the same wordwrapping problem with long strings in table cells, so ATLAS.ti must be forgiven on that score. Interestingly enough, however, if you generate a report that contains some or all of these tables from within ATLAS.ti running on Windows XP, the rtf-format file it produces wordwraps flawlessly and the tables look like they did in the original. ATLAS.ti also experienced problems with relatively complex HTML documents. One of the test HTML files, for example, contained Microsoft photo gallery entities, a relatively new Webbot feature that ATLAS.ti apparently cannot load. Generally speaking, however, ATLAS.ti’s performance in this area is nothing short of brilliant by comparison with NVivo. If you cannot get your data into ATLAS.ti, then you probably are not trying very hard. As with NVivo, primary documents also can be edited in ATLAS.ti, but many users may fail to appreciate how complex the editing of an indexed text can be, especially if the documents in question are being accessed and modified as part of a team-based research project—for single-user projects, it is not such a big deal. ATLAS.ti’s documentation takes pains to instill good editing practices in its users and includes several features to facilitate teambased research projects that share one set of primary documents. Downloaded from fmx.sagepub.com at SAGE Publications on April 20, 2015 REVIEW ESSAYS 455 Codes and Memos Coding is easily done in ATLAS.ti, and without the quirky node concerns of NVivo. As with earlier versions of ATLAS.ti, codes, memos, hyperlinks, and even networks can be created on the fly and associated with elements of the text as small as individual letters, words, phrases, and sentences, right up to the HU itself. Figure 6 shows a simple example of codes assigned to passages in one of the test documents. The second paragraph in Figure 6 expresses an early nineteenth-century fortifications review committee’s view of the state of the defensive works at a hill fort called Chitradurga in South India. To illustrate my point that ATLAS.ti is capable of working with diverse scripts, the committee’s recommendation has been rendered in Kannada script,10 a Dravidian language of South India. In the rightmost panel, the vertical bar spans this passage and is labeled with the word “Chitradurga,” which is a code I created and assigned to all references to Chitradurga in the test document set. These code labels are in the Roman alphabet, but ATLAS.ti 5.0 also enables the user to change the labels to other scripts easily. That you can have multiple codes associated with the same text segment is shown by the codes “Gates” and “Walls,” which is associated with the passage that begins at the bottom of the leftmost panel of the display in Figure 6. Figure 7 takes the example a little further and demonstrates that, not only can ATLAS.ti import nontext files, but you can actually code them directly too. The photograph in Figure 7 depicts part of the citadel area of Chitradurga. Many, but by no means all, of the cultural features present in this area have been assigned codes. The logic of coding graphical objects is the same as that applied to text. The numbered rectangles in the leftmost panel are the graphical equivalent of coded text passages. The vertical bars and the labels in the rightmost panel correspond to each of the coded graphical “passages.” And, yes, the margin pane can get cluttered when many codes are assigned to a short passage span, whether it be text, graphics, or other objects, and ATLAS.ti users can make many modifications to the code display panel by simply right-clicking on that part of the screen and then choosing how they want the display to look. Coding in ATLAS.ti is not all that different from NVivo. Codes can be assigned to selected portions of primary documents manually either by “open coding,” in which you type a word or phrase to become a new code associated with the passage; by “code by list,” in which you select one or more existing codes from a pop-up list; “code in vivo,” in which you enable a word or phrase from a selected text passage to create itself as a new code; and by simple “drag-and-drop” procedures. ATLAS.ti’s “free codes” are effectively Downloaded from fmx.sagepub.com at SAGE Publications on April 20, 2015 456 FIELD METHODS FIGURE 7 ATLAS.ti Main Screen Showing a Coded Graphical Primary Document just labels; they are not attached to primary documents, although they can be at any later time. ATLAS.ti’s automatic coding feature is helpful for coding concepts that can be described by a search expression. For example, the Chitradurga code in Figure 6 was assigned to all passages in the primary documents that include some mention of Chitradurga, Chittledroog, or Chittaldrug, all of which are variations of the same name, using a search expression to scan each document, a process that took only a few seconds. Like its counterpart in NVivo, you can easily set the scope of passages to be autocoded (e.g., word, paragraph, and so on), but ATLAS.ti does not have a direct counterpart to NVivo’s Section Coder. Codes also can be grouped into families (e.g., the code family “Fortifications” in the test HU includes the bastions, ditches, glacis, gates, magazines, and walls codes). The main advantage of a code family is that you can use it like any other code to design elaborate queries of the data set or use them as network nodes in modeling. ATLAS.ti includes a well-designed Code Fam- Downloaded from fmx.sagepub.com at SAGE Publications on April 20, 2015 REVIEW ESSAYS 457 ily Manager tool to facilitate the process of creating and managing code families and “super” families. Audio and video coding is handled by the MediaControl tool, which is a small panel with the necessary controls to play, replay, mark, and code passages of multimedia files. I tried it out on the “Welcome to India” mp3 audio file and found it easy to use. As one would reasonably expect, the video version of the MediaControl tool features all of the audio controls, plus a small screen. ATLAS.ti would not recognize my Apple Quicktime mov-format video file, but, after converting it to avi-format, the file was easily displayed and coded.11 Searches and Queries Among the many strengths of ATLAS.ti 4 were its tools for searches and queries to identify text patterns in the primary documents of an HU. These tools continue to be important features of the latest version. Searches can be simple text searches or regular expressions using the syntax of grep, a regular expression search tool in the UNIX operating system (Jeffrey 2002). The search feature displays the hits one by one. More useful in my view is the ATLAS.ti Object Crawler, with which you can design searches that give you considerable control over scope and the objects to be included in the search. ATLAS.ti’s ability to construct complex queries continues to be an area in which the program really shines. Figure 8 shows the Query Tool, the layout of which appears to be largely unchanged from ATLAS.ti 4. The column of buttons down the left side of the window signify the Boolean, semantic, and proximity operators used to delimit a query. The upper-right-hand pane displays an example query, a search for all quotations in which there is some mention of Chitradurga, but nothing that has to do with fortifications or storage facilities (both of the latter are code families, which can be thought of as sets of associated codes) within five lines. The lower-right-hand pane displays a scrollable list of the hits generated by this query. Left click on a hit and the main HU screen displays the appropriate primary document at the target passage. The results can also be saved to a file as a report or printed. Code queries can be stored as “super codes,” which also are displayed in the drop-down code list. Unlike a simple code, super codes are queries, not links to particular text passages. In practical terms, this means you can use super codes and queries constructed from nested super codes as a framework within which to construct complex queries. Two-way frequency tables that show counts of assigned codes by primary documents can be constructed using ATLAS.ti’s cumbersomely named Codes-Primary-Documents-Table feature, which is analogous to NVivo’s Downloaded from fmx.sagepub.com at SAGE Publications on April 20, 2015 458 FIELD METHODS FIGURE 8 ATLAS.ti’s Query Tool NOTE: The query tool is one of ATLAS.ti’s many strengths, but not, however, one that has intuitive appeal. Plan on spending a few minutes working with the tool before you feel comfortable using it. Assay Tool tables. These two-way frequency tables can be generated as text files or as tab-, semicolon-, or comma-delimited files. The latter are easily imported into Microsoft Excel and most statistical data analysis software packages. ATLAS.ti has no direct counterpart of NVivo’s profile table feature. Creating Networks As stated earlier, ATLAS.ti’s tools for creating and displaying network views of data are comparable to their counterparts in NVivo. Figure 9 shows a network of the historical and functional relationships between some of the test data codes, all centered on their relationship with Chitradurga. It was created with a few clicks in ATLAS.ti’s Network Editor. The left half of the Downloaded from fmx.sagepub.com at SAGE Publications on April 20, 2015 REVIEW ESSAYS 459 FIGURE 9 ATLAS.ti’s Network View NOTE: Constructing and displaying conceptual networks are easily done in ATLAS.ti. graphic are features of Chitradurga’s built environment, all of which are spatially associated with each other. One building stands out because it is one of the few identifiable Chitradurga structures built during the British period. The poligars were the local rulers of the region before it was conquered in the late 1700s, first by the Mysore sultanate and then by the British, and this relation is indicated as a “contradiction” relationship in the network diagram. Although I used codes for the network nodes in Figure 9, quotations, graphics, sounds, or primary documents would have served equally as well. Other Features Space limitations do not permit more than passing mention of a few other interesting ATLAS.ti features. First, there is the Word Cruncher, which can be accessed from the Tools item in the menu bar. Word Cruncher performs a basic content analysis task, which is word frequency display. We could ask, for example, about the extent to which the transportation of siege stores figured in the reports on the Mysore forts. Short of reading and coding more Downloaded from fmx.sagepub.com at SAGE Publications on April 20, 2015 460 FIELD METHODS than twenty reports, one quick measure would be to examine the frequency with which the authors of the reports mentioned bullocks and carts, the main means by which stores were conveyed in Mysore at that time. Word Cruncher shows us that, among the 12,005 discrete words in these reports, there are seventeen references to bullocks and six mentions of carts (and variations of both words); all but one of these mentions are contained in the two formal reports made by the fortifications review committees, which certainly suggests that they were concerned about the army’s ability to provision the forts under review. The next step would presumably be carefully to read these two reports and also examine the orders given to the officers who were charged with conducting the reviews. Second, ATLAS.ti can generate a wide range of output and reports based on your analysis of an HU. ATLAS.ti data entities can be exported in HTML or XML (eXtensible Markup Language) format. XML is designed to ease the task of working with structured data (e.g., Web pages, books, warehouse inventories) and, like HTML, is an SGML (Standard Generalized Markup Language) application (Harold and Means 2002). If you are unfamiliar with XML, ATLAS.ti includes examples of it in action that will definitely catch your attention. As in ATLAS.ti 4, codes and code families can also be exported as an SPSS syntax file for quantitative analysis. To sum up my examination of ATLAS.ti, it is an outstanding example of creative software design and I look forward to using it in my own research. Scientific Software Development has kept the best features of previous versions and taken some giant steps in improving ATLAS.ti’s ability to work with a wide range of qualitative data. I am particularly impressed by the facility with which one can directly code, query, and analyze text, audio, pictures, video, HTML, and other data types in ATLAS.ti 5.0. This feature alone gives ATLAS.ti a tremendous competitive edge over NVivo, which can only directly analyze text. Given its many outstanding features and its data-handling capabilities, ATLAS.ti is an excellent choice for just about any QDA research project. CONCLUSIONS NVivo and ATLAS.ti are both fine products and useful tools for QDA researchers. The learning curves for these packages also are similar. ATLAS.ti is clearly the more versatile of the two, but it may hold its lead only briefly. The current production version of NVivo was released in 2002 and it is reasonable to assume that QSR International has its own plans for a new Downloaded from fmx.sagepub.com at SAGE Publications on April 20, 2015 REVIEW ESSAYS 461 and improved NVivo in the next year or two. Until then, there is little about ATLAS.ti not to like; it is an excellent general-purpose QDA package. NVivo 2.0 strikes me as a good choice for interviews and other text-based research, but once the data move beyond relatively straightforward texts, I would turn to ATLAS.ti because it can import, display, code, and analyze such a wide range of qualitative data types. As always, what works for me may not be the answer for you, so download demo versions of both products from their respective Web pages (see the appendix for the addresses) and try them out before making your final decision. If you are a new user of such programs, you would be ill-advised to install one of these packages right out of the box and jump right into your study. They are too complex. Plan on spending at least a few days to a week to become familiar with the package you choose before expecting to apply it, even clumsily, in research. And be grateful you are not doing this kind of research back in the days when it featured such fun activities as papering your office wall with Post-It notes or 4 × 6 cards, perhaps even gussied up with diverse highlighter colors. APPENDIX Additional Information about NVivo 2.0 and ATLAS.ti 5.0 Characteristic ATLAS.ti 5.0 NVivo 2.0 Minimum Windows 98 and ME, NT4.0 (sp 6), system 2000, XP, 2003; Intel Pentium/ requirements AMD 133 MHz processor, 64MB RAM, 25MB hard disk space Windows 98 and ME (32MB RAM), NT4.0 (sp 5; 48MB RAM), 2000 (64MB RAM), XP (128MB RAM); Intel Pentium 400mhz processor or equivalent, 40MB–125MB hard disk space Manuals 417-page user and reference guide; 30-page quick tour manual 165-page user guide; 52-page “Getting Started” manual Help Online help file, Web page, mailing list Online help file, Web page, mailing list Document types Rich text (*.rtf), ASCII or ANSI text Rich text (*.rtf), ASCII or ANSI text (*.txt); MS Word; MS Works 4.0; (*.txt) Windows Write; WordPerfect; MS Excel and Lotus 1-2-3 spreadsheets; HTML; sound files (*.au, *.snd, *.mp3, *.wav); video files (*.avi, *.mpg, *.mov, *.qt, *.wmv); and many graphics file formats (continued) Downloaded from fmx.sagepub.com at SAGE Publications on April 20, 2015 462 FIELD METHODS APPENDIX (continued) Characteristic ATLAS.ti 5.0 NVivo 2.0 Demo version download http://www.scolari.com/ http://www.scolari.com/ Web page http://www.atlasti.com http://www.qsrinternational.com Ease of use Excellent Excellent Value Excellent Very good Single license pricing $950, retail; $470, educational; $180, student; site licenses, upgrades and volume discounts available $735, retail; $445, educational; site licenses and NUD•IST 5–6 and NVivo 1.* upgrades available Where can you buy it? Scolari Sage Publications Software 2455 Teller Road 6 Bonhill Street Thousand Oaks, CA 91320 London, EC2A 4PU United Kingdom phone: (805) 499-1325 phone: +44(0)20 7330 1222 fax: (805) 499-0871 fax: +44(0) 20 7374 8741 e-mail: [email protected] e-mail: [email protected] NOTES 1. One solution for the Mac OS is Microsoft Virtual PC (http://www.microsoft.com/ windowsxp/virtualpc/), which, as the name suggests, enables Mac users to run Windows software. 2. Like many researchers, I would also find it quite useful to include Adobe Acrobat pdfformat files in my data sets, simply because so much journal literature is now available in that form. Although such capabilities are beyond what QDA software can do at the moment, there are several ways to do it. First, if you own or have access to the full version of Adobe Acrobat 6.0 (not just the free Acrobat Reader), you can save unprotected Acrobat files as *.doc, *.rtf, *.txt documents, all of which can be imported by NVivo and ATLAS.ti. Adobe Acrobat 6.0 Professional retails for $449, but you should be able to find it discounted for as little as $189. Second, ScanSoft’s “PDF converter for Microsoft Word” can convert most, but by no means all, pdf-format files into Microsoft Word documents. Information about “PDF converter for Microsoft Word,” which retails for $49.99, but for which I have seen street prices for as little as $39.86, can be found at http://www.scansoft.com/pdfconverter/. 3. My 1998 comparative review examined ATLAS.ti first. For the sake of fairness to the two companies, I consider the QSR International product first this time around. 4. Most word-processing software and many other mainstream applications give the user the option to save work in a rich-text format, recognizable by the extension “.rtf” that appears after the file name. If you were to look inside a rich-text file, you would find all the text from the Downloaded from fmx.sagepub.com at SAGE Publications on April 20, 2015 REVIEW ESSAYS 463 original file but embedded in a standard markup language that encodes font choices, point sizes, margins, paragraph styles, table formats, and so on. Since the markup language is published, programmers who create other applications can easily write the code necessary to import rich-text format files into their applications and have the results look just as they did in the program that originally created these files. Rich-text format, therefore, helps users solve the problem of moving formatted text files between programs. 5. NVivo 2.0 also can import NUD•IST 4.0, 5.0, and 6.0 projects. 6. Most word-processing software enables the user to assign specific fonts, point sizes, colors, and appearances to repeated text patterns, the most common example being chapter or section headings. Microsoft Word users can read details about how to assign and use style sheets by looking up the formatting topic in the online help facility. 7. The test “tables” were just formatted text files, not something fancy such as embedded MS Excel spreadsheets. NVivo cannot import the latter either. 8. An embedded object refers to information (an object) from program X that is inserted into a file created by program Y. An example is a Microsoft Excel table that you paste into a Microsoft Word document. You can do this several ways, including pasting it into the Word document as a Microsoft Excel Worksheet Object. Done in this manner, the object (in this case, a table) is said to be “embedded” in the Word file. It cannot be edited directly within Word, but if you double click on it, the table will open itself in a table-size Excel window so you can edit it using all the functionality of the latter program (assuming, of course, that you have Microsoft Excel installed on the computer in question). 9. StarOffice 7 was released while this review was being written. As with previous versions of this outstanding office suite package, it is a free download (roughly 125MB) for students and teachers. For additional information, point your browser to http://www.sun.com/products-nsolutions/edu/solutions/staroffice.html. 10. Like other Dravidian languages, Kannada scans from left to right. 11. To do the conversion, I used “Rad Video Tools,” a set of shareware video and audio tools that can be downloaded from http://www.radgametools.com. This is not the only fix. If you experience this or other audio or video file access problems in ATLAS.ti, and if you are comfortable making changes to your system registry, you can also work through the instructions given at http://www.atlasti.com/mcisetup.shtml to change the registry so ATLAS.ti can access these files. REFERENCES Bazeley, P., and L. Richards. 2000. The NVivo qualitative project book. London: Sage. Gibbs, G. 2002. Qualitative data analysis: Explorations with NVivo. London: Open University Press. Harold, E. R., and W. S. Means. 2002. XML in a nutshell: A desktop quick reference, 2nd ed. Sebastopol, CA: O’Reilly. Jeffrey, E. F. F. 2002. Mastering regular expressions, 2nd ed. Sebastopol, CA: O’Reilly. Lewis, R. B. 1998. ATLAS/ti and NUD•IST: A comparative review of two leading qualitative data analysis packages. Cultural Anthropology Methods 10:41–47. Morse, J., and L. Richards. 2002. Readme first for a user’s guide to qualitative methods. Thousand Oaks, CA: Sage. Downloaded from fmx.sagepub.com at SAGE Publications on April 20, 2015 464 FIELD METHODS Richards, L. 2002a. Getting started in NVivo. Melbourne, Australia: QSR International. . 2002b. Using Nvivo in qualitative research. Melbourne, Australia: QSR International. Singh, S., ed. 2003. Teaching qualitative research with QSR software. Qualitative Research Journal. http://www.latrobe.edu.au/aqr/journal/special_AQR2003.pdf, p. 134. —R. BARRY LEWIS University of Illinois at Urbana–Champaign R. BARRY LEWIS is a professor of anthropology at the University of Illinois at Urbana– Champaign. His current research is an ethnohistorical and archaeological study of the small kingdoms and cultural landscape of precolonial Mysore, India. Ethics and the Profession of Anthropology: Dialogue for Ethically Conscious Practice, edited by Carolyn Fluehr-Lobban. Walnut Creek, CA: Altamira Press. 2003. 278 pp. Walking the Tightrope: Ethical Issues for Qualitative Researchers, edited by Will C. van den Hoonaard. Toronto, Canada: University of Toronto Press. 2002. 218 pp. Ethics in Qualitative Research, edited by Melanie Mauthner, Maxine Birch, Julie Jessop, and Tina Miller. London: Sage. 2002. 172 pp. DOI: 10.1177/1525822X04269173 These three collections on ethics in research provide a window on the shared moral and ethical dilemmas facing fieldworkers in different Western societies. Authors in the United Kingdom, Canada, and the United States struggle with similar issues. As research practices globalize, these issues may be clothed differently in different places, but communities of scholars puzzle through similar alternatives in their efforts to conduct responsible research. Carolyn Fluehr-Lobban’s anthology is the second edition of a 1991 collection on ethics in anthropology that provided historical overviews, philosophical positions, and disciplinary and subdisciplinary perspectives. For this revision, several authors have updated their original chapters. Some of the new chapters address new developments, and others replace chapters on similar topics. Fluehr-Lobban, active in ethics policy for the American An- Downloaded from fmx.sagepub.com at SAGE Publications on April 20, 2015