1
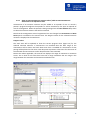
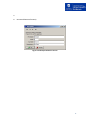
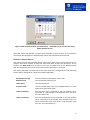
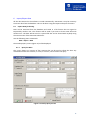
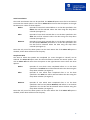
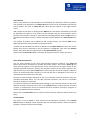
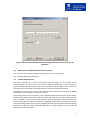
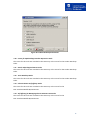
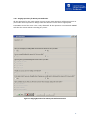
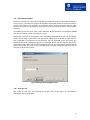
iCAHE Outcomes
Calculator
Chronic Disease Version
Software Guide
Monitoring patient status over time using
common pain and musculoskeletal outcome
measures
Prepared by
Research Team
The International Centre for Allied Health Evidence
University of South Australia
Adelaide, SA 5000
Note: This manual is to be used in conjunction with the iCAHE Outcomes
Calculator User Manual.
Table of Contents
1
Installing The Software ............................................................................................ 1
2
Installation Patch ..................................................................................................... 1
3
Running The Outcomes Calculator ......................................................................... 2
4
Using The Quick Start Menu ................................................................................... 2
5
Performing Tasks ...................................................................................................... 3
5.1
Create A New Episode Of Care .............................................................................3
5.1.1 Overview ...............................................................................................................3
5.1.2 General Controls ...................................................................................................3
5.1.3 Step 1 – Initiating An Episode Of Care ..................................................................3
5.1.4 Step 2 – Enter Patient & Funding Details ..............................................................4
5.1.5 Step 3 – Configure Outcome Measures ................................................................7
5.2
Add A New Patient................................................................................................9
5.3
Looking Up Patient Data .......................................................................................9
5.4
Manage An Episode Of Care .................................................................................9
5.4.1 Overview ...............................................................................................................9
5.4.2 Open An Episode Of Care For Management .......................................................10
5.4.3 The Episode Management Screen ......................................................................11
5.4.4 View An Outcome Measure Progress Chart / Add An Outcome Measure
Assessment To An Episode Of Care .....................................................................13
5.4.5 Selecting A Default Therapist..............................................................................17
6
Import/Export Data ............................................................................................... 18
6.1
6.1.1
6.1.2
6.2
7
Export Data For Sharing ......................................................................................18
Query The Data ...................................................................................................18
Query Using Multiple Criteria .............................................................................22
Export The Data To Excel ....................................................................................22
Outcome Measure Screens ................................................................................... 23
7.1
7.2
7.3
7.4
7.5
7.6
7.7
7.8
7.9
7.10
Body Mass Index .................................................................................................23
Health Assessment Questionnaire .....................................................................24
Fear-Avoidance Beliefs Questionnaire ...............................................................25
Fatigue/Shortness Of Breath Visual Numeric .....................................................26
Resumption Of Activities Of Daily Living Scale ...................................................26
Tampa Scale Of Kinesiophobia ...........................................................................26
Örebro Musculoskeletal Pain Screening Questionnaire .....................................27
West Haven Yale Multidimensional Pain Inventory ...........................................29
London Handicap Scale.......................................................................................29
Centre For Epidemiologic Studies-Depression Scale ..........................................30
i
7.11
7.12
7.13
7.14
7.15
7.16
7.17
7.18
7.19
7.20
7.21
7.22
7.23
7.24
7.25
7.26
Kessler Physiological Distress Scale ....................................................................30
Voice Handicap Index .........................................................................................30
Chronic Disease Self-Efficacy Scales ...................................................................30
Self Efficacy For Managing Chronic Disease 6 Item Scale...................................30
Perceived Health Competence Scale ..................................................................31
Perceived Stress Scale ........................................................................................31
Arthritis Self-Efficacy ..........................................................................................31
Pain Self-Efficacy Questionnaire .........................................................................31
Modified Somatic Perceptions Questionnaire ...................................................31
Diabetes Knowledge Test ...................................................................................31
Problem Areas In Diabetes Questionnaire .........................................................31
Perceived Diabetes And Dietary Competence Scale ..........................................31
Self-Efficacy For Diabetes ...................................................................................31
Staging Questions For Dietary Fat Reduction .....................................................32
Glycated Hemoglobin .........................................................................................33
Steps Per Day ......................................................................................................33
ii
1.
Installing the Software
On the CD there will be the following four directories:
Chronic Disease
Incontinence
Musculoskeletal
Neurological
Patch
To install the Chronic Disease Outcomes Calculator, open the Chronic Disease directory by
double clicking on it. Run the following file by double clicking on it:
setup.exe
Follow the simple instructions. The program will install the software on your computer. Once
the software is completely installed, an icon should appear on your desktop called “Chronic
Disease Outcomes Calculator”. Double click this icon to run the software.
2.
Installation Patch
If the program opens and the following message appears (Figure 1), the patch must be
installed. Open the directory called “Patch” on your CD and run the file called “idapi32.exe”.
It will open a small program. Don’t change any of the settings. Just press the “Unzip” button.
Then close this program. Now you can open any of the calculators again by double clicking
on the icon on your desktop.
Figure 1 Installation PDOXUSRS.NET Error
1
3.
Running the Outcomes Calculator
The Outcomes Calculator installation will install a shortcut in the Start Menu to allow you to
start the software. For instance, if the default shortcut settings were accepted then the
software may be run by navigating to:
Start Menu > Programs > Chronic Disease Outcomes Calculator
Select this shortcut and the calculator will start.
There will also be an icon (Figure 2) on the computer’s desktop. Double clicking this icon will
also open the software.
Figure 2 Chronic Disease Outcomes Calculator Icon
4.
Using the Quick Start Menu
When the software opens, the Quick Start window (Figure 3) is shown. This provides a way
of quickly opening or creating an Episode of Care (EoC). Simply select what you want to do
and press OK and the appropriate screen will open. If you don’t want to open or create an
EoC, press the Cancel button. This window will not be displayed again while the software is
running.
Figure 3 Quick Start Menu
2
5.
5.1
Performing Tasks
Create a New Episode of Care
5.1.1
Overview
An episode of care is made up by the occasions of service provided to a patient from their
first presentation until they no longer require treatment. The process of creating a new
episode of care requires several stages. Firstly, information is gathered about the patient
whom the episode of care concerns. Secondly, information is gathered about the episode
itself. Finally, outcome measures are chosen to keep track of the episode's progress over
time.
5.1.2
General Controls
On each screen in the process of creating a new episode of care a set of common controls is
present:
Figure 4 EoC Navigation Buttons
The controls consist of four buttons labelled Prev (Previous), Next and Cancel. These
controls are located at the bottom of each screen. In the example above, the Prev button is
not available because there is no previous screen to return to.
Select Next after completing a screen in order to move onto the next screen in the process.
A dialog box will pop up if required details have not been filled in. Select Prev to return to
the previous stage in the process to make changes and alterations to previously entered
data. Select Cancel at any point to cease the process of creating a new episode of care, and
return to the main Outcome Calculator screen.
Once all the general EoC data is captured, the EoC will be created and assessments can be
made.
5.1.3
Step 1 – Initiating an Episode of Care
Initiate a new EoC by following these commands on the menu bar.
Episode > New
This is shown in Figure 5.
3
Figure 5 Initiate a New Episode of Care
5.1.4
Step 2 – Enter Patient & Funding Details
Specify a Patient
The episode of care may be created for a new patient or for a patient already known to the
Outcomes Calculator. To enter a new patient’s details press the New button in the Create a
New Episode of Care screen (see Figure 6) and specify the name, date of birth and gender
using the provided fields. Alternatively press the Select button to choose a patient whose
details are already recorded in the Outcomes Calculator.
Figure 6 Patient & Funding Details Screen
4
Selecting a Patient
If the Select button was pressed, the Patient Information screen will appear (Figure 7). There
are two ways of finding a patient.
The first method is to browse the database using the Navigation Buttons. The leftmost
button opens the first record in the database. In Figure 7, the button is inactive (grey),
because the first record is displayed. The second button from the left moves one record at a
time back. Again, in Figure 7 this button is inactive because the first record is displayed. The
third button from the left moves one record at a time forward. The button on the right
moves to the last record in the database.
Navigation
Buttons
Search
Button
Figure 7 Patient Information Screen
This method can be time consuming. A faster way of finding a patient is to press the Search
button. The Patient Information screen will change appearance and look as shown in Figure
8. Notice that the name of the Search button has changed to Close. Pressing the Close
button will change the screen back to its original appearance.
5
Figure 8 Patient Information Screen with Search Function
Type the surname of the patient you are looking for in the box labelled Enter Surname to
Search On:. Now press the Go button. All the patients with this surname will be shown in the
list at the bottom of the screen. Click on the patient you are looking for. The selected
patient’s details will be displayed in the top part of the screen.
Once you have selected a patient, press the OK button. This will return you to the Patient &
Funding Details screen (Figure 6).
6
Specify an Initial Consultation Date
The date specified marks the beginning of the episode. Press the down arrow of the box
labelled Initial Consultation. A calendar will appear (Figure 9). The calendar will open at the
current date. If you want to specify another date in the same month, simply click on the
date. Select another month by clicking on the left and right arrows at the top of the
calendar. The selected date will appear in the edit box.
Figure 9 Calendar
Select a Funding Source
The source of funds that the patient will use to cover the episode of care is specified using
the provided form. Only one fund source may be specified in the Choose Fund Source box. If
standard options do not suitably describe the fund source then select the Other option and
enter a brief description in the text field provided below it.
Creating a Demo Episode of Care
This option will not be available in all versions of the calculator. A demo EoC is used in class
demonstrations, etc. Simply check the Demo box.
Continue
If all patient and funding details have been entered then click Next to continue to the next
step.
5.1.5
Step 3 – Configure Outcome Measures
After completing the previous step, a new screen (Figure 10) will open.
7
Figure 10 Selecting Outcome Measures Screen
Select Appropriate Outcome Measures
The available outcome measures are presented for selection. A minimum of one measure
must be selected. To select a measure and use it in the created episode, click on the box to
the left of the outcome measure. In Figure 10 only the Blood Pressure outcome measure is
selected. To remove a measure once you have selected it, simply click on the checkbox again
to remove the checkmark.
Continue
If all desired measures have been selected then click Next to create the episode. The
episode details will be saved and the episode will automatically be opened for management.
Note that once Next is pressed, the data will immediately be saved to the database and
cannot be changed again. If the data was entered incorrectly, a new EoC must be created
with the correct data. This is to ensure the integrity of the data.
8
5.2
Add a New Patient
Adding a new patient to the Outcome Calculator is done during the creation of their first
episode of care (See Section 5.1 Create a New Episode of Care). Their details are recorded as
part of the creation process. When the episode of care is created, these details are used to
create a new patient record. Subsequent episodes of care may then be added for the patient
without re-entering patient details.
New patient data can also be added at any time by using the following these commands on
the top menu bar.
Patient > New
Independent of the method that you decide to add a new patient, the Patient Information
Screen (Figure 7) will be displayed. Note that all the navigation buttons will be inactive and
the boxes (except the Date of Birth) will be empty. Enter the correct patient data in all the
fields. Note that in the Gender field, only a selection must be made by pressing on the down
arrow on the right of the box. Do not type anything in the Gender box.
Make sure that all the data is correct. Once it is saved in the database, it cannot be changed
again. This is to ensure the integrity of the data. Now press OK to save the data. Pressing
Cancel will close the window without saving the data.
5.3
Looking Up Patient Data
The details of any patient can be checked at any time by following these commands on the
top menu bar:
Patient > Browse
The Patient Information Screen (Figure 7) will be displayed. Patients can be found as
explained in Section 5.1.4 Step 2 – Enter Patient & Funding Details.
5.4
Manage an Episode of Care
5.4.1
Overview
Managing an episode of care allows viewing summary information that describes the
episode, adding new assessments to the episode, and viewing a chart of the progress of a
patient’s progress over time.
9
5.4.2
Open an Episode of Care for Management
To open a created episode of care, follow these commands on the menu bar:
Episode > Open
The Select Episode of Care screen will be shown (Figure 11). The patient data of all the
patients in the database are accessible. Browse to the correct patient using the Navigation
Buttons on the top of the screen. As you browse, note that all the episodes of care for the
selected patient is displayed in the list on the bottom of the screen. Each EoC is represented
with a date range in the list box (Initial Consultation and Completed). If the EoC is still open,
there will be no date in the Completed column.
To open an episode of care for a patient first select a patient from the patient list and then
select an episode from the available episodes of care for that patient. Click OK to open the
episode for management, or Cancel at any point to close the dialog without opening an
episode.
Figure 11 Select Episode of Care Screen
A faster way of finding a patient is using the Search button. Pressing it will extend the screen
with additional controls to find a patient (Figure 12). Note that the name of the button
changed to Close. Pressing the button again will close the extra search functions. Type the
patient’s surname in the Enter Surname to Search On: box. Then press the Go button. This
will display all the patients in the database with that surname in the list below the Go
button. You can now select a patient from this list and his/her details will be shown in the
fields on the left of the screen.
10
Figure 12 Search for a Patient on the Select Episode of Care Screen
5.4.3
The Episode Management Screen
The Episode Management screen (Figure 13) will be the first screen to open when an
episode is loaded.
Figure 13 Episode Management Screen
11
Work Area (Top Right Hand Pane)
The work area displays information of the currently selected item in the Item Selector (left
hand pane). In Figure 13 the Episode Summary is currently selected. In the work area general
information on the episode is displayed.
Chart Control Area (Bottom Right Hand Pane)
For charts with multiple data series, this area is used to control which series will be displayed
in the work area. Note that there are six identical boxes to select the series. These can only
be used once an outcome measure has been selected in the Item Selector. There are six,
because the maximum number of series that can be displayed simultaneously on the graph
is six.
Control Area (Left Hand Pane)
The Item Selector contains an item called Episode Summary, always the first item. Below
that all the outcome measures selected for this episode is displayed. When the Episode
Summary is selected, the Episode Management Screen will look as displayed in Figure 13.
The Print button will print whatever is displayed in the work area, in this case the Episode
Summary.
Pressing the Complete button will change the episode status of ‘open’ to complete. This
indicates that no further assessments will be conducted for it. Assessments cannot be added
to a completed episode.
To complete an episode of care first open an episode of care and then click the Complete
button in the control area. A confirm dialog will be presented to double check that the
episode should indeed be closed – click Yes to perform the action, or No to return to the
management screen without completing the episode.
When a user clicks Complete the episode will remain managed. It may be closed and
managed again at a later time, but it will no longer be possible to add assessments to it. An
episode should be completed only when there will be no more assessments relating to that
episode of care in the future.
Note that once an episode’s status is changed to closed (using the Complete) button, it
cannot be changed back again.
Pressing the Close button will close the episode for management without changing the
status of the episode. Therefore, when the episode is again opened for management, it will
be possible to add new assessment data.
12
5.4.4
View an Outcome Measure Progress Chart / Add an Outcome Measure
Assessment to an Episode of Care
Assessments of an outcome measure may be added to an episode of care to record a
patient’s progress throughout the episode. To add an assessment, first open an episode of
care for management. When the episode is being managed use the Item Selector drop down
to select the outcome measure that will be assessed.
Note that the management screen’s appearance has now changed. An Assessment and Data
Series panel are added to the Control Area. The Progress Chart for the selected outcome
measure is displayed in the Work Area.
Progress Chart
The work area will be updated to show the current progress chart (Figure 14) for the
selected outcome measure. If assessments are recorded then the date range of the
assessments will be shown and each data series that is available for assessments of that
pairing will be plotted on the chart. Each data point represents a data score for that series of
the assessed outcome measure at the date/time that it was assessed.
Notice that where applicable, the vertical axis displays the range of minimum to maximum
scores. This is done for all scales that have such a range. Otherwise the axis range is the
range between the maximum and minimum recorded scores.
13
Figure 14 Episode Management Screen with Progress Chart
Adding an Assessment
To add an assessment for the selected outcome measure:
1.
Click the Make Assessment button.
2.
The Therapists screen (Figure 15) will be displayed to select the therapist who did the
assessment, if the Always Use Default therapist option is off (see section 5.4.5 Selecting
a Default Therapist). Use the navigation buttons at the top of the screen to make the
selection.
3.
If the Demo option is available in your version of the calculator, and the episode was
created as a Demo, the next screen will ask you to set the assessment date and time
(Figure 16). Specify the date and time. The current date and time will be selected by
default. When you press OK, the selected date and time will be used as the assessment
date and time.
4.
Next, the questionnaire will be displayed. This screen will depend on the selected
outcome
measure
(see
section
0
14
5.
6.
Outcome Measure Screens).
Figure 15 Therapist Selection Screen
15
Figure 16 Set Assessment Date and Time Screen – Available only on version that allow
demo episodes of care
Note that, unless the episode is a Demo (only available in some versions of the software),
the current date and time are automatically used as the assessment date and time.
Data Series Analyses Metrics
The control area will automatically display a set of basic data series analyses metrics for any
progress chart that contains at least one data series with at least one data point. This is
shown in the Data Series area. If there is more than one data series on the displayed chart
then the drop down box may be used to select which data series is analysed.
Each metric describes a characteristic of the data series that is being analysed. The following
metrics will be displayed for a data series (when applicable):
Recorded Scores (#)
The raw number of data points in the series.
Baseline Score
The raw baseline (initial) score.
Latest Score
The raw latest score.
Previous Score
The raw second-latest score. Only available when 2 or more
assessments have been made.
Latest Vs Baseline
The raw latest score compared to the raw baseline score,
expressed as a percentage. If the baseline score was zero,
the value will be Inf.
Latest Vs Previous
The raw second-latest score compared to the raw baseline
score, expressed as a percentage. Only available when 2 or
more assessments have been made. If the baseline score
was zero, the value will be Inf.
16
Selecting Data Series to Display
As shown in Figure 14 some outcome measures have more than one data series. The names
of the data series are shown as a legend on the graph. They are also displayed in the boxes
in the Chart Control Area. The user can select which series must be displayed.
You can also choose not to display a specific series. Simply change the selection of the
appropriate drop down box in the Chart Control Area to a series that you actually what to
display, i.e. the name of the series you want to display now replaces the one you don’t want
to display. Notice that the number of series on the graph has reduced by one.
5.4.5
Selecting a Default Therapist
It can be annoying to enter the therapist name every time if the software is only used by one
therapist. The Default Therapist option allows the user to set the name of the default
therapist. Use the following commands from the menu bar:
Therapist > Set Default
The Therapist Selection screen (Figure 15) will be displayed. Navigate to the desired
therapist and press OK to make the selection the Default Therapist.
Next, make sure that the Always Use Default option is checked (there is a small check mark
next to the option). Use the following commands from the menu bar:
Therapist > Always Use Default
If there is no check mark next to it, click on the option. Repeat the above menu commands
without clicking on Always Use Default. Notice that there is now a check mark next to the
command.
If the Always Use Default option is selected, step 2 for creating a new assessment will be
skipped, because the Therapists screen will not open. The Default Therapist will
automatically be selected from the database.
These options can be changed at any time.
17
6.
Import/Export Data
All the data entered in the software is saved automatically. Sometimes it may be necessary
to extract data from the database. This can be done using the import and export functions.
6.1
Export Data for Sharing
Data can be extracted from the database and saved in a file format that can again be
imported by another user. This function will be used if you want to share some data with
another user. The data will be saved in a special file that can be shared with anybody using
the same version of the Outcomes Calculator.
Use the following menu commands:
Data > Export > Data
The Develop Query screen (Figure 17) will be displayed.
6.1.1
Query the Data
This screen (Figure 17) consists of four sections that can be used to refine the data. Any
combination of the four sections, or none, or all four, can be used in the query.
Figure 17 Develop Query Screen
18
Initial Consultation
The initial consultation date can be specified. The Select All option must first be unchecked
to activate the search options. Just click on Select All and notice that the options to the right
become active. There are three options:
Before
Episodes of care which started before or on the date specified in the
Before box will be selected. Select the date using the drop down
calendar (see Figure 9).
After
Episodes of care which started after or on the date specified in the
After box will be selected. Select the date using the drop down
calendar (see Figure 9).
Between
Episodes of care which started after or on the date specified in the
first box (below Between) and before or on the date specified in the
last box will be selected. Select the date using the drop down
calendar (see Figure 9).
Note that only one of the date options can be used. Notice that if the Select All option is
checked, all the dates will be used in the query.
Completion Date
The date on which the episode was completed (i.e. status changed to “closed”) can be
selected. The Select All option must first be unchecked to activate the search options. Just
click on Select All and notice that the options to the right become active. There are three
options:
Before
Episodes of care which were completed before or on the date
specified in the Before box will be selected. Select the date using the
drop down calendar (see Figure 9).
After
Episodes of care which were completed after or on the date
specified in the After box will be selected. Select the date using the
drop down calendar (see Figure 9).
Between
Episodes of care which were completed after or on the date
specified in the first box (below Between) and before or on the date
specified in the last box will be selected. Select the date using the
drop down calendar (see Figure 9).
Note that only one of the date options can be used. Notice that if the Select All option is
checked, all the dates will be used in the query.
19
Select Patient
One or more patients can be selected from the database. The episodes in which this patient
was involved in can be queried. The Select All option must first be unchecked to activate the
search options. Just click on Select All and notice that the options to the right become
active.
Add a patient to the query by clicking on the Add button. The Patient Information screen will
be displayed (see Figure 7). Any patient can be selected using the normal patient search
functions (see section 5.1.4 Step 2 – Enter Patient & Funding Details). Once the OK button on
the Patient Information screen is clicked, the patient will be added to the Select Patient text
box.
Any number of patients can be added. To add another patient, just click the Add button
again and follow the same procedure as described above.
A patient can be removed from the list of patients in the Select Patient text box. Click on the
patient that must be removed so that the patient is highlighted. Then click the Remove
button. The patient will no longer be seen in the Select Patient text box.
Notice that if the Select All option is checked, all the patients will be used in the query.
Select Outcomes Measure
You can query episodes of care that used specified outcomes measures. The Select All
option must first be unchecked to activate the search options. Just click on Select All and
notice that the options to the right become active. The list box on the right contains all the
available outcomes measures. Click on the outcomes measure that must be queried in the
right hand list box. Then click the Add button. Notice that the outcomes measure is added to
the list of selected outcomes measures on the left and that is disappears from the list of
available outcomes measures on the right.
Continue to add outcomes measures to the list of selected outcomes measures using the
procedure described above. You can add outcomes measures until the list of available
outcomes measures is exhausted.
An outcomes measure can be deselected by clicking on the outcomes measure in the list of
selected outcomes measures. Then click on the Remove button. Notice that the outcomes
measure is removed from the list of selected outcomes measures and that it reappears in
the list of available outcomes measures.
Notice that if the Select All option is checked, all the outcomes measures will be used in the
query.
Include Demo’s
This option is only available in some versions of the Outcomes Calculator. If the Include
Demo’s option is checked, all the episodes that was classified as demo’s will be included in
the query, otherwise they will be excluded.
20
Execute the Query
Once all the criteria are specified, click the OK button. This will execute the query. The
results will be displayed in the Query Results screen (Figure 18). Pressing the Cancel button
on the Develop Query screen, will close the screen without executing the query.
Figure 18 Query Results
The query results are displayed in four list boxes in the Query Results screen. The top left
box shows all the episodes of care that was found, the top right list box shows the outcome
measure, the bottom left list box shows all the assessments and the bottom right list box
shows all the scores for each data series available for that assessment.
Notice that if you select any item in one of the list boxes, the items in the following boxes
changes (the sequence is: top left, top right, bottom left, bottom right).
The screen and boxes can also be resized to make it easier to view the data. Resize the
screen by grabbing any edge or corner of the screen with the mouse cursor and dragging it
until the screen is large enough. The list boxed can be resized by slowly moving the mouse
curser over the area between the list boxes. Notice that the cursor will change shape at
some point. At this point, hold the left mouse button down and drag it until the list box’s size
is good enough.
21
Save the Data
When the OK button on the Query Results screen is pressed, a Save dialog will appear.
Specify the place and file name where the data must be saved. Use the default extension
(.dat) without typing it explicitly. Once the Save button is pressed, the data will be saved.
This file can now be shared by any user of the same version of the Outcomes Calculator.
6.1.2
Query Using Multiple Criteria
Any combination of the criteria described in the previous section can be used to query the
data. For example, a specific patient can be selected and all the episodes of care started
after a specified date can be selected. In other words, from the list of all the episodes of care
for the selected patients, only those started after a specified date will be selected.
This can be done by unchecking the Select All options for Initial Consultation and Select
Patient. Now, in any order, specify the date and select the patient using the procedures
described in the previous section.
Now run the query.
6.2
Export the Data to Excel
The data can be exported to a format that can be read by Excel. It will be exported as a
comma delimited file (.csv) and will therefore actual be readable by any spreadsheet
program that can read comma delimited files.
Note that this format cannot be read by the Outcomes Calculator. Therefore, this will
typically be used if you want to present the data in your own way or if you want to perform
your own analysis on the data.
Follow these menu commands to save the data in a comma delimited format:
Data > Export > Excel
The Develop Query screen (Figure 17) will open. Create the query in the same way as
described in section 6.1.1 Query the Data. Everything will be the same as described in that
section, except when the Save dialog appears. Now the file format will be .csv. Give the file
any name you like. Don’t type the .csv extension, this will be added automatically. Once the
file is saved, you should be able to open it with Excel.
22
7.
Outcome Measure Screens
Each scale has a sequence of simple forms that must be completed to record the scores.
Once all the data is captured, the scores will be calculated and the results displayed in the
Episode Management screen (Figure 14). The objective of this chapter is to give some
guidance to the recording of the scores in the Outcomes Calculator. It is not to give detail on
the outcomes measures themselves. For that, the accompanying Outcomes Measure Manual
must be consulted.
7.1 Body Mass Index
The information required for this scale must be recorded in the screen shown in Figure 19.
The number of the question appears in the first line. The next line contains the question. The
table is displayed below the question. Simply enter the correct data in the appropriate fields.
Press OK to record the score. This is only allowed if all the questions are answered. Cancel
will close the screen without recording any scores.
Notice that if the text of the question is not completely displayed the screen can be resized.
Grab a vertical edge of the screen with the mouse and move it to the left or right until the
text is readable. If all the lines of the question are not displayed, move the mouse the
bottom of the panel on which the question is displayed. Notice that the shape of the mouse
cursor will change. When the cursor has changed, hold the left mouse button down and drag
the mouse so that the cursor moves vertically down. This will enlarge the panel so that all
the lines of the text are visible.
Figure 19 Body Mass Index Screen
23
7.2
Health Assessment Questionnaire
The data for the first 20 questions is recorded on a series of forms that looks like Figure 20.
The number of the question appears in the first line. The next line contains the question. A
list of options is given next. Select the appropriate option. Press the button with the right
arrow to move the next question or the button with the left arrow to move to the previous
question.
The last question is completed on a form shown in Figure 21. The number of the question
appears in the first line. The next line contains the question. A list of options is given next.
Select the appropriate option. Any number of options can be marked. Press the button with
the right arrow to move the next question or the button with the left arrow to move to the
previous question.
Press OK to record the score. This is only allowed if all the questions are answered. Cancel
will close the screen without recording any scores.
Notice that if the text of the question is not completely displayed the screen can be resized.
Grab a vertical edge of the screen with the mouse and move it to the left or right until the
text is readable. If all the lines of the question are not displayed, move the mouse the
bottom of the panel on which the question is displayed. Notice that the shape of the mouse
cursor will change. When the cursor has changed, hold the left mouse button down and drag
the mouse so that the cursor moves vertically down. This will enlarge the panel so that all
the lines of the text are visible.
Figure 20 Health Assessment Questionnaire Screen for First 20 Questions
24
Figure 21 Health Assessment Questionnaire Screen for Last Question
7.3
Fear-avoidance Beliefs Questionnaire
The data is recorded on a series of forms that looks like Figure 22. The number of the
question appears in the first line. The next line contains the question. Move the slider to
record the appropriate score. Notice that the score selected on the slider is also displayed in
the box marked Selected Value. This box only displays the value of the slider and cannot be
changed by the user. Press the button with the right arrow to move the next question or the
button with the left arrow to move to the previous question.
Press OK to record the score. This is only allowed if all the questions are answered. Cancel
will close the screen without recording any scores.
Notice that if the text of the question is not completely displayed the screen can be resized.
Grab a vertical edge of the screen with the mouse and move it to the left or right until the
text is readable. If all the lines of the question are not displayed, move the mouse the
bottom of the panel on which the question is displayed. Notice that the shape of the mouse
cursor will change. When the cursor has changed, hold the left mouse button down and drag
the mouse so that the cursor moves vertically down. This will enlarge the panel so that all
the lines of the text are visible.
25
Figure 22 Fear-avoidance Beliefs Questionnaire Screen
7.4
Fatigue/Shortness of Breath Visual Numeric
The scores for this scale are recorded in the same way as the scores for the
Fear-avoidance Beliefs Questionnaire.
7.5
Resumption of Activities of Daily Living Scale
The scores for this scale are recorded in the same way as the scores for the
Fear-avoidance Beliefs Questionnaire.
7.6
Tampa Scale of Kinesiophobia
The scores for this scale are recorded in the same way as the scores for the
Fear-avoidance Beliefs Questionnaire.
26
7.7
Örebro Musculoskeletal Pain Screening Questionnaire
The data for the first question is recorded on a form that looks like Figure 23. The number of
the question appears in the first line. The next line contains the question. A list of options is
given next. Select the appropriate option. Any number of options can be marked. Press the
button with the right arrow to move the next question or the button with the left arrow to
move to the previous question.
The second and third questions are completed on forms as shown in Figure 24. The number
of the question appears in the first line. The next line contains the question. A list of options
is given next. Select the appropriate option. Press the button with the right arrow to move
the next question or the button with the left arrow to move to the previous question.
The last 18 questions are completed on a series of forms that looks like Figure 25. The
number of the question appears in the first line. The next line contains the question. Move
the slider to record the appropriate score. Notice that the score selected on the slider is also
displayed in the box marked Selected Value. This box only displays the value of the slider
and cannot be changed by the user. Press the button with the right arrow to move the next
question or the button with the left arrow to move to the previous question.
Figure 23 Örebro Musculoskeletal Pain Screening Questionnaire: Screen for First Question
27
Press OK to record the score. This is only allowed if all the questions are answered. Cancel
will close the screen without recording any scores.
Notice that if the text of the question is not completely displayed the screen can be resized.
Grab a vertical edge of the screen with the mouse and move it to the left or right until the
text is readable. If all the lines of the question are not displayed, move the mouse the
bottom of the panel on which the question is displayed. Notice that the shape of the mouse
cursor will change. When the cursor has changed, hold the left mouse button down and drag
the mouse so that the cursor moves vertically down. This will enlarge the panel so that all
the lines of the text are visible.
Figure 24 Örebro Musculoskeletal Pain Screening Questionnaire: Screen for Second and
Third Questions
28
Figure 25 Örebro Musculoskeletal Pain Screening Questionnaire: Screen for Last 28
Questions
7.8
West Haven Yale Multidimensional Pain Inventory
The scores for this scale are recorded in the same way as the scores for the
Fear-avoidance Beliefs Questionnaire.
7.9
London Handicap Scale
The data is recorded on a series of forms that looks like Figure 26. The number of the
question appears in the first line. The next line contains the question. A list of options is
given next. Select the appropriate option. Press the button with the right arrow to move the
next question or the button with the left arrow to move to the previous question.
Press OK to record the score. This is only allowed if all the questions are answered. Cancel
will close the screen without recording any scores.
Notice that if the text of the question is not completely displayed the screen can be resized.
Grab a vertical edge of the screen with the mouse and move it to the left or right until the
text is readable. If all the lines of the question are not displayed, move the mouse the
bottom of the panel on which the question is displayed. Notice that the shape of the mouse
cursor will change. When the cursor has changed, hold the left mouse button down and drag
the mouse so that the cursor moves vertically down. This will enlarge the panel so that all
the lines of the text are visible.
29
Figure 26 London Handicap Scale Screen
7.10 Centre for Epidemiologic Studies-Depression Scale
The scores for this scale are recorded in the same way as the scores for the London Handicap
Scale.
7.11 Kessler Physiological Distress Scale
The scores for this scale are recorded in the same way as the scores for the London Handicap
Scale.
7.12 Voice Handicap Index
The scores for this scale are recorded in the same way as the scores for the London Handicap
Scale.
7.13 Chronic Disease Self-efficacy Scales
The scores for this scale are recorded in the same way as the scores for the
Fear-avoidance Beliefs Questionnaire.
7.14 Self Efficacy for Managing Chronic Disease 6 Item Scale
The scores for this scale are recorded in the same way as the scores for the
Fear-avoidance Beliefs Questionnaire.
30
7.15 Perceived Health Competence Scale
The scores for this scale are recorded in the same way as the scores for the
Fear-avoidance Beliefs Questionnaire.
7.16 Perceived Stress Scale
The scores for this scale are recorded in the same way as the scores for the London Handicap
Scale.
7.17 Arthritis Self-efficacy
The scores for this scale are recorded in the same way as the scores for the
Fear-avoidance Beliefs Questionnaire.
7.18 Pain Self-efficacy Questionnaire
The scores for this scale are recorded in the same way as the scores for the
Fear-avoidance Beliefs Questionnaire.
7.19 Modified Somatic Perceptions Questionnaire
The scores for this scale are recorded in the same way as the scores for the London Handicap
Scale.
7.20 Diabetes Knowledge Test
The scores for this scale are recorded in the same way as the scores for the London Handicap
Scale.
7.21 Problem Areas in Diabetes Questionnaire
The scores for this scale are recorded in the same way as the scores for the London Handicap
Scale.
7.22 Perceived Diabetes and Dietary Competence Scale
The scores for this scale are recorded in the same way as the scores for the
Fear-avoidance Beliefs Questionnaire.
7.23 Self-efficacy for Diabetes
The scores for this scale are recorded in the same way as the scores for the
Fear-avoidance Beliefs Questionnaire.
31
7.24 Staging Questions for Dietary Fat Reduction
All the questions for this scale appear on one screen. New questions will become active as
you answer the first questions. Simply make the selection in each area as appropriate.
Press OK to record the score. This is only allowed if all the questions are answered. Cancel
will close the screen without recording any scores.
Figure 27 Staging Questions for Dietary Fat Reduction Screen
32
7.25 Glycated Hemoglobin
The data is recorded on a form that looks like Figure 28. The number of the question appears
in the first line. The next line contains the question. Record the answer in the box provide by
typing in the value or by using the up and down arrows. Press the button with the right
arrow to move the next question or the button with the left arrow to move to the previous
question.
Press OK to record the score. This is only allowed if all the questions are answered. Cancel
will close the screen without recording any scores.
Notice that if the text of the question is not completely displayed the screen can be resized.
Grab a vertical edge of the screen with the mouse and move it to the left or right until the
text is readable. If all the lines of the question are not displayed, move the mouse the
bottom of the panel on which the question is displayed. Notice that the shape of the mouse
cursor will change. When the cursor has changed, hold the left mouse button down and drag
the mouse so that the cursor moves vertically down. This will enlarge the panel so that all
the lines of the text are visible.
Figure 28 Glycated Hemoglobin Screen
7.26 Steps per day
The scores for this scale are recorded in the same way as the scores for the Glycated
Hemoglobin outcome measure.
33