1
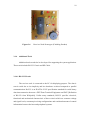
WATER SENSOR SYSTEM (RECEIVER)
DIYANA BINTI MUHAMAD
Project Report Submitted as Partial Fulfilment
of the Requirement for the
Degree in Bachelor of Electrical Engineering
(Telecommunication)
FACULTY OF ELECTRICAL ENGINEERING
UNIVERSITI TEKNOLOGI MALAYSIA
NOVEMBER 2006
iii
Specially Dedicated to
My beloved Mother; Nik Aeshah Nik Mustapha, Father; Muhamad
Mat Salleh, Siblings and Friends
For their eternal support, motivation, encouragement and inspiration
throughout my journey of education.
iv
ACKNOWLEDGMENT
Alhamdulillah, for His Blessing, I finally have completed my final year
project for Bachelor Degree of Electrical Engineering (Telecommunication). There
are several people whom I would like to thank for involving in making this project
successful. Without any help from these people, I am sure that it would be much
difficult for me to accomplish the objectives of the project.
First of all, I would like to take this opportunity to express my deepest
appreciation to my supervisor Prof. Dr. Norsheila Bt. Fisal who had guided me,
giving support and motivation during the project.
This project is collaboration between me and Zatulfarha Md. Yaman.
Therefore I would like to convey my outmost gratitude to her for giving fully
cooperation and always be with me during up and down throughout entire project.
Most importantly, I would like to thank my parents and family for their
encouragement and support. Last but not least, thousand appreciations to Mr. Arif ,
Mr. Ajis, Che Mazru , Nordiyana Kamaruddin and all individuals who have directly
or indirectly offered help, support and suggestions, contributing towards the
successful completion of water sensor system.
v
ABSTRACT
Nowadays, Wireless Sensor Network (WSN) has become very popular. The
availability of low-cost, high performance and practical usage of the embedded
processor, radios and sensor has lead to the used of wireless sensor communication
in humans life. The application of WSN is very wide. It can be used as habitat
monitoring, health monitoring, and sensing others environmental data such as
temperature, humidity, light, water and etc remotely at distance. The purpose of this
project is to develop a sensor system which able to monitor increments of water level
at computer. Water sensor system consists of two nodes which are transmitter and
receiver. Transmitter will sense four levels increment of the water and sent to the
receiver end wirelessly. Then the receiver will capture the signal, demodulate,
process data, display on LEDs and send to PC. Water sensor system can be used as
an early warning system to monitor flood. This report elaborates the development of
receiver node that includes the hardware and software design. The receiver node is
built using ATmega8535 as it processor, superheterodyne receiver module as it
communication tool and computer to display the sensor value. This system
implements the non-standard protocol for point to point communication between two
nodes. All programming is written in C language. GUI is also developed as an
additional feature to the system (using VB 6.0). The results obtained in this project
are taken using USART terminal, oscilloscope and GUI interface. It is observed that
the frame sent is successfully received and displayed at the receiver end with very
small time interval between transmitted and receive frame.
vi
ABSTRAK
Rangkaian pengesan tanpa wayar (RPTW) telah menjadi semakin popular
pada masa kini. Dengan adanya pemproses terbenam, radio dan pengesan yang
berharga rendah, pertasi tinggi dan juga praktikal untuk digunakan telah membawa
kepada penggunaan
sistem pengesan tanpa wayar dalam kehidupan manusia.
Aplikasi RPTW adalah meluas. Ianya boleh digunakan
habitat, pemerhati kesihatan dan pengesan
sebagai pemerhati
elemen persekitaran seperti suhu,
kelembapan, cahaya, air dan sebagainya pada jarak jauh. Projek ini adalah bertujuan
untuk membina sebuah sistem pengesan yang mampu mencerap takat kenaikan air di
komputer. Sistem ini terdiri daripada dua nod iaitu stesen pemancar dan penerima.
Stesen pemancar akan mengesan empat
takat kenaikan air dan menghantarnya
secara tanpa wayar ke stesen penerima. Kemudian stesen penerima akan menangkap
isyarat, mengubah ke bentuk digital , memproses, memapar ke LED dan menghantar
data ke komputer. Sistem ini sesuai digunakan sebagai sistem amaran awal untuk
mengesan banjir. Laporan ini mengemukakan pembagunan nod penerima termasuk
rekaan perkakasan dan rekaan perisian. Nod penerima dibina menggunakan
ATmega8535 sebagai pemprosess, Modul frekuensi radio sebagai alat komunikasi
dan komputer untuk paparan.Sistem ini menggunakan rekaan
standard untuk
komunikasi nod ke nod. Semua atucara ditulis
protokol bukandalam bahasa
pengatucaraan C. Selain itu, antaramuka- pengguna bergrafik turut dibangunkan
sebagai ciri tambahan kepada sistem (menggunakan VB 6.0). Keputusan yang
diperolehi diambil dengan menggunakan terminal USART, osiloskop dan
antaramuka pengguna- bergrafik. Di dapati bingkai yang di hantar berjaya diterima
oleh stesen penerima. Perbezaan masa diantara bingkai yang dihantar and bingkai yg
diterima adalah sangat kecil .
vii
TABLE OF CONTENT
CHAPTER
TITLE
PAGE
TITLE
i
DECLARATION
ii
DEDICATION
iii
ACKNOWLEDGMENTS
iv
ABSTRACT
v
ABSTRAK
vi
TABLE OF CONTENTS
vii
LIST OF FIGURES
1
2
x
LIST OF TABLE
xii
LIST OF ABBREVIATIONS
xiii
LIST OF APPENDICES
xiv
INTRODUCTION
1.1
Project Background
1
1.2
Problem Statement
2
1.3
Project Objectives
3
1.4
Scope of Works
3
TLIERATURE REVIEWS
2.1
Introduction to Wireless Sensor Network
5
2.2
Network Modeling
7
viii
2.3
3
Wireless and RF Communication System
RECEIVER NODE DEVELOPMENT
3.1
Introduction
11
3.2
Hardware Development
14
3.2.1
Processor
15
3.2.2
RF Module
15
3.2.3
Circuit Design
16
3.2.4
Additional Tools
18
3.2.4.1
RS-232 Circuit
18
3.2.4.2
ISP Cable
21
3.3
Software Development
23
3.3.1
25
Software Tools
3.3.1.1
4
Programmer Notepad
(WINAVR)
25
3.3.1.2
PonyProg 2000
26
3.3.1.3
Microsoft Visual Basic
28
3.3.2
Main Program
28
3.3.3
Graphical User Interface
31
RESULT AND DISCUSSIONS
4.1
Overview
34
4.2
System Hard wares
34
4.3
System Software
36
4.4
Measured Voltage
37
4.5
Data Transmission
38
4.5.1
Wired Connection
38
4.5.2
Wireless Connection
40
4.6
5
9
Result from Graphical User Interface
42
CONCLUSION AND FUTURE WORKS
5.1
Conclusion
45
ix
5.2
Future Works
46
REFERENCESS
48
APPENDICE
50
x
LIST OF FIGURES
FIGURE NO
TITLE
PAGE
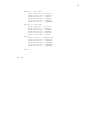
1.1
Flash Flood that strike Kuala Lumpur
2
2.1
The OSI layer
8
2.2
Block Diagram of Superheterodyne Receiver
10
3.1
Block Diagram of Water Sensors System
12
3.2
Flow chart of developing the receiver node
13
3.3
Block Diagram for Receiver node
14
3.4
Pin Connection of RF Receiver Module
16
3.5
Receiver Node Schematic diagram
17
3.6
Receiver Node Prototypes (Finishing Product)
18
3.7
Pin Configuration and Block Diagram of Max232
19
3.8
RS-232 Schematic
20
3.9
RS-232 Interface Cable
20
3.10
ISP Cable
21
3.11
ISP Schematic
22
3.12
Flow of Software development
24
3.13
Window of Programmer Notepad (WINAVR)
25
3.14
PonyProg2000 Window Application
27
3.15
Flowchart for Receiver Node
29
3.16
Frame Format
29
3.17
Flow chart to detect error at Receiver End
31
3.18
Flowchart for GUI development
31
3.19
Visual Basic 6.0 window environment
32
3.20
Form designed for Water Sensor System
33
4.1
The receiver end prototype: (a) Top view, (b)Side view
35
xi
4.2
Output Window resulting from compilation
36
4.3
Porting Hex code using Ponyprog200 software
37
4.4
Measured Supply voltage for input processor board
38
4.5
Result taken from Usart Terminal (wired connection)
39
4.6
Result taken from Oscilloscope (Wired connection)
39
4.7
Result taken from Usart Terminal (wireless connection)
40
4.8
Result taken from Oscilloscope (Wireless connection)
42
4.9
GUI result: (a) No level, (b) Level 1, (c) level 2, (d)
5.1
level 3 and (e) level 4
43
The PCB Design for Receiver module
46
xii
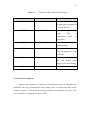
LIST OF TABLE
TABLE NO
3.1
TITLE
Function of ISP Connector Pin Header
PAGE
23
xiii
LIST OF ABBREVIATIONS
AM
Amplitude Modulation
AVRGCC
AVR-GNU Compiler Collection
AVR RISC
AVR Reduced Instruction Set Computer
COM
Serial Communication port
CPU
Central Processor Unit
EEPROM
Electrically Erasable Programmable Read Only
Memory
GUI
Graphical User Interface
IF
Intermediate Frequency
ISP
In-Circuit Serial Programmable
LED
Light Emitting Diode
MHz
Megahertz
OS
Operating System
OSI
Open System Interconnection
PC
Personal Computer
PCB
Printed Circuit Board
RF
Radio Frequency
RT-OS
Real Time Operating System
RX
Receiver
SRAM
Static Random Access Memory
TCP/IP
Transmission Control Protocol/ Internet protocol
TX
Transmitter
USART
Universal Synchronous Asynchronous Receiver
Transmitter
VB
Visual Basic
WSN
Wireless Sensor Network
LIST OF APPENDICES
APPENDIX
TITLE
PAGE
A
Source Code of Water Sensor System
50
B
Make file for AVR Microcontroller
54
C
Source code for GUI
62
D
Ponyprog 2000’s User Manual
64
CHAPTER 1
INTRODUCTION
1.1
Project Background
Water sensor system is another application of Wireless Sensor Network
(WSN). This system enable user to monitor four increment of water level remotely at
PC or LEDs on receiver board. For a prototype, this project only develops two nodes
which are transmitter node and receiver node. Transmitter node consists of water
sensor board connected to processing board (contain microcontroller and RF
module). Meanwhile, at the receiver end, there are processing board (contain
microcontroller and RF module) connected to the computer.
The nonstandard communication protocol was implemented in the system.
The error detection codes and addresses are attached to the data before transmitted.
This application is using radio signal with frequency of 433MHz to transmit data
wirelessly to the receiver. The type of communication implemented in the system is
simplex communication where transmitter node continuously sends data to receiver
without waiting for acknowledgement. While, at the other end a receiver is ready to
receive data from transmitter.
Water sensor system is suitable to be used as an early warning system to
detect flood. The sensor node is suitable to be setup near the river banks or drain to
sense the increment of the water while the receiver node can be install at the resident
2
house or police station so that whenever water exceed the critical level, police can
alarm resident low lying area to be prepared.
1.1
Problem Statement
Malaysia is a tropical country. Generally, the country is frequently hits by
heavy rain all year around cause by north- east monsoon and south-west monsoon
which later lead to floods. Usually major floods occur at the east coast and north side
of the country during the north-east monsoon.
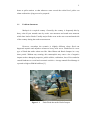
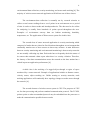
However, nowadays the scenario is slightly different where flood can
happened anytime and anywhere whenever heavy rains occur. Flash-flood is a new
type of flood that strike urban area like Johor Bharu and Kuala Lumpur in a very
short period. Without any warning, this catastrophic may cause a lot of negative
impact such as damaged properties, public utilities, cultivation, loss of lives and also
caused hindrance to social and economic activities. Average annual flood damage is
reported as high as RM100 millions [3].
Figure 1.1
Flash Flood that strike Kuala Lumpur
3
The government of Malaysia has developed many strategies to reduce the
impact and the negative effect of the floods. The floods control strategies include
construction of multi purpose dam, properly plan and designed the urban drainage
system, river bed deepening and widening, etc. The development of all above
strategies is very costly and will take longer time to be finished. Therefore, at a mean
time, flood forecasting and warning system is being considered as the most effective
non-structural measure to minimize the losses of properties and human lives due to
floods.
As mention before, water sensor system can be implement for this purpose.
Beside it low costs, this system is also easy to be installed and maintained in a very
short time.
1.2
Project Objectives
The objectives of this project include:
•
To develop receiver node that will receive data from the sensor node using
wireless transmission and processing.
•
To implement nonstandard protocol for communication between sensor and
receiver node at data link and physical layer.
•
To display the level of the water level using LED on receiver board
•
To monitor the changes of water level remotely on computer in a very small
time interval.
4
1.3
Scope of Works
The works involve in this project includes Hardware and Software
development. This project will developed receiver node using ATmega8535 as
processor and RF receiver module with frequency range 433MHz as communication
device. Since the computer will be used to display the data value, an interface circuit
between receiver node and computer need to be built (RS-232 circuit).In addition;
ISP cable is developed as a utility to load the hex file to the microcontroller.
The most important element of wireless sensor system is communication
between nodes and data processing. This function can be implemented on the nodes
through programming. Software developments involve some programmings which
enable the receiver node to perform tasks such as receive data frame from
transmitter, check header, address and checksum, extract data from the frame,
display on LED and send data to the PC. Graphical User Interface
is also
developed as additional feature to the system. All programming are written in C
language accept for GUI which written in Visual Basic 6.0.
CHAPTER 2
LITERATURE REVIEWS
There are many relevant and similar projects on wireless sensor system. In
this section the discussion will be made on the wireless sensor network (WSN), OSI
network modeling and OOK amplitude modulation scheme which are relevant to the
project.
2.1
Introduction to Wireless Sensor Network
The advances in science and technology are deeply intertwined. This has lead
to next evolutionary development of wireless sensor network application in building,
utilities, industrial, and home, shipboard and transportation systems automation. The
concept of wireless sensor networks is based on a simple equation:
Sensing + CPU + Radio = Thousands of potential applications
As soon as people understand the capabilities of a wireless sensor network,
hundreds of applications spring to mind. It is a straightforward combination of
modern technology [4].
The most important element in the WSN is sensory data from the real word.
Sensory data comes from multiple sensors of different modalities in distributed
locations. The application of WSN can divided into three classes which are
6
environmental data collection, security monitoring, and sensor node tracking [4]. The
majority of wireless sensor network application will fall into one of these classes.
The environment data collection is normally use by research scientist to
collect several sensor readings from a set of points in an environment over a period
of time in order to detect trends and interdependencies. The data need to be collect
for analyzing is usually from hundreds of points spread throughout the area.
Examples of environment sensory data are habitat monitoring, humidity,
temperature, etc. The application of Water sensor system lies in this class.
The second class of sensor network application is security monitoring which
composed of nodes that are placed at fixed locations throughout an environment that
continually monitor one or more sensors to detect any variance. A main difference
between security monitoring and environmental monitoring is that security networks
are not actually collecting any data. Each node has to frequently check the status of
its sensors then transmit a data report when there is a security violation. Therefore,
the latency of the data communication across the network to the base station has a
critical impact on application performance [4].
A third class is the tracking of a tagged object through a region of space
monitored by a sensor network. Example of applications include as distance sensor,
velocity sensor, object tracking etc. Unlike sensing or security networks, node
tracking applications will continually have topology changes as nodes move through
the network. [4].
The second element of wireless sensor system is CPU. The purposes of CPU
are for data processing and perform standard communication protocol. The TCP/IP,
point to point or other non-standard protocol may be embedded into the processor to
make the communication possible between nodes
7
The concept of wireless sensor system is to monitor the sensory data remotely
from the actual observable area. Therefore, the radio frequency communication is
required for data transmission in long range distance.
2.1
Network Modeling
The communication protocol is the key element in data transmission for
Wireless Sensor System. It is the set of rules governing the exchange of data between
2 entities. It is used for communication between entities in the system [1]. In
communication system, the task is broken up into modules. The services offered by
the modules are grouped into layers where each layer provide/used service to/
provide by other layers. There are two types of standard layering model in data
communication which are TCP/IP and OSI Model.
Open System Interconnection (OSI) model is a set of protocols that attempt to
define and standardize the data communications process. The OSI model is set by the
International Standards Organization (ISO). The OSI model has the support of most
major computer and network vendors, many large customers, and most governments,
including the United States [Definition of OSI Model from Wikipedia].
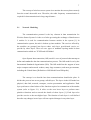
The concept is to describe how data communications should take place. It
divides the process into seven groups, called layers. The layers in the OSI model are
physical, data link, network, transport, session presentation and application. Each
layer performs a related subset of the function required to communicate with another
system (refer to figure 2.1). It relies on the next lower layer to perform more
primitive functions and to conceal the details of those layers [1]. Each layer also
provides service to the next higher layer. The function of each layer is well defined
therefore any changes in one layer will not required changes in any other layer.
8
Application
Provide access to the OSI environment for user and also provides distributed information
services
Presentation
Provide independence to the application process from difference in data representation
(syntax)
Session
Provide the control structure for communication between applications; establish, manage,
terminate the connection between cooperating systems
Transport
Provide reliable transparent transfer of data between end points; provide end to end error
recovery and flow control
Network
Provide upper layers with independence from the data transmission and switching
technologies used to connect system; responsible for establishing, maintaining, and
terminating connections.
Data Link
Provide for the reliable transfer of information across the physical link; sends blocks (
frame) with necessary synchronization, error control and flow control
Physical
Concern with transmission of unstructured bit stream over physical medium; deals with
mechanical, electrical, functional, and procedural characteristics to access the physical
medium
Figure 2.1
The OSI layer
Water sensor system only deploys the two bottom layer of the model which is
data link and physical. The non- standard protocol is implemented for the system for
communication. The main task of the data link layer for this project is to take a raw
transmission facility and transform it into a line that appears free of transmission
errors in the network layer. The task is accomplished by input the data into data
frames, insert the error detection sequence bit, and transmit the frames sequentially.
Since the physical layer merely accepts and transmits a stream of bits without any
regard to meaning of structure, it is up to the data link layer to create and recognize
frame boundaries. This can be accomplished by attaching special bit patterns to the
beginning and end of the frame.
On the other hand, the service offered by physical layer is to provide the
electrical and mechanical interface to the network medium (wireless link). This layer
gives the data-link layer (layer 2) its ability to transport a stream of serial data bits
between two nodes in the system; it conveys the bits that move along the link. It is
9
also responsible for making sure that the raw bits get from one place to another, by
modulation technique, and deals with the electrical and mechanical characteristics of
the wireless link such as frequency used, type of modulation, communication device,
etc.
2.2
Introduction to Wireless and RF Communication System
The area of wireless communication is fairly broad especially in
technological research and development. It is deal with transmitting data via some
form of air waves. Wireless communication can de defined as any transfer of data
from one point to another using no wires. Radios, cell phones, satellite TVs, and
remote controls are just a few of the many technologies currently being used and
developed in the area of wireless communication.
The Water Sensor System use Amplitude Modulation scheme to transmit data
wirelessly to the receiver. It works by varying the strength of the transmitted signal
in relation to the information being sent. Hence the amplitude demodulator is used at
the receiver end to converse back the AM signal into digital output. Receiver node in
system is using super heterodyne receiver.
The super heterodyne principle, as used in radio receivers, allows certain
obstacles in high-performance radio design to be overcome [5]. All signal
frequencies are converted typically to a constant lower frequency before detection.
This constant frequency is called the intermediate frequency, or IF. In typical AM
(Medium Wave) home receivers, that frequency is 455 kHz, for FM VHF receivers,
it is usually 10.7 MHz.
10
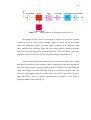
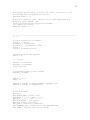
Figure 2.2
Block Diagram of Superheterodyne Receiver
Heterodyne receivers "beat" or heterodyne a frequency from a local oscillator
(within the receiver) with all the incoming signals. In mixer, the local oscillator
signal will multiplies with the incoming signal, producing beat frequencies both
above and below the incoming signal. The mixer stage produces outputs at both the
sum of the two input frequencies and at the difference. Either the higher or the lower
(typically) is chosen as the IF, which is amplified and then demodulated [5].
The advantage of Superheterodyne receiver is that most of the radio's signal
path has to be sensitive to only a narrow range of frequencies. Only the front end (the
part before the frequency converter stage) needs to be sensitive to a wide frequency
range. For example, the front end might need to be sensitive to 30 MHz, while the
rest of the radio might need to be sensitive only to 455 kHz, a typical IF frequency.
Other than that it also has superior characteristics to simpler receiver types in
frequency stability and selectivity [5].
CHAPTER 3
RECEIVER NODE DEVELOPMENT
3.1
Introduction
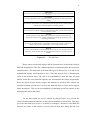
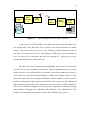
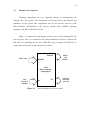
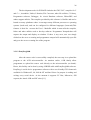
The purpose of water sensor system is to sense the increment of water
remotely at distance. In order to do so, block diagram for the whole system is
developed and the function for each block is clarified. Figure 3.1 shows the block
diagram of the overall system. For this project, water sensor can only sense four
increment of the water level. Then, this level is send to the microcontroller at
transmitter board for processing. The processor of transmitter end will process the
data by creating a data frame to be transmitted to the receiver node through USART.
This data frame represent in form of digital signal (0 and 1). In order to be transmitted
wirelessly, the data must be transformed into analog signal. RF Module will modulate
the data to analog signal using Amplitude modulation. Afterwards, this signal will be
12
Sensor
Board
Micro
controller
RF
Module
RF
Module
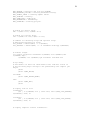
Figure 3.1
Micro
controller
RS-232
Circuit
Block Diagram of Water sensors System
At the receiver end, RF Module will capture the signal and demodulate into
the original data. This data then will be passed to the microcontroller for further
process. The process that involve in receiver includes checking whether the data is
free from error then send to the PC and display on LED. If the data contained any
error, the data will be discarded and alert user through PC. Whenever the water
exceeds the forth level, an alarm will be on.
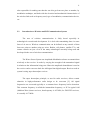
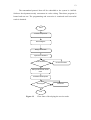
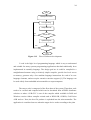
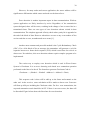
The thesis describes in details the methodology that is used to develop the
receiver node in term of hardware and software. The development processes are based
on the objective of the project which is to produce receiver node that has an ability to
receive data, do some processing and display on LEDs and Computer. Figure 3.2 has
shown the works flow in developing the hardware and the software of receiver node.
It start by choosing the right component to used for node’s processor, RF module and
other components that will used to indicate the water level such as LEDs and Buzzer.
The receiver node block diagram was constructed to simplify the schematic drawing.
After finished designing the schematic, the hardware was implemented. This
hardware will encounter several tests to ensure the reliability of the system
13
The nonstandard protocol that will be embedded to the system is clarified.
Software developments mostly concentrate in codes writing. Then those programs is
burned and run test. The programming and correction is continued until successful
result is obtained.
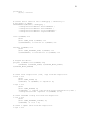
Start
Choose Component
Block diagram
Design Schematic
Implement Hardware
Test Hardware
Circuit Correction
NO
OK
Setup Protocol that will be
used
Software Development
Test Program
Correction
NO
OK
End
Figure 3.2
Flow chart of developing the receiver node.
14
3.1
Hardware Development
Choosing components are very important element in implementing the
hardware for every system. The components are chosen based on the function and
suitability for the system. The components used for the receiver node are AVR
Microcontroller (ATmega8535), RF receiver module with 433MHz operating
frequency, and RS-232 Interface Circuit.
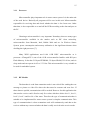
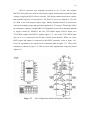
Figure 3.3 shows the block diagram of the receiver node.ATmega8535 has
four I/O ports. Port A is connected to the LEDs and Buzzer. Port B is connected to
ISP cable for uploading the hex file. While RF receiver module and RS-232 are
connected to the Rx and Tx pin respectively at Port C.
PORTA
ISP Cable
PORTB
LEDs
and
Buzzer
AVR
Microcontroller
ATmega8535
RF
Receiver
Module
Figure 3.3
Rx
TX
RS-232
Interface
Circuit
Block Diagram for Receiver node
15
3.1.1
Processor
Microcontroller plays important role in water sensor system. It is the main unit
of the node device. Basically all programs will be run in this unit. Microcontroller
responsible for receiving data and check whether the data is free from error. Other
than that, it also responsible to on and off the LEDs according to the data and pass to
the PC.
Choosing a microcontroller is very important. Nowadays, there are many types
of microcontroller available in the market such as PIC from microchip,
microcontroller from Motorola, Intel, Rabbit 2000 and etc. In Wireless Sensor
System, power consumption and memory utilization is the significant element when
deciding the right processor [7].
Many WSN applications used 8-bit AVR RISC microcontroller as it
processor. ATmega8535 is one of the AVR- microcontroller families with 8K bytes
Flash Memory. It also has 512 bytes EEPROM, 512 bytes SRAM, 32 I/O line, and six
sleep mode and can operate in 4.5 to 5.5 Volts. This microcontroller is very suitable to
be used for embedded system.
3.1.2
RF Module
The data that is send from transmitter node is not critical like sending the text
message or picture or video file where the data must be accurate and error free. If
those data are spoiled, retransmission will be needed. However for this application the
data send to receiver end is fixed to only five values which are below level 1, level 1,
level 2, level 3 and level 4 of the water. Therefore the type of communication that is
suitable to be implemented for water sensor system is simplex communication. This
type of communication is where transmitter node will continuously send data to the
receiver without any concern whether the data is safely received at the receiver node.
16
On the other hand, the receiver accepts data without sending any response to
the transmitter.
Hence, in this project, RF transmitter and receiver module is use to transfer
data from sensor node to receiver node wirelessly. Both RF modules are operating in
free licensed frequency which is 433MHz. The modulation scheme use for the system
is OOK-AM modulation. The receiver uses Superheterodyne receiver. The maximum
distance that can be implemented for the system is 100 meter. While the operating
voltage range for the receiver module is 4.5 to 5.5 Volts. Therefore, this module is
compatible to be connected directly to the AVR Microcontroller.
Figure 3.4
3.1.3
Pin Connection of RF Receiver Module
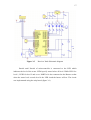
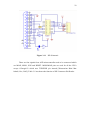
Circuit Designed
The circuit is designed based on the block diagram. Figure 3.5 shows the
schematic for Receiver Node. The microcontroller used 8 MHz external crystal
oscillator. Since the voltage range of ATmega 8535 is 4.5Volts to 5.5Volts. Therefore
the circuit cannot get direct supply from the Battery. In order to avoid any harm to the
microcontroller, Voltage Regulator is used to step down the voltage to appropriate
value.
17
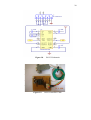
Figure 3.5
Receiver Node Schematic diagram
PortA0 until PortA4 of microcontroller is connected to the LED which
indicates the level of the water. LED0 specify water below all level. While LED1 for
level 1, LED2 for level 2 and so on. PORTA4 is also connected to the Buzzer so that
when the water level exceeds level 4 the LED 4 and the buzzer will on. The circuit
was implemented using the strip board (figure 3.6)
18
Figure 3.6
3.1.4
Receiver Node Prototypes (Finishing Product)
Additional Tools
Additional tools needed to be developed for supporting the system application.
Those tools include RS-232 Circuit and ISP Cable.
3.1.4.1 RS-232 Circuit
The receiver node is connected to the PC for displaying purpose. The data is
sent in serial due to its simplicity and low hardware overhead compared to parallel
communication. Rs-232 is an IEA/TIA-232-E specification standard for serial binary
data interconnection between a DTE Data Terminal Equipment and DCE [Definition
of RS-232 from Wikipedia]. Unlike many standards, RS-232 specifies electrical,
functional and mechanical characteristic of three criteria which are common voltage
and signal levels, common pin-wiring configurations and a minimal amount of control
information between the host and peripheral systems.
19
RS-232 connector was originally developed to use 25 pins. The original
MAX232 Driver/Receiver and its related parts simply doubled and inverted the input
voltage to supply the RS-232 driver circuitry. This design enabled much more voltage
than actually required; it wasted power. The EIA-232 levels are defined as ±5V into
5k. With a new low-dropout output stage, Maxim introduced RS-232 transceivers
with internal charge pumps that provided regulated ±5.5V outputs. This design allows
the transmitter outputs to maintain RS-232-compatible levels with a minimum amount
of supply current [8]. MAX232 has two TTL/CMOS inputs, RS-232 inputs, two
TTL/CMOS outputs and RS-232 outputs (figure 3.7). One of the TTL/CMOS input
(pin 10 or 11) is connected to the Rx pin of AVR microcontroller. While one of the
RS232 input and output is connected to the RS232 connector (refer to figure 3.8).
Four 1uF capacitances are required to be connected (table in figure 3.7). The overall
schematic is shown in figure 3.8. This circuit is then implemented using strip board
(figure3.9)
Figure 3.7
Pin Configuration and Block Diagram of Max232
20
Figure 3.8
Figure 3.9
RS-232 Schematic
RS-232 Interface Cable
21
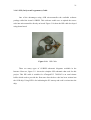
3.1.4.2 ISP ( In-System Programmer) Cable
One of the advantages using AVR microcontroller the available software
package called the Atmel AVRISP. This software enable user to upload the source
code into microcontroller directly on board. Figure 3.10 show the ISP cable developed
using donut board.
Figure 3.10
ISP Cable
There are many types of AVRISP schematic diagrams available in the
Internet. However, figure 3.11 shows the simplest ISP schematic that used for this
project. This ISP cable is suitable for ATmega8535. 74LS245 is an octal tristate
buffer which used to provide the float state after the hex code has been written into
the AVR chip. Using LED is for indicating the PC start up and code is written into the
chip.
22
Figure 3.11
ISP Schematic
There are four signals from AVR microcontroller need to be connected which
are MOSI, MISO, SCK and RESET. MISO/MOSI pins are used for all the CPUs
except ATmega103 which uses TXD/RXD pin instead [Warsuzarina Binti Mat
Jubadi; Nov, 2005]. Table 3.1 has shown the function of ISP Connector Pin Header.
23
Table 3.1
Function of ISP Connector Pin Header
Name
MOSI
Function
Master Out- Slave In
Description
Data being transmitted to
the part being programmed
is sent on this pin
RESET
Target MCU Reset
Connect to target AVR.
Target
AVR
programmed
while
is
in
Reset State.
SCK
Shift Clock
Serial Clock generated by
the Programmer
MISO
Master In Slave Out
Data received from the part
being programmed is sent
on this pin
VCC
ISP Power
5Volts Power supply for
ISP.
ISP
header
must
supply power to the dongle
GND
Ground
Common Ground
3.2 Software Development
Software development is referring to development process in embedded the
application into the microcontroller and writing codes to display the data on the
computer. Figure 3.12 shows the flow chart of software development. All source code
was developed in C language except for GUI.
24
Start
Develop Flow Chart
C Programming
Setup Make File
No
Compile ok?
Yes
Upload Program
No
Test ok?
Yes
End
Figure 3.12
Flow of Software development
C code is the high- level programming language which is easy to understand
and suitable for many systems-programming applications that had traditionally been
implemented in assembly language. The design goal are it could be compiled in a
straightforward manner using a relatively simple compiler, provide low-level access
to memory, generate only a few machine language instructions for each of its core
language elements, and not require extensive run-time support [9]. The language can
be used widely from embedded microcontrollers to supercomputers.
The source code is composed of the flow chart of the system. Then those code
need to be verified and compiled which can be download from ATMEL distributor
websites or others. AVR-GCC is one of the compiler which available in DOS and
Windows version. Others compiler existed such as WINAVR, AVRLib, CodeVision
AVR and etc. Next, the hex file produce is uploaded into the microcontroller. The
application is considered success when the target device works according to the plan.
25
3.2.1
Software Tools
There are many software tools needed to support the development of water
sensor system starting from writing the source code to upload the hex file to the
microcontroller. Those soft wares are free and can be downloaded from internet
accept for software to develop GUI. The soft wares that utilized in this project
includes Programmer Notepad (WINAVR), PONY PROG and Microsoft Visual Basic
6.0
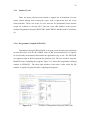
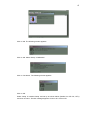
3.2.1.1 Programmer Notepad (WINAVR)
Programmer Notepad (WINAVAR) is an open source window based platform
to write the source code for the ATMEL series of RICS microcontroller. It is operate
in user-friendly environment which make the application easy to use. The WINAVR
are supported only in DOS command line platform [10]. The user needs to setup the
Makefile before compiling the program. Figure 3.13 shows the programmer Notepad
window in WINAVR. The most right window is the source codes while the left
window is output file generated after compiling the program.
Figure 3.13
Window of Programmer Notepad (WINAVR)
26
The development tools for WINAVR includes the GNU GCC compiler for C
and C++, Assembler, Linker, Librarian, File Converter, other file utilities, C Library,
Programmer software, Debugger, In- circuit Emulator software, Editor/IDE, and
others support utilities. The compiler provided by this software is flexible and can be
hosted on many platforms where it can target many different processor or operating
systems (back-end), and can be configured in different languages (front-end).This
features is ideal for execute the User’s Makefile which in turn calls the compiler,
linker and other utilities used to develop software. Programmer Notepad then will
capture the output and display on window. If there is any error, user can simply
clicked on the error or warning and programmer notepad will automatically open file
and go to the error or warning line of the program.
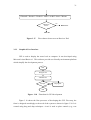
3.2.1.2 PonyProg2000
After the source code is successfully compiled, the next step is to upload the
program to the AVR microcontroller. As mention earlier, AVR family allow
programmer to upload the source code directly to the microcontroller (on board).
Hence, this facility can be done by using AVRISP cable with PonyProg2000 software.
PonyProg is serial device programmer software with a user friendly GUI framework
available for Windows95, 98, 2000 & NT and Intel Linux. Its purpose is reading and
writing every serial device. At the moment it supports I²C Bus, Microwire, SPI
eeprom, the Atmel AVR and PIC micro[11].
27
Hex code
Address
ASCII codes
Unused
memory
Figure 3.14
PonyProg2000 Window Application
Figure 3.14 shows the machine codes (hex file) resulting from compiling the
source code. Some configuration need to be done before using the software to
uploading the codes. At the beginning, user need to setup the interface by specify the
connector used (serial or parallel) between microcontroller and PC. Next, calibrate the
bus timing, define the device used (e.g. ATmega8535, PIC16xx83, etc) and setup the
configuration and security bits. Then, the hex file is opened and programmed to the
target device. The hex file consist of memory address, machine code presented in the
form of hexadecimal and ASCII. PonyProg also verify filled”0XFF” in the unused
memory.
28
3.2.1.3 Microsoft Visual Basic 6.0
Visual Basic (VB) is an event driven programming language and associated
development environment from Microsoft. The language is rather very simple and
easy to understand where the codes are written using simple English-like words and
syntax. Its not only allows programmers to easily create simple GUI applications, but
also has the flexibility to develop fairly complex applications [Definition of Visual
Basic from Wikipedia].
Programming in VB is a combination of visually arranging components or
controls on a form, specifying attributes and actions of those components, and writing
additional lines of code for more functionality. Since default attributes and actions are
defined for the components, a simple program can be created without the programmer
having to write many lines of code [12].
3.2.2
Main Program
Generally, there are three significant tasks need to be performed by receiver
node which are receive data from transmitter, error detection and display.
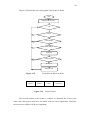
The flowchart is constructed based on the task before writing the codes. This
is important in order to ease the code writing and can ensure that the program is not
away from main system application.
Refer to the figure 3.15; the program starts with initializing the USART
interrupt function. Those codes can be found in the ATmega8535 Datasheet. Water
Sensor System use Serial Communication to transfer between two microcontrollers
and PC. The sensor data is sent in a form of frame as shown in figure 3.16. Header is
used for frame synchronization. When receiver node receives first 2bytes data, it will
check whether it is a header or not.
29
Then it will obtain the next coming data if the header is found.
Start
Initialized Port and Usart
True
Data in?
No
Yes
Check Header
No
Yes
Check Address
No
Yes
Store Data
Check checksum
No
Ok
Send to PC
Display on LED
Figure 3.15
Header
2 Bytes
Flowchart for Receiver Node
Address
2Bytes
Figure 3.16
Data
Checksum
1Byte
1Bytes
Frame Format
The second element in the frame is Address. It indicates the receiver port
name. Since this project only have two nodes with one sensor application. Therefore
the source port address will be less important.
30
However, for many nodes and sensor application, the source address will be
significant to differentiate which sensor and node are the data refer to.
Error detection is another important aspect in data communication. Wireless
system application are likely interferes by noise. Regardless of the transmission
system designed, there will be errors, resulting in the change of one or more bits in a
transmitted frame. There are two types of error detection scheme existed in data
communication. The simplest approach is Parity check where parity bit is appended to
the end of the block of data. However when there are two or any even number of bits
are inverted due to error, an undetected error occurs [1].
Another most common and powerful method is the Cyclic Redundancy Check
(CRC). For a k-bit block of bits or message, the transmitter will generate a (n-k)-bit
sequence known as a frame check sequence (FCS) which is used later for receiver to
detect error. Nevertheless, this error detection scheme require complex program to be
implemented.
The easiest way to employ error detection which is used in Water Sensor
System is Checksum. It is an error- detecting code based on a summation operation
performed on the bits to be check. The formula to generate Checksum Code is:
Checksum = ~ (Header1 + Header2 +Address1 + Address2 + Data)
This sequence code is then will be add up to the frame and transmit to the
other end. At the receiver, some calculation will be made to detect error. Processor
will Sum up all bytes including the Checksum value. For free- error transmission, the
expected summation result should be 0x1FF. If there is an error occurs, the data will
be discarded. Figure below shows the flowchart for error detection
31
Chksum2= Header1+ Header2+ Addr1 +Addr2+ data+ Chksum
Chksum2=
0xFF?
No
Data Error
Yes
Data Ok
Figure 3.17
Flow chart to detect error at Receiver End
.
3.2.3
Graphical User Interface
GUI is used to display the water level at computer. It was developed using
Microsoft visual Basic 6.0. This software provide user friendly-environment platform
which simplify the development process.
Start
Design Form
Add function
Compile
Error
Reprogram
Ok
End
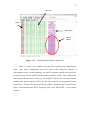
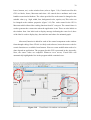
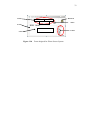
Figure 3.18 Flowchart for GUI development
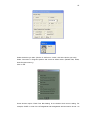
Figure 3.18 shows the flow processes of developing the GUI. First step, the
form is designed accordingly to the need of the system as shown in figure 3.20. It is
created using drag and drop techniques. A tool is used to place controls (e.g., text
32
boxes, buttons, etc.) on the window form (refer to figure 3.18). Controls used for this
GUI are labels; frame, Mscomm and timer. All controls have attributes and event
handlers associated with them. The values provided for each control is changed to the
suitable value (e.g. high, width, font, background color, caption, etc).This value can
be changed at the window properties (figure 3.18) The main control in the GUI is
Mscomm which allowed the reading function from PC com port. The control timer is
used to generate the current time when the application is run. There are nine labels on
the window form. One label used to display message indicating the water level, three
of the label is used to display day, date and time and others for animated graph.
Afterward, function is added for each of the control component on the window
form through coding. Since VB 6.0 is widely used software, hence the source code for
certain functions are available from Internet. However some modification need to be
done depend on application. The program for this GUI is presented in the AppendixNext, the source codes are compiled. Whenever error occurs, Visual basic will
automatically highlight the line in the program which contained error.
Controls
Tool
Attributes
Value
Window
form
Figure 3.19
Window
Properties
Visual Basic 6.0 window environment
33
Labels
MScomm
Timer
Frame
Labels
Label
Figure 3.20
Form designed for Water Sensor System
CHAPTER 4
RESULTS AND ANALYSIS
4.1
Overview
This chapter analyses the simulation result attained for overall system. The
performance of data transmission between nodes for both wired and wireless
transmission is compared. The result are taken from the Oscilloscope, USART
terminal and GUI Interfaced.
4.2
System Hardware
Water Sensor System consists of two parts which are transmitter and receiver
end. The transmitter end comprises of sensor circuit, processing board and radio
transmitter module.
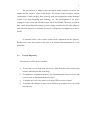
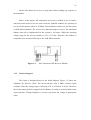
While, on the other end, the receiver part consists of Processing board, RS232 Interface Circuit and the computer. All hardware develops using stripe board
(Refer to following figure 4.1). Hard wares are build base on the function of receiver
node al already discussed in previous chapter.
35
RS 232
Circuit
Radio
Receiver
Module
Processing
Board
(a)
(b)
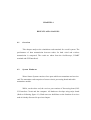
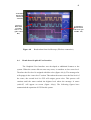
Figure 4.1
The receiver end prototype: (a) Top view, (b) Side view
The Radio receiver module is connected to the processing board through
receive USART terminal. While the RS-232 interfaces circuit is connected to the
board through Transmit USART Terminal. The RS-232 circuit is then connected to
the computer.
36
4.1
System Software
After completing developing the hardware module, the next stage is software
development where the communication and data processing function is embedded in
the microcontrollers. The source code is written in the Programmer Notepad (WIN
AVR). Then the code was compiled to produce the hex file, list file and object file
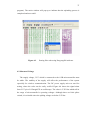
.However only hex file will be used to be uploaded. Figure 4.2 shows the successful
compiled result on WINAVR window. The left window shows the source code while
the right shows the output window. The total memory size used for this system is
1989 bytes.
Output
window
Programming
window
Memory size
display
Figure 4.2
Output Window resulting from compilation
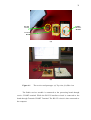
Then, the hex file produced is uploaded into the AVR-microcontroller using
PonyProg 2000. Figure 4.3 proved the hex code is successfully embedded into the
microcontroller. It would be better to erase the microcontroller’s memory before
writing the codes to the target device (especially if device is already contained any
37
program). The notice window will pop-up to indicate that the uploading process is
completed and successful.
Figure 4.3
Porting Hex code using Ponyprog200 software.
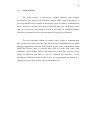
4.2 Measured Voltage
The supply voltage, VCC which is connected to the AVR microcontroller must
be stable. The stability of the supply will affect the performance of the system
especially for wireless communication. The DC power supply unit was used for
testing, where the value can be easily verified. Figure 4.4 shows the signal taken
from VCC pin of ATmega8535 at oscilloscope. The value is 5.35Volts which still in
the range of microcontroller’s operating voltages. Although there are little spikes
existed, it is tolerable since the spiking voltage are below 5.5Volts.
38
5.35Volt
(acceptable
range)
Figure 4.4
Measured Supply voltage for input processor board
4.3 Data Transmission
This section will elaborate the result obtained for data communication for the
system. The data transmission for this system uses the USART, with 8 bit frame
format, Big Indian byte order and baud rate of 1200 bps. The same baud rates are set
for both nodes for synchronization. The result is taken in two different system
layouts which are wired and wireless connection.
4.3.1 Wired Connection
The data sent from the transmitter node is in the form of frame which
includes 2 bytes header, 2 bytes address, 1 byte data and 1 byte checksum as
discussed in previous chapter. The following figures show the result taken from
USART terminal for both nodes using Usart terminal and Oscilloscope.
39
Frame receive taken
from USART-RX
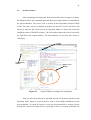
Figure 4.5
Water level sends to
pc
Result taken from Usart Terminal (wired connection)
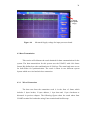
Referring to figure 4.5, the red circle indicates the frame received at the
receiver end (pin USART RX). Then this frame is processed by checking the error. If
the frame is free from error, processor will then extracts data from the frame.
Afterward, this data will be send to the PC through pin USART –TX (green circle).
Transmitted
Bits Frame
from TX
node)
Received Bits
Frame (Pin
USART RX)
Transmitted data
from RX node to
PC ( pin USART
TX)
Start bit is “0”.Trigered
from 1->0 and the next
bit is data
Figure 4.6
Stop bit is”0” .
Triggered from 0 to 1
indicate the bit data
finished
Result taken from Oscilloscope (Wired connection)
40
The result taken from oscilloscope has shown three different output which are
from transmitter node USART transmit pin, Receiver node USART receive and
transmit pin (refer to figure 4.6). The ATmega8535 has USART function which
automatically generates the start and the stop bit for every byte transmitted. The start
Bit and the stop bit is “0”. The bit will remain “1” when the line is idle. This is
clearly proven at the generated green signal. It is nearly impossible to observe the
start bit of the data frame (yellow and pink signal) because the oscilloscope shows
the continuous display.
4.3.2 Wireless Connection
After the wired transmission has been successfully implemented, the test for
wireless connection was made. Fortunately, the result obtained using wireless is
actually same as wired. This has been proven in the following figure.
Water level sends to pc
Frame receive from RF
module
Figure 4.7
Result taken from Usart Terminal (wireless connection)
41
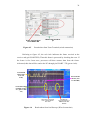
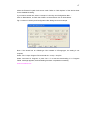
Result from USART terminal shows two windows (figure 4.7). The right
window illustrate the receive frame taken from data out pin of RF module. The
frame consists of 6 bytes data which are 0x68, 0x66, 0x31, 0x32, 0x00 and 0xCE.
The first two byte is the frame header (ASCII code =“hf”). While the next two bytes
data are the address ( ASCII=”12”) followed by water level (0x00). This value
indicates that there is no water sensed by water sensor. Finally, the last byte is the
checksum ( ~(0x68 +0x66+0x31+0x32+0x00) = 0xCE).
The left window show the data sent to the PC (taken from TX-Usart pin).
This time the data is sent without a frame. Please note that both windows are
captured at different time. That is why the data in the frame (right window) is not the
same as data sent to PC (left window). The 0x07 signify that water is now at level 3.
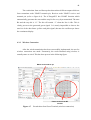
More clear result can be obtained by using oscilloscope. Referring to figure
4.8, there are three signals taken which are from transmitter node (USART-TX),
receiver node (USART-RX) and receiver node (USART-TX). It is observed that
transmitted bits frame is exactly the same as received bits frame. Also, notice that the
time interval between transmit and receive frame is very small which nearly 0sec.
The purple signal indicates the water level value. This data will be used by the PC to
display the real value.
42
Transmitted
Bits Frame
taken from
TX node)
Received
Data taken
from RX
node to PC
( pin USART
RX)
Transmitted
Datafrom RX
node to PC (pin
USART TX)
Figure 4.8
4.4
Result taken from Oscilloscope (Wireless connection)
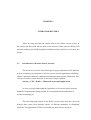
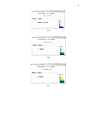
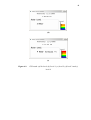
Result from Graphical User Interface
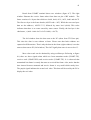
The Graphical User Interface was developed as additional features to the
system. When the sensor did not sense any water, it considers as low water level.
Therefore the first level is assigned with blue color (figure 4.9(a)). The message also
wills popup in the “water level” section. Then when the sensor sense the first level of
the water, the second level in GUI will assigns green color. This process will
continue until the water reached the highest level where the message “4 meter
(critical)” will appear on screen (figure 4.9(e)). The following figures have
summarized the operation of GUI for this system.
43
(a)
(b)
(c)
44
(d)
(e)
Figure 4.9
GUI result: (a) No level, (b) Level 1, (c) level 2, (d) level 3 and (e)
level 4
CHAPTER 5
CONCLUSION AND FUTURE WORK
5.1
Conclusions
The main purpose of this project is to implement the application of wireless
sensor system. This project was designed based on ideas and theory of wireless
sensor network. Water detector has been chosen as a sensor detecting flood. In
general, this project is has successful in achieving all the objectives. The
communication between nodes using non-standard protocol is met. It is shown that
the receiver node can receive data from transmitter and display on LED and PC.
Besides early warning flood detection, water sensor system is also suitable to
be use
for measuring water level in the dam. Klang valley always has a problem
related to water supply shortage due to decrement of water in the dam during
drought. Sometimes there is no notice or any warning from responsible body to the
residence. Resulting, resident has no opportunity to take a precaution action (Stack
up water supply).
46
5.1
Future work
Event though water sensor system is considered success, however, it is only a
prototype and there are still has some weaknesses that need to be improved. In
future, few modifications can be done for real implementation. It is suggested that
instead of using transmitter and receiver module, transceiver also can be used so that
communication both ways can be applied.
This Water sensor system use non-standard protocol. Hence, the application
is limited for that system network only. This system can be improved by using
common standard protocol such as point to point or TCP/IP so that the system can be
deployed in real network application. For TCP/IP, MicroIP can be used along with
operating system application such as TinyOS or RT-OS.
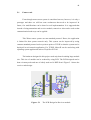
The hardware designed in this project used strip board resulting large module
size. This size of module can be reduced by using PCB. The PCB designed can be
done via many tools and one of widely used tool is DXP Protel. Figure 5.1 shows the
receiver node design.
Figure 5.1
The PCB Design for Receiver module
47
Other than that, water sensor used in this project is rather simple and cheap. It
has the ability to measure only four level of water. This feature can be improved by
using water sensor with better features.
Lastly, since this project has only two nodes. It is suggested that more then
two nodes is used to create a network. Function of the receiver node is to receive and
display the water level. These features can be enhanced by form a database system so
that interested parties can have access to the system through the Internet.
48
REFERENCES
1.
William Stallings. Data and Computer Communication. 7th edition. Prentice
Hall
2.
Behrouz A. Forouzan. Data Communication and Networking. 2nd
edition.McGraw- Hill International Edition .2000
3.
Permanent Flood Commission Committee. Web page. URL:
http://agrolink.moa.my/did/river/r_fcom.html
4.
Jason Lester Hill. System Architecture for Wireless Sensor Networks.
University of California, Berkeley. Spring 2003.Web page. URL:
www.eecs.harvard.edu/~mdw/course/cs263/papers/jhill-thesis.pdf
5.
Answer.com. Superheterodyen. Web page. URL: www. answer.com
6.
National Instrument. Introduction to RF & Wireless Communications Systems.
Web page. URL: http://zone.ni.com/devzone/cda/tut/p/id/3541
7.
Warsurina Bt. Mat Jubadi. Embedded TCP/IP in Sensor Nodes
(SENSORNETS). Universiti Teknologi Malaysia. November 2005
8.
MAXIM. Fundamentals of RS-232 Serial Communications. Application notes.
Web page. URL:
http://www.maximic.com/appnotes.cfm/appnote_number/3262
49
9.
Brian W. Kerninghan, Dennis M. Ritchie. The C programming Language. 2nd
edition.Prentice Hall
10.
WIN AVR - AVRfreaks. Web page. URL: http://ww.avrfreaks.net/AVRGCC
11.
Ponyprog2000. Web page. URL: www.lancos.com/prog.html
12.
Visual Basic-Wikipedia. Web page. URL:
http://en.wikipedia.org/wiki/Visual_Basic
13.
Wikipedia. Web page. URL: http://en.wikipedia.org/wiki/Main_Page
14.
ATMEL Corporation. Web page. URL: http://www.Atmel.com
15.
Cplusplus resources. Web page. URL: http://www.cplusplus.com
16.
VB Forums. Web page. URL: http://www.vbforums.com/
APPENDIX A
SOURCE CODE OF WATER SENSOR SYSTEM
50
/********************************************************************/
/**Title
: Water Sensor System with Non-standart Protocol
Description
:Basically this protocol only involve datalink layer.
The purpose of this protocol is to ensure the
reliability of datatransmission between 2
entities
( point to point).Below are the details used in
this protocol:
Error detection: Checksum
Frame Structure:
|------|---------|------|---------|
|Flag | Address | Data | Chcksum |
|----- |---------|------|---------|
2
2
1
1
-----> Bytes
where,
Flag: hf
Address: 12
/*******************************************************************/
#define FOSC 8000000// Clock Speed
#define BAUD 1200
#define baudrate (FOSC/16/BAUD-1)
#include <avr/io.h>
#include <stdio.h>
#define TX 1
// set tx=1:Receiver while tx-0: receiver
/******************************************************/
/********** Declaration for Subroutine *************/
/*****************************************************/
void USART_INIT(unsigned int UBRR);
void USART_TX(unsigned char data);
unsigned char USART_RX(void);
void delay_1m (unsigned char i);
/********************************************************/
/********
Main Program *****************************/
/******************************************************/
int main (void)
{
#if(TX==0)
#warning "TRANSMITTER"
unsigned char sen_data;
#else
#warning "RECEIVER"
unsigned char rx_data, ctr, sensor_data, chksum_;
#endif
unsigned char hdr[2] = "hf";
unsigned char add[2] = "12";
unsigned char chksum;
/**************************************/
/***** Initialize Timer0 & USART *****/
/*************************************/
USART_INIT(baudrate);
51
/****************************************/
/***** Program for Transmitter *********/
/***************************************/
#if(TX==0)
/* Initialize ADC */
DDRA = 0xF0;
while (1) {
/*read port a*/
sen_data = PINA;
/*calculate checksum: sum up all bytes in dataframe then invert (
1'scomplement)*/
chksum = sen_data + hdr[0] + hdr[1] + add[0] + add[1];
chksum = ~chksum;
/*Send 2 bytes header*/
USART_TX(hdr[0]);
USART_TX(hdr[1]);
/*send 2 bytes address*/
USART_TX(add[0]);
USART_TX(add[1]);
/*send data*/
USART_TX(sen_data);
/*send checksum*/
USART_TX(chksum);
}
/***************************************/
/****** Program for Receiver***********/
/*************************************/
#else
ctr = 0;
/* Set PortA as output (connected to LED)*/
DDRA = 0xff;
PORTA = 0;
while (1) {
/* wait for incoming data*/
if (UCSRA & (1<<RXC)) {
rx_data = UDR;
/* Check 2 bytes header*/
if (ctr < 2) {
if (rx_data == hdr[ctr]) {
ctr++;
} else {
ctr = 0;
}
/* Check 2 byte Address*/
} else if ((ctr > 1) && (ctr < 4)) {
if (rx_data == add[ctr - 2]) {
ctr++;
} else {
ctr = 0;
}
/*copy and save data */
} else if (ctr == 4) {
sensor_data = rx_data;
ctr++;
/* copy check sum*/
} else if (ctr == 5) {
chksum = rx_data;
ctr++;
/* Check wheter data contained any error?*/
} else {
chksum_ = (hdr[0] + hdr[1] + add[0] + add[1] +
sensor_data + chksum);
52
/*If data is error free display on LED and send
to pC*/
if (chksum_ == 0xff) {
USART_TX(sensor_data);
if (sensor_data == 0x1) {
PORTA = 0x3;
} else if (sensor_data == 0x3) {
PORTA = 0x7;
} else if (sensor_data == 0x7) {
PORTA = 0xf;
} else if (sensor_data == 0xf) {
PORTA = 0x1f;
} else {
PORTA = 0x1;
}
/*If data error send ff to pc alert user*/
} else {
USART_TX(0xff);
}
ctr = 0;
}
}
}
#endif
}
/***************************************/
/*** Subroutine for Initialized USART**/
/**************************************/
void USART_INIT(unsigned int UBRR)
{
/* Set baud rate */
UCSRA &= 0xfd;
UBRRH = (unsigned char)((UBRR)>>8);
UBRRL = (unsigned char)(UBRR);
/* Enable receiver and transmitter */
UCSRB = (1<<RXEN)|(1<<TXEN);
/* Set frame format: 8data, no parity, 1 stop bit */
UCSRC = (1<< URSEL) | (1<< UCSZ1) | (1<< UCSZ0);
}
/*****************************************************/
/**** Subroutine for Transmit data through USART*****/
/****************************************************/
void USART_TX(unsigned char data)
{
/* Wait for empty transmit buffer */
while ( !(UCSRA & (1<<UDRE)) ) ;
/* Start transmission */
UDR = data; // send least significant byte
}
/***************************************************/
/***Subrounite for Receive data through USART******/
/**************************************************/
unsigned char USART_RX(void) {
53
/* Wait for data to be received */
while (!(UCSRA & (1<<RXC))) ;
/* Get and return received data from buffer */
return UDR;
}
/*****************************************/
/****** Subroutine Delay 1 ms************/
/****************************************/
void delay_1m (unsigned char i)
{
int j;
while(i--)
{
j=11415;
// 8Mhz Exteranl Crystal(CKSEL3..0 = 1,1,1,1)
while(j--);
}
}
}
APPENDIX B
MAKE FILE FOR AVR MICROCONTROLLER
54
# WinAVR Sample makefile written by Eric B. Weddington, Jörg Wunsch, et
al.
# Released to the Public Domain
# Please read the make user manual!
#
# Additional material for this makefile was submitted by:
# Tim Henigan
# Peter Fleury
# Reiner Patommel
# Sander Pool
# Frederik Rouleau
# Markus Pfaff
#
# On command line:
#
# make all = Make software.
#
# make clean = Clean out built project files.
#
# make coff = Convert ELF to AVR COFF (for use with AVR Studio 3.x or
VMLAB).
#
# make extcoff = Convert ELF to AVR Extended COFF (for use with AVR
Studio
#
4.07 or greater).
#
# make program = Download the hex file to the device, using avrdude.
Please
#
customize the avrdude settings below first!
#
# make filename.s = Just compile filename.c into the assembler code
only
#
# To rebuild project do "make clean" then "make all".
#
# MCU name
MCU = atmega8535
# Output format. (can be srec, ihex, binary)
FORMAT = ihex
# Target file name (without extension).
TARGET = wlevel
# Optimization level, can be [0, 1, 2, 3, s]. 0 turns off optimization.
# (Note: 3 is not always the best optimization level. See avr-libc
FAQ.)
OPT = s
# List C source files here. (C dependencies are automatically
generated.)
SRC
= main.c
#delay.c usart_tr_vadib_sairi.c ruzaini.c
55
#usart_tr.c init.c blink.c usart_rx.c
adc_adibsairi.c
# If there is more than one source file, append them above, or modify
and
# uncomment the following:
#SRC += foo.c bar.c
# You can also wrap lines by appending a backslash to the end of the
line:
#SRC += baz.c \
#xyzzy.c
# List Assembler source files here.
# Make them always end in a capital .S. Files ending in a lowercase .s
# will not be considered source files but generated files (assembler
# output from the compiler), and will be deleted upon "make clean"!
# Even though the DOS/Win* filesystem matches both .s and .S the same,
# it will preserve the spelling of the filenames, and gcc itself does
# care about how the name is spelled on its command-line.
ASRC =
# List any extra directories to look for include files here.
#
Each directory must be seperated by a space.
EXTRAINCDIRS =
# Optional compiler flags.
# -g:
generate debugging information (for GDB, or for COFF
conversion)
# -O*:
optimization level
# -f...:
tuning, see gcc manual and avr-libc documentation
# -Wall...: warning level
# -Wa,...:
tell GCC to pass this to the assembler.
#
-ahlms: create assembler listing
CFLAGS = -g -O$(OPT) \
-funsigned-char -funsigned-bitfields -fpack-struct -fshort-enums \
-Wall -Wstrict-prototypes \
-Wa,-adhlns=$(<:.c=.lst) \
$(patsubst %,-I%,$(EXTRAINCDIRS))
# Set a "language standard" compiler flag.
#
Unremark just one line below to set the language standard to use.
#
gnu99 = C99 + GNU extensions. See GCC manual for more information.
#CFLAGS += -std=c89
#CFLAGS += -std=gnu89
#CFLAGS += -std=c99
CFLAGS += -std=gnu99
# Optional assembler flags.
# -Wa,...:
tell GCC to pass this to the assembler.
# -ahlms:
create listing
56
# -gstabs:
have the assembler create line number information; note
that
#
for use in COFF files, additional information about
filenames
#
and function names needs to be present in the assembler
source
#
files -- see avr-libc docs [FIXME: not yet described
there]
ASFLAGS = -Wa,-adhlns=$(<:.S=.lst),-gstabs
# Optional linker flags.
# -Wl,...:
tell GCC to pass this to linker.
# -Map:
create map file
# --cref:
add cross reference to map file
LDFLAGS = -Wl,-Map=$(TARGET).map,--cref
# Additional libraries
# Minimalistic printf version
#LDFLAGS += -Wl,-u,vfprintf -lprintf_min
# Floating point printf version (requires -lm below)
#LDFLAGS += -Wl,-u,vfprintf -lprintf_flt
# -lm = math library
LDFLAGS += -lm
# Programming support using avrdude. Settings and variables.
# Programming hardware: alf avr910 avrisp bascom bsd
# dt006 pavr picoweb pony-stk200 sp12 stk200 stk500
#
# Type: avrdude -c ?
# to get a full listing.
#
AVRDUDE_PROGRAMMER = stk500
AVRDUDE_PORT = com1
#AVRDUDE_PORT = lpt1
# programmer connected to serial device
# programmer connected to parallel port
AVRDUDE_WRITE_FLASH = -U flash:w:$(TARGET).hex
#AVRDUDE_WRITE_EEPROM = -U eeprom:w:$(TARGET).eep
AVRDUDE_FLAGS = -p $(MCU) -P $(AVRDUDE_PORT) -c $(AVRDUDE_PROGRAMMER)
# Uncomment the following if you want avrdude's erase cycle counter.
# Note that this counter needs to be initialized first using -Yn,
# see avrdude manual.
#AVRDUDE_ERASE += -y
57
# Uncomment the following if you do /not/ wish a verification to be
# performed after programming the device.
#AVRDUDE_FLAGS += -V
# Increase verbosity level. Please use this when submitting bug
# reports about avrdude. See
<http://savannah.nongnu.org/projects/avrdude>
# to submit bug reports.
#AVRDUDE_FLAGS += -v -v
# -------------------------------------------------------------------------# Define directories, if needed.
DIRAVR = c:/winavr
DIRAVRBIN = $(DIRAVR)/bin
DIRAVRUTILS = $(DIRAVR)/utils/bin
DIRINC = .
DIRLIB = $(DIRAVR)/avr/lib
# Define programs and commands.
SHELL = sh
CC = avr-gcc
OBJCOPY = avr-objcopy
OBJDUMP = avr-objdump
SIZE = avr-size
# Programming support using avrdude.
AVRDUDE = avrdude
REMOVE = rm -f
COPY = cp
HEXSIZE = $(SIZE) --target=$(FORMAT) $(TARGET).hex
ELFSIZE = $(SIZE) -A $(TARGET).elf
# Define Messages
# English
MSG_ERRORS_NONE = Errors: none
MSG_BEGIN = -------- begin -------MSG_END = -------- end -------MSG_SIZE_BEFORE = Size before:
MSG_SIZE_AFTER = Size after:
MSG_COFF = Converting to AVR COFF:
MSG_EXTENDED_COFF = Converting to AVR Extended COFF:
MSG_FLASH = Creating load file for Flash:
58
MSG_EEPROM = Creating load file for EEPROM:
MSG_EXTENDED_LISTING = Creating Extended Listing:
MSG_SYMBOL_TABLE = Creating Symbol Table:
MSG_LINKING = Linking:
MSG_COMPILING = Compiling:
MSG_ASSEMBLING = Assembling:
MSG_CLEANING = Cleaning project:
# Define all object files.
OBJ = $(SRC:.c=.o) $(ASRC:.S=.o)
# Define all listing files.
LST = $(ASRC:.S=.lst) $(SRC:.c=.lst)
# Combine all necessary flags and optional flags.
# Add target processor to flags.
ALL_CFLAGS = -mmcu=$(MCU) -I. $(CFLAGS)
ALL_ASFLAGS = -mmcu=$(MCU) -I. -x assembler-with-cpp $(ASFLAGS)
# Default target.
all: begin gccversion sizebefore $(TARGET).elf $(TARGET).hex
$(TARGET).eep \
$(TARGET).lss $(TARGET).sym sizeafter finished end
# Eye candy.
# AVR Studio 3.x does not check make's exit code but relies on
# the following magic strings to be generated by the compile job.
begin:
@echo
@echo $(MSG_BEGIN)
finished:
@echo $(MSG_ERRORS_NONE)
end:
@echo $(MSG_END)
@echo
# Display size of file.
sizebefore:
@if [ -f $(TARGET).elf ]; then echo; echo $(MSG_SIZE_BEFORE);
$(ELFSIZE); echo; fi
sizeafter:
@if [ -f $(TARGET).elf ]; then echo; echo $(MSG_SIZE_AFTER);
$(ELFSIZE); echo; fi
# Display compiler version information.
59
gccversion :
@$(CC) --version
# Convert ELF to COFF for use in debugging / simulating in
# AVR Studio or VMLAB.
COFFCONVERT=$(OBJCOPY) --debugging \
--change-section-address .data-0x800000 \
--change-section-address .bss-0x800000 \
--change-section-address .noinit-0x800000 \
--change-section-address .eeprom-0x810000
coff: $(TARGET).elf
@echo
@echo $(MSG_COFF) $(TARGET).cof
$(COFFCONVERT) -O coff-avr $< $(TARGET).cof
extcoff: $(TARGET).elf
@echo
@echo $(MSG_EXTENDED_COFF) $(TARGET).cof
$(COFFCONVERT) -O coff-ext-avr $< $(TARGET).cof
# Program the device.
program: $(TARGET).hex $(TARGET).eep
$(AVRDUDE) $(AVRDUDE_FLAGS) $(AVRDUDE_WRITE_FLASH)
$(AVRDUDE_WRITE_EEPROM)
# Create final output files (.hex, .eep) from ELF output file.
%.hex: %.elf
@echo
@echo $(MSG_FLASH) $@
$(OBJCOPY) -O $(FORMAT) -R .eeprom $< $@
%.eep: %.elf
@echo
@echo $(MSG_EEPROM) $@
-$(OBJCOPY) -j .eeprom --set-section-flags=.eeprom="alloc,load" \
--change-section-lma .eeprom=0 -O $(FORMAT) $< $@
# Create extended listing file from ELF output file.
%.lss: %.elf
@echo
@echo $(MSG_EXTENDED_LISTING) $@
$(OBJDUMP) -h -S $< > $@
# Create a symbol table from ELF output file.
%.sym: %.elf
60
@echo
@echo $(MSG_SYMBOL_TABLE) $@
avr-nm -n $< > $@
# Link: create ELF output file from object files.
.SECONDARY : $(TARGET).elf
.PRECIOUS : $(OBJ)
%.elf: $(OBJ)
@echo
@echo $(MSG_LINKING) $@
$(CC) $(ALL_CFLAGS) $(OBJ) --output $@ $(LDFLAGS)
# Compile: create object files from C source files.
%.o : %.c
@echo
@echo $(MSG_COMPILING) $<
$(CC) -c $(ALL_CFLAGS) $< -o $@
# Compile: create assembler files from C source files.
%.s : %.c
$(CC) -S $(ALL_CFLAGS) $< -o $@
# Assemble: create object files from assembler source files.
%.o : %.S
@echo
@echo $(MSG_ASSEMBLING) $<
$(CC) -c $(ALL_ASFLAGS) $< -o $@
# Target: clean project.
clean: begin clean_list finished end
clean_list :
@echo
@echo $(MSG_CLEANING)
$(REMOVE) $(TARGET).hex
$(REMOVE) $(TARGET).eep
$(REMOVE) $(TARGET).obj
$(REMOVE) $(TARGET).cof
$(REMOVE) $(TARGET).elf
$(REMOVE) $(TARGET).map
$(REMOVE) $(TARGET).obj
$(REMOVE) $(TARGET).a90
$(REMOVE) $(TARGET).sym
$(REMOVE) $(TARGET).lnk
$(REMOVE) $(TARGET).lss
$(REMOVE) $(OBJ)
$(REMOVE) $(LST)
61
$(REMOVE) $(SRC:.c=.s)
$(REMOVE) $(SRC:.c=.d)
# Automatically generate C source code dependencies.
# (Code originally taken from the GNU make user manual and modified
# (See README.txt Credits).)
#
# Note that this will work with sh (bash) and sed that is shipped with
WinAVR
# (see the SHELL variable defined above).
# This may not work with other shells or other seds.
#
%.d: %.c
set -e; $(CC) -MM $(ALL_CFLAGS) $< \
| sed 's,\(.*\)\.o[ :]*,\1.o \1.d : ,g' > $@; \
[ -s $@ ] || rm -f $@
# Remove the '-' if you want to see the dependency files generated.
-include $(SRC:.c=.d)
# Listing of phony targets.
.PHONY : all begin finish end sizebefore sizeafter gccversion coff
extcoff \
clean clean_list program
APPENDIX C
SOURCE CODES FOR GRAPHICAL USER INTERFACE
62
Private Sub Timer1_Timer()
masa.Refresh
masa.Caption = Time
End Sub
Private Sub Form_Load()
MSComm1.RThreshold = 1
MSComm1.InputLen = 2
MSComm1.CommPort = 1
MSComm1.Settings = "1200,N,8,1"
MSComm1.DTREnable = False
MSComm1.PortOpen = True
Tarikh = Date
masa = Time
Hari = WeekdayName(Weekday(Date, vbSunday))
End Sub
Private Sub Form_Unload(Cancel As Integer)
MSComm1.PortOpen = False
End Sub
Private Sub MSComm1_OnComm()
Dim x As Long
Dim y As Long
Dim r As Long
Dim sData As String
incoming data
Dim lHighByte As Integer
Dim Word1 As Long
result
If MSComm1.CommEvent = comEvReceive Then
comEvReceive Event then get data and display
sData = MSComm1.Input
lHighByte = Asc(Mid$(sData, 1, 1))
Word1 = lHighByte
End If
x = lHighByte
If lHighByte = 46 & lHighByte = 57 Then
MsgBox "THIS FRAME IS NOT FOR US!!"
End If
If x = &H1 Then
Label3.Caption =
Label1.BackColor
Label2.BackColor
Label4.BackColor
Label5.BackColor
Label6.BackColor
"1 meter"
= &HFF0000
= &HFF00&
= &HFFFFFF
= &HFFFFFF
= &HFFFFFF
ElseIf x = &H3 Then
Label3.Caption =
Label1.BackColor
Label2.BackColor
Label4.BackColor
Label5.BackColor
Label6.BackColor
"2 meter"
= &HFF0000
= &HFF00&
= &HFFFF&
= &HFFFFFF
= &HFFFFFF
' Holds our
' Holds the Word
' If
' get 1st byte
63
ElseIf x = &H7 Then
Label3.Caption =
Label1.BackColor
Label2.BackColor
Label4.BackColor
Label5.BackColor
Label6.BackColor
"3 meter"
= &HFF0000
= &HFF00&
= &HFFFF&
= &H80FF&
= &HFFFFFF
ElseIf x = &HF Then
Label3.Caption = "4 meter"
Label1.BackColor = &HFF0000
Label2.BackColor = &HFF00&
Label4.BackColor = &HFFFF&
Label5.BackColor = &H80FF&
Label6.BackColor = &HFF&
Else
Label3.Caption = "WATER LOW"
Label1.BackColor = &HFF0000
Label2.BackColor = &HFFFFFF
Label4.BackColor = &HFFFFFF
Label5.BackColor = &HFFFFFF
Label6.BackColor = &HFFFFFF
End If
End Sub
APPENDIX D
PONYPROG2000 USER MANUAL
64
How to use PonyProg2000 for the Microrobot
AVR Products(Rev 0.3)
Contents
What is PonyProg2000?
How to install?
Preparation
How to download a program using PonyProg2000
What is PonyProg2000?
PonyProg is a serial device programmer software with a user-friendly GUI framework
available for Windows95, 98, 2000 & NT and Intel Linux. Its purpose is reading and writing
every serial device. At the moment it supports I²C Bus, Microwire, SPI EEPROM, the Atmel
AVR and Microchip PIC micro.
For more details, visit http://www.lancos.com/e2p/ponyprog2000.html
How to install?
Run the setup.exe file.
Preparation
1. Supply proper power to the (CPU) board.
2. Connect the downloading adapter to the PC printer port. Then connect the
downloading adapter and the board with the flat cable.
3. Turn on the power switch on the board. Power LED turns on (when applicable).
4. Compile the source file you want to download.
How to download a program using PonyProg2000
Run the PonyPorg2000 program.
65
Click on OK. The following window appears.
Click on OK. Select ‘Setup Æ Calibration’.
Click on Yes button. The following window appears.
Click on OK.
Select ‘Setup Æ interface Setup’ and set up as shown below (Parallel, Avr ISP I/O, LPT1)
and click on Probe. ‘Test Ok’ message appears. Click on OK. Click on OK.
66
Select the device you want. (‘Device Æ AVR micro Æ XXX’, XXX is the device you want)
Select ‘Command Æ Program Options’ and check as shown below. (Reload Files, Erase,
Write Program memory)
Click on OK.
Some devices require ‘Flash Fuse Bits Setting’ for the desired clock source setting. For
example, CKSEL3..0 bits of the ATmega8535 and Atmega8515 devices need to be set 1 to
67
select the External Crystal clock source mode. Refer to ‘Clock Options’ of the device sheet
for the detailed bit setting.
If you need to set the bits, select ‘Command Æ Security and Configuration Bits…’.
Click on Read button, uncheck the CKSEL3..0 bits and then click on Write button.
Fig 1.6 shows a ‘Security and Configuration Bits’ dialog box as an example.
Note: If the board has an AT90S-type CPU instead of ATmega-type, the setting is not
required.
Select ‘File Æ Open Program File’ and load the *.rom(or *.hex) file.
Select ‘Command Æ Program’ or press ‘Ctrl + P’ to start the downloading. If no ‘Program
Failed’ message appears, the downloading has been completed successfully.
www.microrobot.com