1
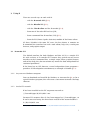
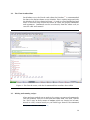
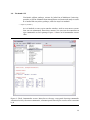
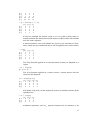
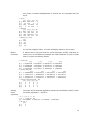
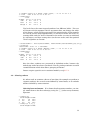
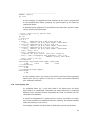
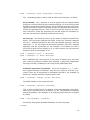
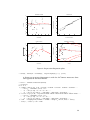
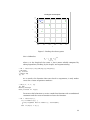
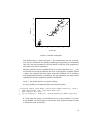
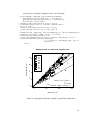
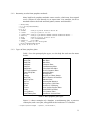
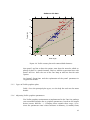
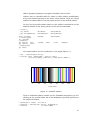
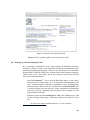
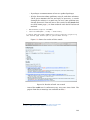
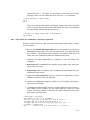
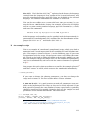
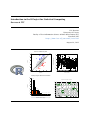
●
●
6
11
16
2
7
12
17
22
3
8
13
18
23
4
9
14
19
●
24
5
10
15
20 ●
25
1
●
●
21
●
Figure 7: Plotting symbols
Note the use of the as.numeric method to coerce the Species, which is a
factor, to the corresponding level number (here, 1, 2 and 3), and then the
use of this number to index a list of printing characters (pch argument)
and colours (col argument).
The plot generic method is an example of a high-level plotting method
which begins a new graph. Once the coördinate system is set up by plot,
several mid-level plotting methods are available to add elements to the
graph, such as lines, points, and text; Table 1 lists the principal methods;
see the help for each one for more details.
abline
arrows
axis
box
grid
legend
lines
mtext
points
polygon
rect
rug
segments
symbols
text
title
Add a Straight Line
Add Arrows
Add an Axis
Draw a framing Box
Add a Grid
Add Legends
Add Connected Line Segments
Write Text into the Margins
Add Points
Draw Polygons
Draw Rectangles
Add a Rug
Add Line Segments
Draw Symbols
Add Text
Plot Annotation
Table 1: Methods for adding to an existing base graphics plot
For example, to add horizontal and vertical lines at the mean and median
71