1
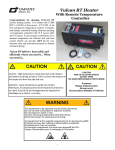
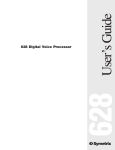
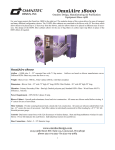
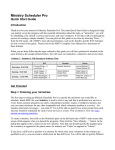
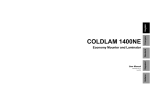
Low Fidelity Prototype and Usability Test
Human-Computer Interaction Capstone
James Anderson
Young Kim
Cameron Tom
Darby Wong
(computer, observer)
(computer, facilitator)
(computer, observer)
(computer, facilitator, observer)
Introduction & Mission Statement
Introduction
The system being evaluated is one designed to provide commuters with information
regarding traffic conditions, in order to enable them to make better driving decisions.
The purpose of this experiment is to gauge usability of the current design of the system
by constructing a paper prototype and observing volunteers accomplish tasks with the
prototype. While there are obviously issues with a real system that can not be observed
from usage of a paper prototype, this experiment does allow us to study the impact of
many design decisions. These design decisions include the general functionality
provided by the system, as well as the types, behaviors, and labeling of controls.
Mission Statement
Our mission is to design a system that will enable commuters to make better driving
decisions, via the provision of information regarding the congestion of traffic on major
roadways. In addition to this core functionality, our mission includes two sub-goals:
• Commuters should be able to use this system with little to no training
• Commuters should be able to use our system quickly and efficiently with partial
attention, in order to ensure safe usage while operating a motor vehicle.
Prototype
Our prototype is a cardboard rendition of the one shown in the sketch shown in Figure 1 below.
A picture of the prototype is shown in Figure 2.
Figure 1: Initial sketch of the system
The only change to the screen was the removal of the “Options” hot area in the upper left corner
of the screen. This was done because none of the tasks involved the “Options” screen. The only
changes to buttons the names “Default” to “Me” and “Alert” to “Events.” We cut out a hole for
the screen and placed it on a huge map. Once posted on cardboard, we could simulate movement
by sliding the map underneath. We created 3 maps at different zoom levels and simulated
changing the zoom level by switching maps. The map was printed from the Department of
Transportation website. Icons were drawn on the map. The thumbnails of preset views were
covered with Post-It notes and pealed off when the user set a preset. The buttons around the
screen were made of rough cardboard. The ones that could turn, like volume, were secured with a
thumbtack.
Figure 2: Low fidelity prototype (more detailed pictures in Appendix)
Method
Participants
All participants are single students who own their own car. All of them frequently drive
on I-5 and I-90. Two of the participants drive on SR-520 and one those two drives on
Highway 99.
Participant A
… is a 21 year old male student who has been driving for 5 years. In an average week, he
drives 8 hours over a course of 3 days. He most frequently commutes from Federal Way
to Seattle for school, and to Redmond to shop.
Participant B
… is a 22 year old male student who has been driving for 6 years. In an average week, he
drives 1-2 hours over the course of 2-3 days. He most frequently drives to make trips to
the grocery store, to run errands, and to visit relatives.
Participant C
… is an 18 year old female student who has been driving for 2 years. In an average
week, she drives 6 hours over the course of 4 days. She mostly drives to visit her family
in Eastern Washington on weekends, and between the UW and the Greenwood area.
All participants were offered $10 in exchange for their time, and were screened to ensure
that they were not computer savvy. Participant A’s participation was obtained through a
posting in an online community for UW students. The ad screened for frequent
commuters familiar with the greater Seattle area. The participation of Participant B and
Participant C were obtained by approaching random people on the UW campus. These
participants were screened to ensure that they were somewhat familiar with the greater
Seattle area and drive somewhat frequently.
Environment
All experiments were performed on a table, with the prototype laid flat on the table. The
participants sat in a chair facing the prototype. The experiments with Participant A and
Participant B were performed in a small room, while the experiment with Participant C
was performed outdoors.
Tasks
Task 1
Traveling north on I-5 passing Boeing Field one evening, you notice congestion
up ahead. You are not accustomed to driving at night, so you don’t want to take
your eyes off the road for too long. Use our device to get an audio report of
events that might be causing the congestion.
Task 2
It is afternoon, and you want to drive from Lynnwood to Renton. Use our device
to find a route to take.
Task 3
School has just ended and you want to go home, which is in Bellevue. You just
got our device and are eager to use it. Since you make the commute from UW to
Bellevue at the end of each day, you would like to have preset map views of 520
and I-90. Use our device to create a preset map view containing these two
bridges.
Procedure
The experiment had four main components.
First, the entire group would introduce themselves and try to make the participant feel at
ease, perhaps answering some general questions about the experiment. The participant
would be asked to fill out a brief survey and consent form.
Second, the facilitator would read a general introduction while demonstrating some key
features of the prototype.
Third, the participant would perform three tasks. For each task, the facilitator would
hand the participant an index card with the task written on it. The participant was then
instructed to announce when the task had been completed to their satisfaction, at which
point the facilitator would hand the participant the next task. During this time, the
facilitator would try to elicit current thoughts and questions that the user had in their
mind as they tried to perform the test.
Fourth, the participant was allowed to ask questions, give general impressions, and make
suggestions in a debriefing session. In addition, the participant would be asked questions
by members of the team other than the facilitator during this debriefing session.
As a team, we rotated our roles for each experiment. In the first experiment, Darby was
the computer, Young was the facilitator, while Cameron and Jim were observers. In the
second, Young was the computer, Darby was the facilitator, while Jim was the observer.
In the third, Cameron was the computer, Jim was the facilitator, while Darby was the
observer. As mentioned earlier, the tasks the team members differed slightly from those
in ‘Prototyping for Little Fingers’, in that the entire group functioned as the greeter; we
didn’t see a strong need to limit this role to one person.
Test Measures
The three measures we looked for and measured during the experiments was whether the
user was able to complete the task, whether the user completed the task using congestion
information, and the number of actions the participant had to try before finding one that
was relevant to the task at hand or even after the task had been completed. Panning and
zooming of the map to correct for the participant having panned too much or zoomed too
much were not counted as irrelevant actions, since the participant was clearly able to
recognize that the task was necessary, and the problem most likely arises from the
participant being unfamiliar with the map (e.g., the user would have the map centered on
the correct location, but failed to recognize the map image, and chose to pan further).
Results
Most of the problems involved the labeling of the buttons. One of the participants pressed the
‘Me’ button at the start of the first two tasks before figuring out what the button did. Another
participant turned the volume knob in trying to accomplish the first task. Participants never
engaged in more than one irrelevant action before figuring out how to accomplish the task
however; for example, in the latter example, the participant chose to press the ‘Events’ button
after receiving no response from turning the volume knob.
Only one of the participants intuitively grasped that the colors on the roadways could be relevant
to the task at hand. The others did not use this congestion information when trying to choose
what route to take when given two options, and seemed to treat the system as more of a
navigational tool.
There was some difficulty when it came to setting a preset map view, primarily due to ambiguity
as to what the task asked for. Participant A was able to accomplish the task easily, but the other
two participants simply scrolled to the region without setting any presets. Once the task was
clarified however, the participants were able to easily set the preset. One of the users set presets
for the first task, though this seemed to be an earnest digression from the task assigned. All the
users intuitively understood the parallel of our system to that of setting a radio station in a car by
holding a preset button. They all immediately knew that recalling a map view could be done by
pressing the appropriate preset button.
Since zooming and panning were covered in our demo, all of the users were able to manipulate
the map to provide them with the data they wanted. All of them commented on the ease and
familiarity of using a four way rocker switch to pan the map, and appreciated the dial for
changing the zoom. The volume was intuitive for all the users, though none commented on it.
Discussion
We discovered problems with the “Me” button. Users would push this button to try to figure out
its function, but if the map was already centered on the user’s location, nothing happened. We
realized all buttons should provide feedback when pressed, with a beep, flashing icon, or both.
For example, we plan on changing the “Me” button so that it will flash the user’s location and
emit a soft beep when pressed.
We also learned that some users had trouble noticing and realizing what the colors meant. They
simply did not realize that the purpose of the colors was to indicate congestion levels. Upon
further discussion, we concluded that this issue was due to a mismatch between the model of the
designers, and the model of the users. The mental model of a navigation system, which they were
used to seeing, was interfering with the model of a traffic monitor, which we were trying to
present. To solve this, we plan to use brighter colors to force the user to notice the feature and to
emphasis the congestion aspect of the project. It is important to note however, that the two
participants that used the system more for navigational purposes were drivers that seemed to be
less experienced with the regions in the tasks. These two participants might not be considered
frequent commuters by some. We might be able to thus attribute at least some of this problem to
the fact that some participants are somewhat outside of our target demographic.
Though not directly related to the design, we found that some users were initially confused about
the task involving setting preset map views. We plan to change the wording of the task to tell the
user to “save the view for future reference” rather than “set a preset.” All users were able to save
the view easily once the task was clarified for them. They all immediately inferred the metaphor
to radio station presets.
We learned that the zooming with a dial and panning with a four way rocker switch was easy and
intuitive for all the users. We did find that the view provided by the view with the least resolution
did not cover enough distance, as all users needed to scroll around to accomplish the task of
planning a route from Lynnwood to Renton, but this was more a limitation of the prototype than
of design.
One thing that the experiment could not reveal was the usability of the system with limited
attention paid. The experiments were conducted on tables, making it difficult to simulate the
conditions the system is designed to operate in. We had thought of requiring the user to focus
some visual stimuli while accomplishing given tasks, but this proved to be infeasible in the time
frame given for the experiment construction.
Also as a result of the environment of the experiment, this experiment could not reveal the
usability of the system in its intended orientation. In a car, the system would be vertical and
facing the user from the right-hand side, rather than lying flat on table, directly in front of the
user. Thus, this experiment could not reveal problems related to the placement of controls.
Similarly, the experiment could not reveal any issues regarding lighting and texture (i.e., source
of light, glare, dust or food on the screen, grease on fingers, etc).
Appendix
Table of Contents
1.
2.
3.
4.
5.
6.
7.
Image of the three (3) maps used in our prototype, with soda can for reference
Image of prototype, using the lowest resolution map
Survey given to participants
Informed consent form given to participants
Demonstration script read and performed for participants
Task cards given to participants
Raw process data gathered and compiled
Survey
Age ______
Gender ______ Single/Married
Occupation _________________________________
Do you own a car? Yes/No
How many years have you driven? ______
On average, how many days per week do you drive? ______
On average, how many hours per week do you drive? ______
Please list the highways that you most frequently drive on in the space below.
Please list some tasks what you are usually trying to accomplish when driving. For example, you may
drive from Bellevue to downtown Seattle everyday to get to work.
I voluntarily agree to participate in the evaluation of the Traffic Monitor. I understand that this evaluation
is being conducted by CSE 490 JL students for usability testing.
I understand that the evaluation methods which may involve me are to:
1. listen to an introduction of the product
2. perform guided tasks involving a prototype of the product
3. participate in a 30-45 minute interview
I understand that all personally identifiable information will be kept confidential.
I grant permission for data about my background, such as age and occupation, to be published. I grant
permission for the session to be tape recorded and transcribed. I grant permission for the evaluation data
generated from the above methods to be published in an evaluation report.
_______________________________________
Research Participant (Print)
_______________________________________
Research Participant (Signature)
_______________
Date
Traffic Monitor Demonstration Script
NOTE: FOLLOW PRECISELY
This is a low fidelity prototype of a traffic monitoring system being developed for a course. The
purpose of this system is to enable people to make better driving decisions, by providing
information about congestion.
We will now show you some of the basic features of this device. As you can see, this device
consists of a screen showing a map, and several buttons surrounding it. You can pan around the
map by using this control (point to pan control, press on different directions to illustrate). You
can zoom in on specific regions of the map by twisting this knob (point to zoom knob, twist back
and forth to illustrate).
We will be asking you to perform three (3) tasks with this device. We want to emphasize that
you are strongly encouraged to voice any thoughts or questions you have while using the device.
The purpose of this experiment is to test the prototype, not you. So if anything is unclear to you,
please let us know; this information is extremely valuable to us.
Raw Observation Data
Participant A
• Commented to zoom or focus on event when button pressed, while events spoke out.
• Commented that in closest zoom, events should still be read out.
• Commented when returning to current location view, it should not change zoom setting.
• User curious about camera icons on map. Informed user that these were a by product of maps we used. Will
be fixed in upcoming iteration.
• Used separate presets for I-90 and 520
• Used preset #2 first
• Always finishes task by hitting “Me”
• Used lowest zoom immediately for tasks
• Final Comments:
o Show highway road names of roads shown on map.
o Show exit numbers.
o Zoomed out as far as possible when choosing route to take. Should have had one more level of zoom.
o Presets were used in second task. Not implemented for this stage.
o Suggested to from current location to presets smoothly. Not just jump.
o Expected closed captioning (scrolling text) during announcement.
o Make event locations more noticeable on map. (Flash)
o Outline and label cities
Participant B
• User tried to change volume as first act. Nothing happened.
• Instead of using the congestion colors, used experience to choose best route to take.
• Didn’t figure out point of presets. May have been badly worded.
• Final Comments
o Commented that there should have been more events about traffic itself.
o Suggested a user’s manual would have made the device much more usable.
o Suggested showing side streets.
o Suggested labeling Home instead of Me
o Suggested a compass overlay
o Liked Rocker
o Suggested maps for different regions of country.
Participant C
• Pushes ‘me’ button by default
• Pushed ‘events’ button for first task immediately
• Coloring not self explanatory
• Confused at labeling of ‘events’ button
• Presets – matched user conception model of radio
• Confused about third task – word better?
• Second task – chose southbound on I-5, 518
• Route selection reasoning was based on ‘easiest’ – least amount of turns
• Zoomed out to see possible routes and chose from there
• Seems to use system more for navigation than congestion information