1
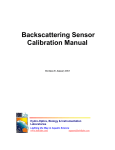
Updating a-Sphere Pure Water
Calibrations
www.hobiservices.com
David Dana, 2015-8-11
Introduction
The a-Sphere in-situ spectrophotometer is calibrated to measure the spectral
absorption coefficient of any fluid flowing through its spherical sample chamber.
Several factors cause the calibration to change with time, primarily aging of the lightemitting diodes in the light source. Long-term changes in the LEDs can be
compensated for by measuring the a-Sphere’s response to pure water. This is part of
the normal calibration process at Hobi Instrument Services, but can also be done by
properly equipped users.
The pure water calibration process is also helpful for testing how well the
integrating cavity has been cleaned, and for observing long-term changes in the cavity.
Prerequisites
This document assumes familiarity with
•
•
•
general operation of the a-Sphere,
a-Sphere processing software based on IGOR Pro, and
using RadSoft for real-time communication with the a-Sphere.
For more about these, see the a-Sphere User’s Manual, and the separate document
“Using RadSoft with the a-Sphere.”
The procedures require these programs and files:
•
•
•
•
•
IGOR Pro version 6.2 or later,
a-Sphere Processing Template.pxt version 2.00 or later,
RadSoft,
PWL.CMD, and
PWD.CMD.
Processing requires the IGOR Pro project “a-Sphere Processing Template.pxt” version
2.00 or later.
The procedures require a source of highly purified water, such as a Millipore MilliQ™ or equivalent system.
Collecting pure water data
Setup Prepare tubing and fittings to allow flowing pure water through the a-Sphere while it is
standing vertically, sphere end down. The vertical orientation provides the best
flushing of air from the sphere when filling it. This requires a right-angle fitting on the
Page 1 of 5
bottom inlet to the sphere. The outlet, on the side of the a-Sphere, can be either rightangle or straight. Ideally, flow water directly and continuously from your purification
system into the sphere. But if that is not practical, you may flow water that has been
stored in a suitable carboy.
Cleaning Thorough cleaning is essential for accurate results. In most cases, merely flowing pure
water through the sphere is not sufficient to clean it. We have found that Alconox
detergent, diluted according to the manufacturer’s instructions, is the most effective
cleaner. Apply the liquid cleaner liberally to a soft cloth or paper towel, and wipe it
directly on the surface of the sphere, then rinse it with pure water. It may be necessary
to repeat this process several times to achieve optimum cleaning. You can use RadSoft
to observe the data after each cleaning. Cleaning tends to have the largest effect on UV
wavelengths, where dissolved matter has highest absorption.
Data Display RadSoft will automatically display data you collect, in a graph that has many options.
Typically it is most useful to select level 4 processing, which displays the data
normalized by the pure water spectrum contained in the current calibration file. This
makes it easy to see how the spectrum has changed, and sometimes to see when
cleaning is needed. For example, a spectrum that falls off rapidly at short wavelengths
likely indicates the sphere is contaminated with UV-absorbing organic matter. A
spectrum with narrow peaks or troughs likely indicates changes in individual LEDs
centered at those wavelengths.
For more details about processing and display options, see the separate “Using
RadSoft with the a-Sphere.”
Procedure Note: commands typed into the RadSoft terminal window are shown in upper case for
clarity, but are not case-sensitive. Commands are sent when you press the Enter or
Return key.
•
•
•
•
Connect to the a-Sphere with RadSoft, and open a terminal window, to allow
typing commands to the a-Sphere and seeing the a-Sphere’s responses.
Using the RadSoft Device Explorer, copy the files PWL.CMD and PWD.CMD to
the a-Sphere.
Fill the sphere with pure water. If possible, allow the water to flow continuously
during the test.
Type WARMUP in the terminal window. If the a-Sphere replies with READY,
proceed. If not, type START WARMUP and wait until it indicates it is ready.
Page 2 of 5
•
•
•
•
•
Type AUTO. This will set the integration time appropriately. It should show a
value between 95 and 250 ms (depending on the characteristics of your
particular instrument).
Type PWL. This will collect and average 50 samples, then send the averaged
spectrum to RadSoft.
To observe whether the values are stable, type START PWL. This will
continuously collect new 50-sample averages and display them. Type STOP to
stop the data collection after it completes the current average, or press ctrl-C
repeatedly to stop it immediately.
Preferably, after collecting satisfactory data, drain, open and clean the sphere
again, and repeat the data collection. If the sphere is perfectly cleaned, the
values should not change significantly after additional cleaning. After a period
of extensive use, it is not unusual for the sphere to require several cleanings.
When finished, turn off power to the a-Sphere
Data you collect during this process will be stored on the a-Sphere in files called
PWL.BIN (light data) and PWD.BIN (dark data). The PWL and PWD commands append
new data to any existing PWL.BIN and PWD.BIN files on the a-Sphere, so data you
collect with this procedure will accumulate in those files until you delete them. It is OK,
and sometimes helpful, to let these files grow large, in order to maintain a record of
multiple pure water calibrations. The date and time are stored with each data sample.
After collecting data, use the RadSoft device explorer to copy the PWL.BIN and
PWD.BIN files from the a-Sphere to your computer.
Processing pure water data
This process requires IGOR Pro software and the a-Sphere Processing Template.pxt file
from Hobi Instrument Services. It uses features first added in version 2.00 (or 200) of
the template file.
•
•
•
•
Open the processing template file in IGOR Pro.
From the a-Sphere menu, select Load Calibration File… and navigate to the
existing calibration file for your a-Sphere.
Select Load Pure Water Data…, and navigate to and select the PWL.BIN file.
When asked “Load separate dark file?”, click Yes and select the PWD.BIN file. It is
acceptable to click No and skip loading of the dark data, but that will produce
slightly less accurate results.
Igor will now present a graph like the following. This example plot shows a long data
set collected over several hours, to illustrate the full capabilities of the software, but it
is OK if your data set is smaller, even just a few samples.
Page 3 of 5
It is also OK if your data includes multiple distinct sets of data separated by hours or
days. In that case you can zoom in on portions of the data, using IGOR Pro’s standard
controls.
The slider control at the bottom of the graph selects one wavelength to display. By
sliding it back and forth you can observe how different wavelengths varied with time.
Note that some wavelengths are out of the useful measurement range, and will display
zero or other meaningless values. But all the wavelengths in the range of
approximately 360 to 750 nm should contain valid data.
The purpose of this display is to allow you to see trends in the data over time, in
order to evaluate the quality of your pure water measurements. At Hobi Services we
typically record a number of measurements, interspersed with cleanings of the sphere,
in a single file. Then we can see the effect of successive cleanings. When the raw
signals reach a stable maximum, the sphere is as clean as possible.
Wavelengths longer than about 650 nm are affected by water temperature, so they
may have a different trend from shorter wavelengths. The example plot above shows
data at 734 nm, where the temperature effect is quite strong. The rising trend in this
case is probably due to decreasing water temperature. Because of this effect, it is best
to judge the quality of data only at wavelengths below 650 nm. It is also important to
measure and note the temperature of the water at the time of calibration, since in-situ
measurements will show temperature effects at the longer wavelengths.
Once you have determined what range of data best represents pure water,
•
•
Drag the round cursor from the toolbar below the graph window, onto the first
data point you wish to include.
Drag the square cursor onto the last point.
Page 4 of 5
•
•
•
Click the Calculate button.
You will be prompted to enter the temperature of the water.
A new plot will open, showing the average spectrum of the data you selected.
Collecting a new air reference spectrum
An air reference spectrum, collected with the sphere completely empty and dry, is
sometimes useful for checking the cleanliness and stability of the a-Sphere. Pure-water
measurements are the best method for doing this, but air spectra can be collected
more easily, and without special equipment.
You can collect and update an air reference using very similar procedures to those
for pure water, with the following differences:
•
•
•
After cleaning the sphere, ensure it is completely dry inside. If necessary, leave
it open to allow water trapped around the windows and edges of the sphere to
evaporate. Depending on the environment, this could take up to several hours.
On the a-Sphere, use the AIRL and AIRD commands instead of the PWL and
PWD commands.
In RadSoft, use level 5 data display, which will normalize the data to the
previous air reference (instead of the previous pure-water) spectrum.
Saving a new calibration file
To store a new version of the calibration file, select the Save Igor Calibration File…
command from the a-Sphere menu in IGOR Pro. The file will contain the last pure
water and air reference spectra (if any) you processed.
You can also save a version of the file for use with RadSoft, using the Save RadSoft
Calibration File… command.
Page 5 of 5