1
ULTRA II User Manual
Ultra II is a new Internet security trading system that has been developed to facilitate Bualuang
i-trading's customers.
1. Over View
Ultra II consists of 5 main category pages:
1.1 Real-time consists of 5 sub-menus.
Market By Price
Market Watch
Stock Watch
3 Bids / 3 Offers
Stock Summary
1.2 Ticker shows most recently traded stocks.
1.3 Portfolio contains 3 sub-menus such.
Profit & Loss
Credit Balance
Credit Available
1.4 Services are subordinate menu providing links to 4 useful pages.
BSIS (Bualuang Securities Information Service)
eFinance Thai
BLS Liberty
Research
1.5 Setting
2. Real time
Real time consists of 5 sub-menus.
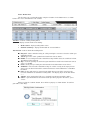
2.1 Market By Price
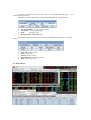
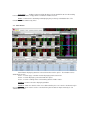
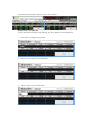
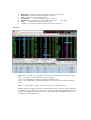
Market By Price is the main page of the program BLS UltraII. It provides market
overview, real-time stock prices. The customers are also able to place immediate trading orders.
The display can be categorized into 3 parts:
Part 1: Other menu selection and display of market overview.
Part 2: Display of individual security.
Part 3: Order-placing tool bar that also shows the details of previous and latest orders.
Part 1: Other menu selection and display of market overview.
Section A Included 5 main menus such as Real time, Ticker, Portfolio, Services and
Setting.
Section B Display the movement of highest and lowest price changes and volume of SET
and SET50, numbers of securities whose prices move up, decline and remain.
Section C Push and Pull functions:
Push is the sending data function. If there is any information change, it will be
automatically sent via Push to Ultra II
Pull is the calling data function. The program will pull out the information from the system
eventually. This is suitable in the presence of firewall.
The program will automatically select the most suitable Push or Pull mode for you every
time you open Ultra II. The selected mode will appear in green and can be observed on the upper
right corner of Ultra II. In addition you can change the Push/Pull mode as you wish by clicking
Push or Pull.
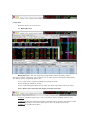
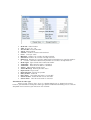
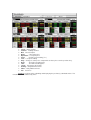
Part 2: This part used to display security details. It has been consist of 3 areas.
Area A: Market By Price
This area shows the details of your selected symbol. The details provided more
information than those appeared in the area B (Real-time Quote). There are two alternative ways
to display the stock details in this area,
First, Select the security symbol that is currently shown in the area B. The stock
information will automatically be displayed.
Second, Move the cursor into the blank box at “Enter Stock Symbol” then enter the stock
symbol, and then click OK.
The security details are provided by:
Volume, Bid: 3 Best bid volumes and prices of a security
Offer, Volume: 3 Best offer prices and volume of a security
Prior: Close price of the previous day
Hi/Lo: Highest and Lowest price of the day
Open: Latest open price. Open 1 is the morning open price. Open 2 is the afternoon
open price. Prices during the time market is closing called Projected Close.
Ce: Ceiling is the maximum price a stock can go up on the day.
Fl: Floor is the maximum price a stock can go down on the day.
I: Price for an IPO shown only on the first day of trading
L: Number of Broad Lot per order, normally equal to 100 stocks.
SP: Price Spread
P: Par value
Volume, Price, Time: 7 latest trading volumes, prices and times
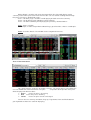
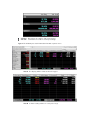
Area B: Real-time
This area displays volumes and prices of multiple stocks. The main purpose is to provide
the users the real-time trading movement as customer’s list. The each color of stocks price and
symbol will be declared whether the increasing, decreasing or remaining price from then the last
previous close price.
Green means increasing price.
Red means decreasing price.
Yellow means the remaining price.
You can use the arrow up and down button or Page up, Page down, Home and End on
your keyboard to view your stocks.
The following information of each stock will be shown
Stock: The stock symbol
Sts: Status of the security
Vol Bid: Best bid volume
Bid: Best bid price
Offer: Best offer price
Vol offer: Best offer volume
Last: Last trading price
Chg: Change in price comparable to close price on the previous day
Open 1: Open price for morning session
Open 2: Open price for afternoon session
Close: Close price. Price during the time market is closing called Projected close.
2.1 Selection Menu
Type the stock symbol in this blank box next to “Selection”, and then click “Enter”. The
information of that individual stock will be shown up. This menu also provides a quick view for
stock groups. A various selections are available in the drop down menu such as MAI, Most Active
Volume, Most Active Value, Top Gainer, Top Loser, Main Board, Foreign Board, All Counters and
Sector. There is also Favorite 1 – Favorite 4 where the users can add the securities of their
interest for monitoring (Watch list/Favorite List).
2.2 Favorite Management
You can set up a stock group by using Favorite 1 up to Favorite 4.
Simply select
the Favorite 1 – 4 from the drop-down menu then click “Add”. The blank box will appear in the first
column, so that you can type in the security symbols, then click “Enter”. The numbers of stock that
can be added into the Favorite is up to the space available in this window or about 20 stocks for
each group or 80 stocks in total.
In order to delete any of the stock in from the Favorite list, you can simply move the
cursor to highlight the stock name, and then click “Delete”.
Area C: Ticker
This area shows trading transactions occurred for each individual stock on the main
board. It changes every time the stock is bought or sold. The transaction will be appeared in Blue
for every trading value exceeding 1 million Baht. This area will display
Stock:
Volume:
Price:
Change:
Stock Symbol
Trading volumes
Trading prices
Change in stock prices comparable to close
prices on the previous day.
The information can be displayed in 2 modes.
Normal mode: Each trading transaction will be shown. It will be default display every time
you open the program.
Sum mode: Trading summary will be displayed. If you would like to view the trading
transaction in sum mode, simply click the small box in front of “Sum”.
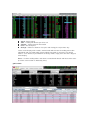
The trading prices and volumes during the day can also be displayed as a chart as shown
below. To view the chart, click “Chart” located next to “View” button.
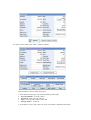
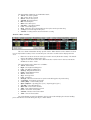
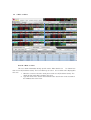
Part 3: Order Area
The investors can send trading order using the functions in the bottom area as shown
below. The area is divided into3 sub sections
Section 1 used for sending trading orders
First row display account number for trading.
Order status: display trading order status.
Confirm summary: display confirmation of executed orders.
Second row used to submit the trading order.
Buy/sell: choose whether to buy or sell by moving the cursor to select the action you
would like to take.
Stock: type in the stock symbol in the blank box next to “Stock”.
NVDR: in case foreign investors would like to buy NVDR stock, the small box in front
of NVDR must be marked.
Qty: insert the quantity of stocks that you would like to trade in the blank box next to
“Qty” e.g. 25,000.
Price: insert price per stock you wish to trade in the blank box next to “Price”.
ATO/ATC: if the investors would like to buy or sell the security at the open price or
close price, the box in front of this command must be marked otherwise it should be
left blank.
PIN: the pin code must be entered in the blank box next to “PIN” every time the
investors would like to submit the trading order. The display of pin in the box will be
**...*
Submit: after entering the PIN, press “Submit” in order to transmit the order
Clear: if you would like to clear all the order previously keyed in the boxes, press
“Clear”.
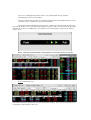
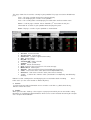
After pressing the “Submit” button, there will be a pop-up as shown below. To confirm
your order, click “Buy”.
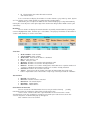
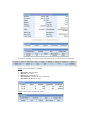
Section 2 will display the details of credit limit and cash balance. The information will be changed
every time you trade. In order to get the latest information, press “Refresh”.
Credit Limit: maximum amount that is allowed to trade for this account.
Line available: maximum amount that is currently available to trade that will
decrease if your buy order is executed and increase if your sell order is executed.
Cash Balance: amount of cash deposited with the broker.
Deal Data: details of match order will be displayed in a window after pressing “Deal
Data”.
Cancel: used to cancel the previous trading order that is not yet matched e.g. SX,MP
(can choose more than 1 order). The PIN must be entered before “Cancel” can be
transmitted.
Change: used for changing the submitted trading order that is not yet matched e.g.
SX, MP (normal stock or NVDR). The change can be done with the type of securities,
number of securities and security prices.
Refresh: used when you need the system to update the trading status information.
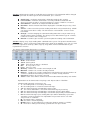
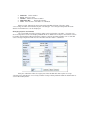
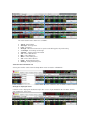
Section 3 display every single trading order submitted to the system. The picture below illustrates
5 trading orders. If there is too much trading order to be shown in the window, users can use scroll
bar on the right side or arrow up, down, Page up, Page down, home and End button on your
keyboard for assistance.
The details of information displayed are as follows:
Order: Order number
Stock: Stock symbol
Time: Time when the order is submitted
B/S:
B = buy and S = sell
Price: Price per share
Quantity: Numbers of securities to be bought or sold
Matched: Numbers of securities already matched
Balance: Numbers of securities waiting to be matched that are equal to numbers of
securities submitted subtracted by numbers of securities already matched
Canceled: Numbers of securities canceled
Status: Order status will be shown in the form of abbreviation altered by each broker.
Explanation can be found under “Help Page” and “Reject Code in “Tool Box”.
Important and frequently used statuses are
S: The trading order is received by Streaming.
SI: The trading order is sent to The Stock Exchange.
SX: The Stock Exchange acknowledges order receipt.
C: The cancel notification is sent to The Stock Exchange by streaming.
CX: The Stock Exchange acknowledges cancellation. (For the whole order)
CP: The Stock Exchange acknowledges cancellation (For partially unmatched order).
RS: The Stock Exchange rejects trading order (this will be followed by reject code
stated the reason of rejection. The explanation of reject code can be seen from
“Reject Code” in “Tool Box”.
M: The whole order is matched.
MP: The order is matched partially.
M (DX): There is an amendment of security type (between normal <-> NVDR)
W The order is waiting in Streaming system before Pre-open of SET
E Expired order (the order will not be matched
after market closes.
Users can choose to display list of orders in various format e.g. by order, by stock, by time
etc. The display can be shown in both ascending and descending orders.
Furthermore you can adjust the width of each column displaying security information by
moving the cursor to place at the right edge of the column then drag it till the width reaches your
satisfactory.
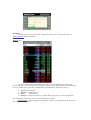
Deal Data
You can choose to display the matched orders or partially matched order by moving the
cursor to highlight that order, and then press “Deal Data”. The pop-up “Deal Data” of that order in
section 3 will show up as can be seen below;
First Row
Order number: Order number
Stock symbol: Stock symbol
Order Time: Time when the order is submitted
B/S: B = buy and S = sell
Price: Price per share
Quantity: Numbers of securities to be bought or sold
Matched: Numbers of securities already matched
Balance: Numbers of securities waiting to be matched that are equal to numbers of
securities submitted subtracted by numbers of securities already matched.
Canceled: Numbers of securities canceled.
Status: Order status will be shown in the form of abbreviation altered by each
broker. Explanation can be found under “Help Page” and “Reject Code in “Tool Box”.
Second Row
Deal No: Deal number
Deal Vol: Number of stocks matched
Deal Price: The matched price
Deal Date: Matched date
Deal Time: Matched time
Cancellation of the order
You can cancel the submitted orders that are not yet matched or only
partially
matched by mark the small box in front of that specific order, then
Click “Cancel” and insert the PIN. If you would like to cancel more than 1 order
simultaneously, mark the small boxes in front of every order you need to cancel, then click
“Cancel” only once. A confirmation pop-up will appear.
Click “Confirm Cancel” to confirm.
Changing an order
You can change submitted order by moving the cursor to highlight that order, and then
click “Change”. There is a pop-up showing the order details. You can select to change either type
of securities, security prices of number of securities.
Part 1: Display order details
Part 2: Display matched order details
Part 3: Display order amendment details
Part 1: The summary of order details will be displayed as follows
Order No: Order Number
Side: B = buy, S = sell
Account No: Account Number.
Stock: Stock symbol.
Volume: Number of stocks to be ordered.
Price: Price per stock.
Matched: Numbers of securities already matched.
Canceled: Numbers of securities already canceled.
Balanced: Numbers of securities waiting to be matched that are equal to numbers
of securities submitted subtracted by numbers of securities already matched.
Order Type: Type of order either normal or NVDR.
Trade date: Date when the order is submitted
Trade time: Time when the order is submitted
Status: Abbreviation of order status
Status Meaning: Meaning of order status
Reject Code: Reject code
Reject Reason: Reason of rejection
Entry Trader: Trader ID
Entry Time: Time when the order is sent to SET
Cancel Trader: Trader ID who cancels the order
Cancel Time: Time when the order is canceled
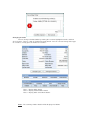
Amendment of order type
After pressing “Change Type”, there is a window popping up as shown in the picture
below. If you would like to change the order type (between Normal and NVDR), please select the
drop down menu and enter your PIN, then click “Submit”.
The details of amended orders will be shown as follows:
Two amendments details will be displayed
1. Amendment of order type will show the following information
Account Number: account number
Trustee Id: order type amendment
Time: Time when the order is amended
Change Trader: Trader ID
2. Amendment of price and number of stocks will show the following information.
Order No: Order number
Price: Price per stock
Volume: Volume of stocks to order
New Order No:
New order number
Time: Time when the new order is submitted
After pressing “Submit” the upper part of the window will show “[Change order
successfully]” and the stock will turn to your selected type. The change history field will show
details of amendment as can be displayed.
Changing of price and volume
The system will cancel the previous orders and send out the new order. Investors can
click “Change Price & Vol. The display window will be as follows the new price and volume can be
inserted in the blank box adjacent to them. However, only the unmatched order such as SX, MP
can be changed. Again the PIN must be entered before the order is submitted.
After you submit the order, the upper part of the window will show up the message
“Change price and volume successfully” and the Change History field will show the information as
seen in the below picture.
In the order sending area, the previous order that has been canceled will be displayed.
Part 2: shows deal details as follows
Deal Time: Matched time
Deal No: Deal No.
Deal Price: Matched price
Deal Volume: Number of stocks matched
Deal Amount: Matched value
Part 3: shows order amendment details
Two types of amendments will be shown, those are amendment of order type
amendment of stock price
Amendment of order type shows the following information in Change History
and
Account Number: User’s account number
Trustee Id: Changing order type
Time:
Changing Time
Change Trader (trader ID): A/O
History
Amendments of price and volume will show the following information in the Change
Order No: Order number
Price: Stock Price
Volume: Stock Volume
New Order No: New Order number
Time: New Order Time
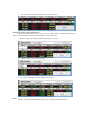
2.2 Market Watch
Market Watch is another main page of program BLS Ultra II that will display market
summary and real-time price movement. The investors can also submit a trading order through
this page. The page is divided into 3 parts;
Part 1: For other pages selections and displaying of details of market summary.
Part 2: For displaying each individual security in details.
Part 3: For order submitting and displaying the previously submitted orders.
Part 1: Pages selection.
For example, in order to open Market Watch Page, go to Real time, choose second topic.
Part 2: Securities Details. The window can be categorized into areas.
Area A: Real-time Quote
This shows volumes and prices of multiple securities. The main purpose is to facilitate the
users to monitor their stock movements. The price
comparable to the previous close price
will be displayed in different colors.
Green
means the price is increasing
means the price is declining
Red
Yellow
means the price remains unchanged
You can also use arrow up and down, Page up, Page down, Home and End button on
your keyboard to choose the stock for displaying.
The information shown for each individual stock;
Stock: The stock symbol
Sts: Status of the security
Close: Latest close price
Vol Bid: Best bid volume
Bid: Best bid price
Offer: Best offer price
Vol offer: Best offer volume
Last: Last trading price
Chg: Change in price comparable to close price on the previous day
% Chg: Percent change of the price
Volume: Trading volume occurred for this security
Area B: 3 Bids / 3 offers
This area shows information of only specific stocks. More details can be shown here than
in area A (Real-time Quote). There are two ways to select the securities to be displayed in this
area.
1. Move the cursor to select the stock you need in area A (Real-time Quote). The details
of that stock will be shown in this area.
2. Type the name of the stock in the blank box after “Quick view” in the last row of the
window, then clicks “View”
The stock details to be shown are as follows:
Stock: Stock Name
High: The highest trading price
Low: The lowest trading price
Ceiling: Daily Maximum Price
Floor: Daily Minimum Price
Close: Close Price
Avg: Average Price
Last: Last Price
Change: Difference between Last price and closing price of previous day
% Change: Percentage of Change
Value ('000): Total Trading value
Open 1/Open 2: Opening price (a.m.) / Opening price (p.m.)
Vol. Bid: 3 Best Bid volumes]
Offer.Vol: 3 Best Offer volumes
Side: Transaction from Buy or Sell
Price: Price from Transaction
Volume: Volume from Transaction
Time: Time of Transaction
The Chart button next to View button in the last row used to display the chart of trading
price and volume occurred during the day as shown below.
SET News
In order to get the news from SET, simply click “SET News”. A link to SET News at
www.set.or.th will be popping up.
Area C: Ticker
This area shows trading transactions occurred for each individual stock on the main
board. It changes every time the stock is bought or sold. The transaction will be appeared in Blue
for every trading value exceeding 1 million Baht. The information shown in this area is
Stock: Stock Symbol
Volume: Trading volumes
Price:
Trading prices
Change: Change in stock prices comparable to close prices on the previous day.
The information viewed from Ticker can be displayed in 2 modes.
Normal mode: Each trading transaction will be shown. This will be default display every
time you open the program.
Sum mode:
Trading summary will be displayed. If you would like to view the trading
transaction in sum mode, simply click the small box in front of “Sum”.
Part 3 used for order submitting and displaying the previously submitted orders. The
function is similar to Market by Price.
2.3 Stock Watch
Stock Watch displaying details of 3 best bid and best offers prices. The window can be
divided into 3 parts:
Part 1: used for page selection and for displaying market overview
Part 2: used for displaying 3 best bid and offer prices
Part 3: used for sending orders and showing details of order status.
Sector 1: used to select the displaying window.
Sector 2: shows the details of the 3 best bid and offer prices of 4 stocks simultaneously in
one page. The list of the stocks can be searched from your Favorite or input manually as can
shown down below.
Stock: Stock Symbol
Volume: Trading volumes
Bid: 3 best bid price
Offer:
3 best offer price
Open/Call: Last open price
Prior:
Previous price trading (T-1)
Last: Last price trading
Chg: Change in stock prices comparable to close prices on the previous day.
The highest trading price
High:
Low:
The lowest trading price
%Chg: Percentage of Change
Ceiling: Daily Maximum Price
Floor: Daily Minimum Price
Par: Par Price
Sector 3: used for order submitting and displaying the previously submitted orders. The
function is similar to Market by Price.
2.4
3 Bids / 3 Offers
Area B: 3 Bids / 3 offers
This area shows information of only specific stocks. More details can
be shown here
than in area A (Real-time Quote). There are two ways to select the securities to be displayed in
this area
1. Move the cursor to select the stock you need in area A (Real-time Quote). The
details of that stock will be shown in this area.
2. Type the name of the stock in the blank box after “Quick view” in the last row of
the window, then click “View”
The stock details to be shown are as follows:
Stock: Stock Name
Average: Average Price
Last: Last Price
Change: Difference between Last price and closing price of previous day
% Change: Percentage of Change
Volume: Volume from Transaction
Vol: 3 Best bid volumes
Bid: 3 Best bid prices
Offer: 3 Best offer prices
Vol: 3 Best offer volumes
Floor: Daily minimum price
Celling: Daily maximum price
Selection the information set
Select your favorite stocks from the drop down menu next to the “3Bid3Offer”.
Change of displayed Stock
6 Stocks can be displayed simultaneously in one screen. If you would like to view other stock in
your favorite list, click “Next”
If you want to go back to the previous stocks click “Previous”.
Adding stocks using Manual
You can add stocks manually using “Manual” (by select “Manual” next to 3Bid3Offer).
1. Click “Enter”, to empty the insert field
2. Move the cursor to place in the blank box
3. Type the stock name and click Enter
4.
The system will display the details of the selected stock.
Change of Stocks in your Favorite list
Stocks in Favorite will be the same as set in the “market watch”. Changing of adding any
stocks in the list will also affect the Market Watch. It can be done by
1. Click the stock name, the box will become blank as shown
3. Type the stock name, then click Enter
3. The system will display the information of that stock
Chart
An intra-day chart of the individual stock can be displayed by clicking “Chart”
Part 3
Used for sending orders and displaying order details including latest order status. Use
the same function as Market By Price.
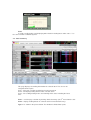
2.5 Stock Summary
This page displays the trading information of selected stock. The site can be
categorized into 3 parts
Part 1: For page selection and display of market overview
Part 2: For display trading details of the selected stocks
Part 3: For sending trading orders and showing order status including the latest
ones
Part 1: used for page selection by clicking “Stock Summary” (the 5th menu from the left”
Part 2: displays trading details of selected stocks in two alternative ways
Type 1 As shown in the picture below. The window is divided into 4 parts
Area A shows one single stock's information as follows:
Symbol: Stock name
Last Done: Last price
Chg: Difference between Last price and closing price of previous day
%Chg: Percentage change
Volume: Volume from the transaction
Value (‘000): Value from trading (in thousand)
Average: Average price
Average Buy: Average bid prices
Average Sell: Average offer prices
Day High: Daily highest price
Day Low: Daily lowest price
Closing Price: Close price
Projected Open1, Open 1, Projected Open2, Open2, Projected Close, Close
Expected open and close prices during the day
Floor: Daily minimum price
Celling: Daily maximum price
Area B shows the 3 best bid and offer prices and volume
Vol: 3 Best Bid volumes
Bid: 3 Best Bid prices (in THB)
Offer: 3 Best Offer prices (in THB)
Vol: 3 Best Bid volumes
Area C shows bid and offer prices for individual stocks in SET
Time: Executed time
Side: Trading side B for buy or S for sell
Volume: Volume from the transaction
Price: Executed Prices
Change: Difference between Last price and closing price of previous day
Area D displays trading volume of each individual stock, its industry's and SET's.
Vol Buy: Buy volume in numbers and in percentage
Vol Sell: Sell volume in numbers and in percentage
Type 2 The window puts stock information into two separate areas
Area A The display will be similar to Area A in type 1
Area B It shows trading volumes in each price range
#Executed: Actual numbers of buy orders occurred in each price
Buy Volume: Volume of stocks bought in each price
Price: Matched prices during the data
volume of stocks sold in each price
Sell Volume:
# Executed: actual numbers of sell orders occurred in
each price
Total:
Total volume occurred in each price
% Total: Percentage of trading volume occurred in each price
Ticker
Ticker This site shows current trading transaction of individual stock. It including 3 parts
Part 1: For page selection and market overview display
Part 2: For displaying of trading transaction of individual stock
Part 3: For sending orders and showing details of executed orders and the latest order
status
Part 1: Used for page selection. Choose “Ticker” (4th menu from the left).
Part 2: Displays trading transaction of each individual stock. The list of stocks appeared
in 3 columns, each contains 23 stocks. The latest transaction will be highlighted from left
to right. The trading transaction exceeding 1 million Baht will be highlighted in blue. The
example is as illustrated below.
Stock: Stock symbol
Side: Trading side B for buy or S for sell
Volume: Volume from the transaction
Price: Executed prices
Change: Difference between Last price and closing price of previous day
Ticker can be displayed in 2 modes; normal mode which shows the trading transaction
individually and sum mode which shows trading transaction in summary. The normal
mode is set as default, if you would like to change mode, simply click sum on the top part
of the display.
Part 3: Used for sending orders and shows executed order details and latest order status
(used the same function as Market By Price)
Portfolio
This page shows list of securities currently in your portfolio. This page can also be divided into 3
parts
Part 1: For page selection and market summary display
Part 2: For displaying the securities in the portfolio
Part 3: For sending orders and displaying executed orders and latest order status
Part 1: Used for page selection. Select “Portfolio” (2nd menu from the left), the
information of securities in your portfolio will be displayed in part 2.
Part 2: Displays securities in your portfolio as shown below.
Account: Account number
Account Type: Account type
Credit Line: Credit line approved for trading
A/O: Account officer
Buy-CR: Buy credit
Sell/Short CR: Short sell credit
Symbol: Stock symbol
Actual: Actual stock balance
Cost: Average cost (using First-in / First-Out concept)
Market Price: Market price
Amount: Total cost amount (Actual Vol multiplied by Avg Price)
Value: Latest value of the stock (Actual Vol multiplied Mkt Price)
Gain/Loss: Gain or loss from the stock (Value minus Amount)
% G/L: % Gain or loss from the stock (Unrealized P/L multiplied by 100 divided by
Amount)
Part 3: Used for sending orders and displaying of executed order details including
order status (use the same function as Market By Price).
latest
5. Service
Used for connect to other information sources or other useful links e.g. BSIS, BLS Liberty,
Efinance Thai or Research
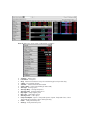
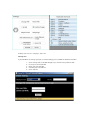
6. Setting
When you select the “Settings”, there appears a pop-up menu which you can amend the setting.
Meantime it is including Keyboard Shortcuts which can be used in Settrade Streaming for example
Ctrl+1 to open “Market Watch”.
Settings consists of 7 sub pages, those are
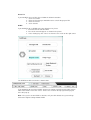
Change Pin
If you would like to change your pin (used for trading), please follow the below instructions
1.
2.
3.
4.
5.
Click Change PIN, a window will pop up as shown in the picture below
Insert your current PIN No.
Enter your new PIN No.
Confirm your new PIN No.
Click “Submit”
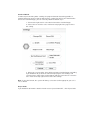
Reset Pin
If you would like to reset PIN, please follow the below instructions
1. Click “Reset PIN”
2. Enter the question you would like to be asked if forget your PIN
3. Enter the answer
4. Click “Submit”
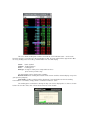
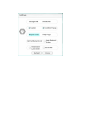
NVDR
If you would like to set NVDR to be your default menu, please
1. Select the box in front of NVDR
2. The check mark will appear as shown in the picture
3. Close Settings by click “Close” or click the cross mark on the right corner
The NVDR box will be marked as shown below.
If you would like to cancel the NVDR, go to menu Settings and take out the right mark in
front of the NVDR. Then click “Close” or the cross mark on the top right of the page to
close this pop up.
Note The system set non-NVDR as default, so if you click default, the system will go
back to the original setting without NVDR
Confirm POPUP
In order to prevent wrong order sending, the program Settrade Streaming provides a
Confirm Popup for you to review the order before sending it to SET. If you would not like
to have the Confirm Popup, you can cancel by follow the below steps:
1. Take out the right mark in select box in front of the Confirm Popup
2. Select Close or click the cross mark on the top right of the page to close
this setting.
3. When you send an order, there will be no longer Confirm Popup reminding
If you would like to get back the Confirm Popup again, click Settings and
select the box in front of the Confirm Popup and then click Close or select the
cross mark on the top right corner to close this Settings
Note If you click Default, the system will always select the Confirm popup for you as it is
set as default
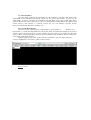
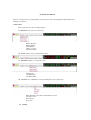
Reject Code
If you would like to know the details of order status rejected from SET, click Reject Code
Help Page
The explanation of the trading order can be seen in Help Page. After selecting Help Page,
the window will show the pop up as follows:
1. You can switch the language for display. The selection box in on the top
right corner. Click EN if you would like an English version
2. If you would like to change to Thai version, click TH
Net Settlement List
In order to see the stocks those are prohibited for Net Settlement, you can follow the
below steps:
1. Click Turnover List. The program will open a new window as shown
below.
2. To close this window, click the cross mark on the top right corner.