1
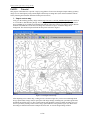
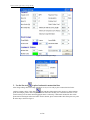
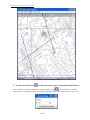
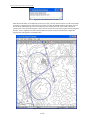
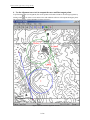
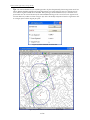
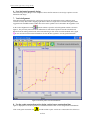
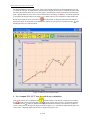
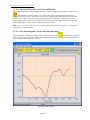
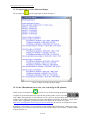
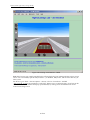
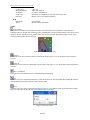
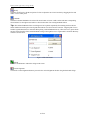
Roadway Online Application for Design (ROAD)
User’s Manual of Web-Based Roadway Geometry Design
Roadway Online Application for Design (ROAD)
http://128.101.111.90/Lab_Mod/RoadDesign.html
Version 0.2.4
October 9, 2006
By
Chen-Fu Liao
Intelligent Transportation Systems Laboratory
www.itslab.umn.edu
1 of 24
Roadway Online Application for Design (ROAD)
Introduction
There are many geometric elements involved in roadway geometry design. The key elements of roadway
alignment are the most important components of geometric design. Detailed discussions are available in the “A
policy on geometric design of highways and streets 2004” [1] published by AASHTO. Students traditionally use
pencil and ruler to conduct roadway geometry designs over contour maps. Manual calculations of stopping sight
distance, minimum turning radius, and curve alignments are required for each geometric design to ensure safety,
minimize economic and environmental impacts, and minimize construction costs (minimum land cut and fill). The
calculation and design process of roadway geometry design are often cumbersome and time consuming. This online
roadway geometry design tool was developed to assist students conducting the geometric design of roadways on
computer screen using a contour map in the background as reference. This software tool will allow students to
design the geometry of a roadway more efficiently and effectively. Furthermore, students have the option to
visualize the final roadway design in a 3D virtual reality environment.
Getting Started
System Requirements
Mozilla Firefox web browser, http://www.mozilla.com/firefox/, road design software was tested using Firefox ver.
1.5. Or, Safari Ver.2.0, http://www.apple.com/macosx/features/safari/, or later (tested on Mac OS X Ver.10.4.5)
1. System Requirements
Operating system with Java Plug-in 1.5.0_06 or later, http://java.sun.com/
2. Hardware Requirements
Pentium 133 MHz or faster with 256 MB RAM or higher
3. Additional Software Requirements
Cortona VRML Client is free for personal and non-commercial use. Cortona® VRML Client is a fast and highly
interactive Web3D viewer that is ideal for viewing 3D models on the Web. A set of optimized 3D renderers
guaranties the best visual quality on both PCs with the latest video-cards and those with more basic video card
capabilities. Cortonal VRML client (cortvrml.exe) is available for manual download and installation at:
Windows:
http://www.parallelgraphics.com/products/cortona/download/netscape/
Installation tips can be found at: http://www.parallelgraphics.com/products/cortona/download/netscape/tips/
Macintosh:
http://www.parallelgraphics.com/products/cortonamac/download
VRML Plugin: (http://cic.nist.gov/vrml/vbdetect.html)
Windows: Cosmo Player, Cortona*, Octaga*, BS Contact*, Flux, blaxxun Contact, Venues, More
Linux: FreeWRL, OpenVRML, Octaga
Macintosh: Cortona, FreeWRL, OpenVRML, Cosmo Player
Technical Support
Please contact Chen-Fu at [email protected] for any technical problem with the ROAD software. Please feel free to
comment and report any error at http://128.101.111.90/forum/index.php
Firefox is a product of Mozilla Corporation, http://www.mozilla.com/
Java is developed by Sun Microsystems, http://java.sun.com/
Cortona VRML client is a product of ParallelGraphics
VRML (Virtual Reality Modeling Language) http://www.web3d.org/
Safari is a product of Apple Computer, Inc. http://www.apple.com/
2 of 24
Roadway Online Application for Design (ROAD)
PART I
Tutorial
This purpose of this tutorial is to provide a step by step guidance for new users through a simple roadway geometry
design of a two-lane highway using scanned digital contour map as background. (Note: Please install the software
first by following the instruction mentioned in the previous section.)
1. Import contour map
First, go to the roadway geometry design website, http://128.101.111.90/Lab_Mod/RoadDesign.html, and click
on “Click Here to Start Roadway Design” button to begin with horizontal geometry design. A sample contour
map, Lab5Map.jpg, is available for download at the bottom of the above website. Use Import Contour function
under the File menu bar to locate the saved image file, and click on “Open” to load the image file as
background. The contour map should look like the picture as shown in Figure 1.
Figure 1 Load digital contour map
After importing a new contour map, a setting screen, as shown in Figure 2(a), can be accessed through Road
Design option under Settings menu to specify the road design settings, including unit, speed limit, grade limit,
maximum cut and fill, and so on. The scanned contour map parameters (image resolution and map scale) can
also be specified by clicking on the Contour Image option under the Settings menu, Figure 2(b). Please leave
the settings as default for the tutorial example and click “OK” to close the design settings window.
3 of 24
Roadway Online Application for Design (ROAD)
Figure 2(a) Road design settings
Figure 2(b) Contour Image settings
2. Use the line tool
to place horizontal construction lines
After design settings and contour map parameters are set, we are ready to place construction line for the
roadway geometry design. Click on the
icon from the toolbar and move the mouse to a desired starting
point (for example, point A on the map). Click on the left mouse and drag it to a desired end location. A line
(linear roadway) will be drawn when dragging the mouse on the map. A horizontal construction line will be
plotted when releasing the left mouse button. For this tutorial, please construct three lines from point A to point
B on the map as shown in Figure 3.
4 of 24
Roadway Online Application for Design (ROAD)
Figure 3 Construct linear horizontal roadways
3. Use the curve/circle tool
to locate the curve where 2 construction lines intersect
Next, use the curve tool for horizontal curve design by clicking on the
icon fro the toolbar. A window
allowing for curve radius input will pop up around the upper right corner of the screen as shown in Figure 4(a).
Figure 4(a) Curve setting input
5 of 24
Roadway Online Application for Design (ROAD)
Figure 4(b) Check minimum curve radius
Enter the desired radius, for example 600, of the curve before you click on the left mouse over the contour map.
A message, as shown in Figure 4(b) will pop up if it does not meet the minimum radius requirement. Click on
the left mouse and drag the curve/circle to a relatively close location where the curve will be constructed.
Construct two curves as shown in Figure 5. Note: The curve/circle does not need to be placed exactly tangent to
the lines. A curve alignment tool will be discussed and used in next section to automatically compute the
tangent points and align the curve with the lines.
Figure 5 Construct horizontal curves/circles
6 of 24
Roadway Online Application for Design (ROAD)
4. Use the alignment curve tool to compute the curve and line tangent points
To perform horizontal curve alignment, first use the pointer tool from the toolbar to select design segments by
clicking on the
icon. Select a circle and two lines with which the software will compute the tangent points.
The selected elements will be highlighted as shown in Figure 6.
Figure 6 Select horizontal alignment elements
7 of 24
Roadway Online Application for Design (ROAD)
Secondly, use the “align curve” tool under the tool menu after 2 lines and 1 circle are selected/highlighted.
Tangent points will then be calculated and selected curve will be translated to conjunct the tangent points as
shown in Figure 7. Select the modify end point tool and use right mouse click on a tangent point to delete
tangent pair point. Use the “unselect all” option from the edit menu to unselect all elements or click on the
selected item again to unselect the item. And follow the same steps as previously mentioned to complete the 2nd
curve tangent points.
Figure 7 Horizontal curve alignment
5. Place stations/landmarks and enter elevation data
After finishing the horizontal curve alignment, the stations/landmarks on the horizontal design can thereafter be
placed by using the landmark tool. Currently, the digital contour map consists of no digital elevation data. Users
have to manually place stations/landmarks and elevation data on existing tangent points, start and end points,
and every contour line that intersects with the road geometry design. Use the landmark tool
to locate a
station from start (A) to end (B) point and enter the elevation of the station sequentially. (Warning: if
stations/landmarks are not placed sequentially, the final design and road length will be incorrect.) After placing
all stations and entering corresponding elevation info, the road geometry design will look similar to Figure 8(b)
with stations/landmarks.
8 of 24
Roadway Online Application for Design (ROAD)
Tips: The stations/landmarks of the road design need to be placed sequentially from starting station to the last
station. Stations should be placed on all points that contour curve and road curve intersect. Tangent point of
curve and line segment should also be included. When placing a station/landmark near by a line and a curve,
please make sure the selected location of the station/landmark belongs to the correct line/curve segment in the
elevation data entry window as shown in Figure 8(a). Select the modify end point tool and use right mouse click
on a tangent point to delete tangent pair point.
Figure 8(a) Enter landmark elevation data
Figure 8(b) Place stations or landmarks with elevation data
9 of 24
Roadway Online Application for Design (ROAD)
6. Save horizontal geometric design
The horizontal geometry design is now completed. Choose the file menu and “save design” option to save the
horizontal road design.
7. Vertical alignment
After the horizontal geometric design, vertical curve design can be conducted to ensure continuous grade
variation for safety and comfort. Stopping sight distance and curve length will be calculated using the formula
suggested in the AASHTO manual. Further discussion on the equations used is included in the Appendix. Click
on the vertical alignment icon tool
from the toolbar to open the vertical alignment window as shown in
Figure 9. The previously entered elevation information of each station is plotted versus the calculated road
distance from the starting station based on the horizontal design. Click on the elevation landmark on the graph
to view its location and elevation information. Click on the line segment to view the grade information.
Figure 9 Elevation profile of stations/landmarks
8. Use the grade construction tool to design vertical curve construction lines
Figure 9 display the raw elevation profile based on the horizontal location of each designed stations/landmarks.
Click on the grade construction icon
from the toolbar to place vertical curve construction lines. Please use
10 of 24
Roadway Online Application for Design (ROAD)
first station/landmark as the beginning of the vertical curve design and use the last station/landmark as the end
of vertical curve design. To construct lines, click and release the left mouse to place a construction point. A blue
line will be drawn as the mouse moves over the graph. Construction line will be placed when next construction
point is placed. Note: The color of the vertical construction line will change to RED if it exceeds the grade limit
as specified in the design setting screen (Figure 2). To end the vertical curve construction, simply double click
the left mouse button or use the end icon tool
from the toolbar. A designed construction line example is
displayed in Figure 10. PVI points can be modified by clicking on a PVI (point of vertical intersection, ) point
and drag the mouse to a desired location.
Figure 10 Vertical curve construction lines
9. Use “compute PVC, PVT” icon for vertical curve calculation
Click on the vertical curve computation icon
from the toolbar to calculate the vertical point of curvature
(PVC, ) and the vertical point of tangency (PVT, ) of each vertical curve. The PVC, PVT and PVI (point of
vertical intersection, ) points are identified on the graph with different marker. If PVT and PVC of adjacent
curves overlap, an error message will display as shown in Figure 11(a). Clear current design and redesign a new
vertical curve. Computed sample vertical curve is displayed in Figure 11(b).
11 of 24
Roadway Online Application for Design (ROAD)
Figure 11(a) Vertical curves overlap
Figure 11(b) Vertical curve design
10. Use “Edit Curve Length” icon for vertical curve modification
To modify the individual vertical curve length, click on the toolbar icon,
, or select the “Edit Curve
Length” option under ‘Tool” file menu. Vertical curve edit screen will be displayed as shown in Figure 11(c).
Select desired curve, modify its length and click “Save” button to update the curve length. Use “Check Min
Len” button to compute minimum vertical curve length based on the formula recommended by AASHTO green
book as shown in Appendix. Modified vertical curve will be updated on the screen as soon as mouse was placed
over the vertical curve design.
12 of 24
Roadway Online Application for Design (ROAD)
Figure 11(c) Edit Vertical Curve Length
Figure 12(a) Cut and fill profile
13 of 24
Roadway Online Application for Design (ROAD)
11. Use “View Cut/Fill Profile” icon for cut and fill plot
The cut and fill profile based on the design vertical curve can also be displayed by clicking on the fill/cut icon,
from the toolbar as shown in Figure 12(a). The zero line in the cut and fill profile represents the
proposed vertical curve design. Lines above zero means cut (elevation higher than design vertical curve) and
lines below zero requires fill (elevation lower than designed curve). Maximum cut and fill specified in the
design settings screen (Figure 2) are also plotted for references. Click on the “Data” button at the upper right
corner of the graph to view the fill and cut data and save it to a text file.
Tips: Clear vertical curves (edit-clear curves) before modifying PVI points. Use left mouse to click and drag
the PVI point to a desired location.
12. Use “View Mass Diagram” icon for mass diagram display
The mass diagram is available by clicking on the “view mass diagram” icon,
from the toolbar as shown in
Figure 12(b). Users can click on the “Data” button at the upper right corner of the mass diagram display to view
the mass diagram data and save it to a text file.
Figure 12(b) Mass diagram
14 of 24
Roadway Online Application for Design (ROAD)
13. Use report icon to review final road design
Use the report icon
to create design report as shown in Figure 13.
Figure 13 Report of roadway geometry design
14. Use the 3D animation icon to view your road design in 3D, optional
Finally, use the 3D animation icon
to create 3D view of the road design as shown in Figure 14. Several
viewpoints are generated automatically in the 3D road geometry model. Use the view button
in the VRML client application to select different view of a vehicle is driving at design speed. If the animation
toolbars does not display automatically, right click on the animation and choose “Preferences”. Check “Show
toolbars” in the “Appearance” group under “General” tab. Please refer to Cortona user’s guide
(http://www.parallelgraphics.com/developer/products/cortona/help/) for more info on navigation in Cortona.
It might take a few minutes to create 3D models on Mac machine using Safari browser. For Mac users with
Safari browser, press “control” key and click on the 3D scene then choose “show toolbars” to display toolbars
as shown in Figure 14.
15 of 24
Roadway Online Application for Design (ROAD)
Figure 14 Road design 3D animation in VRML
Note: Some browsers (for example, Mozilla Firfox) will not display the local animation file due to Java security
reason. User can manually open the html file under c:\ for Windows, HD for Mac, and user home directory for
Linux system.
For IE users, go to Tools -> Internet Options ->Security, Click on “Trusted sites” and add
“http://128.101.111.90 to the trusted sites. Uncheck the “Require server verification (https:) for all sites in this
zone. The 3D animation window should pop up automatically by clicking on the 3D animation icon on the
vertical curve design screen.
16 of 24
Roadway Online Application for Design (ROAD)
PART II
Roadway Geometry Design Tools
1. Horizontal Geometry Design
Menu bar
File menu
Open Design:
Save Design:
Close Design:
Import Contour:
Print:
Exit:
Edit menu
Undo:
Redo:
Delete:
Clear Landmarks:
Clear All:
Unselect All:
View menu
Reset:
Zoom in:
Zoom out:
Station Landmarks:
Open existing design file from disk drive.
Save current design to a disk file.
Close current design and clear background contour image.
Load contour image file
Send current design to a printer
Exit and close application
Undo last line/curve segment or landmark design point
Redo last line/curve segment or landmark design point
Select line/curve segment using pointer tool and choose file-delete to delete
selected line or curve.
Clear all horizontal station landmarks
Clear all horizontal road design and associated landmarks
Unselect selected line/curve segments
Reset background image scale to 1:1
Zoom in the contour image scale by 0.1
Zoom out the contour image scale by 0.1
View designed landmark/station elevation data
Figure 15 View landmark data
Station Landmarks Menu bar
File menu
Save Data:
Print:
Close:
Save landmark data (*.txt) to a disk file
Send landmark data to a printer
Close view station landmark screen
Settings menu
Road Design:
Contour Image:
Specify road design setting parameters
Enter contour image resolution and scale
Tool menu
Create Line:
Line tool
17 of 24
Roadway Online Application for Design (ROAD)
Create Curve:
Modify End Point:
Set Station:
Align Curve:
Properties:
Help
Instructions:
About:
Curve tool
Adjust end point tool
Set station / landmark tool
Horizontal curve alignment by selecting 2 lines and 1 curve
Display line or curve segment properties
User’s manual
ROAD software information
Toolbar
Arrow pointer
Choose the arrow pointer tool and left mouse click to select line and/or circle segments for horizontal curve
alignment. Color of selected item will change to the complimentary color (The complementary colors are the colors
which are directly opposite from one another on the color wheel as shown in the following figure). Click on the
selected segment again to unselect the item.
Figure 16 Complimentary color ring
Zoom in
Click on the zoom in icon from the toolbar to increase the zoom scale by 0.1 or use the mouse wheel forward to
zoom in.
Zoom out
Click on the zoom out icon from the toolbar to decrease the zoom scale by 0.1 or use the mouse wheel backward to
zoom out.
Move / Translation
Choose the move/translation tool to move the background contour image.
Line
Select the line tool to construct horizontal lines. Click on left mouse to start construction line and drag the mouse to
an end point and release mouse button to end construction line
Curve
Select the curve/circle tool to construct horizontal curve lines. A curve radius window will be displayed for radius
input. Use left mouse and drag the curve to a desired location on the map.
Figure 17 Edit curve radius
18 of 24
Roadway Online Application for Design (ROAD)
Modify
Select the modify tool to edit the end points of a line or adjust the curve/circle location by dragging the line end
marks or curve center point.
Landmark
Select the horizontal landmark tool and use left mouse button to locate or add a station and enter corresponding
elevation data. Use the right mouse button to edit elevation data of an existing landmark/station.
Tips: The stations/landmarks of the road design need to be placed sequentially from starting station to the last
station. Stations should be placed on all points that contour curve and road curve intersect. Tangent point of curve
and line segment should also be included. When placing a station/landmark near by a line and a curve, please make
sure the selected location of the station/landmark belongs to the right line/curve segment in the elevation data entry
window as shown below.
Figure 18 Edit station data
Refresh
Click on refresh button to redraw the design on the screen.
Vertical alignment
Click on the vertical alignment button to proceed to the vertical alignment window using the horizontal design.
19 of 24
Roadway Online Application for Design (ROAD)
2. Vertical Curve Design
Use left mouse to click on the elevation landmark on the graph to view its location and elevation information. Click
on the line segment to view the grade information.
Menu bar
File menu
Load Vertical Curve:
Save Vertical Curve:
Print:
Close:
Load existing vertical curve design
Save current vertical curve design to a disk file
Send current vertical curve design to a printer
Close vertical curve design screen
Edit menu
Undo:
Redo:
Clear Design:
Clear Curves:
Undo last vertical curve design
Redo last vertical curve design
Clear all vertical curves and construction lines
Remove vertical curves only
View menu
Elevation Profile:
Fill-Cut Profile:
Mass Diagram:
Stations:
3D Animation:
View vertical curve design profile
View cut and fill profile
View mass diagram
View station data
Generate 3D animation view
Tool menu
Grade Construction ON:
Grade Construction OFF:
Align Vertical Curves:
Edit Curve Length:
Turn on vertical curve construction tool
Turn off vertical curve construction tool
Perform vertical curve alignment
Edit vertical curve length
Help
Instructions:
About:
Cortona VRML Client:
User’s manual
software information
Info about VRML client
Tool Icon
Start Vertical Curve Construction
Select the construction tool to place vertical curve construction lines. Click on the first station as the start point and
the last station as the ending point.
Stop Vertical Curve Construction
Use the stop construction button or double-click on left mouse to end vertical curve construction line design.
Vertical Curve Calculation
Click on vertical curve calculation icon to calculate vertical point of curvature (PVC), vertical point of tangency
(PVT), vertical point of intersection (PVI), and the curve parabolic function based on equal tangency design.
Edit Vertical Curve Length
Use the edit vertical curve length icon to modify the vertical curve length.
View Elevation Profile
20 of 24
Roadway Online Application for Design (ROAD)
Click on elevation profile button to view elevation profile and vertical curve design.
View Fill and Cut Profile
Click on fill and cut profile button to view the fill and cut curve based on the vertical curve design. Use
to view fill/cut data.
button
View Mass Diagram
Click on the mass diagram button from the toolbar to display the mass diagram along the roadway design. Use
button to view mass diagram data.
Create Report
Click on the report button to show read geometric design report including horizontal, vertical curve information and
cut and fill volume information.
Menu bar
File menu
Save Report:
Print:
Close:
Save design report (*.txt) to a disk file
Send report to a printer
Close report screen
3D Animation
Click on the 3D animation button to generate a 3D model of the road design. Animation of a vehicle driving at
design speed and several view points are available to examine the road design in 3D VRML model. During the
3D animation, the vehicle location (X, Y and Elevation) is generated from the 3D scene and plotted over the
horizontal geometry design window and the vertical curve design screen in real-time.
References:
[1]
[2]
[3]
“A policy on geometric design of highways and streets” Chapter 3 Design elements, 2004, AASHTO
Mannering F.L., Kilareski W.P., and Washburn S. S, “Principles of Highway Engineering and Traffic
Analysis”, 3rd edition, John Wiley & Sons, Inc. 2005
Ames A.L., Nadeau D.R., and Moreland J.L., “VRML 2.0 Source Book”, 2nd edition, John Wiley & Sons,
Inc. 1997
21 of 24
Roadway Online Application for Design (ROAD)
APPENDIX:
The following equations are used in the roadway geometry design software.
Stopping Sight Distance (SSD): is calculated using the formula stated in reference [2], pp. 57
SSD =
V12
+ V1 × t r
a
2 g ( ± G)
g
Where,
SSD is the stopping sight distance in ft (m)
V1 is the initial vehicle speed in ft/s (m/s)
g is the gravitational constant, 32.3 ft/s/s (9.807 m/s/s)
a is the deceleration rate in ft/s/s (m/s/s)
G is the roadway grade (+ for uphill, - for downhill) in percentage/100, and
t r is the perception/reaction time in second.
Crest Vertical Curve Design: calculated using the formula stated in reference [2], pp. 60
For SSD < L
US Customary
Lm =
For SSD > L
A × SSD
2158
Metric
2
Lm =
A × SSD 2
658
US Customary
Lm = 2 × SSD −
Metric
2158
A
Lm = 2 × SSD −
658
A
Where,
SSD = stopping sight distance in ft (m),
Lm = minimum length of vertical curve in ft (m), and
A = absolute value of the differences in grades ( G1 − G 2 ) expressed as a percentage.
Sag Vertical Curve Design: calculated using the formula stated in reference [2], pp. 64
For SSD < L
Lm =
For SSD > L
US Customary
Metric
A × SSD
400 + 3.5 × SSD
Lm =
US Customary
Metric
2
Lm = 2 × SSD −
400 + 3.5 × SSD
A
A × SSD 2
120 + 3.5 × SSD
Lm = 2 × SSD −
120 + 3.5 × SSD
A
Where,
SSD = stopping sight distance in ft (m),
Lm = minimum length of vertical curve in ft (m), and
A = absolute value of the differences in grades ( G1 − G 2 ) expressed as a percentage.
22 of 24
Roadway Online Application for Design (ROAD)
Horizontal Curve Radius:
Rv =
V2
g( fs +
e
)
100
Where,
Rv = radius defined to the vehicle’s travel path in ft (m),
f s = coefficient of side friction,
V = vehicle speed in ft/s (m/s),
g is the gravitational constant, 32.3 ft/s/s (9.807 m/s/s), and
e = number of vertical ft (m) of rise per 100 ft (m) of horizontal distance.
Vertical Curve - PVC, PVC & PVI calculation:
The general form of the parabolic equation, as applied to vertical curves, is
y = ax 2 + bx + c
G − G1
a= 2
2L
b = G1
Where,
y = roadway elevation at distance x from the beginning of the vertical curve in ft (m)
x = distance from the beginning of the vertical curve in stations or ft (m)
c = elevation of the point of vertical curvature (PVC) in ft (m),
G1 = initial roadway grade in percent, it is as referred as the initial tangent grade
G 2 = final roadway (tangent) grade in percent.
23 of 24
Roadway Online Application for Design (ROAD)
Revision Log:
Version 0.1: Mar. 14, 2006
* Release Windows .NET version.
Version 0.2: Apr. 04, 2006
* Release web-based version.
* Fix metric unit display error in [Design Settings] screen.
* Fix 3D animation error when choosing metric unit.
* Fix vehicle speed to reflect design speed in 3D animation.
* Fix horizontal curve setting scaling factor error when updating image
resolution and map scale.
* Add [edit - clear curves] and allow PVI modification in vertical curve
design.
* Add [file - save report] in vertical curve design for saving report to
local disk drive.
Version 0.2.1: Apr. 21, 2006
* Add [file - delete] function in horizontal design, 4/21/06
Version 0.2.2: May 1, 2006
* Update contour image resolution & scale with corresponding unit
selection
* Update horizontal design curve radius & elevation data with
corresponding unit selection
* Include unit info while saving vertical curve file
* Automatically convert vertical curve data to corresponding unit
selected
Version 0.2.3: July 1, 2006
* Add mass diagram view feature in vertical curve design
Version 0.2.4: Oct. 10, 2006
* Add min grade input
* Change image scale and map scale from integer to float
* Allow users to modify vertical curve length
24 of 24