1
Catchment Manual
Lei Gong Shan
(LGS) monitoring
site
Guizhou province
IMPACTS project
Integrated Monitoring Program on Acidification of
Chinese Terrestrial Systems
R. D. Vogt1, T. Mortensen2, J. Mulder3,
S. Solberg4 and W. Aas5
1
Department of Chemistry, University of Oslo, Norway
Norwegian Institute of Water research, Oslo
3
Norwegian Agricultural University, Aas
4
Norwegian Institute of Forest research, Aas
5
Norwegian Institute of Air research, Kjeller
2
03/2001
IMPACTS Field manual for LGS
INDEX
1.
INTRODUCTION....................................................................................................................................................................3
2.
INSTRUMENTATION ...........................................................................................................................................................4
2.1 BULK PRECIPITATION COLLECTOR ..............................................................................................................................................4
2.2 WET ONLY PRECIPITATION COLLECTOR .....................................................................................................................................4
2.3 OZONE .............................................................................................................................................................................................4
2.4 WEATHER STATION ........................................................................................................................................................................5
2.5 SEQUENTIAL NO2 SAMPLER (NILU SS2000) ...............................................................................................................................5
2.6 FILTERPACK SAMPLER (NILU-EK)..............................................................................................................................................8
2.7 THROUGHFALL COLLECTORS .................................................................................................................................................... 12
2.8 LYSIMETERS ................................................................................................................................................................................ 13
2.9 SOIL TEMPERATURE SENSOR ...................................................................................................................................................... 13
2.10 SOIL TENSIOMETER ................................................................................................................................................................... 14
2.11 LIMNIGRAPH .............................................................................................................................................................................. 14
2.12 TEMPERATURE SENSORS .......................................................................................................................................................... 15
2.13 MACRO-, CORE- AND MESO PLOT AND TREE MARKING ......................................................................................................... 15
2.14 LITTERFALL COLLECTOR ......................................................................................................................................................... 15
2.15 NITROGEN MINERALIZATION TUBES ....................................................................................................................................... 15
2.16 INSTRUMENT LOCATION ........................................................................................................................................................... 16
3.
PROCEDURES ..................................................................................................................................................................... 19
3.1 PRECIPITATION ........................................................................................................................................................................... 19
3.1.1
In the field............................................................................................................................................................... 19
3.1.2
In the field laboratory ............................................................................................................................................. 19
3.2 CHANGING OF FILTERPACK........................................................................................................................................................ 20
3.3 SEQUENTIAL NO2 SAMPLER ....................................................................................................................................................... 20
Continue noting on the back side of the Daily air field log sheet from section 3.2............................................................... 20
3.4.1
In the field............................................................................................................................................................... 21
3.4.2
In the laboratory ..................................................................................................................................................... 22
3.5 PERCOLATION LYSIMETERS ....................................................................................................................................................... 22
3.5.1
In the field............................................................................................................................................................... 22
3.5.2
In the laboratory ..................................................................................................................................................... 23
3.6 SUCTION LYSIMETERS................................................................................................................................................................. 23
3.6.1
In the field............................................................................................................................................................... 23
3.6.2
In the laboratory ..................................................................................................................................................... 23
3.7 SOIL LYSIMETER PROBLEMS AND REMEDIES ............................................................................................................................ 24
3.7.1
The lysimeter looses its pressure without sampling water. ................................................................................... 24
3.7.2
The lysimeter does not sample any water but holds its suction............................................................................. 24
3.8 SURFACE WATER ......................................................................................................................................................................... 25
3.8.1
In the field............................................................................................................................................................... 25
3.8.2
In the laboratory ..................................................................................................................................................... 25
3.9 LIMNIGRAPH ................................................................................................................................................................................ 25
3.9.1
Maintenance required for the Isco 4120................................................................................................................. 25
3.9.2
Retrieving data from the Isco 4120........................................................................................................................ 26
3.9.3
Calibrate the Isco 4120........................................................................................................................................... 27
3.9.4
Editing Data............................................................................................................................................................ 27
3.10 TEMPERATURE .......................................................................................................................................................................... 28
3.10.1
In the field ......................................................................................................................................................... 28
3.11 LITTERFALL............................................................................................................................................................................... 28
3.11.1
In the field ......................................................................................................................................................... 28
3.11.2
In the laboratory................................................................................................................................................ 28
3.12 MEASUREMENT OF SOIL TEMPERATURE AND SOIL WATER POTENTIAL ............................................................................... 29
3.13 MEASUREMENT OF NITROGEN MINERALIZATION .................................................................................................................. 29
3.12.1
In the field ......................................................................................................................................................... 30
3.12.2
In the laboratory................................................................................................................................................ 30
3.14 MACRO-, CORE- AND MESO PLOT AND TREE MARKING ......................................................................................................... 30
4.
LOGGING BOOK - HANDLING OF DATA ................................................................................................................... 31
p.2
IMPACTS Field manual for LGS
1.
INTRODUCTION
One important aspect of intensive monitoring is to follow the changes in water
chemistry as it passes through the various compartments of the watershed. In order to
achieve this the water must be sampled on a routine basis from a set of stations within
the catchment.
At the Lei Gong Shan (LGS) monitoring site the following sampling equipment are
installed:
1 weather station for recording the main meteorological parameters
1 bulk precipitation collector and 1 wet only precipitation collector
1 three-stage filterpack system for sampling main air components (i.e. SO2, NO3- +
HNO3, NH4+ + NH3)
1 sequential air sampler for NO2 sampling utilising the iodide method
1 passive ozone sampler
16 forest canopy throughfall collectors and 15 ground vegetation throughfall
collectors
3 percolation lysimeters and 16 suction lysimeters
16 litterfall collectors
16 soil temperature sensors and 16 soil moisture sensors, and
48 nitrogen mineralization tubes
1 V-notch weir
The weather station and precipitation collectors are set up just outside the watershed.
Most equipment for measuring throughfall, litterfall and soil water is placed in four
macro-plots, i.e. well defined 10m x 10m squares in the catchment. These four plots
are called intensive macro-plots. Each of the four intensive macro-plots have 4
litterfall samplers, 4 forest canopy throughfall samplers and 3 ground vegetation
throughfall samplers. In addition, there are 4-5 soil water lysimeters, 12 nitrogen
mineralization tubes, 4 tensiometers and 4 soil temperature sensors. The lysimeters
are soil water sampling devices of two designs (for details see below). The
tensiometers and temperature sensors are situated at similar depth as the soil
lysimeters. At all intensive macro-plots nitrogen mineralisation rates will be studied.
Soil water-only plots, having lysimeters and ground vegetation throughfall collectors
only, are installed at 1 additional place, together spanning the variation in soil types
found within the catchment. All lysimeters are installed at different soil depths,
according to genetic horizons.
p.3
IMPACTS Field manual for LGS
2.
INSTRUMENTATION
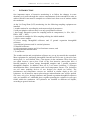
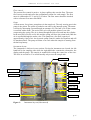
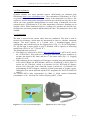
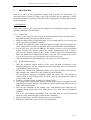
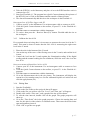
2.1 Bulk precipitation collector
The bulk precipitation collector (Figure 1) is delivered by NILU Products, Norway.
(http://www.nilu.no/products/sampler/sampler.html. The collector consists of a
precipitation collector, steel ring, 2.5 litre bottle, screw cap, bug sieve, O-ring, basket
and ground spike. The material used for the collectors is high-density polyethylene
and the mounting stand is made of stainless steel, and the height above ground is
adjustable between 1.7m to 2.6m. Diameter of collecting surface is 200mm; hence, 1
litre rainwater is equivalent to 31.85mm precipitation.
2.2 Wet only precipitation collector
The wet only collector (Figure 1) is from the Department of Meteorology at
Stockholm University, MISU, Sweden. It consists of a precipitation collector (5L
bottle), a lid and a funnel. The lid is opened when the sensor is activated by water. A
heating system dries the sensor when it stops raining; hence, the lid closes again. The
collector is driven by a solar panel. If the battery has been emptied and recharged a
knob inside the storage box needs to be pressed to get the sampler working again. The
sensor needs to be cleaned now and then with a tissue wetted with alcohol. 1 litre
rainwater is equivalent to 26mm precipitation; hence, the diameter of the collecting
surface is approximately 221mm.
Figure 1. Bulk and wet only precipitation collectors
2.3 Ozone
The diffuse sampler for ozone is from Passam, Switzerland
(http://www.passam.ch/Ozone.htm). They are bought ready impregnated from their
office in Beijing where the samplers are also sent after exposure for analyses. The
sampler is mounted vertically and the lower stopper is removed at the beginning of
the sampling. The plug is replaced at the end of sampling. Sampling period is limited
to one week. The tubes are placed within a shelter (made by Passam) to protect from
light and strong winds.
p.4
IMPACTS Field manual for LGS
2.4 Weather station
It records wind speed, wind direction, temperature and relative humidity.
The data logger records averages for every 5 minutes; however only averages of half
an hour should be reported to CRAES.
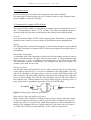
2.5 Sequential NO2 sampler (NILU SS2000)
The sequential NO2 sampler is equipped for 8 samplers and the sampling flow is 0.5 l
min-1 (corresponding to about 0.7 m3 in 24h). The airflow through the sampler is
measured with a dry gas meter in line between the solenoid valves and the pump.
Air inlet
An inverted funnel made of PTFE teflon, polypropylene, borosilicate or polyethylene
should be used in order to prevent entrance of precipitation at the sampling point.
Tubing
The sampling tube connection between the air inlet and the absorption system should
be as short as possible, and made of PTFE teflon, polypropylene, borosilicate glass or
polyethylene.
Filterholder with prefilter
A filterholder with a filter should be used in front of the absorption system in order to
remove particulate matter. The filter must be inert to NO2. A teflon membrane filter
with a pore size 1–2 µm or a Whatman 40 cellulose filter or equivalent may be used.
The filterholder and the connections to the sampling line must be air-tight. The
prefilter can be used for one week.
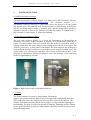
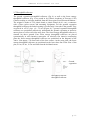
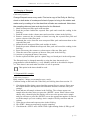
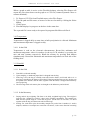
Absorption system
A 4 mm thick sintered glass filter 25 mm i.d. with a porosity of 40–60 µm enclosed in
a glass bulb as shown in Fig. 2 is used as a substrate for the impregnation. The NO2
gas will be absorbed on the glass sinters, which are treated with sodium iodide and
other chemicals. The glass bulbs should be connected to the sampling line using short
pieces of silicon tubing. Note that the sinter should be nearest to the tube leading to
the solenoid valve. During transport the silicon tubing must be closed by pieces of
glass, plastic rods or appropriate caps made of PP, PE or PTFE teflon.
To manifold
To solenoid valve
Figure 2. Sintered glass filter in a glass bulb
Measurement range and sampling efficiency
With a sample time of 24 hours, a sample volume of 0,7m3 and an extraction volume
of 4 ml you can detect between 0,1 and 10 µg of NO2/Nm3 in ambient air. Exposed
samples are stable for several weeks, which allows transfer to a remote laboratory for
analysis. The sampling efficiency is greater than 98 % with a flow rate of 0,5 lpm at
15 % RH. The efficiency is better than 98 % at 60 % RH even up to 4 lpm.
p.5
IMPACTS Field manual for LGS
Flow control.
The present flow control is passive. A glass capillary tube sets the flow. The mass
flow sensor records and stores the accumulated volume for each sample. The flow
meter is calibrated at 25 °C and 1013,25 mbar. The flow meter should be checked
with a reference flow meter like BIOS.
Pump.
A linear motor, free piston, pump draws in the sample air. The only moving part in the
pump is the piston. The piston is pushed to one side by the internal spring. The motor
is driven by alternating current through an armature coil. The half cycle of the current
is rectified with a diode. The active half cycle will push the piston to one side
compressing the spring. The air is drawn through the inlet valve and into the cylinder.
In the next half cycle the coil is idle and the spring will force the piston back while the
air is expelled through the outlet valve. This pump has a free flow capacity of
approximately 6 lpm of air. An electronic pump control is under development and will
be introduced later. The pump will then even work when the sampler is running from
the back-up battery
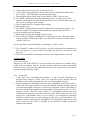
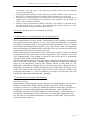
Instrument layout.
The instrument is laid out in two sections. Facing the instrument on a bench, the left
hand half is the sampling side while the right hand side contains the electronics, the
display and the pump. The sample air manifold lies along the centre line of the case.
The lid is in two halves. You would usually only access the sample side.
Memory module
Mains filter
Sample air manifold
PLC
Glass sinter filter
24 V DC Power supply
Pump relay
Solenoid valve unit
Linear pump
Solenoid valve unit
Mass flow meter
Figure 3:
Display unit
Instrument lay-out (lid removed)
p.6
IMPACTS Field manual for LGS
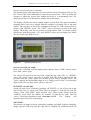
Display and operator panel commands.
The operator panel with display has its own real time clock with battery back up. The
PLC will use this clock rather than its own to keep track of time. This is to enable the
operator to adjust the system time without the need of a programming tool. The
display has 4 lines of 20 characters to display the system status.
The display will show the active sample number, present flow, time and accumulated
sampling time for the active sample when the sampler is operating. This is the main
display. The operator can check the accumulated volumes for each exposed filter by
means of the <RIGHT> arrow. The “LEFT” arrow will bring you back to the main
display. The display will also revert back to main window after 15 seconds without
interference from the operator. “UP” and “DOWN” arrows let you display text, which
may lie outside your field of view.
Figure 4:
Operator panel lay out.
SET correct DATE and TIME :
Push <enter> and hold until the display below appears. Select “TIM” with the arrow
keys. Push <enter> again.
The cursor will appear on the day field. Adjust the day with <UP> or <DOWN>
arrow. Hit <enter> cursor will move to month field. The field is adjusted like the
previous field. Hit <enter> again. You advance to next field by pushing <enter>. Hit
<enter> again if the field should remain as it is. Finally you hit “clear” to exit the date
adjust mode. The new date will be effective after exit.
SET STRT, set start time
which will recur every 24 hours by pushing <SET STRT> i.e. the #5 key pad on the
panel. Push <ins> i.e. #0 key pad. Enter hours for instance 07 with the key pads. Hit
<enter>. Push <SET STRT> again and then <ins>. Move to the minutes with the
<RIGHT> arrow. Enter the minutes for instance 15 with the key pads. Then hit
<enter>. The display should now read Start time: 07:15.
The
display
will
automatically revert to the main display.
NON STOP:
This button will toggle between continuous sampling and single sequence sampling.
Single sequence will stop after the eight filter is sampled. In continuous mode the
p.7
IMPACTS Field manual for LGS
sampler will retain pertinent data for the active filter when you temporarily stop the
sampling to change filters. You simply push the <CONT> button to resume sampling
on the active filter when the filters are changed. Selected mode will show up as
continuous with the green LED lit and single sequence when the LED is off.
STRT:
Starts the sampling. This button toggles between start and stop. So when you want to
stop sampling for some reason like changing filters, you actually hit <STRT>. Please
observe that the sample filter is incrementing with one every second time you hit
<STRT>. Start/stop status is indicated with <STRT> LED lit when the sampler is
running.
CONT:
Is used to resume sampling without advancing to next filter.
prn:
is used to print out all data from the display. An optional printer will be introduced in
a later version of the instrument. You can, however, transmit the data to a computer
by means of a terminal emulating program and an interface cable to the display unit.
2.6 Filterpack sampler (NILU-EK)
The NILU-EK (http://www.nilu.no/products/seq-samplers/seq-s-ek.html) air sampler
collects aerosol and gas in ambient air in a filter pack, which consists of an aerosol
prefilter, and one or more impregnated filters mounted in a filter holder
(http://www.nilu.no/products/filter/filter.html). The sampler consists of two funnels with
filter holders, a control unit, a pump, a dry gas meter as well as a flow controller.
The pump draws air through the filters during a preset time period. The EK air
sampler has two parallel sampling lines, each consisting of a funnel with a filter pack
which are activated sequentially. The start/stop of each sampling line is set with the
timer. A solenoid valve is used to change from one line to the other at the preset time.
The volume of air sampled is read on an air volume counter connected to a dry gas
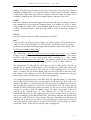
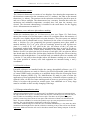
meter. Figure 5 gives a schematic overview of the equipment.
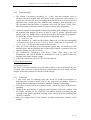
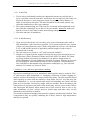
Air is drawn through the filters in the filter pack (2) when the pump (7) is operating.
The position of the solenoid valve (3) determines which of the two filter packs (2) is
exposed. The funnel (1) protects the filter pack against direct sunlight, rain and snow,
and prevents large particles to reach the aerosol prefilter. The air volume passing
through the filter is measured with the gas meter (6). For every 10 litres of air the gas
meter gives a pulse to that air volume counter (4) which corresponds to the open
position of the solenoid valve (3). The solenoid valve (3) and the relay (5) is
controlled by the timer (8). The sampling period is preset with the timer (8), and at the
end of one sampling period the solenoid valve will change sampling line and the relay
will switch to the second air volume counter. The timer will initiate a switch from one
sampling line to the next at the end of every sampling period and hence, the exposed
filter pack must be replaced by an unexposed one and the corresponding air volume
read in the counter, before the next change of the sampling line.
p.8
IMPACTS Field manual for LGS
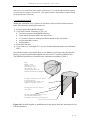
Figure 6 shows the front of the control unit. The manometer (5) shows the pressure
behind the filter pack in exposure. The measured pressure will reveal leackages and
other problems with the sampling line. The actual pressure will, however, depend on
the filter type and the aerosol mass collected on the aerosol prefilter.
4
1
3
5
2
6
8
9
220 V
50 Hz
1. Funnel
2. Filter pack
3. Solenoid valve
4. Air volume counters
5. Relay
6. Gas meter
7. Pump
8. Timer
9. Power switch (on/off)
7
Figure 5. Sampling principle
2
3
4
5
6
7
8
9 10 11 12
00148812
0000
0000
1. Plug socket for the pump
(rear panel)
2. Nipples for tubes from and
to the pump
3.Timer
4.Nipples for tubes connecting
the air intakes
5. Manometer
6. Fuses
7. On/off switch
8. Test button, sampling line 1
9. Counter for air volume through
line 1, litres x10
10. Test button, sampling line 2
11. Counter for volume through
line 2, litres x 10
12. Gas meter
Figure 6. Control unit, front panel
The control unit is equipped with test buttons (8) and (10) for each of the two
sampling lines. The light on the button tells that the corresponding sample line is
activated.
By pushing the button without light, air will be sucked through the corresponding
sample line as long as the button is pressed. The sampling line is immediately
deactivated when the test button is released. The test buttons are used to check the
pressure and the counter. The counters (9) and (11) give the air volume in units 10
p.9
IMPACTS Field manual for LGS
litres through the two sampling lines. These counters can be reset. The gas meter (12)
gives the total air volume and can not be reset.
Making the sampler ready for use
The control unit and the pump should be placed in a room with electrical connections
which must be grounded if the room contains water pipes. The air intake, i.e. the
funnel and filter pack, is mounted on a rack which is fixed to the outdoor wall when
ambient air is measured. The opening of the funnel must point downwards, and the
tubes from the funnels should be led through the wall to the control unit. The distance
from the ground to the funnel is usually 2-5 m.
The air intake and exhaust openings in the pump should be connected by 2 tubes to
the corresponding nipples on the left hand side of the control unit. The tube from the
nipple with the indication "ut" must be connected with the air intake of the pump.
Make certain that there is some space between the pump and the tubes, otherwise the
vibrations in the pump may eventually cause holes in the tubes. The electrical cable
from the pump is to be connected to the plug socket in the side of the control unit. The
tubes from the two air intakes must be connected to the nipples marked "filterholder"
on the top of the control unit (Filter pack #1 to be combined with system #1).
The filter holder should be mounted/dismounted in the laboratory. During the inspection the filter pack which is not active (and exposed during the previous sampling
period) should be replaced with an unexposed one.
User manual for Grässlin digital timer for NILU’s filterpack sampler
Setting time and week-day
The timer retains its program and works for
140 hours without power. The timer must,
however, be reset and reprogrammed if
subjected to long transport or storage time. The
resetting is described below:
Figure 7. Display of
Grässlin’s digital timer
1. Turn off the filterpack sampler with the red
switch at top of the front panel.
2. A new or empty timer will display four
large zeros. Seven digits 1 through 7 will
flash on the top line of the display. These
numbers
represent
the
weekdays,
1=Monday, 2= Tuesday and so on. Correct
day and time will be displayed if the timer
is active.
Please note that the timer will revert to the main display after 15 seconds of
inactivity.
3. Firmly push the clock key at the left and hold, while you push the hour key (h), to
the right and repeat until the correct hour is displayed.
p.10
IMPACTS Field manual for LGS
4. Keep the clock key depressed and push the minute key (m) at the right until
correct time is displayed in the window. The numbers will advance at a higher
speed if you keep the hour or minute key depressed instead of successive hits.
5. Keep the clock key depressed and push the day key (Day) at the lower right of the
timer until correct weekday is shown.
6. When you release the clock key, the weekday digits will stop flashing and the
correct day and time will be shown with a flashing colon. This indicates that the
timer is working.
Programming weekly sampling interval.
1. Push the programming key (Prog.) to the left to commence programming.
2. Push the function key with the hand symbol at the top until the actuate
sign appears in the lower left of the display.
3. Push the hours key (h) until correct start time e.g. “08”
4. Push the minute key (m) until correct start minute e.g.“00”
5. Push the day key (Day) until first day that will not be a sampling day, e.g “2”
6. Confirm that this day is no sampling day by pressing Sel
7. Continue with 5 and 6 until only all 6 days are removed and only the day of the
sampling day is left in the window, e.g. “1”
8. Push the programming key (Prog.) again.
9. Select disengage by pushing the hand key till the sign at the right
appears.
10. Select stop time with the hour key (h) until e.g. “08” is shown.
11. Push the minute key (m) until correct stop minute “01” is shown. The timer
activates the filter-selecting relay for only for one minute. This relay has a toggle
function, which means that the selected sample line will be changed every time
the relay is activated.
12. Select the day for sampling doing the same procedure as in number 5,6 and 7
13. Exit programming mode by pushing the clock key.
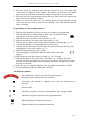
The different symbols:
The function key (“hand”) gives the following options:
(Displayed on the bottom left in the window):
Connection, the channel is changed every time the function key is
activated
Disconnection
Automatic program, connection at programmed time, change channel
Automatic program, disconnected at programmed time
Manual sampling. Permanent connection.
Manual sampling. Permanent disconnection
p.11
IMPACTS Field manual for LGS
2.7 Throughfall collectors
The ground vegetation throughfall collectors (Fig. 8) as well as the forest canopy
throughfall collectors (Fig. 9) are made in by Chinese Academy of Forestry (CAF)
China according to a design modified from the Norwegian Forest Research Institute .
The original is made of a 2L plastic bottle, a plastic funnel (d=9.1 cm), a connector
with a filter (nylon screen) and mounting equipment. For the ground vegetation
throughfall collectors the funnel opening is located only 10cm above the ground. They
are placed in a PVC pipe (d = 12 cm) (Figure 8). 3 ground vegetation throughfall
collectors are positioned subjectively underneath the ground vegetation at intensive
macro-plots as well as soil water-only plots. The forest canopy throughfall collector is
situated 1m above ground. Four forest canopy throughfall collectors are placed
systematically in each intensive macroplot. At relatively flat intensive monitoring
plots the forest canopy throughfall collectors are positioned on the diagonal of the
30m x 30m square, 2 m from each of the four corners. At the steep plots, the forest
canopy throughfall collectors are positioned on the lower base-line of the 30m x 30m
plot, at 1m, 10.3m, 19.7m and 29m from the left-hand corner.
Ground
vegetation
Figure 8.
throughfall collector
throughfall collector
p.12
IMPACTS Field manual for LGS
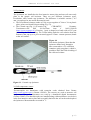
2.8 Lysimeters
The lysimeters are installed at the four intensive macro-plots and one soil water-only
plots in the genetic soil horizons. There are two different lysimeters types;
Percolation- and Ceramic cup lysimeters. The difference is whether suction (< 0.5
atm.) is employed or not and in the material used.
• The Percolation lysimeter (made at UiO) are put together of 30cm x 30 cm plastic
plate, nylon screen and Perspex tubing (Fig. 10).
• The Ceramic cup (Fig. 11) (Ceramic Cup,
CERAMTEC,
Germany.
Tensiometer-celle
P80
20:12x67mm
item
#
1.603112.00.00
(http://www.ceramtec.de/); Poresize: 1 µm) is shaped as a bottle with a PVC-part
pierced by the Teflon tubing. The Teflon tubing leads the soil solution from the
bottom of the cup up to a pre-evacuated (approx. 0.5atm. vacuum pressure) bottle
at the soil surface.
Figure 10.
Percolation lysimeter (Note that the
lysimeter drains freely through a
tube connected to a 5-L collection
container (poly-propylene), which is
graded to allow the field recording of
the collected volume.
Figure 11. Ceramic cup lysimeter
2.9 Soil temperature sensor
Thermocouples are thermistors with extension cords obtained from Geonor
(http://www.geonor.com/) (Geonor AX24L). The sensors are used to measure soil
temperature. The soil temperatures are read by a hand-held digital thermometer
(Geonor C9003). The thermocouples are installed along with tensiometers (see below)
at the four intensive macro-plots and are usually buried in the soil at the same depth as
the lysimeters. Measurements are made in oC.
p.13
IMPACTS Field manual for LGS
2.10 Soil tensiometer
Granular matriks soil water potential sensors (Watermark) are obtained from
Eijkelkamp (http://www.eijkelkamp.com/). The tensiometers (Eijkelkamp 14.27.05)
are placed in the undisturbed soil in close vicinity of the thermistors (see above). The
sensors are used to measure the strength at which water is held by the soil; this is also
called soil water potential. Measurements are made using a hand-held soil water
potential meter (Eijkelkamp 14.27.01) after temperature correction. Readings are in
centibar (=kPa). Water-saturated soil gives a reading of 0 centibar; the drier the soil,
the higher the soil water potential and the measured value. The maximum value is 200
centibar.
2.11 Limnigraph
The dam is located at the stream outlet from the catchment. The dam is used to
measure the discharge, which must be determined in order to calculate catchment
budgets. The dam consists of a V-notch weir, a discharge-logging device
(limnigraph), and a small house for the logging device (Fig. 13). At Lei Gong Shan a
60°, 60 cm high V-notch profile in iron is installed, with a capacity of measuring
runoff from 0-0.222 m3 sec-1 (799.8m3 h-1).
The limnigraph unit consists of:
• Flowlogger are delivered by ISCO (http://www.ISCO.com/) (ISCO 4120, article
no.: 68-4120-001). This probe uses an integral differential pressure transducer to
measure the depth of the water and has a 7.5m sensor-cable (Fig. 13). Logging
height: 0-3.05 m.
• Data collecting device consisting a Flowlogger recording unit and transformation
to PC (ISCO, Model 581 RTD module, article no.: 60-9004-027); ISCO, SPA 939
(article no. 69-1780-008), which is an interface for 581 RTD and PC (battery
driven (12V) with cable; and a flowlink version 4 (article no.: 60-2544-047) for
programming all ISCO-loggers, emptying of data, generation of graphs, reports,
summaries from stored data and exports to PC-programs like Excel for Win95/98
and NT.
The Chinese ISCO sales representative in China is: North America Instrument
Consultants Co, No. 140 Feng Tai Lu Kou, Beijing 100071, China
Figure 12. V-notch weir and limnigraph
Figure 13. ISCO Flow logger
p.14
IMPACTS Field manual for LGS
2.12 Temperature sensors
The electronic thermometer consists of two displays. One showing the temperature at
the thermistor connected to the extension cord (i.e. outdoor), the other to the internal
thermistor (i.e. indoor). The termistor on the extension cord must be placed in open air
and out of direct sunlight. The thermometer has a memory function that stores the
maximum and minimum temperature recorded since last time the memory was
cleared. The electronic thermometer is installed in the small house for the logging
device. Measurements are made in oC.
2.13 Macro-, core- and meso plot and tree marking
Within the catchment there are 10 forest macro plots (see Figure 15). Each forest
macro plot consists of a 30x30m square, with a few exceptions where the measures of
the plots were slightly adjusted due to terrain obstacles. The plot corners are marked
with sticks with a painted band on top. Positioned in the centre of each macro plot
there a 10x10m core plot comprising the ground vegetation meso plots which is
marked similarly. Five 1-m2 meso plots are randomly placed in each 10x10m-core
plots; i.e. a total of 50 1-m2 plots in the site. All corners of the 1-m2 plots are
permanently marked with subterranean eloxed aluminium tubes as well as by aboveground white plastic sticks. Yellow plastic numbers on the plastic stick marks the plot
number of each 1-m2 plot in the lower left corner of each plot. All 1-m2 plots are drawn
into sketch maps for each of the 10x10m plots. Inside the 30x30m plot, all trees having
diameter at breast height above 5 cm outside bark, are marked with a tree number and
a circular 2.5 cm point at brest height (where all diameter readings are to be taken).
The exact position of corners, trees and equipment are measured using x and y
coordinates.
2.14 Litterfall collector
Litterfall collectors are installed beside the canopy throughfall collectors (see 2.7).
The litterfall collectors are made in China by local field responsible (under directions
of central WPIII leader) according to a modified design from the Norwegian Forest
Research Institute (NISK) (Fig. 14). Modifications are made in order to allow the
application of local equipment for their construction. A litterfall collector consists of a
squared 0.45m x 0.45m tree frame and bag made of brown or green Jersey fabric. The
frame is 1m above the ground on wooden posts. One additional set of Jersey bags
must be available to allow weekly changing of the bags.
2.15 Nitrogen mineralization tubes
Nitrogen mineralization tubes (15 cm long and 7 cm diameter pvc tubes) are hammered into
the top soil after the L layer is carefully removed (note the F and H layer are not removed). In
total 12 tubes are installed per intensive macro-plot. The tubes can be placed along two
parallel 1 meter long lines (about 10 cm apart) with a distance of about 10 cm between the
tubes. The tubes should be covered with a plastic cap to prevent precipitation water from
entering. The caps should have small holes to allow gas exchange.
The 6 tubes situated along one of the lines are excavated immediately (i.e. the same day) after
installation and brought back to the lab, while the remaining 6 stay in the soil for two months.
Important: Make sure that the soil cores in the tubes remain intact during transport. In the lab
p.15
IMPACTS Field manual for LGS
each soil core is divided into three groups of horizons F+F, A+AB and B1 and their length is
recorded. The soil samples are stored at –18oC until extraction. Note that the samples should
not be dried before extraction!
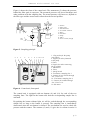
2.16 Instrument location
Within the catchment (Fig. 15) there are ten macro plots and four intensive macro
plots. Each intensive macro-plot consist of:
¾ 4 forest canopy throughfall collectors
¾ 1 Soil water station consisting of (Fig. 16);
• 3 ground vegetation throughfall collectors
• 1 percolation lysimeter below the forest floor
• 3-5 suction lysimeters situated at different depths in the soil profile
• 4 soil temperature sensors
• 4 tensiometers
¾ 4 litterfall collectors
¾ 12 pvc tubes (15 cm length, ∅=7 cm) for N-mineralisation studies (not until after
2001)
Outside the intensive macroplots there are in addition a soil water-only plot (plot D),
having 3 ground vegetation throughfall collectors and 3-5 suction lysimeters only.
The different lysimeters are situated in the catchment according to Table 1.
Ring:
Height ~ 30 mm
Thickness ~ 5 mm
Inner diameter ~44.8
Outer diameter ~45.3
(measuring area: D=45 cm)
M aterial: painted steel or aluminium
The ring is mounted by use of ~95 mm
non-corrosive nails
on three wooden posts (diam ~5 cm)
Height above ground = 100 cm
The bag (100 x 145 cm) is made of
jersey fabric
The bag is attached to the ring by use of
tape stretched around the ring,
and lashed with a string to one of the posts
Figure 14 Litterfall sampler (a modification of this design from the Norwegian forest
research institute).
p.16
IMPACTS Field manual for LGS
Figure 15.
Map of the LGS catchment. Letters
refer to soil water plots and
numbers refer to macro-plots, both
described in Table 1
p.17
IMPACTS Field manual for LGS
Figure 16
The field equipment in a soil water station. The nests of temperature and tensiometers
are located to the side of the lysimeters. (Nitrogen mineralization tubes not indicated).
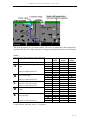
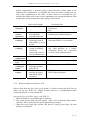
Table 1
The location of the lysimeters in the catchment.
Plot
A
Location
Bottom of eastern slope close to the
dam
B
Intensive MACROPLOT 1
On the gentle slope of the top of
the eastern ridge
D
Intensive MACROPLOT 8
In the floodplains in the valley
bottom close to the stream
Intensive MACROPLOT 4
On the sharp ridge of the western
ridge
E
On the bottom of the steep sloping
western ridge
C
Intensive MACROPLOT 2
Horizon
L
A
AB
B1
B2
L
A
B1
B2
A
AB
B
A
B1
B2
L
A
AB
B1
B2
Depth
limit
cm
+2
2.5
22
+2
5.5
20
10
19
12
30
+2.5
8
22
42
-
Lysimeter
depth
cm
0
1
11
36
50
0
1
15
45
7
16
36
8
25
40
0
5
Lys.
Numb.
36
60
E2
E3
A0
A1
A2
A3
A4*
B0
B1
B2
B3
C1
C2
C3
D1
D2
D3
E0
E1
* Only moisture and temp. sensor – no lysimeter.
p.18
IMPACTS Field manual for LGS
3.
PROCEDURES
Print out a copy of the appropriate weekly field log sheet on both sides of a
waterproof sheet of paper to bring to the field and make sure by marking of on the
sheet that all tasks are conduced. Note down the sampling date and start and stop time
for the fieldwork.
3.1 Precipitation
Collection frequency: Wet Only: Weekly samples every monday morning (or another
weekday) between 07.00 and 09.00.
3.1.1 In the field
1. If there is any chance for the operator to touch the inside of the collecting funnel,
disposable polyethylene gloves should be put on.
2. Bring an empty clean precipitation bottle (2.5L for bulk and 5L for wet only) and
screw cap to the precipitation samplers.
3. Exchange the collection bottle in the precipitation sample collector and put on a
screw-stopper. Be careful not to touch the inner side of the bottle with the fingers.
4. For the wet only, open the lid adding a few drops of water on the precipitation
sensor. Examine the collector funnel for visible contamination such as insects,
leaves or tree-needles, organic debris. If this is found, remove the contamination.
Rinse the funnel twice using distilled water (~100 ml). This rinsing must be done
even if there has been no precipitation in that collection period.
5. After the distilled water has drained off, put on the new collection bottle.
3.1.2 In the field laboratory
1. Take the collection bottles indoors to the room assigned to function as the
sampling laboratory. All the equipment used for measuring must be rinsed twice
with distilled water before use.
2. Measure the volumes in a graduated cylinder. Use a large cylinder (0-250 mL) for
large samples and a small (0-25 ml) cylinder for small samples.
3. The precipitation amount is measured within the nearest mL. The amount is
written on the weekly field log sheet. If it hasn’t been any precipitation, 0 shall be
written on the scheme.
4. Transfer a suitable aliquot (100mL) to a storage bottle.
5. The storage bottles are marked with the station name, date for sampling interval,
and total precipitation amount. The bottles are put in plastic bags and stored in a
fridge until transportation.
6. Pour out the remainder of the sample, rinse with distilled water and place the
collecting bottle upside down in a clean place to dry. Also rinse the graduated
cylinders.
7. Fill in the field sample registration form, and take time to record usual and
unusual events, which may have influenced the sampling.
8. pH and conductivity should be performed as soon as possible
9. Follow the instructions given in "The local lab manual".
p.19
IMPACTS Field manual for LGS
3.2 Changing of filterpack
Collection frequency:
Change filterpack once every week. Print out a copy of the Daily air field log
sheet on both sides of a waterproof sheet of paper to bring to the station and
make sure by marking of on the sheet that all tasks are conduced. Note down
the sampling date and start and stop time for the fieldwork.
1. Mark an unexposed filter pack with start date
2. Read the pressure behind the exposed filter pack and record the reading in the
field log
3. Read the counter in the volume meter and record the volume in the field log
4. Remove (unscrew) the air intake or funnel covering the exposed filter pack and
remove (unscrew) the filter pack
5. Dismount the covers from the new unexposed filter pack and mount them on the
exposed filter pack
6. Mount the new unexposed filter pack and the air intake,
7. Read the pressure behind the unexposed filter pack and record the reading in the
field log
8. Reset if necessary the counter or volume meter of the new filter pack
9. Write the start of the exposure of the new filter pack in the field log
10. Activate or program the timer if necessary
11. Put the exposed old filter pack in a plastic bag, seal it and put it in the refrigerator
The filterpack may be changed manually or using the timer that needs to be
programmed to switch channel e.g. every Monday at 08.00 as described in chapter
2.6. If the timer is not used make sure that it is out of operation:
This option in the timer should be used
3.3 Sequential NO2 sampler
Collection frequency:
Daily samples. Change seven samples once a week.
Continue noting on the back side of the Daily air field log sheet from section 3.2.
1. Check that the filter being exposed and the present flow are correct. Please note
the sample number and exposure time and check that this coincides with your
settings.
2. Read and note all sample volumes in the field log. The volumes appear one
sample after the other when you press the <RIGHT> arrow. Please observe that
shortly after volume display the display will revert to the present active sample
and you will have to press the <RIGHT> arrow the appropriate number of times to
recall the sample you were reading. Active sample will only read flow and not
volume.
3. Write down volume and exposure time in the field log
4. Hit <STRT> button to temporarily stop the sampling.
5. Check that the <STRT> and <NON STOP> light emitting diodes (LEDs) go off.
p.20
IMPACTS Field manual for LGS
6. Change all the filters except the one that was active.
7. Close off inlet by pinching the silicone tube between manifold and intake filter.
8. Hit <CONT>. The LEDs lights up and the pump starts.
9. Wait till the displayed flow drops to zero and hit <STRT> again to stop.
10. Hit <SHFT> button and check that all 8 sample flows go down to zero. The
sampler will automatically shift through all 8 filters. You will probably reach zero
flow just as it changes to next sample.
11. If not, trouble-shoot for leakages and test again.
12. Remove the pinch.
13. Hit <SHFT> again and check that all 8 sample flows reach normal value i.e. 0,5
litres per minute. The sampler will automatically shift through all 8 filters.
14. If not, trouble-shoot for blockage.
15. Mark in the field log that leaking has been tested.
16. Hit <CONT> to continue sampling on the filter that was active. Reconfirm that
you are in NON-STOP mode if that is your intention. Selection is made with the
<NON STOP> key.
You can get back to the main display by pushing the <LEFT> arrow.
17. The "Remarks" column in the field log is used for information of importance to
the local operator, e.g. power failure. If possible, the period of "no current" shall
be given.
18. The field log should be sent together with the exposed glass sinters to the lab.
3.4 Throughfall
Collection frequency:
Samplers are left in the field for 1-one week before the collectors are bulked. Every
fourth week the samples from the ground vegetation and forest canopy throughfall
collectors in each soil water plot and intensive macro plot, respectively, are mixed to
2 grand 4 weekly bulk plot sample.
3.4.1 In the field
1. 7 days after start of sampling bring graded 1, 2 and 5L rinsed polyethylene or
polypropylene transport vessels out to the respective plots ensuring that the
marking on the bottles match the plot letter on the throughfall collector.
2. Before handling the throughfall collectors put on disposable polyethylene gloves.
Collect the total volume of all four canopy throughfall collectors and three ground
vegetation throughfall collectors per plot into the transport vessels. Depending on
the total volume of throughfall in the throughfall collectors choose the 1, 2 or 5 L
transport vessels. After the total volume of a throughfall collector has been
collected in the transport vessel the collection bottle, funnel and sieve have to be
rinsed twice with distilled water. In case rinsing is not enough the equipment
should be replaced (more serious cleaning can be done in the laboratory). The
transport vessels containing the throughfall of all throughfall collectors at each
macro- and soil water plot are brought to the institute avoiding temperature
changes to the sample.
p.21
IMPACTS Field manual for LGS
3.4.2 In the laboratory
1. The volume is measured (weighing; 1g = 1mL). Next the transport vessel is
marked with its collection date and stored in the refrigerator. Note amount of
sample per plot for each week in fieldlog sheet and take time to record usual and
unusual events, which may have influenced the sampling (bird droppings etc.).
The procedure described above is repeated every week for 4-four- weeks. Thus,
after four weeks, 4 transport vessels per plot are stored in the refrigerator.
2. Chemical analyses of throughfall is done using monthly bulk samples per plot. For
the monthly bulk samples we prefer to have a 1-one- L volume. Mark this bulk
sample with a log number that is retrieved from the EXEL field log spreadsheet.
To obtain this we take a fraction x from each weekly bottle, where
x = 1/(a+b+c+d)
In this formula a, b, c and d are the pooled volumes (in L) of the four throughfall
collectors for the plot in week 1, week 2, week 3 and week 4, respectively. If
(a+b+c+d) < 1L, use the total volume of the 4 weeks.
3. After the weekly transport vessels have been emptied they are rinsed twice with
distilled water, and the sampling date, written on the outside, is removed. Now the
transport bottles are ready for re-use.
4. pH, conductivity, absorbency (OD 254nm, Colour (OD: 410nm), the Alfractionation and total-P should be performed as soon as possible after the
monthly bulk sample aliquot is made
5. Follow the instructions given in "The local lab manual".
3.5 Percolation lysimeters
Collection frequency:
The five-5 L collection containers are left in the field for 1-one week before they are
collected. The vessels are replaced with new sample bottles. Every 4-fourth week the
samples from each lysimeter are mixed to a bulk sample.
3.5.1 In the field
1. 7 days after start of sampling bring the rinsed 5L graded polyethylene or
polypropylene lysimeter bottles out to the respective percolation lysimeters
ensuring that the marking on the bottles match the marking on the tubing.
2. Take time to record usual and unusual events, which may have influenced the
sampling
3. Exchange the polyethylene or polypropylene lysimeter collection container with
the rinsed container for the respective percolation lysimeter ensuring that the
marking on the bottles match the marking on the tubing. Write the sampling date
on the 5L container.
4. Bring the samples back to the institute avoiding temperature changes to the
sample.
p.22
IMPACTS Field manual for LGS
3.5.2 In the laboratory
1. Measure (weigh) the amount of sample, write the volume on the container and
note the volume in the field log.
2. Store the bulk samples in a cold, dark room (refrigerator at about 4°C)
3. Every 4-fourth week a 1L monthly bulk sample aliquot is taken for chemical
processing. Use the same procedure as for the monthly bulk throughfall samples
(3.4.2). Mark sample aliquot with log number that is retrieved from the EXEL
field log spreadsheet
4. The sampling containers are rinsed and made ready for re-use
5. pH, conductivity, absorbency (OD 254nm, Colour (OD: 410nm), the Alfractionation and total-P should be performed at as soon as possible after the
monthly bulk sample aliquot is made
6. Follow the instructions given in "The local lab manual".
3.6 Suction lysimeters
Collection frequency:
Samplers are left for 1-one week before the glass sample vessels are collected. The
vessels are replaced with rinsed pre-evacuated sample bottles. Every 4-four weeks the
samples from each lysimeter are mixed to a bulk sample.
3.6.1 In the field
1. Pre-evacuate lysimeter glass bottles at Institute to >0.5atm. (= 50 cbar) suction.
Avoid touching the inside of the bottle and rubber membrane.
2. 7 days after start of sampling bring the glass bottles out to the respective
lysimeters ensuring that the marking on the bottles match the marking on the
syringes.
3. Take time to record usual and unusual events, which may have influenced the
sampling in the field log.
4. Exchange the glass lysimeter sampling bottles with the respective new preevacuated lysimeter bottles
5. Observe if pressure is lost quickly by e.g. holding the bottle up side down and
look for bubbles. If so is the case refer to chap. 3.7 for remedy and make note in
field book.
6. Bring the samples back to the institute avoiding temperature changes to the
sample..
3.6.2 In the laboratory
1. Measure the amount of sample and note the data in the field log.
2. Pour the weekly sample from glass bottle to clean polyethylene or polypropylene
2L lysimeter 4-weekly bulk container ensuring that the marking on the glass
bottles match the lysimeter number on the bulk containers.
3. Mark the bulk container with sampling date and sample volume
4. Store the samples in a cold, dark room (refrigerator at about 4°C)
5. Every 4-fourth week a 0.5L monthly bulk sample aliquot is taken for chemical
processing. Mark sample aliquot with log number that is retrieved from the EXEL
field log spreadsheet
p.23
IMPACTS Field manual for LGS
6. The glass lysimeter bottles and (every fourth week) bulk containers are rinsed and
stored and made ready for re-use.
7. pH, conductivity, absorbency (OD 254nm, Colour (OD: 410nm), the Alfractionation and total-P should be performed at as soon as possible after the
monthly bulk sample aliquot is made
8. Follow the instructions given in "The local lab manual".
During frost periods sampling must be stopped and bottles brought back to the
institute.
3.7 Soil lysimeter problems and remedies
The sampling of soilwater above the groundwater table is not an easy task. The
lysimeters are problematic and need ongoing service and maintenance. During very
dry conditions only those lysimeters that always collect water may be sampled. A
couple of typical problems and possible remedies will here be treated.
3.7.1 The lysimeter looses its pressure without sampling water.
a) During dry conditions the porous wall of the lysimeters are not saturated with
water. The lysimeters then become permeable for air and the vacuum will slowly
be lost (after > 5 min.). If the problem is not constant the pressure must be reset
frequently or the lysimeter temporarily abandoned.
b) The rubber membranes may begin to leak. Check that the pressure remains stable
after evacuating the flasks, if not replace the membrane. Avoid contamination of
the inside of membrane. Fit cap tightly.
c) The syringe from the lysimeter must be allowed to stand freely in the rubber
membrane. If not, air will leak between the syringe and membrane
d) The ceramic cups are fragile and may crack due to frost swelling or if stepped on
(organic surface layer). If cracked replace with new lysimeter.
e) A forest animal may disjoin the Teflon tubing. Rejoin the loose ends using the
supplied tubing. If more then one tubing is detached ensure that marking on
syringe corresponds to marking at soil surface. Check point c).
3.7.2 The lysimeter does not sample any water but holds its suction.
a) The teflon tubing or the lysimeter surface may be plugged by organic or other fine
material. This may often be solved by gently applying positive pressure through
the syringe.
b) The soil and the lysimeter are moist, but the soil water potential is higher than the
applied suction of 50 cbar. Note that the soil water potential is measured weekly
(in cbar).
p.24
IMPACTS Field manual for LGS
3.8 Surface water
Collection frequency: weekly samples
3.8.1 In the field
1. Bring an empty clean polyethylene or polypropylene bottle (1 L) with cleaned
screw cap on to the sampling site.
2. The bottle should be marked with station name, sampling type (here surface
water) and sampling date.
3. Collect the sample close to the discharge (runoff) device. Since a weir is present
here, sampling is done at some distance up-stream from the weir because of the
risk of chemical contamination from the weir material.
4. Samples are taken in such a way that contamination and sampling of surface film
is avoided.
5. When filling the bottle, keep the bottleneck against the current, well below the
surface.
6. Rinse the bottle and screw cap 3 times with sampling water prior to sampling a
full bottle
7. Avoid touching the inside of the bottle and screw cap
8. Note in the field log that the sample is collected and take time to record usual and
unusual events, which may have influenced the sampling
9. The sample is transported to the laboratory avoiding temperature changes to the
sample.
3.8.2 In the laboratory
1. pH, conductivity, absorbency (OD 254nm, Colour (OD: 410 and 600 nm) and the
Al-fractionation should be performed at as soon as possible after returning to the
laboratory
2. Store the samples in a cold, dark room (refrigerator at about 4°C)
3. Measurement of Alkalinity (only on water with pH>5) and total-P should not be
stored for more than maximum one day before analysed.
4. Follow the instructions given in "The local lab manual".
3.9 Limnigraph
This chapter contains information about maintenance of ISCO data logger, retrieving
data, calibrating and editing data.
3.9.1
Maintenance required for the Isco 4120
1. Keep all unused connectors capped. This prevents moisture from damaging the
pins in the connectors.
2. Change the desiccant every month.
3. Replace the batteries every sixth month. The Isco 4120 Flow Logger requires a
12-volt DC power source. Use two 6-volt lantern batteries. Use only alkaline
lantern batteries or the flow logger will not work correctly. Lantern batteries are
available in local hardware stores. Place an alkaline battery at each end of the
p.25
IMPACTS Field manual for LGS
battery compartment, so that the springs contact the brass contact plates at the
bottom of the compartment. To complete the circuit, the plates extend from one
end of the compartment to the other. A short section of nonconductive tape
insulates the plates at the centre of the compartment, preventing the batteries from
touching the wrong contact plate and creating a short circuit.
Location of
desiccant
How to
remove
desiccator
When to
recharge
How to
recharge
Oven
temperature
How long to
heat
Desiccant is
recharged
when...
When to
replace
3.9.2
Desiccant Cartridge
Battery compartment
Desiccant Tube
Exterior of Chase and Quick
Disconnect
Box
Snap the desiccant tube from
mounting clip and disconnect it
Open compartment
door and slide
cartridge from slot
Desiccant behind
inspection window
turns PINK, or every
month.
Heat cartridge in a
vented, circulating
forced air,
convection oven in a
well ventilated room.
150ºC
150ºC
3 hours
3 hours
Desiccant behind the
inspection window
turns BLUE
The desiccant
particles no longer
turn BLUE when
recharged
Desiccant particles turn BLUE
Silica Gel: Before all desiccant in the
tube turns PINK, or every month.
Pour desiccant particles into shallow
pan. Heat particles in a vented,
circulating forced air, convection
oven in a well-ventilated room.
The desiccant particles no longer turn
BLUE when recharged
Retrieving data from the Isco 4120
Retrieve data from the Isco 4120 every month. To retrieve data from the 4120 you
either can use the “RTD 581” (Rapid Transfer Device) or communication cable
connecting directly to your portable PC.
Interrogate Isco 4120 Flow logger with RTD 581
1. Place the RTD 581 in the interrogator connector.
2. The yellow Power light will start pulsate. After a few seconds the data transfer
will start. This is shown bay the green light starting to pulsate.
3. When the green light stops pulsate and shows a steady green light, the data
transfer is completed.
p.26
IMPACTS Field manual for LGS
4. Take the RTD 581 to the laboratory and place it in to the RTD Interface witch is
connected to a PC.
5. Start Isco Flowlink 4.1. The program has a Quick Connect button with a picture of
the RTD 581 on it. Click on this button and the transfer of data will start.
6. The data will automatically add the site to the workspace in the Flowlink 4.1.
Interrogate Isco 4120 Flow logger with PC
1. Connect your PC to the instrument. Use an interrogator cable to connect to 4120.
2. Click the Quick Connect button on the toolbar, or press F11 in the Flowlink 4.1
program.
3. Flowlink starts to communicate with the instrument.
4. To retrieve data press the “ Retrieve Data (F8)” button. Flowlink adds the site to
the workspace.
3.9.3
Calibrate the Isco 4120
Every month when retrieving data, it is necessary to measure the water level in the Vnotch. This must be done to insure that the Isco 4120 is measuring the right water
level in the V-notch.
1. Place the ruler in the bottom of the V-notch.
2. Aim on the top of the curve of the flowing water in the V-notch, and read the level
in mm.
3. Control the level inn the V-notch against the Limnigraph reading. If the digital
reading and the manual reading do not collaborate, insert the new value in to the
Isco 4120.
Insert new measured liquid level in Isco 4120.
1. Connect your PC to the instrument. Use an interrogator cable to connect to Isco
4120.
2. Click the Quick Connect button on the toolbar, or press F11 in the Flowlink 4.1
program.
3. Flowlink starts to communicate with the instrument.
4. Go to the Measurements tab in the site picture. The instrument will display the
current level in a number-entry box. Set the calibrated liquid level in this box and
click the apply button (F9).
3.9.4 Editing Data
1.
2.
3.
4.
5.
Start the Fowlink 4.1
Click on the Site Folder so the retrieved data will appear.
Click on the Site you wish to edit. The “Level” and “Flow rate” will appear.
Double click on the “Flow rate”, and a graph of the site will be shown.
To edit the time interval, double click on the graph. The graph properties will
show up.
6. Go to the “Time Scale” tab in the graph properties. Choose the starting date and
time for this plot in either relative or absolute terms. Then enter the desired time
span and summary interval.
7. Click “OK” to get the new graph.
p.27
IMPACTS Field manual for LGS
When a graph or table is active on the Flowlink desktop, selecting File>Export will
export the series data shown on the graph to a CSV file (comma-separated values or
comma-delimited).
1. To Export a CSV File from Flowlink menu, select File>Export.
2. Type the path and file name, or browse for the new location by clicking the Select
button.
3. Click Export.
4. Flowlink displays its progress on the bare in the status box.
The exported file is now ready to be opened in programs like Microsoft Excel.
3.10 Temperature
Temperature is logged daily at same time as bulk precipitation is collected. Minimum
and maximum temperature is logged weekly.
3.10.1 In the field
Temperature is read on the electronic thermometers. Record the minimum and
maximum temperature value for outdoor (in the top LCD window) by pressing the
min. and max. buttons respectively. Blank the memory by pressing both buttons
simultaneously. Record the minimum and maximum temperatures on back side of the
fieldlog sheet
3.11 Litterfall
3.11.1 In the field
1. Litterfall is collected monthly.
2. Upon sampling, a numbered paper label is dropped into the bag.
3. If the bag is wet, the bag is carefully removed from the frame, and closed with a tie. A
new bag is attached to the frame as described. If the bag and the litter are dry, the bag can
be opened in the bottom, and the litter (together with the label) is dropped down directly
into a paper bag.
4. The four bags from each macro-plot are brought to the laboratory and air-dried.
3.11.2 In the laboratory
1. Drying and air dry weighting: The litter is air dried, weighted bag by bag. The weight is
logged in the “Sample log weekly” sheet in the Fieldlog spreadsheet. The samples are
then stored in plastic bags in a cool and dry place. (In the case of wet litter, it is dried
together with the bag, and then removed from the bag.)
2. Sorting: For each macro plot, the monthly samples are pooled into 3-months (13 weeks)
samples, and these 16 samples are sorted into 3 fractions; 1) the coarse fraction consisting
p.28
IMPACTS Field manual for LGS
of branches, twigs and cones, 2) the masson pine needles, and 3) the rest (including
leaves, lichens and seeds).
3. Weighting: The three fractions (coarse, masson pine needles, and the rest) are dried for 48
hours at 65oC. The dried fractions are weighed and stored until the end of the year.
4. Preparation for chemical analyses: At the end of the year the samples are pooled into 12
samples, one for each fraction and each macro plot. The samples are sent to Wang Yan
Hui at CAF for analysis at CRAES.
5. Chemical analyses (Perfomed at CRAES in Beijing): The samples are analysed for the
macronutrients N, P, S, Ca, K, Mg, as done with the foliar samples. However, it is not
necessary to include ringtest material in these analyses.
Calculations: All data is stored in the database as g/m2/day.
3.12 Measurement of soil temperature and soil water potential
These measurements are done weekly, simultaneously with sampling of throughfall
water and lysimeter water (chapt. 3.4 - 3.6). At each plot soil temperature is measured
first. Make sure that the cable is well connected to the thermometer. In case of strong
corrosion the metal tips must be cleaned (e.g. by using a knife). After the temperature
has been measured at all depths and the values have been recorded in the field log the
measurement of the soil water potential may start.
Before connecting the measuring device to a tensiometer a check of the device should
be performed. Switch on the meter, set the temperature to 24oC and press “read” and
“test” simultaneously. If the reading is between 95 and 105 the device is functioning
well (for details, please consult the manual).
Next the temperature has to be set to the average value that was measured in the soil
(press “read” and “temperature” simultaneously to change the setting). Only when the
range in soil temperatures between the different depths is more than 2oC the
temperature setting has to changed for the respective tensiometers. When the correct
temperature is reached, the surface tensiometer may be connected to the device. Press
“read” twice and note the value (this is given in cbar) in the field log. Continue with
measuring tensiometers 2, 3, and 4 (calibration, or testing is not necessary now, but
possibly the temperature setting has to be changed).
3.13 Measurement of nitrogen mineralization
Collection frequency:
Measurements are done during only one complete year. Sampling tubes are left in the
field for 2 months before being collected. So this means there will be 6 sampling
occasions. At time zero 12 tubes are installed per intensive macro-plot, 6 of these are
immediately excavated, and brought back to the laboratory. After 2 months the
remaining 6 tubes are excavated, brought back to the laboratory. At the same time 12
new tubes are installed again, and 6 of these are excavated and brought back to the
lab. The other 6 are left in the field and are excavated 2 months later. This procedure
is repeated for one full year.
p.29
IMPACTS Field manual for LGS
3.12.1 In the field
1. Twelve tubes (individually marked) are hammered into the top soil after the L
layer is carefully removed (note the F and H layer are not removed). The tubes can
be placed along two 1 meter long lines (about 10 cm apart) with a distance of
about 10 cm between the tubes. The tubes should be covered with a plastic cap,
which has small holes to allow gas exchange.
2. The 6 tubes situated along one of the lines are excavated and brought back to the
lab, while the remaining 6 stay in the soil for two months. Important: Make sure
that the soil cores in the tubes remain intact during transport.
3. Note date and time of installation.
3.12.2 In the laboratory
1. Upon arrival in the lab the soil cores have to be removed from the tubes with as
little disturbance of the structure as possible. Use a piston to push the core out and
collect it on clean laboratory tissue. With a sharp knife the soil core is divided into
F+H, A+AB and B1 horizon (if applicable) and the length of each section is
measured and recorded.
2. The soil sections are stored at –18oC until extraction with KCl.
3. Samples of 10 gram from the organic horizons and 40 g of the mineral layers are
weighed into 100 ml Erlenmeyer flasks and 50 ml 1M KCl is added. The flasks
are gently shaken (100 strokes per minute) for 30 minutes. Suspensions are
filtered (Blauband, 125 mm, Schleicher & Schull, Germany). Filtrates are stored at
4oC until analysis, which should be done as soon as possible. Concentrations of
NO3 and NH4 are determined using colorimetric techniques (e.g. flow injection
analysis). For details see Torstveit, 2000.
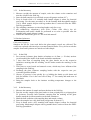
3.14 Macro-, core- and meso plot and tree marking
Plot and tree markings have to be maintained. Missing sticks must be replaced. The 1
m2 plots must be kept undisturbed, i.e. trampling, collections of plants, digging etc.
must be avoided. All marking of corners must be kept intact. The plots must be looked
after regularly to ensure that the marking is kept intact, but in a way that keep the
plots undisturbed; i.e. use the sketch maps and avoid trampling also inside 10x10m
plots as far as possible. If necessary supply with new markers, but do not mark a plot
if the position is uncertain, just mark on the sketch map. Always report to the Chinese
and Norwegian WP-leaders when markers have been removed from a plot or any
other disturbance of plots. Always mark on sketch maps and make notes on any
disturbances and removal of markers.
Tree numbers and breast height points must be regularly checked and refreshed. This
is important as they are quickly vanishing due to heavy showers, high temperatures
and fast tree growth.
p.30
IMPACTS Field manual for LGS
4.
LOGGING BOOK - HANDLING OF DATA
Registration and handling of field and laboratory data is conducted by means of an
EXCEL spreadsheet Workbook ("The log-book"). The EXCEL Workbook consist of
10 excel spreadsheets.
a) Each EXEL Workbook contain data for a 4-week period.
b) The first sheet is for daily fieldwork. The next 4 sheets are weekly fieldlogforms.
These are to be printed out and used in the field. All white fields should filled inn
c) After fieldwork is completed a copy is made which replaces the form in the
fieldlog. The data in the form is punched into the EXEL file and the original copy
is stored in safe place.
d) The 6th and 7th sheets holds bookkeeping with sample -date, -volume and log
numbers
e) The 8th through 10th 10th sheets are the main sheets containing all the data for the
month
f) In the 8th sheet there are quality control columns that should be controlled
p.31