1
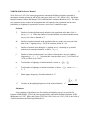
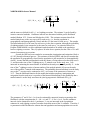
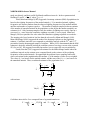
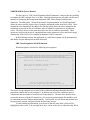
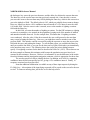
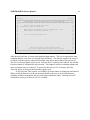
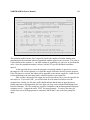
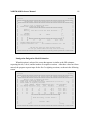
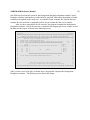
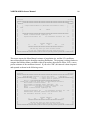
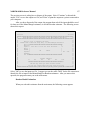
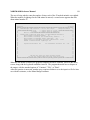
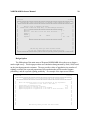
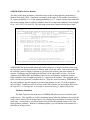
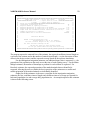
January 25, 1996
Gary C. White
Department of Fishery and Wildlife
Colorado State University
Fort Collins, CO 80523
(970)491-6678
[email protected]
RH: NOREMARK Software Reference Manual ! White
Program NOREMARK Software Reference Manual
Gary C. White, Department of Fishery and Wildlife, Colorado State University, Fort Collins, CO
80523
Key words: closure, Lincoln-Petersen, mark-resight, maximum likelihood, population estimation,
sighting surveys.
Scientific and Technical Information
Estimation of population size of a geographically and demographically closed but freeranging population is a common problem encountered by wildlife biologists. The earliest
approaches to this problem were developed by Petersen (1896) and later Lincoln (1930), where
capture-recapture techniques were applied. Extensions to the simple 2 occasion Lincoln-Petersen
estimator were developed for multiple occasions (Schnabel 1938, Darroch 1958), for removal
experiments (Zippin 1956, 1958), and for heterogeneity of individual animals (Burnham and
Overton 1978, 1979, Chao 1988). For the capture-recapture technique, Otis et al. (1978) and
White et al. (1982) provided a summary of the available methods, and others (White et al. 1978,
Rexstad and Burnham 1991) describe Program CAPTURE for computing these estimators of
population size.
More technologically advanced approaches to the problem of abundance estimation have
incorporated animals marked with radio transmitters. The initial sample of animals is captured
and marked with radios, but recaptures of these animals are obtained by only observing them, not
actually recapturing them. The limitation of this procedure is that unmarked animals are not
marked on subsequent occasions. The advantage of this procedure is that resighting occasions are
generally much cheaper to acquire than when the animals must be physically captured and
handled. The mark-resight procedure has been tested with known populations of mule deer
(Bartmann et al. 1987), and used with white-tailed deer (Rice and Harder 1977), mountain sheep
(Furlow et al. 1981, Neal et al. 1993), black and grizzly bears (Miller et al. 1987), and coyotes
(Hein 1992). Eberhardt (1990) further investigated the Petersen estimator with the Chapman
correction (Chapman 1951) for small population sizes where animals could immigrate/emigrate
from the study area.
Here, I present a user's manual for Program NOREMARK, a program to compute markresight estimators of population abundance. Four estimators of abundance are provided: the joint
hypergeometric maximum likelihood estimator (JHE) (Bartmann et al. 1987, White and Garrott
NOREMARK Reference Manual
2
1990, Neal et al. 1993), the joint hypergeometric maximum likelihood estimator extended to
incorporate animals moving on and off the study area (Neal et al. 1993, White 1993), the MintaMangel estimator (Minta and Mangel 1989), and Bowden's estimator (Bowden 1993). The latter
two estimators do not require the assumption that each animal in the population has the same
probability of resighting on a particular occasion, as the first 2 estimators require.
Notation
Ti
Number of marked (telemetered) animals in the population at the time of the ith
survey, i=1,...,k. When the number of marked animals is assumed constant across
surveys, the value is denoted as T. .
Mi
Number of marked animals in the population that are on the area surveyed at the
time of the ith sighting survey. For all Mi constant, define M / Mi.
ni
Number of animals seen during the ith sighting survey, consisting of mi marked
animals and ui unmarked animals, so that ni = mi + ui.
fi
Number of times marked animal i was observed during the k surveys (sighting
frequencies), i = 1, ..., T. . Note that this is not the same use of f j as in Otis et al.
(1978) or White et al. (1982).
m.
Total number of sightings of marked animals, so that m. = 3mi = 3fi.
u.
Total number of sightings of unmarked animals, so that u. = 3ui , where i = 1, ...,
N - T. .
f¯
Mean capture frequency of marked animals, m./T. .
¯2
j (f i & f )
T.
2
sf
2
Variance of the sighting frequencies of the marked animals, sf '
i'1
T.
.
Estimators
Four estimators of population size for marking and sighting surveys are provided in
Program NOREMARK. First is the joint hypergeometric maximum likelihood estimator (JHE)
(Bartmann et al. 1987, White and Garrott 1990, Neal 1990, Neal et al. 1993). JHE is the value of
^
N which maximizes the following likelihood (N):
NOREMARK Reference Manual
3
‹(N | M, n i , mi ) ' k
k
M
mi
N & M
ni & mi
(1)
N
ni
i'1
and the terms are defined for all i = 1 to k sighting occasions. The estimate N^ can be found by
iterative numerical methods. Confidence intervals are determined with the profile likelihood
method (Hudson 1971, Venzon and Moolgavkar 1988). This estimator assumes that all the
marked animals are on the area surveyed for each survey, i.e., that the population is
geographically and demographically closed, and thus N is the same for each survey. The number
of marked animals (M) is the same for each survey in the above equation, although the probability
of sighting animals is not assumed to be the same for each survey. An extension allowed in
Program NOREMARK is to allow additional marked animals to be added to the population
between sighting occasions. Thus, Mi replaces M in the above equation, but the value of N is still
assumed constant across occasions.
Second, the JHE has been extended to accommodate immigration and emigration (Neal et
al. 1993) through a binomial process. This estimator is labeled IEJHE, and does not assume that
the population is geographically closed (but the population is still assumed to be demographically
closed). Assume that the total population with any chance of being observed on the study area is
N*, and that at the time of the ith sighting survey, Ni animals occur on the study area. I am
interested in estimating the mean number of animals on the study area, N , and possibly N*. At the
time of the ith sighting occasion, a known number of the marked animals (Mi) are on the study
area of the possible Ti animals with transmitters. The probability that an individual is on the study
area on the ith occasion can be estimated as Mi/Ti, or in terms of the parameters of interest as
Ni/N*. Then the likelihood function for the model that includes temporary immigration and
emigration from the study area is a product of the binomial distribution for the probability that a
marked animal is on the study area times the joint hypergeometric likelihood of Eq. (1):
‹(N (, Ni | Ti , Mi , m i , ni ) ' k
k
i'1
Ti
Ni
Mi
N(
Mi
1 &
Ni
N(
T i & Mi
Mi
Ni & M i
mi
ni & m i
Ni
(2)
ni
The parameters N* and Ni for i=1 to k can be estimated by numerical iteration to maximize this
likelihood, with the constraints that Ni > (Mi + ui) and N* > Ni for i=1 to k. Profile confidence
intervals can be obtained for the k+1 parameters. I was not interested in the k population
estimates for each sighting occasion, but rather desired the mean of the Ni estimates. Therefore, I
re-parameterized the likelihood to estimate the total population and mean population size on the
NOREMARK Reference Manual
4
study area directly, and their profile likelihood confidence intervals. In the re-parameterized
likelihood, I used Ni = N + "i, where 3 "i = 0.
Third, Minta and Mangel (1989) suggested a bootstrap estimator (MM) of population size
based on the sighting frequencies of the marked animals, fi. For unmarked animals, sighting
frequencies are drawn at random from the observed sighting frequencies of the marked animals
until the total number of captures equals u. . The number of animals sampled is then an estimate
of the number of unmarked animals in the population, so that M plus the number sampled is an
estimator for N. Only bootstrap samples where the number of sightings was exactly equal to u.
were used, i.e., cases where the cumulative sightings exceeded u. were rejected. Minta and
Mangel (1989) accepted the first value where the cumulative sightings equalled or exceeded u. .
The stopping rule I used results in less bias than the rule used by Minta and Mangel (1989).
Minta and Mangel (1989) suggested the mode of the bootstrap replicates as the population
estimate. Confidence intervals were computed as probability intervals with the 2.5th and 97.5th
percentiles from the bootstrapped sample of estimates. White (1993) demonstrated that the MM
estimator is basically unbiased, but that the confidence interval coverage was not at the expected
95% for "=0.05. He suggested a modified procedure, but coverage still was not satisfactory.
Fourth, Bowden (1993) suggested an estimator for the Minta-Mangel model where the
confidence intervals on the estimate were computed based on the variance of the resighting
frequencies of the marked animals. He approached the problem from a sampling framework,
where each animal in the population has the attribute fi of the number of times it was resighted.
The values of fi are known for the marked animals, and the sum of the fi's (= u.) are known for
the unmarked animals. Then, an unbiased estimator of the population size is
2
N̂ '
sf
(u. % m.)
%
2
f¯
f¯
2
1 %
sf
T.f¯
2
with variance
2
Vâr(N̂) ' N̂
2
1
1 sf
&
T.
N̂ f¯ 2
1 %
2
2
sf
T.f¯
.
2
Confidence intervals for N are computed from a log-transformation as
N̂ / exp t1
&
ˆ
CV(N̂)
"
, T. & 1
2
and N̂ × exp t1
&
ˆ
CV(N̂)
"
, T. & 1
2
NOREMARK Reference Manual
ˆ N̂) is Var(
ˆ N̂)1/2/N̂ and t
where CV(
1&
5
"
, T. & 1
2
is a t distribution with T. - 1 degrees of freedom.
User's Guide and Demonstration Runs
Program NOREMARK executed with the command
NOREMARK
typed at the DOS prompt. The following menu appears.
01/05/94
Memory Available = 141
10:47:57
64444444444444444444444444444444444444444444444444444444444444444444444444444447
5
DESIGN AND ANALYSIS OF MARK-RESIGHT EXPERIMENTS
5
:444444444444444444444444444444444444444444444444444444444444444444444444444444<
5
5
5
5
5
JHE Closed Population Model Estimation
5
5
Immigration/Emigration Model Estimation
5
5
Minta-Mangel Model Estimation
5
5
Bowden's Model Estimation
5
5
Design Experiment Using Interpolation for Closed Population
5
5
JHE Closed Population Model Simu ation
5
5
Immigration/Emigration Model Simulation
5
5
Minta-Mangel Estimator Simulation
5
5
Bowden's Estimator Simulation
5
5
5
5
Estimate Population Size for No Immigration/Emigration with JHE
5
94444444444444444444444444444444444444444444444444444444444444444444444444444448
EXIT
The ESC key takes you back one menu screen.
You can get context-sensitive help with the F1 key.
Nine options are presented for the user to select from. To select a choice the user can
either specify the first letter of the choice, or use the arrow keys to move the cursor to the choice.
After the cursor is positioned on the desired choice, the user hits the Enter key to execute the
option. For computers with a mouse, the mouse cursor can be moved to the desired option, and
double clicked on the option to select the choice. The line "Estimate Population Size for No
Immigration/Emigration with JHE" provides additional detail about each of the choices and
changes as you move the cursor to different selections from the 9 choices.
The function key F1 is the help function. Context-sensitive help can be obtained any time
the program is waiting for input by hitting the F1 key. A window will pop up on the screen
displaying information about the program's request. To exit this window, hit the Esc key, which
is equivalent to selecting the "Exit" option from the menu choices. In general, the Esc key always
takes you back one window to a previous menu.
NOREMARK Reference Manual
6
The first choice is "JHE Closed Population Model Estimation", and provides the capability
to compute the JHE estimator for a set of data. Equivalent functions are provided with the next 3
options, for computing the Immigration/Emigration JHE, Minta-Mangel, and Bowden's
estimators. The fifth option, "Design Experiment Using Interpolation for Closed Population"
allows the user to quickly design a survey using the simulation results from Neal (1990). These
simulations were summarized in a dBase file, and this option allows the user to interpolate the
simulations to provide an idea of confidence interval length for a particular set of parameter
values. The last 4 choices in the main menu allow the user to simulate experiments. These
options are useful in the design of experiments that require parameter values outside the ranges
simulated by Neal (1990), or to compare performance of the 4 estimators..
In the following sections, the application of each of these options will be demonstrated,
and details of input and output from them discussed.
JHE Closed Population Model Estimation
When this option is selected, the following screen appears.
04/20/93
09:41:32
64444444444444444444444444444444444444444444444444444444444444444444444444444447
5
Mark-Resight Population Estimation for Closed Populations
5
:444444444444444444444444444444444444444444444444444444444444444444444444444444<
5
5
5
Enter a title to identify the data:
5
5
5
5
5
5
Alpha level for confidence interval construction:
5
5
Enter number of sighting occasions:
5
5
5
5
5
5
Hit F2 to retrieve an input file
5
5
5
5
5
5
5
5
5
5
5
5
5
5
5
5
5
5
5
5
The ESC key takes you back one menu screen.
5
5
You can get context-sensitive help with the F1 key.
5
944444444444444444444444444Top4444Bot444444444444444444444444444Top4444Bot444448
This screen is requesting the user to enter a title or other identifying information about the
population estimate that is to be computed. In addition, the " level for confidence interval
construction and the number of occasions are being asked for. The note at the bottom of the
screen tells the user to hit the F2 function key if a previously prepared input file should be used
for estimation instead of entering data manually. At this point, we will assume that no data have
been previously entered, and proceed with the data entry process.
To enter identifying information, type the text in the title entry block, which will be
highlighted on the screen. Left and right arrow keys can be used to move within the entry block,
NOREMARK Reference Manual
7
the backspace key erases the previous character, and the delete key deletes the current character.
The Insert key can be used to insert text into previously entered text. Once the title is correct,
you move the cursor to the next data entry field by hitting the Enter key, which in this case moves
you to the alpha level field. The default value is 0.05, which you probably do not want to change.
However, should you desire a 90% confidence interval instead of a 95% interval, enter the value
0.10 in this field. After the correct value is entered, move to the number of sighting occasions
field with the Enter key.
In this field, you enter the number of sighting occasions. For the JHE estimator, a sighting
occasion is an attempt to view animals in the population, keeping track of the number of marked
and unmarked animals observed. For the example here, I'll assume that 14 sighting occasions
were conducted. After the value 14 has been entered, the user could proceed to the next data
entry screen by hitting the Enter key. However, you might have noted a mistake in one of the
previous fields. This mistake could be corrected by using the up arrow to move the cursor to the
field with the error, and making the change. To exit the data screen, you could hit the Enter key
until you reach the last field, or you can use the short cut key PgDn, which takes you immediately
to the next data entry screen. The following shows the screen just prior to hitting return to
specify 14 resighting occasions for the data set described in Neal et al. (1993). These data are not
the best example to illustrate this estimator with because the population was not closed, as is
assumed by this estimator. However, I believe it is informative to see the difference in the results
from this estimator and the immigration-emigration estimator, which is appropriate for these data.
The user has specified a title to identify the data. In addition, an " level for computing
confidence intervals has been specified as 0.05, giving a 95% confidence interval. Finally, 14
recapture occasions have been specified.
Note that additional information is available on any of these input requests by hitting the
F1 (Help) key. A description of the input being requested will be poped on the screen for the user
to read. To return to entering data, just hit Esc to exit the help screen.
NOREMARK Reference Manual
02/01/94
8
14:55:53
64444444444444444444444444444444444444444444444444444444444444444444444444444447
5
Mark-Resight Population Estimation for Closed Populations
5
:444444444444444444444444444444444444444444444444444444444444444444444444444444<
5
5
5
Enter a title to identify the data:
5
5
Andrea Neal's Mountain Sheep Data
5
5
5
5
Alpha level for confidence interval construction: 0.05
5
5
Enter number of sighting occasions: 14
5
5
5
5
5
5
Hit F2 to retrieve an input file
5
5
5
5
5
5
5
5
5
5
5
5
5
5
5
5
5
5
5
5
The ESC key takes you back one menu screen.
5
5
You can get context-sensitive help with the F1 key.
5
944444444444444444444444444Top4444Bot4444Help4444PgUp4444PgDn4444Return4444ESC48
After the user hits Enter, a screen requesting data input appears. The user is requested to enter
resighting data for each of the 14 occasions specified above. The data are requested in sets of 5
occasions, with the option to edit each block after entry before proceeding to the next set of 5.
The first 5 occasions appear on the screen. After the first 5 occasions were entered, the LincolnPetersen estimate is computed for each occasion. This output is useful in evaluating whether the
correct recapture data were entered. To proceed to the next set of 5 occasions, select the
"Proceed" option as shown in the following output screen.
If you select the "Edit" option, you would be given the chance to change the data entered.
When you hit the Enter key on the last occasion shown on the screen, the Lincoln-Petersen
estimates would be recomputed, and you could again evaluate the input. Selecting "Proceed"
would allow you to go to the next set of 5 occasions.
NOREMARK Reference Manual
02/01/94
9
14:55:53
64444444444444444444444444444444444444444444444444444444444444444444444444444447
5
Mark-Resi?444444444444444444444444444444444444444@lations
5
:4444444444444444444*
*444444444444444444<
5
* More data entry, or edit screen...
*
5
5
Enter a ti*
*
5
5
Andrea Neal's M*
*
5
5
*
Proceed
Edit
*
5
5
Alpha leve*
*0.05
5
5
Enter numb*
*
5
5
B444444444444444444444444444444444444444A
5
5
Marked
Marked
Unmarked Lin.-Pet.
95% Confidence
5
5
Occ. Available Seen
Seen
Estimate
Interval
5
5
---- --------- ------- -------- --------- ---------------5
5
1
22
9
31
93.3
56.9 - 129.7
5
5
2
21
11
52
116.3
77.6 - 155.1
5
5
3
21
14
52
97.3
73.3 - 121.2
5
5
4
20
11
46
100.5
68.3 - 132.7
5
5
5
20
10
42
100.2
65.0 - 135.3
5
5
5
5
5
5
5
5
The ESC key takes you back one menu screen.
5
5
You can get context-sensitive help with the F1 key.
5
944444444444444444444444444Top4444Bot4444Help4444PgUp4444PgDn4444Return4444ESC48
After selecting "Proceed" for the above screen, the user would enter the next set of 5 occasions,
and then the final set of 4 occasions.
After the user selects "Proceed" for the last occasion, the Joint Hypergeometric Maximum
Likelihood Estimator (JHE) is computed. This numerical optimization can take a few seconds, so
the user should not expect an instant response. The following screen shows the output produced.
NOREMARK Reference Manual
02/01/94
10
14:55:53
64444444444444444444464444444444444444444444444444444444444744444444444444444447
5
Mark-Resig5 Continue -- Do not save output
5ulations
5
:444444444444444444445 File
-- Output saved to a file 54444444444444444444<
5
5 Print
-- Output saved to printer 5
5
5
Enter a tit944444444444444444444444444444444444448
5
5
Andrea Neal's Mountain Sheep Data
5
5
5
5
Alpha level for confidence interval construction: 0.05
5
5
Enter number of sighting occasions: 14
5
5
5
5
Marked
Marked
Unmarked Lin.-Pet.
95% Confidence
5
5
Occ. Available Seen
Seen
Estimate
Interval
5
5
---- --------- ------- -------- --------- ---------------5
5
11
20
14
55
97.0
74.2 - 119.8
5
5
12
17
6
29
91.6
46.6 - 136.6
5
5
13
20
13
38
77.0
57.5 - 96.5
5
5
14
21
17
40
69.9
58.6 - 81.2
5
5
Minimum number known alive is 90
5
5
Population Estimate: 100
95% Confidence Interval: 94 - 108
5
5
5
5
5
5
The ESC key takes you back one menu screen.
5
5
You can get context-sensitive help with the F1 key.
5
944444444444444444444444444Top4444Bot4444Help4444PgUp4444PgDn4444Return4444ESC48
The minimum number known alive is reported, which is the number of marked animals in the
population plus the maximum number of unmarked animals sighted on any occasion. This value is
a lower bound on the estimate, i.e., the JHE estimate of population size can never be less than this
value. Next, the population estimate is shown, with the 95% profile likelihood confidence
interval.
At the top of the above screen the program is requesting whether to proceed, or to save
the output to a file for later printing, or to print the output at this time directly from the program.
If the File option is selected, the output can be appended to the current output file, so that several
screens pertaining to the same data can be collected together in one output file.
After you have disposed of the output, the next screen allows you to save the input file for
later retrieval. If you select "OK", you will be asked for a file name in which to store the
recapture data. Ideally, the file name suffix should indicate that the data are hypergeometric
format input data, to distinguish the file from others you may create with the Minta-Mangel and
Bowden estimators. The file created here would be compatible with the Immigration-Emigration
estimator as well. I suggest the suffix "HYP" for hypergeometric. To retrieve the data, you
would select one of the hypergeometric estimators, and hit the F2 key at the first prompt for
input.
NOREMARK Reference Manual
02/01/94
11
16:16:46
64444444444444444444444444444444444444444444444444444444444444444444444444444447
5
Mark-Resight Population Estimation for Closed Populations
5
:444444444444444444444444444444444444444444444444444444444444444444444444444444<
5
5
5
Enter a title to identify the data:
5
5
Andrea Neal's Mountain Sheep Data
5
5
?444444444444444444444444444444444444444444444@
5
5
Alpha l*
*5
5
5
Enter n* Save data to file for later retrieval...
*
5
5
*
*
5
5
Marked*
*e
5
5
Occ. Availab*
OK
Cancel
*
5
5
---- -------*
*-5
5
11
20 *
*.8
5
5
12
17 B444444444444444444444444444444444444444444444A.6
5
5
13
20
13
38
77.0
57.5 - 96.5
5
5
14
21
17
40
69.9
58.6 - 81.2
5
5
Minimum number known alive is 90
5
5
Population Estimate: 100
95% Confidence Interval: 94 - 108
5
5
5
5
5
5
The ESC key takes you back one menu screen.
5
5
You can get context-sensitive help with the F1 key.
5
944444444444444444444444444Top4444Bot4444Help4444PgUp4444PgDn4444Return4444ESC48
Immigration-Emigration Model Estimation
When this option is selected, the screen that appears is similar to the JHE estimator,
requesting the title, " level, and the number of recapture occasions. After these values have been
entered, the program requests input for the first 5 resighting occasions, as shown in the following
screen.
02/01/94
15:55:57
64444444444444444444444444444444444444444444444444444444444444444444444444444447
5
Mark-Resight Estimation for Populations with Immigration/Emigration
5
:444444444444444444444444444444444444444444444444444444444444444444444444444444<
5
Enter a title to identify the data:
5
5
Andrea Neal's Mountain Sheep Data
5
5
Alpha level for Confidence Interval Construction (0.01-0.50):
0.05
5
5
Enter number of sighting occasions:
14
5
5
Total Marked
Marked Unmarked Lin.-Pet.
95% Confidence
5
5
Occ. Marked Available Seen
Seen
Estimate
Interval
5
5
---- ------ --------- ------- -------- --------- ---------------5
5
1
25
22
9
31
93.3
56.9 - 129.7
5
5
2
25
21
11
52
116.3
77.6 - 155.1
5
5
3
25
21
14
52
97.3
73.3 - 121.2
5
5
4
25
20
11
46
100.5
68.3 - 132.7
5
5
5
25
20
10
42
100.2
65.0 - 135.3
5
5
?444444444444444444444444444444444444444@
5
5
*
*
5
5
* More data entry, or edit screen...
*
5
5
*
*
5
5
*
*
5
5
*
Proceed
Edit
*
5
5
T*
*.
5
5
You *
*1 key.
5
94444444444444444444B444444444444444444444444444444444444444A4444Return4444ESC48
NOREMARK Reference Manual
12
One difference between this screen for the Immigration-Emigration Estimator and the Closed
Estimator is that the total number of radios must be specified, followed by the number of radios
available to be sighted on the study area. As with the Closed estimator, the Lincoln-Petersen
estimate for each occasion is computed to allow you to evaluate the data you've entered.
After you have entered data for all occasions, the program computes the ImmigrationEmigration estimates. Before this process is conducted, the program gives you a chance to save
the data you have input, as shown in the following screen.
02/01/94
15:55:57
64444444444444444444444444444444444444444444444444444444444444444444444444444447
5
Mark-Resight Estimation for Populations with Immigration/Emigration
5
:444444444444444444444444444444444444444444444444444444444444444444444444444444<
5
Enter a title to identify the data:
5
5
Andrea Neal's Mountain Sheep Data
5
5
Alpha level for Confidence Interval Construction (0.01-0.50):
0.05
5
5
Enter number?444444444444444444444444444444444444444444444@
14
5
5
Total *
*idence
5
5
Occ. Marked * Save data to file for later retrieval...
*val
5
5
---- ------ *
*------5
5
11
25 *
* 119.8
5
5
12
25 *
OK
Cancel
* 136.6
5
5
13
25 *
* 96.5
5
5
14
25 *
* 81.2
5
5
B444444444444444444444444444444444444444444444A
5
5
5
5
Total Population Minimum Number Known Alive:
93
5
5
5
5
5
5
5
5
5
5
The ESC key takes you back one menu screen.
5
5
You can get context-sensitive help with the F1 key.
5
944444444444444444444444444Top4444Bot4444Help4444PgUp4444PgDn4444Return4444ESC48
After you have saved your data, or chosen not to, the program computes the ImmigrationEmigration estimates. The following screen shows this output.
NOREMARK Reference Manual
02/01/94
13
15:55:57
64444444444444444444464444444444444444444444444444444444444744444444444444444447
5
Mark-Resight Es5 Continue -- Do not save output
5on/Emigration
5
:444444444444444444445 File
-- Output saved to a file 54444444444444444444<
5
Enter a tit5 Print
-- Output saved to printer 5
5
5
Andrea Neal's Mo944444444444444444444444444444444444448
5
5
Alpha level for Confidence Interval Construction (0.01-0.50):
0.05
5
5
Enter number of sighting occasions:
14
5
5
Total Marked
Marked Unmarked Lin.-Pet.
95% Confidence
5
5
Occ. Marked Available Seen
Seen
Estimate
Interval
5
5
---- ------ --------- ------- -------- --------- ---------------5
5
11
25
20
14
55
97.0
74.2 - 119.8
5
5
12
25
17
6
29
91.6
46.6 - 136.6
5
5
13
25
20
13
38
77.0
57.5 - 96.5
5
5
14
25
21
17
40
69.9
58.6 - 81.2
5
5
5
5
5
5
Total Population Minimum Number Known Alive:
93
5
5
Total Population Estimate:
120
5
5
95% CI on Total Population Estimate:
109.1
132.9
5
5
Daily Population Estimate:
96.1
5
5
95% CI on Daily Population Estimate:
88.7
105.5
5
5
The ESC key takes you back one menu screen.
5
5
You can get context-sensitive help with the F1 key.
5
944444444444444444444444444Top4444Bot4444Help4444PgUp4444PgDn4444Return4444ESC48
The minimum number of animals known to be alive is computed, with this value serving as a
lower bound on the possible estimates of the total number of animals. Next, the total population
size and its 95% profile likelihood confidence interval is shown, followed by the average daily
population estimate and its 95% profile likelihood confidence interval.
At the top of the screen, the program is requesting how to dispose of this output. You
can continue and discard the output, or store the output in a file, or print the output directly to a
printer.
Minta-Mangel Model Estimation
When this option is selected, the screen that appears is
NOREMARK Reference Manual
02/01/94
14
16:37:35
64444444444444444444444444444444444444444444444444444444444444444444444444444447
5
Mark-Resight Population Estimation for Minta-Mangel Estimator
5
:444444444444444444444444444444444444444444444444444444444444444444444444444444<
5
5
5
Enter a title to identify the data:
5
5
Andrea Neal's Mountain Sheep Data, for Minta-Mangel Estimator
5
5
Enter number of marked animals:
25
5
5
Enter number of unmarked animal sightings:
615
5
5
Alpha level for confidence interval construction: 0.05
5
5
Enter number of bootstraps to perform: 10000
5
5
5
5
5
5
Hit F2 to retrieve an input file
5
5
5
5
5
5
5
5
5
5
5
5
5
5
5
5
5
5
The ESC key takes you back one menu screen.
5
5
You can get context-sensitive help with the F1 key.
5
944444444444444444444444444Top4444Bot4444Help4444PgUp4444PgDn4444Return4444ESC48
In the above screen, a title to identify the output has been entered. The number of marked
animals was entered as 25, with 615 unmarked animals sighted during the surveys. For
confidence interval construction, " has been entered as 0.05 to obtain 95% confidence intervals.
Finally, the Minta-Mangel estimator is based on a bootstrap procedure, so the number of
bootstraps to perform is requested. The value 10,000 is adequate, as suggested by Minta and
Mangel (1989).
When the user hits the Enter key, the program requests input on the number of times each
marked animal was observed.
NOREMARK Reference Manual
02/01/94
15
16:37:35
64444444444444444444444444444444444444444444444444444444444444444444444444444447
5
Mark-Resight Population Estimation for Minta-Mangel Estimator
5
:444444444444444444444444444444444444444444444444444444444444444444444444444444<
5
5
5
Enter a title to identify the data:
5
5
Andrea Neal's Mountain Sheep Data, for Minta-Mangel Estimator
5
5
Enter number of marked animals:
25
5
5
Enter number of unmarked animal sightings:
615
5
5
Alpha level for confidence interval construction: 0.05
5
5
Enter number of bootstraps to perform: 10000
5
5
Animal
Times
Animal
Times
Animal
Times
5
5
Number
Seen
Number
Seen
Number
Seen
5
5
------- ------------- ------------- ------5
5
1
10
9
2
17
4
5
5
2
9
10
5
18
9
5
5
3
3
11
8
19
4
5
5
4
6
12
9
20
3
5
5
5
7
13
8
21
6
5
5
6
5
14
3
22
6
5
5
7
5
15
12
23
6
5
5
8
12
16
10
24
3
5
5
The ESC key takes you back one menu screen.
5
5
You can get context-sensitive help with the F1 key.
5
944444444444444444444444444Top4444Bot4444Help4444PgUp4444PgDn4444Return4444ESC48
Each column appears as you complete the proceeding column of entries. For the example here,
an additional page of input is requested, because 25 animals were marked. After the user hits the
Enter key for the last animals, the program performs the bootstrap process. This process can take
from a few minutes to several hours, depending on the number of unmarked animals observed and
the number of bootstraps requested. A progress bar is shown on the screen to allow the user to
see that progress is being made. Once the bootstrap procedure is completed, the following screen
appears.
NOREMARK Reference Manual
02/01/94
16
16:37:35
64444444444444444444444444444444444444444444444444444444444444444444444444444447
5
?444444444444444444444444444444444444444444444444444444444444444@
5
:4444444*
*444444<
5
* Compute Robbins-Monro CI (Buckland and Garthwaite 1990)...
*
5
5
*
*
5
5
And*
*
5
5
*
OK
Cancel
*
5
5
*
*
5
5
*
*
5
5
B444444444444444444444444444444444444444444444444444444444444444A
5
5
Number of marked animal sightings: 162
5
5
5
5
Population Estimate: 119
95% Confidence Interval: 112 - 128
5
5
5
5
5
5
5
5
5
5
Percent Complete
5
5
0%
20%
40%
60%
80%
100%
5
5
$$$$$$$$$$$$$$$$$$$$$$$$$$$$$$$$$$$$$$$$$$$$$$$$$+
5
5
5
5
The ESC key takes you back one menu screen.
5
5
You can get context-sensitive help with the F1 key.
5
944444444444444444444444444Top4444Bot4444Help4444PgUp4444PgDn4444Return4444ESC48
This screen reports the Minta-Mangel estimate of population size, and the 95% confidence
interval determined from the bootstrap sampling distribution. The program is asking whether to
compute the Robbins-Monro confidence interval procedure (discussed in White 1993), a more
precise estimator of the confidence interval. If you select "OK", this interval is then computed
and reported as shown in the following screen.
02/01/94
16:37:35
64444444444444444444464444444444444444444444444444444444444744444444444444444447
5
Mark-Resight5 Continue -- Do not save output
5 Estimator
5
:444444444444444444445 File
-- Output saved to a file 54444444444444444444<
5
5 Print
-- Output saved to printer 5
5
5
Enter a tit944444444444444444444444444444444444448
5
5
Andrea Neal's Mountain Sheep Data, for Minta-Mangel Estimator
5
5
Enter number of marked animals:
25
5
5
Enter number of unmarked animal sightings:
615
5
5
Alpha level for confidence interval construction: 0.05
5
5
Enter
bootstraps to perform: 10000
5
5
Number of marked animal sightings: 162
5
5
5
5
Population Estimate: 119
95% Confidence Interval: 112 - 128
5
5
Robbins-Monro Procedure (Buckland and Garthwaite 1990)
5
5
95% Confidence Interval: 107.60 - 130.97
5
5
5
5
5
5
Percent Complete
5
5
0%
20%
40%
60%
80%
100%
5
5
$$$$$$$$$$$$$$$$$$$$$$$$$$$$$$$$$$$$$$$$$$$$$$$$$+
5
5
5
5
The ESC key takes you back one menu screen.
5
5
You can get context-sensitive help with the F1 key.
5
944444444444444444444444444Top4444Bot4444Help4444PgUp4444PgDn4444Return4444ESC48
NOREMARK Reference Manual
17
The previous screen is asking how to dispose of the output. Select "Continue" to discard the
output, "File" to save the output to a file, and "Print" to print the output on a printer connected to
your computer.
After you have disposed of the output, the program then asks if the input should be saved
for later use in the Minta-Mangel estimator, or also the Bowden estimator. The following screen
shows this request.
02/01/94
16:37:35
64444444444444444444444444444444444444444444444444444444444444444444444444444447
5
Mark-Resight Population Estimation for Minta-Mangel Estimator
5
:444444444444444444444444444444444444444444444444444444444444444444444444444444<
5
5
5
Enter a title to identify the data:
5
5
Andrea Neal's Mountain Sheep Data, for Minta-Mangel Estimator
5
5
Enter n?444444444444444444444444444444444444444444444@
5
5
Enter n*
*
5
5
Alpha l* Save data to file for later retrieval...
*5
5
5
Enter *
*
5
5
Number *
*
5
5
*
OK
Cancel
*
5
5
Populat*
* 112 - 128
5
5
Robbins*
*
5
5
95% ConB444444444444444444444444444444444444444444444A
5
5
5
5
5
5
Percent Complete
5
5
0%
20%
40%
60%
80%
100%
5
5
$$$$$$$$$$$$$$$$$$$$$$$$$$$$$$$$$$$$$$$$$$$$$$$$$+
5
5
5
5
The ESC key takes you back one menu screen.
5
5
You can get context-sensitive help with the F1 key.
5
944444444444444444444444444Top4444Bot4444Help4444PgUp4444PgDn4444Return4444ESC48
Select "OK" to save the input to a file. I suggest you use the suffix "MM" for the file extension to
identify the file as input for the Minta-Mangel or Bowden estimators. After you answer this
question, the program returns you to the main menu.
Bowden Model Estimation
When you select this estimator from the main menu, the following screen appears.
NOREMARK Reference Manual
02/01/94
18
17:47:16
64444444444444444444444444444444444444444444444444444444444444444444444444444447
5
Mark-Resight Population Estimation for Bowden's Minta-Mangel Estimator
5
:444444444444444444444444444444444444444444444444444444444444444444444444444444<
5
5
5
Enter a title to identify the data:
5
5
Andrea Neal's Mountain Sheep Data, for Minta-Mangel Estimator
5
5
Enter number of marked animals:
25
5
5
Enter number of marked, but unidentified, animals:
0
5
5
Enter number of unmarked animal sightings:
615
5
5
Alpha level for confidence interval construction: 0.050
5
5
5
5
5
5
Hit F2 to retrieve an input file
5
5
5
5
5
5
5
5
5
5
5
5
5
5
5
5
5
5
The ESC key takes you back one menu screen.
5
5
You can get context-sensitive help with the F1 key.
5
944444444444444444444444444Top4444Bot4444Help4444PgUp4444PgDn4444Return4444ESC48
The user has specified a title to identify the output, and that 25 marked animals are to be used for
the analysis. The number of marked, but unidentified, animals are the number of sightings where
a marked animal was noted, but its unique identification was not ascertained. For Neal's study, no
marked animals were not identified. Next is the number of unmarked animals counted, 615.
Finally, the " level for use in confidence interval construction is specified. When the user hits the
Enter key on this last input value, the following screen appears.
02/01/94
17:47:16
64444444444444444444444444444444444444444444444444444444444444444444444444444447
5
Mark-Resight Population Estimation for Bowden's Minta-Mangel Estimator
5
:444444444444444444444444444444444444444444444444444444444444444444444444444444<
5
5
5
Enter a title to identify the data:
5
5
Andrea Neal's Mountain Sheep Data, for Minta-Mangel Estimator
5
5
Enter number of marked animals:
25
5
5
Enter number of marked, but unidentified, animals:
0
5
5
Enter number of unmarked animal sightings:
615
5
5
Alpha level for confidence interval construction: 0.050
5
5
Animal
Times
Animal
Times
Animal
Times
5
5
Number
Seen
Number
Seen
Number
Seen
5
5
------- ------------- ------------- ------5
5
1
10
9
2
17
4
5
5
2
9
10
5
18
9
5
5
3
3
11
8
19
4
5
5
4
6
12
9
20
3
5
5
5
7
13
8
21
6
5
5
6
5
14
3
22
6
5
5
7
5
15
12
23
6
5
5
8
12
16
10
24
3
5
5
The ESC key takes you back one menu screen.
5
5
You can get context-sensitive help with the F1 key.
5
944444444444444444444444444Top4444Bot4444Help4444PgUp4444PgDn4444Return4444ESC48
NOREMARK Reference Manual
19
The user is being asked to enter the number of times each of the 25 marked animals were sighted.
When the number of sightings for the 24th animal is entered, a second screen appears that asks
about animal number 25.
02/01/94
17:47:16
64444444444444444444464444444444444444444444444444444444444744444444444444444447
5
Mark-Resight Pop5 Continue -- Do not save output
5angel Estimator
5
:444444444444444444445 File
-- Output saved to a file 54444444444444444444<
5
5 Print
-- Output saved to printer 5
5
5
Enter a tit944444444444444444444444444444444444448
5
5
Andrea Neal's Mountain Sheep Data, for Minta-Mangel Estimator
5
5
Enter number of marked animals:
25
5
5
Enter number of marked, but unidentified, animals:
0
5
5
Enter number of unmarked animal sightings:
615
5
5
Alpha level for confidence interval construction: 0.050
5
5
Number of marked animal sightings: 162
5
5
5
5
Population Estimate: 119
95% Confidence Interval: 101 - 140
5
5
5
5
5
5
5
5
5
5
5
5
5
5
5
5
5
5
The ESC key takes you back one menu screen.
5
5
You can get context-sensitive help with the F1 key.
5
944444444444444444444444444Top4444Bot4444Help4444PgUp4444PgDn4444Return4444ESC48
When the last animal is entered, the program computes Bowden's estimator, shown in the above
screen, along with the log-based confidence interval. The program then asks how to dispose of
the output, with the standard options of "Continue", "File", or "Print".
After this question is answered, another query requests whether to save the input in a file for later
use with this estimator, or the Minta-Mangel estimator.
NOREMARK Reference Manual
02/01/94
20
17:47:16
64444444444444444444444444444444444444444444444444444444444444444444444444444447
5
Mark-Resight Population Estimation for Bowden's Minta-Mangel Estimator
5
:444444444444444444444444444444444444444444444444444444444444444444444444444444<
5
5
5
Enter a title to identify the data:
5
5
Andrea Neal's Mountain Sheep Data, for Minta-Mangel Estimator
5
5
Enter n?444444444444444444444444444444444444444444444@
5
5
Enter n*
* 0
5
5
Enter n* Save data to file for later retrieval...
*
5
5
Alpha l*
*50
5
5
Number *
*
5
5
*
OK
Cancel
*
5
5
Populat*
* 101 - 140
5
5
*
*
5
5
B444444444444444444444444444444444444444444444A
5
5
5
5
5
5
5
5
5
5
5
5
5
5
The ESC key takes you back one menu screen.
5
5
You can get context-sensitive help with the F1 key.
5
944444444444444444444444444Top4444Bot4444Help4444PgUp4444PgDn4444Return4444ESC48
Design Option
The fifth option of the main menu of Program NOREMARK allows the user to design a
mark-resight survey. This design procedure uses simulation data generated by Neal (1990) based
on the joint hypergeometric estimator. The user provides values of population size, number of
sighting occasions, the expected proportion of the population that will be marked (capture
probability), and the expected sighting probability. An example of the input screen follows.
04/07/94
10:00:39
64444444444444444444444444444444444444444444444444444444444444444444444444444447
5
Expected Results for a Proposed Design Using Interpolation
5
:444444444444444444444444444444444444444444444444444444444444444444444444444444<
5
5
5
Enter the expected values of for the parameters of the experiment:
5
5
(Press ESC to exit back to main menu.)
5
5
Guesstimate of population size:
450
5
5
Expected number of sighting occasions:
8
5
5
Expected proportion of population to be marked:
0.15
5
5
Expected proportion of population to be seen on each occasions: 0.65
5
5
5
5
5
5
5
5
5
5
5
5
5
5
5
5
5
5
5
5
5
5
5
5
The ESC key takes you back one menu screen.
5
NOREMARK Reference Manual
21
The range of the input parameters is limited because results are determined by interpolating a
database from Neal (1990). Population size must be in the range 50-500, number of occasions 520, capture probability 0.1-0.5, and sighting probability 0.1-0.7. Output consists of the estimated
bias of the resulting estimate, and the confidence interval coverage and confidence interval length
for " = 0.01, 0.05, 0.10, and 0.20. The following screen shows output from the above input.
04/07/94
10:00:39
64444444444444444444464444444444444444444444444444444444444744444444444444444447
5
Expected R5 Continue -- Do not save output
5rpolation
5
:444444444444444444445 File
-- Output saved to a file 54444444444444444444<
5
5 Print
-- Output saved to printer 5
5
5
Enter the expect944444444444444444444444444444444444448experiment:
5
5
(Press ESC to exit back to main menu.)
5
5
Guesstimate of population size:
450
5
5
Expected number of sighting occasions:
8
5
5
Expected proportion of population to be marked:
0.15
5
5
Expected proportion of population to be seen on each occasions: 0.65
5
5
5
5
Estimated bias is 0.16% or 0.7 animals.
5
5
Expected 99% confidence interval is 18.4%, or 83.0 animals.
5
5
Expected 95% confidence interval is 13.9%, or 62.4 animals.
5
5
Expected 90% confidence interval is 11.6%, or 5 .1 animals.
5
5
Expected 80% confidence interval is 9.0%, or 40.3 animals.
5
5
Expected confidence interval coverage is (1-alpha)*100%.
5
5
5
5
5
5
5
5
5
5
The ESC key takes you back one menu screen.
5
5
You can get context-sensitive help with the F1 key.
5
944444444444444444444444444Top4444Bot4444Help4444PgUp4444PgDn4444Return4444ESC48
NOREMARK has generated the output and is now asking how to dispose of these results using
the same menu as shown previously to continue, print, or file the output. Note in the output that
the confidence interval length is reported as a percent of the estimate, and as the number of
animals. Confidence interval length is the difference of the upper and low limits. For all the
estimators in NOREMARK, the confidence intervals are not symmetric around the estimate.
Often confidence interval length is reported as ± a percent of the estimate. This approach is not
really valid for an asymmetric confidence interval. Thus, the values reported by NOREMARK are
the total confidence interval length as a percent of the estimate, not just 1/2 of the confidence
interval length. Confidence interval coverage of the JHE estimator was not found to differ from
the expected 1 - " coverage rate, so coverage is reported as being (1 - alpha)*100 percent.
Estimator Simulation
The final 4 options in the main menu of NOREMARK allow the user to simulate markresight surveys. This capability is useful in designing surveys when the parameters are outside the
range of those allowed for the design option, or to compare the performance of estimators for the
same input. As noted above, the design option only provides interpolated output for the joint
hypergeometric estimator. With the 4 simulation options, you can simulate each estimator for a
particular set of input values.
NOREMARK Reference Manual
22
The input for the 4 simulation options is basically the same for each estimator. Thus, I
will only present the input for joint hypergeometric estimator in detail, and mention differences for
the other 3 estimators. The input screen for simulation of the joint hypergeometric estimator is
shown below.
04/07/94
10:30:26
64444444444444444444444444444444444444444444444444444444444444444444444444444447
5
Monte Carlo Simulation of Joint Hypergeometric Estimator
5
:444444444444444444444444444444444444444444444444444444444444444444444444444444<
5
5
5
Enter the expected values of the parameters for the experiment:
5
5
Guesstimate of population size:
45
5
5
Expected number of sighting occasions:
4
5
5
Expected proportion of population to be marked:
0.30
5
5
Expected proportion of population to be seen on each occasions: 0.70
5
5
Alpha level for Confidence Interval Construction (0.01-0.50):
0.05
5
5
Number of replicates to simulate:
1000
5
5
Random number seed to initiate simulations:
4422654
5
5
5
5
5
5
5
5
5
5
5
5
5
5
5
5
5
5
5
5
The ESC key takes you back one menu screen.
5
5
You can get context-sensitive help with the F1 key.
5
944444444444444444444444444Top4444Bot4444Help4444PgUp4444PgDn4444Return4444ESC48
The input screen is requesting the size of the population, number of sighting occasions, expected
proportion of the population that will be marked, and expected proportion of the population that
will be resighted on each occasion. Next, the " level to use for confidence interval construction is
entered. The number of simulations you request determines precision of results reported. If only
a small number, such as 10, is requested, the program doesn't take long and a result that will be
quite variable will be reported. To obtain more precise results, you should specify much larger
values (such as the default of 1000), although time needed to simulate more replications can be
substantial. The last input field specifies a random number seed to initialize the random number
generator. The default value will change for each run because the default value is computed from
the current date and time set in the computer. To generate identical data for 2 different estimators
and hence achieve a better comparison of their performance, specify the same random number
seed for each estimator.
After you hit the Enter key on the last input field (or hit PgDn), the program displays a
horizontal bar showing the percent of the simulations that have been completed. This display
gives you a good idea of how long before the simulations will be completed. The following
screen shows the output for the above input.
NOREMARK Reference Manual
04/07/94
23
10:30:26
64444444444444444444464444444444444444444444444444444444444744444444444444444447
5
Monte Car5 Continue -- Do not save output
5stimator
5
:444444444444444444445 File
-- Output saved to a file 54444444444444444444<
5
5 Print
-- Output saved to printer 5
5
5
Enter the expect944444444444444444444444444444444444448eriment:
5
5
Guesstimate of population size:
45
5
5
Expected number of sighting occasions:
4
5
5
Expected proportion of population to be marked:
0.30
5
5
Expected proportion of population to be seen on each occasions: 0.70
5
5
Alpha level for Confidence Interval Construction (0.01-0.50):
0.05
5
5
Number of replicates to simulate:
1000
5
5
Random number seed to initiate simulations:
4422654
5
5
5
5
5
5
Simulation Results
5
5
5
5
Number of Valid Simulations: 1000
5
5
Estimated Bias: 0.60% or 0.3 animals.
5
5
95% Conf. Interval Length: 29.43%, or 13.2 animals.
5
5
95% Conf. Interval Coverage: 95.90%
5
5
5
5
The ESC key takes you back one menu screen.
5
5
You can get context-sensitive help with the F1 key.
5
944444444444444444444444444Top4444Bot4444Help4444PgUp4444PgDn4444Return4444ESC48
The program reports the estimaed bias of the estimate, the expected confidence interval length as
a percent of the estimate and as the number of animals (total length -- see the discussion of these
values in the design section), and the expected coverage based on the replicate simulations.
For the immigration-emigration estimator, one additional input value is requested, i.e., the
proportion of the population on the study area at the time of each sighting survey. For the MintaMangel estimator, the number of bootstraps to perform for each estimate is requested. For
Bowden's estimator, the expected proportion of the marked animals that are identified is
requested, allowing the user to evaluate the loss in precision of the estimator as a smaller and
smaller proportion of the marked animals are individually identified.
Output for all the estimators is the same, except that for the immigration-emigration
estimator, the bias, confidence interval length, and confidence interval coverage are reported for
both total population size and average daily population size. An example output for this estimator
is shown in the following screen.
NOREMARK Reference Manual
04/07/94
24
19:48:42
64444444444444444444464444444444444444444444444444444444444744444444444444444447
5
Monte Carl5 Continue -- Do not save output
5Estimator
5
:444444444444444444445 File
-- Output saved to a file 54444444444444444444<
5
5 Print
-- Output saved to printer 5
5
5
Enter the expect944444444444444444444444444444444444448eriment:
5
5
Guesstimate of total population size:
150
5
5
Expected proportion of population on study area:
0.90
5
5
Expected number of sighting occasions:
4
5
5
Expected proportion of population to be marked:
0.30
5
5
Expected proportion of population to be seen on each occasions: 0.70
5
5
Alpha level for Confidence Interval Construction (0.01-0.50):
0.05
5
5
Number of replicates to simulate:
1000
5
5
Random number seed to initiate simulations:
2922875
5
5
5
5
Simulation Results (Number of Valid Simulations Was 1000)
5
5
5
5
Total Population
Daily Population
5
5 Estimated Bias: 0.26% or 0.4 animals.
0.14% or 0.2 animals.
5
5
95% CI Length: 20.05%, or 30.1 animals.
17.43%, or 23.5 animals.
5
5 95% CI Coverage: 95.40%
93.40%
5
5
5
5
The ESC key takes you back one menu screen.
5
5
You can get context-sensitive help with the F1 key.
5
944444444444444444444444444Top4444Bot4444Help4444PgUp4444PgDn4444Return4444ESC48
Before starting a simulation with a large number of replicates (i.e., $500, the user should
run the simulation with 5-10 replicates to see how much time the large simulation will take. For
example, if a set of input parameters takes 2 minutes to complete 5 replications, then 1000
replications will take about 400 minutes, or 6.7 hours! You may want to reconsider whether you
want to tie up your computer for the next 7 hours. The time that a simulation will take depends
on the size of N (larger values take more time), capture probability (larger values take more
time), sighting probability (larger values take more time), and number of occasions (more
occasions take more time). Also, each of the 4 estimators require different amounts of
computation, and thus take differing amounts of time to compute a single replication. Generally,
Bowden's estimator is the fastest. The JHE and the IEJHE estimators require numerical
optimization to compute the estimate, so take longer. The Minta-Mangel estimator uses a
bootstrap procedure, so takes even longer, although the amount of time required depends on the
number of iterations of the bootstrap procedure that are performed for each replication. In
summary, evaluate the amount of time required before starting a big simulation.
Estimator Selection
Each of the 4 estimators provided in Program NOREMARK have slightly different
assumptions, and thus apply best to certain conditions. The joint hypergeometric estimator
assumes a geographically closed population, with each animal in the population having the same
sighting probability on a particular occasion. In addition, animals are assumed to be sampled
without replacement, i.e., no animal is observed or counted twice during the survey for a
particular occasion. The immigration-emigration estimator extends this model to the situation
where the study area is no longer geographically closed, but each animal in the population still has
NOREMARK Reference Manual
25
the same sighting probability on a particular occasion and is sampled without replacement. For
both these estimators, it is inappropriate to apply them to data collected by sampling with
replacement, i.e., animals are seen more than once during a particular occasion.
Bowden's estimator allows each animal's sighting probability to differ from the others, and
sampling can be with or without replacement. Sighting heterogeneity allows to a certain degree
that the study area does not have to be geographically closed, in that some animals can be off the
study area for a particular occasion(s), and hence have a zero sighting probability. The resulting
estimate is the total population using the study area, which is not the same as the average density
of animals on the study area. Thus, the estimate resulting from Bowden's estimator may not be
exactly what the researcher had in mind if the study area is not closed.
The Minta-Mangel estimator requires the same assumptions as Bowden's estimator,
although this estimator is derived under the assumption of sampling with replacement. However,
using this estimator for situations where sampling without replacement is not particularly
inappropriate, because the estimator would not be particularly biased and confidence interval
length would be only slightly larger than the estimator derived under the assumption of sampling
without replacement. I do not recommend the Minta-Mangel estimator because of the poor
performance of the confidence interval coverage, and suggest that users of NOREMARK use
Bowden's estimator if heterogeneity of sighting probabilities is serious or sampling is performed
with replacement.
If there is little or no heterogeneity of sighting probabilities, the joint hypergeometric
estimator should generate slightly smaller confidence interval lengths than Bowden's estimator
because stronger assumptions are made. Neal et al. (1993) showed that confidence interval
coverage drops to 80% for an expected 95% interval when reasonable sighting heterogeneity is
simulated. The choice of Bowden's estimator over the joint hypergeometric estimator will depend
on the degree of heterogeneity in sighting probabilities, and whether sampling is performed with
or without replacement.
One additional criterion is useful in deciding between the joint hypergeometric estimator
and Bowden's estimator. Often, conduct of the survey does not fall into logical occasions, i.e.,
animals may be counted multiple times during one "occasion". Examples are photographing bears
at bait sites with motion-sensing cameras, where the same bear may visit the same bait site
multiple times in a few hours time. Besides the fact that this type of survey probably has
heterogeneity of sighting probabilities, structure of the survey basically precludes use of the joint
hypergeometric estimator. Such surveys should be considered as sampling with replacement.
Program Testing
User's can verify their copy of the program by duplicating results in the previous sections.
Input files supplied with the program can be retrieved with the F2 function key, and the output
verified against the output shown in the above screen reproductions. The input file
ANDREA.HYP provides input for the JHE and immigration-emigration estimator.
ANDREA.MM provides input for the Minta-Mangel and Bowden's estimators.
Verification of the code has been performed by checking the numerical optimization
results against independent codes. However, the strongest evidence that the code is correct is
NOREMARK Reference Manual
26
that simulation results for data simulated under the correct model generates correct results. That
is, estimators are unbiased, and confidence interval coverage is the expected 1 - " level for
reasonable inputs.
Programming Logic
NOREMARK user interface is implemented using the CA-Clipper compiler. This
language is a superset of the dBase III language and provides the capabilities to select choices
from a list and input fields interactively.
The design capability of the program is implemented via a dBase III database named
INTERP.DBF that the code creates if the database is not present. The context-sensitive help
function is also implemented via a dBase III database (HELP.DBF) which includes a memo field
existing in HELP.DBT. If these files are not present in the local directory, the program creates
them.
Numerical optimization is performed with FORTRAN codes for the joint hypergeometric
and the immigration-emigration estimators. For the joint hypergeometric estimator, the
FORTRAN objects are linked directly into the NOREMARK.EXE file. For the immigrationemigration estimator, the NOREMARK.EXE code creates an input file (IE_NRM.INP) to the
IE_NRM.EXE file. This file is then executed, reads IE_NRM.INP, computes the estimator,
creates the output file IE_NRM.OUT, and exits. NOREMARK.EXE then reads the estimation
results from IE_NRM.OUT.
A golden section search in one dimension (Press et al. 1986) is used to compute the
maximum of the joint hypergeometric estimator. The maximum is bracketed with routine
MNBRAK, then the golden section search initiated. NPSOL (Gill et al. 1986) is used to compute
the optimum of the immigration-emigration estimator. NPSOL is a set of FORTRAN
subroutines designed to minimize a smooth function subject to constraints, which may include
simple bounds on the variables, linear constraints and smooth nonlinear constraints. NPSOL uses
a sequential quadratic programming algorithm, in which the search direction is the solution of a
quadratic programming subproblem. The algorithm treats bounds, linear constraints, and
nonlinear constraints separately.
The NOREMARK code is not portable to other operating systems at this time because the
CA-Clipper compiler is available only for DOS.
Program Files
The following is a list of files distributed with the program as an archive created with
PKZIP. The archive can be unzipped with PKUNZIP.
Directory of C:\NOREMARK
README
ANDREA
ANDREA
ANDREA
NOREMARK
1ST
HYP
MM
OUT
EXE
262
369
250
3,692
611,328
01-05-94
06-20-92
06-20-92
04-27-94
02-25-95
10:29a
8:31a
9:54a
4:07p
9:30a
NOREMARK Reference Manual
INTERP
HELP
HELP
IE_NRM
DOSXMSF
BADGER
BISON76
BISON77
PORCUPIN
KUFELD
NOODLES
NOODLES
USERMAN
DBF
DBF
DBT
EXE
EXE
MM
MM
MM
MM
MM
HYP
MM
WP
27
29,186
1,116
13,989
350,720
374,950
169
170
160
109
250
224
371
291,342
06-20-92
02-02-94
02-02-94
04-07-94
01-30-93
06-22-92
06-22-92
06-22-92
06-22-92
11-15-93
06-17-93
06-17-93
02-25-95
8:14a
6:38a
6:38a
6:49p
12:00a
10:01a
10:33a
12:47p
1:41p
8:43a
12:37p
12:36p
9:46a
The file ANDREA.OUT is output for checking the program using as input the files
ANDREA.HYP (JHE and immigration-emigration estimators) and ANDREA.MM (MintaMangel and Bowden's estimators). The files NOREMARK.EXE and IE_NRM.EXE are
executable files for the program. DOSXMSF.EXE is the DOS memory extender file for
IE_NRM.EXE. INTERP.DBF is the dBase database for interpolations with the design
procedure. HELP.DBF and HELP.DBT are the help documents in dBase III format. The next 7
files are example input from Minta and Mangel (1989), Bowden (1993), or just a test case based
on a simple experiment with marked macaroni. The last file USERMAN.WP is this document in
WordPerfect 6.0 format.
NOREMARK Reference Manual
28
Literature Cited
Arnason, A. N., Schwarz, C. J., and Gerrard, J. M. 1991. Estimating closed population size and
number of marked animals from sighting data. J. Wildl. Manage. 55:716-730.
Bartmann, R. M., G. C. White, L. H. Carpenter, and R. A. Garrott. 1987. Aerial mark-recapture
estimates of confined mule deer in pinyon-juniper woodland. J. Wildl. Manage. 51:41-46.
Bowden, D. C. 1993. A simple technique for estimating population size. Dept. of Statistics,
Colorado State Univ., Fort Collins, Colo. 17pp.
Buckland, S. T., and P. H. Garthwaite. 1990. Algorithm AS 259 -- Estimation confidence
intervals by the Robbins-Monro search process. Applied Statistics 39:413-424.
Burnham, K. P., and W. S. Overton. 1978. Estimation of the size of a closed population when
capture probabilities vary among animals. Biometrika 65:625-633.
Burnham, K. P., and W. S. Overton. 1979. Robust estimation of population size when capture
probabilities vary among animals. Ecology 60:927-936.
Chao, A. 1988. Estimating animal abundance with capture frequency data. J. Wildl. Manage.
52:295-300.
Chapman, D. G. 1951. Some properties of the hypergeometric distribution with applications to
zoological sample censuses. University of California Publication in Statistics 1:131-160.
Darroch, J. N. 1958. The multiple recapture census: I. Estimation of a closed population.
Biometrika 45:343-359.
Eberhardt, L. L. 1990. Using radio-telemetry for mark-recapture studies with edge effects. J.
Applied Ecol. 27:259-271.
Furlow, R. C., M. Haderlie, and R. Van den Berge. 1981. Estimating a bighorn sheep population
by mark-recapture. Desert Bighorn Council Transactions 1981:31-33.
Gill, P. E., W. Murray, M. A. Saunders, and M. H. Wright. 1986. User's guide for NPSOL
(Version 4.0): a FORTRAN package for nonlinear programming. Tech. Rep. SOL 86-2,
Systems Optimization Laboratory, Dept. of Operations Research, Stanford Univ.,
Stanford, Calif. 54pp.
Hein, E. W. 1992. Evaluations of coyote attractants and a density estimate on the Rocky
Mountain Arsenal. M. S. Thesis, Colorado State Univ., Fort Collins. 58pp.
NOREMARK Reference Manual
29
Hudson, D. J. 1971. Interval estimation from the likelihood function. J. Royal Stat. Soc. Series
B 33:256-262.
Leslie, D. M., Jr. and C. L. Douglas. 1979. Desert bighorn sheep of the River Mountains,
Nevada. Wildl. Monogr. 66:1-56.
Leslie, D. M., Jr. and C. L. Douglas. 1986. Modeling demographics of bighorn sheep: current
abilities and missing links. North American Wildlife and Natural Resources Conference
Transactions 51:62-73.
Miller, S. D., E. F. Becker, and W. H. Ballard. 1987. Black and brown bear density estimates
using modified capture-recapture techniques in Alaska. International Conference on Bear
Research and Management 7: 23-35.
Minta, S. and M. Mangel. 1989. A simple population estimate based on simulation for capturerecapture and capture-resight data. Ecology 70:1738-1751.
Neal, A. K. 1990. Evaluation of mark-resight population estimates using simulations and field
data from mountain sheep. M. S. Thesis, Colorado State Univ., Fort Collins. 198pp.
Neal, A. K., G. C. White, R. B. Gill, D. F. Reed, and J. H. Olterman. 1993. Evaluation of markresight model assumptions for estimating mountain sheep numbers. J. Wildl. Manage.
57:436-450.
Otis, D. L., K. P. Burnham, G. C. White, and D. R. Anderson. 1978. Statistical inference from
capture data on closed animal populations. Wildl. Monogr. 62:1-135.
Press, W. H., B. P. Flannery, S. A. Teukolsky, and W. T. Vetterling. 1986. Numerical recipes:
the art of scientific computing. Cambridge Univ. Press, Cambridge, U.K. 818pp.
Schnabel, Z. E. 1938. estimation of the size of animal populations by marking experiments. U.
S. Fish and Wildlife service Fisheries Bull. 69:191-203.
Rexstad, E., and K. Burnham. 1991. Users' guide for interactive program CAPTURE. Colo.
Coop. Fish and Wildl. Res. Unit, Colo. State Univ., Fort Collins. 29pp.
Rice, W. R. and J. D. Harder. 1977. Application of multiple aerial sampling to a mark-recapture
census of white-tailed deer. J. Wildl. Manage. 41:197-206.
Venzon, D. J. and Moolgavkar, S. H. 1988. A method for computing profile-likelihood based
confidence intervals. Appl. Stat. 37:87-94.
NOREMARK Reference Manual
30
White, G. C. 1993. Evaluation of radio tagging marking and sighting estimators of population
size using Monte Carlo simulations. Pages 91-103 in J.-D. Lebreton and P. M. North
(eds.). Marked Individuals in the Study of Bird Population, Birkhäuser Verlag, Basel,
Switzerland.
White, G. C., K. P. Burnham, D. L. Otis and D. R. Anderson. 1978. User's manual for program
CAPTURE. Utah State Univ. Press, Logan, UT. 40pp.
White, G. C., D. R. Anderson, K. P. Burnham, and D. L. Otis. 1982. Capture-recapture and
removal methods for sampling closed populations. Los Alamos National Laboratory. LA8787-NERP. Los Alamos, N. M. 235pp.
White, G. C. and R. A. Garrott. 1990. Analysis of wildlife radio-tracking data. Academic Press,
New York, N. Y. 383pp.
Zippin, C. 1956. An evaluation of the removal method of estimating animal populations.
Biometrics 12:163-169.
Zippin, C. 1958. The removal method of population estimation. J. Wildl. Manage. 22:82-90.


![manual [372769 bytes]](http://vs1.manualzilla.com/store/data/005891066_1-6553408cfa4c941a2bbbbb48a824c132-150x150.png)