1
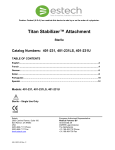
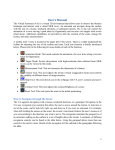
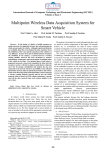
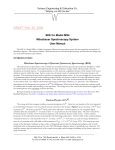
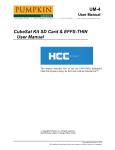
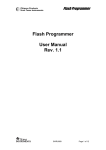
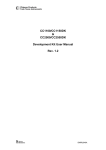
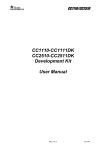
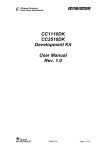
SEE Co. W302 User's Manual page 1 of 11 SEE Co. Model W302 Resonant Gammaray Spectrometer User's Manual Version 1.0 March 2010 Contents I. Purpose and Scope II. Configuration, Specifications and General Functions III. Operation as part of the SEE Co. MS4 Mossbauer Spectroscopy System IV. Operation with other equipment Appendix A. Schematic Diagram Appendix B. User Interface Software for Microsoft Windows PCs. SEE Co. W302 User's Manual page 2 of 11 I. Purpose and Scope This manual describes the configuration and operation of the SEE Co. Model W302 Resonant Gammaray Spectrometer. The W302 incorporates a dualinput Multi Channel Scaler (MCS), a waveform generator, a hybrid analog/digital servo amplifier, a USB interface and userinterface PC software. The hardware components are house is a single, compact box and may be used for many applications. However, the W302 was designed primarily to be the core of the SEE Co. MS4 Resonant Gammaray Spectroscopy (RGS) System. RGS is more commonly known as Mossbauer Spectroscopy, named for the discoverer of resonant gammaray absorption and emission, Prof. Rudolf Mossbauer(1). Figure 1 shows a complete MS4 spectrometer except for the MS Windows PC. Figure 1. SEE Co. MS4 Spectrometer recording a Mossbauer spectrum with the sample at room temperature. Components shown are (right side) W302 Resonant Gammaray Spectrometer, (left side) W202 Gammaray Spectrometer, (rear) VT400 Velocity Transducer and LND Kr/Co2 Proportional Gas Counter, (front) SEI Monitor 4EC Radiation Survey Meter. The Co57/Rh Mossbauer gammaray source is mounted on the end of the VT400 shaft inside the radiation shield between the VT400 and the Kr counter. Not shown is MS Windows PC with USB interface and the W202 and W302 user interface software. II. Configuration, Specifications and General Functions Figure 2 is a diagram of the MS4 spectrometer and also shows a block diagram of the internal components of the W302. The major components of the W302 are: A. Silicon Labs C8051F320 8bit MCU with USB interface B. 64 k Byte Dualport RAM memory C. Silicon Labs C8051F120 8bit MCU with ADC, DAC and 32bit counters. SEE Co. W302 User's Manual page 3 of 11 D. Analog power amp for Velocity Transducer drive coil E. Analog amp for Velocity Transducer pickup coil Figure 2. Diagram of components of the SEE Co. MS4 Mossbauer Spectroscopy System SEE Co. W302 User's Manual page 4 of 11 Figure 3. W302 Front View As shown in Figure 3, the W302 has no connectors or controls on the front panel. There is a LED pilot light to indicate when the W302 in turned on. Figure 4. W302 Rear View The real panel of the W302 is shown in Figure 4. From left to right the connectors are: A. 100 240 VAC at 50 – 60 Hz line power connector with ON/OFF rocker switch above. B. Type B USB connector C. 15pin SubD female Auxiliary output connector (This connector is not used in the MS4 system.) Pin outs: 1 Analog Monitor signal 2 CAP Channel Advance Pulse 3 SSP Start Sweep Pulse D. “Counts1 In” BNC jack for TTL input pulses for MCS 1 E. “Counts2 IN” BNC jack for TTL input pulses for MCS 2 F. 9pin subD female connector for the Velocity Transducer. Pin outs: 2 Pickup coil V+ 4 Pickup coil V 7 Drive coil V+ 8 Drive coil V SEE Co. W302 User's Manual page 5 of 11 III. W302 Operation as part of the SEE Co. MS4 Mossbauer Spectroscopy System When used as part of the MS4 system, the W302 is very simple to install. With the power off, connect all cables as shown in Figure 2. Before turning on the W302, the user interface program must be installed on the PC along with the driver for the USB interface. If the PC was supplied with the MS4 then the W302 program and the USB drivers will have been installed and tested at SEE Co. If you do need to install the USB drivers and W302 program on you PC, follow the instructions in the README.TXT file bundled with the installation package. Figure 5. Initial “Splash” Window of W302 Program When the W302 program is executed, the first window to appear is shown in Figure 5. This splash screen displays a dropdown list box with the serial numbers of all the W302 boxes connected to the PC. Usually, there is only one. The displayed serial number was sent from the W302 to the PC and demonstrates that the W302 is powered on and communicating properly. Choose the W302 you wish to use and click with the left mouse button on “OK” to continue. The splash screen will close and the main window of the W302 program will open as shown in Figure 6. Figure 6. Main window of W302 PC program. SEE Co. W302 User's Manual page 6 of 11 The main window is divided into four parts. On the left are displayed the number of points in the time scan of the MCS and three Command Buttons. In the middle are information and Command Buttons regarding the two spectra stored in the dual MCS. On the right are the Save Data to disk button, the Get Data check box and the Exit Command Button. Table 1 lists are the displayed parameters and Command Buttons. Name Symbol Description Number of Points Nt Total number of channels in the MCS time scan Number of Active Points Na Total number of channels in which data are stored. Normally, Na = Nt Velocity Scale [mm/s] Vs Amplitude of Velocity Scan, e.g. Vs = 12 means a scan from 12 mm/s to +12 mm/s. The amplitude of the scan depends on the particular velocity transducer used and the Servo Amp parameters. Change Scale Command Button Makes the change velocity scale buttons visible. Velocity Transducer Monitor Command Button Makes the Velocity Monitor plot window visible. Velocity Transducer Parameters Command Button Makes the servo amp parameters and dwell time parameter visible for editing. Sweeps1, Sweeps2 The number of MCS sweeps since the data was last cleared. Acquisition Time The time since the data was last cleared. Baseline The value of the first channel in the MCS data. Rate The count rate [counts / second ] Channel 1 Plot, Channel 2 Plot Command Buttons Makes the MCS data plot (the Mossbauer spectrum) visible. Clear Channel 1, Clear Channel 2 Command Buttons Set the MCS data to zero. Save Data Command Button Writes the MCS data to the disks files c:\data\W302_1.txt and c:\data\W302_2.txt. Get Data Check Box Toggles the updating of the MCS data in the PC RAM on/off. Note, this does not affect the data collection within the W302 box. Exit Command Button Closes the W302 program on the PC. Note, the W302 box will continue to collect data until it is turned off. If the W302 PC program is run again, the current data in the W302 box will be sent to the PC. Table 1. Parameters and Command Buttons on the Main Form. When the main window first opens, a “Please Wait” notice is displayed. A few seconds will pass as the W302 box is interrogated regarding its status. The W302 RAM memory is volatile. When the W302 is first SEE Co. W302 User's Manual page 7 of 11 turned on, items such as the number of channels and the Velocity Reference Waveform are set to zero. If that is the case then the W302 PC program will download the required information to the W302 box. The default values are stored as ASCII files in the W302 folder on the PC disk drive. These files are listed in Table 2. ASCII File Name Content Nt_Ndata_dt_K.txt Nt = total number of channels in MCS time scan ( = 1024 for this version of the W302 embedded software.) Ndata = number of MCS channel used to store counts ( = Nt for this version of the W302 embedded software.) dt = MCS dwell time [ micro seconds ] K_dr = +1 or 1 (phase factor for Velocity Drive signal) K_pu = +1 or 1 (phase factor for Velocity Pickup signal) Vref.txt Vref(i) where i=1, Nt. The Velocity Reference Waveform is stored as a single column of integers with range 0 to 4095. This waveform is loaded into the RAM in the W302 box. The default waveform is triangular with rounded corners and is the one displayed in this manual. The user may define any waveform and copy it to Vref.txt. Whatever waveform is stored in the file Vref.txt will be downloaded to the W302 box the next time the W302 PC program is run after the W302 box have been turned off and back on. Arr_Sc.txt Default values for Servo amp gains, bandwidth and bias. This file has 13 rows and 6 columns. The columns are, left to right: G = software gain Bias = bias on drive signal P1 = digital potentiometer 1 setting, range = [0,255] P2 = digital potentiometer 2 setting, range = [0,255] P3 = digital potentiometer 3 setting, range = [0,255] P4 = digital potentiometer 4 setting, range = [0,255] The rows are numbered 0 to 12 and correspond to the value of Vs, the Velocity Scale index. The usual practice is to set the parameters for a given row so that the velocity transducer scans the corresponding velocity range. For example, the parameter values of row 4 would set the velocity scan at +/ 4 mm/s. These parameters and there relationship to the W302 servo amp are discussed in detail in Section IV. Table 2. ASCII Files used to define the default values of the Velocity Waveform and Servo Amp settings. SEE Co. W302 User's Manual page 8 of 11 Figure 7 shows the PC screen after the Channel 1 Plot Button and the Velocity Transducer Monitor Button have been clicked. The MCS data for Channel 1 are scaled automatically to span the Plot Window. Note, if the data just been cleared then the data will not be plotted until at least one point has a value of 100 counts or greater. The Velocity Transducer Monitor window has three Buttons for choosing display of the Velocity Reference Waveform, the Velocity Pickup Coil signal or the Velocity Error signal. The vertical scale of the Monitor Window is displayed in milliVolts and may be change by clicking on the “+” and “” Buttons. The internal Analog to Digital Converter (ADC) and Digital to Analog Converter in the C8051F120 MCU both have 12 bit resolution and a reference voltage of 2.42 Volts. Hence the Vref waveform is stored as integers within the range 0 to 4,095 which corresponds to a voltage range of 0 V to +2.42 V. Figure 7. Screen with Main Window, Channel 1 Data Plot Window and Monitor Window. SEE Co. W302 User's Manual page 9 of 11 Figure 8. Servo Amp Parameters Displayed Clicking the Velocity Transducer Parameters button will cause the servo amp parameters to be displayed as shown in Figure 8. Also displayed is the MCS dwell time “dt” in units of microseconds. Clicking the Velocity Transducer Parameters button again will close the Servo Parameters display. The value in the white boxes may be edited. Clicking OK will cause the Servo Parameters display to close and the “Please Wait” message to appear. During the wait period the velocity transducer is turned off so that the transducer shaft will stop moving. At that time, the DC offsets of the servo amps will be measured and the Off_Set parameter value defined to compensate. Then the servo amp will be turned on driving the transducer, the MCS data cleared and the data collection started. When the W302 is used with a SEE Co VT400 Velocity Transducer, the servo parameters stored in the Arr_Sc.txt file will have been optimized at SEE Co. No changes should be required. Figure 9. Velocity Transducer Error Signal SEE Co. W302 User's Manual page 10 of 11 Figure 9 shows the Velocity Error signal “Verr”. In this example, the peak to peak amplitude is approximately 18 mV with observed noise of approximately 2 mV. The least significant bit of the 12 bit ADC corresponds to ( 2.42 V / 4,095) = 0.6 mV. The 0.6 mV steps can be seen in Figure 9. Figure 10. Changing the Velocity Scale. The range of the velocity scan may be changed by clicking on the “Change Scale” button. Left and Right arrows and an “OK” button will appear. Click on the arrows to choose the desired and then click “OK”. A “Please Wait” message will appear, the servo amp off set measured and corrected, the data in both MCS 1 and MCS 2 cleared and the data acquisition started. V. Operation with other equipment As mentioned above, when the W302 is used with the SEE Co. VT400 velocity transducer the parameters in the Arr_Sc.txt file will have factory set defaults that cause the servo amp to drive the VT400 over the nominal velocity range of +/ Vs. If the W302 is used with a different velocity transducer then the servo amp parameters will have to optimized for that transducer. PUT SIMPLIFIED SCHEMATIC OF SERVO AMP HERE. SEE Co. W302 User's Manual page 11 of 11 References 1. Mössbauer, R. (1958) "Kernresonzflureszenz von Gammastrahlung in Ir191", Z. Physik 151, 124143 2. 3. Appendix A. Schematic Diagram Appendix B. User Interface Software for Microsoft Windows PCs.