1
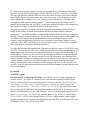
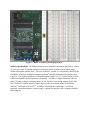
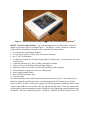
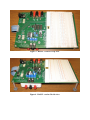
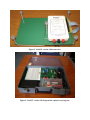
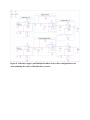
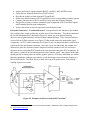
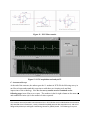
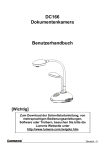
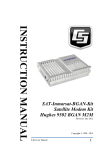
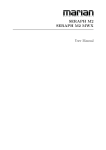
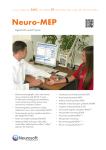
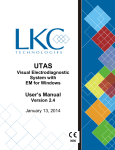
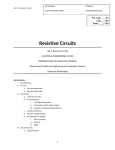
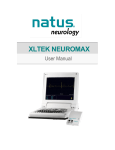
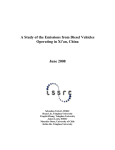
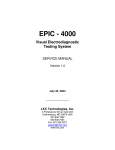
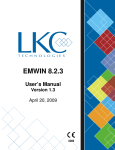
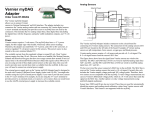
AC 2011-1927: A RAPID ANALYSIS AND SIGNAL CONDITIONING LABORATORY (RASCL) DESIGN COMPATIBLE WITH THE NATIONAL INSTRUMENTS MYDAQ PLATFORM
Steve Warren, Kansas State University
Steve Warren received a B.S. and M.S. in Electrical Engineering from Kansas State University in 1989
and 1991, respectively, followed by a Ph.D. in Electrical Engineering from The University of Texas at
Austin in 1994. Dr. Warren is an Associate Professor in the Department of Electrical & Computer
Engineering at Kansas State University. Prior to joining KSU in August 1999, Dr. Warren was a Principal
Member of the Technical Staff at Sandia National Laboratories in Albuquerque, NM. He directs the KSU
Medical Component Design Laboratory, a facility partially funded by the National Science Foundation
that provides resources for the research and development of distributed medical monitoring technologies
and learning tools that support biomedical contexts. His research focuses on (1) plug-and-play, point-ofcare medical monitoring systems that utilize interoperability standards, (2) wearable sensors and signal
processing techniques for the determination of human and animal physiological status, and (3) educational
tools and techniques that maximize learning and student interest. Dr. Warren is a member of the American
Society for Engineering Education and the Institute of Electrical and Electronics Engineers.
Xiongjie Dong, Kansas State University
Tim J. Sobering, Kansas State University
Tim J. Sobering is an Electrical Engineer and serves as Director of the Kansas State University Electronics
Design Laboratory. His B.Sc. (1982) and M.Sc. (1984) degrees are in Electrical Engineering, both
from Kansas State University, where he specialized in instrumentation and measurement with graduate
work focusing on low-power analog-to-digital conversion architectures and dynamic testing methods. He
worked for 12 years at Sandia National Laboratories where he developed electro-optic remote sensing
instruments for the detection of nuclear, biological, chemical, and laser weapons proliferation. In 1996
Tim came to K-State and started the Electronics Design Laboratory. As EDL’s Director, Tim’s vision was
realized as the laboratory came online and assumed the responsibility for supporting the instrumentation
needs of research programs across all of K-State.
Jason Yao, East Carolina University
Dr. Jianchu (Jason) Yao joined the Department of Engineering at East Carolina University as an Assistant
Professor in August, 2005. He received a B.S. and M.S. degrees in electrical engineering from Shaanxi
university of Science and Technology, China, in 1992 and 1995, respectively, and the Ph.D. degree in electrical engineering from Kansas State University in 2005. His research interests include wearable medical
devices, telehealthcare, bioinstrumentation, control systems, and biosignal processing. His educational
research interests are laboratory/project-driven learning and integration of research into undergraduate
education. Dr. Yao is a member of the American Society of Engineering Education and a senior member
of Institute of Electrical and Electronics Engineers.
c
American
Society for Engineering Education, 2011
A Rapid Analysis and Signal Conditioning Laboratory (RASCL) Design
Compatible with the National Instruments myDAQ® Platform
Abstract
Virtual instruments and mobile data acquisition hardware for engineering education offer
flexibility in learning venues and can help to alleviate overcrowding in traditional benchtop
instrumentation laboratory space. This paper presents a new design for a Rapid Analysis and
Signal Conditioning Laboratory (RASCL) hardware toolset that provides a hardware bridge for
the myDAQ personal instrumentation platform recently released by National Instruments. The
myDAQ platform is a handheld hardware unit that interfaces to a computer through a universal
serial bus connection. It hosts two analog input channels, two analog output channels, eight
digital input/output channels, power supplies, and digital multimeter functionality. LabVIEW
virtual instruments then allow the myDAQ unit to provide the roles of, e.g., an oscilloscope, a
function generator, and a frequency-domain signal analyzer. The new RASCL design connects
to the myDAQ unit via a ribbon cable and provides a student with direct access to breadboard
space, a wide-frequency-range analog function generator, two electrically isolated signal
channels, various connectors (audio, BNC, and banana jack) for input/output signals, a wall
outlet power adapter, and a wrist strap for electrostatic discharge protection. Mounting screws
hold the myDAQ unit securely underneath the larger RASCL board. A carrying case
accommodates the entire assembly and a parts/tools storage bin.
The effectiveness of this learning toolset was assessed within the context of a Fall 2010 course:
ECE 628 – Instrumentation. The course, which typically utilizes benchtop instrumentation, was
supplemented with virtual instruments and mobile hardware to support sessions that address a
myDAQ/RASCL tutorial, second-order filters, instrumentation amplifiers, electrocardiography,
and electrooculography. Pre- and post-session surveys and assessments indicate that (a) learning
objectives were effectively met with this technology, (b) students find the toolset to be a sensible
alternative to learning environments that employ desktop instrumentation, and (c) students would
be willing to invest in a such a resource, as it would be useful for many analog and digital
courses offered in standard electrical and computer engineering curricula.
I. Introduction
Laptop-based data acquisition (DAQ) toolkits used for secondary electronics education have the
potential to (a) alleviate overcrowding and cost issues faced with benchtop laboratories, (b)
supplement usually lecture-only courses with hands-on exercises, and (c) deliver mobile learning
experiences to students who have a cultural expectation for access to connected consumer
electronics.1-8 Such learning kits also offer a student a choice to build and debug circuitry at
home as a pre-laboratory exercise so that their follow-on benchtop laboratory session allows
more time for discussion and abstract analysis, as opposed to the student spending their entire
laboratory time “getting their circuit to work.”
One would surmise that low-cost, computer-enabled DAQ tools exist for circuit prototyping at
home, but options are limited2-4, 6, 9. These include (a) minimal breadboard-based tools that use
PC sound cards as analog-to-digital converters, (b) portable DAQs with minimal data display
interfaces, (c) full-featured prototyping hardware with little-to-no PC connectivity, (d) academic
offerings with limited availability that need greater integration for large-scale course adoption,
and (e) highly functional products whose price point exceeds the ‘textbook pricing’ levels to
which students are accustomed. (See 2 for a broader listing with citations.) This drove the
development of the original RASCL platform2, 7-9, which employs breadboarding resources,
portable DAQ technology, and LabVIEW VIs that allow a student to acquire circuit parameters
and signals off-campus. It is described in detail in the next section.
This paper presents a new design for the RASCL hardware toolset that provides a hardware
bridge for the myDAQ personal instrumentation platform recently released by National
Instruments10. The myDAQ platform is a handheld hardware unit that interfaces to a computer
through a universal serial bus connection. The new RASCL design connects to the myDAQ unit
via a ribbon cable and provides a student with direct access to breadboard space, a widefrequency-range analog function generator, two electrically isolated signal channels, various
connectors (audio, BNC, and banana jack) for input/output signals, a wall outlet power adapter,
and a wrist strap for electrostatic discharge protection.
The paper also presents early applications of the toolset within the context of a Fall 2010 course:
ECE 628 – Instrumentation. The course, which typically utilizes benchtop instrumentation, was
supplemented with virtual instruments and mobile hardware to support sessions that address a
myDAQ/RASCL tutorial, second-order filters, instrumentation amplifiers, electrocardiography,
and electrooculography. Pre- and post-session surveys and assessments were administered in
order to determine whether (a) learning objectives were effectively met with this technology, (b)
students found the toolset to be a sensible alternative to learning environments that employ
desktop instrumentation, and (c) students would be willing to invest in a such a resource, as it
would be useful for many analog and digital courses offered in standard electrical and computer
engineering curricula.
II. Methods
A. RASCL Upgrade
Previous RASCL Version 2 Specifications. The RASCL version 2 design (an upgrade to
previous design9 – see Figure 1) constitutes prior work and is the hardware baseline for this
effort. It includes a large circuit-prototyping board, a function generator (Exar XR–2206 core;
sine, triangle, and square waves; course/fine frequency adjustments), a power supply (AC
adapter; 8-pin connector; +5 Vdc (3 A); +12 Vdc (1 A); -12 Vdc (0.5 A)), audio input/output
jacks, an uncased NI USB-6009 DAQ card which interacts with LabVIEW VIs running on a PC,
and direct breadboard access to the USB-6009 pins. The NI USB-6009 DAQ unit provides bus
power (+5 Vdc (0.2 A); +2.5 Vdc (0.1 A)), 8 analog inputs (14-bit, 48 kS/s), 2 analog outputs
(12-bit, 150 S/s), 12 TTL/CMOS digital I/O lines, a 32-bit (5 MHz) counter, a digital trigger,
multiple operating system support, and compatibility with LabVIEW, Visual Studio .NET, and
NI-DAQmx drivers. The collection cost ~$225.
Figure 1. RASCL version 2 prototyping board.2, 9
myDAQ Specifications. The authors had previously planned to incorporate the RASCL version
2.0 unit into a suite of learning experiences in order to assess its effectiveness and to gauge
student satisfaction with the tools. The move to RASCL version 3.0 was primarily driven by the
availability of the new National Instruments myDAQ® personal instrumentation platform (see
Figure 2). The myDAQ platform (a USB-6009 upgrade) adds a ±5/±15 V power supply (0.5W),
a software-controlled function generator (frequency ≤ 100 kHz), a digital multimeter, and two
audio I/O jacks. It hosts two analog inputs (16-bit, 200 kS/s), two analog outputs (16-bit, 200
kS/s), and 8 TTL/CMOS digital I/O lines. Drivers and VIs are based on the NI ELVISmx
software11 used with NI ELVIS II12. Available VIs include an oscilloscope, a waveform
generator, a digital multimeter, a power supply, a digital I/O interface, and a frequency-domain
Bode analyzer.
Figure 2. National Instruments myDAQ® personal instrumentation platform.10
RASCL Version 3.0 Specifications. Top, side, and bottom views of the RASCL version 3.0
design are pictured in Figure 3 through Figure 5. The RASCL version 3 design is a cohesive,
rigid collection of hardware learning resources with the following features:
• two electrically isolated input channels,
• a wrist strap to protect circuitry from electrostatic discharge,
• two 2” by 6” breadboards,
• a collection of connectors for input/output signals (5 banana jacks, 2 co-axial connectors, and
4 audio jacks),
• a function generator (0.01 Hz to 1 MHz) with improved knobs,
• surface access to all myDAQ and board inputs/outputs,
• rigid trace connectivity all the way from the breadboard to the computer,
• an external power supply with access to earth ground,
• power supply switches/fuses,
• power-on LED indicators, and
• fuse protection.
The entire assembly can be carried inside a plastic briefcase (see Figure 6). Note from Figure 4
and Figure 5 that the myDAQ unit can be secured beneath the RASCL board by way of four
screws. RASCL version 3 retains power supply and function generator capabilities from version
2 since (a) the USB bus can only draw 500 mA, and the myDAQ needs ~250 mA to operate and
(b) the myDAQ function generator can only (ideally) provide signals that contain frequencies up
to 100 kHz. The entire collection (RASCL + myDAQ + Student LabVIEW license) costs ~$325.
Figure 3. RASCL version 3.0 top view.
Figure 4. RASCL version 3.0 side view.
Figure 5. RASCL version 3.0 bottom view.
Figure 6. RASCL version 3.0 design inside a plastic carrying case.
B. Initial Learning Experiences in ECE 628 – Instrumentation
KSU and ECU team members eventually plan to develop VIs for courses at KSU (ECE 512 –
Linear Systems; ECE 772 – Bioinstrumentation) and ECU (ENGR 3014 – Electric Circuits;
ENGR 3050 – Instrumentation and Controls). Early results from the ECU experiences are
discussed in other FIE 20107 and ASEE 201113 papers. KSU experiences in Fall 2010 focused
on ECE 628 – Instrumentation as a temporary substitute for ECE 772 – Bioinstrumentation, a
course planned for Fall 2010 that was not offered. Two laboratory experiences were offered:
• a combined session that included a RASCL tutorial session and an active-filter exercise,
and
• a session that focused on instrumentation amplifiers and their use in acquiring
electrocardiograms and electro-oculograms.
These laboratory sessions are summarized in the following paragraphs.
Lab 1 – Active Filter Laboratory
Active Filter Laboratory – Overview. The goal of this laboratory exercise is to introduce
students to a cyber-laboratory learning kit which consists of a newly-developed Rapid Analysis
and Signal Conditioning Laboratory (RASCL) board, a National Instruments (NI) myDAQ®
USB data acquisition module, and a set of NI LabVIEW® virtual instruments (VIs). The target
application for this exercise will be active second-order filters, where students will compare
time- and frequency-domain data acquired for two types of second-order active lowpass filters
(Sallen-Key and Multiple-Feedback (MFB) architectures) with the corresponding behavior as
predicted by theory and PSpice simulations
Active Filter Laboratory – Learning Objectives. Upon completion of this laboratory, each
student should be able to do the following:
•
•
•
•
•
•
•
•
•
Utilize the basic functionality of a RASCL board, an NI myDAQ® unit, and the
accompanying LabVIEW® virtual instruments (VIs):
o Supply a sine wave to a circuit using the RASCL analog function generator
o Supply a square wave to a circuit using the myDAQ function generator
o Monitor circuit voltages using hardware on the RASCL board and myDAQ unit
o Display time-domain signals and make peak-to-peak measurements using the
LabVIEW Oscilloscope VI
Calculate and plot theoretical transfer function behavior, |H(ω)|, for active second-order
Sallen-Key and MFB Butterworth filters.
Simulate time- and frequency-domain filter behavior in PSpice
Construct, debug, and evaluate active, second-order lowpass filters
Describe the behavior of a lowpass filter given input sinusoids at different frequencies
Compare experimental transfer function data to the theoretical and simulated H(ω) curves
Explain the output signal from a lowpass filter given an input square wave
Compare the architectural design and frequency-domain performance of Sallen-Key
versus MFB lowpass filters
Discuss the effects of op amp quality on filter performance
•
Archive the results of such an investigation in an electronic format
Active Filter Laboratory – Theory. The circuit layouts for the 2nd-order active lowpass filters
to be used in this laboratory are illustrated in Figure 7. These circuits exhibit gains of
K=
R3 + R4
− R2
(Sallen Key - Figure 7(a)) and K =
(MFB - Figure 7(b)).
R3
R1
Note that the MFB filter is an inverting filter. The two circuits have –6 dB cutoff frequencies of
f c , SK =
1
2π R1 R2 C1C 2
Hz and f c , MFB =
1
2π R2 R3C1C 2
,
respectively. To obtain a unity-gain Sallen-Key configuration (a configuration usually referred
to as a “voltage controlled voltage source” (VCVS) filter), one can tie the output, Vo, directly to
the inverting input terminal (R3 = ∞, R4 = 0). Depending on the resistor and capacitor values,
either filter can be configured to display Butterworth, Bessel, or Chebyshev filter characteristics.
1,2
For example, when choosing R1 = R2 = R and C1 = C2 = C for a Sallen-Key lowpass filter in
the unity-gain, VCVS configuration, the filter demonstrates Butterworth behavior. Cascading n
filters of a similar type yields a (2n)th-order filter with the same type of behavior.
2nd‐Order Lowpass Sallen‐Key Filter
2nd‐Order Lowpass Multiple‐Feedback Filter
(a)
(b)
Figure 7. Circuit topologies for 2nd-order lowpass (a) Sallen-Key and (b) MultipleFeedback (MFB) filters.2
The frequency-domain transfer functions for the two 2nd-order lowpass filters are specified by
1
Horowitz, Paul and Winfield Hill. The Art of Electronics, First Edition, ©1980, Cambridge University Press, New York, NY, ISBN 0‐521‐23151‐5 (hard cover), ISBN 0‐521‐29837‐7 (soft cover). 2
Karki, Jim. “Active Low‐Pass Filter Design,” AAP Precision Analog, Texas Instruments Application Report, SLOA049B, September 2002, http://focus.ti.com/lit/an/sloa049b/sloa049b.pdf. H (ω ) =
( R3 + R4 ) / R3
(Sallen-Key)
1 − R1 R2 C1C 2ω 2 + jω (R1C1 + R2 C1 − R1C 2 (R4 / R3 ))
and
H (ω ) =
− R2 / R1
(MFB)
1 − R2 R3C1C 2ω + jω (R3 C1 + R2 C1 + R2 R3 C1 / R1 )
2
where ω = 2πf.
Active Filter Laboratory – Condensed Protocol. In this laboratory, the students first
simulated the frequency response of the two filter circuits in PSpice to verify their viability; each
has a cutoff frequency near 1 kHz. They then changed the excitation sources to square waves
and performed a transient simulation to illustrate input versus output waveforms for several
waveform cycles. As an introduction to the virtual instrumentation toolkit, students were
provided access to a virtual oscilloscope (see Figure 9) via the National Instruments LabVIEW
software and ELVISmx drivers. Upon gaining familiarity with virtual device settings and
oscilloscope controls, the students each built the two active filter circuits depicted in the
schematics in Figure 8. Specific instructions were offered with respect to RASCL board
connections and the analog input channels on the myDAQ units, since the students had not
previously used these tools to acquire signals. Once the students verified that the circuits were
functional, they performed transfer function analyses (by stepping the frequency of an input
sinusoid obtained from the analog function generator on the RASCL board) and noted the
responses to an analog input square wave. Experimental values were then compared to
simulated behavior, and the students responded to a set of summary questions. Rather than use
written laboratory notebooks, students were asked to record data/images from each major
element in a Microsoft Word file. The Word files were then used to provide grades and to verify
that the learning objectives were met.
Figure 8. Sallen-Key (upper) and Multiple-Feedback (lower) filter configurations to be
assessed during the course of this laboratory exercise.
Figure 9. Oscilloscope virtual instrument front panel.
Electrodes Laboratory
Electrodes Laboratory – Overview. The goal of this laboratory is to introduce students to
instrumentation amplifiers and their practical use in biomedical electrode applications. Each
student will build instrumentation-amplifier-based circuitry to acquire electrocardiograms (ECGs)
and electro-oculograms (EOGs). The design element for this laboratory will involve the
configuration of a cascade of suitable filters to remove unwanted signal elements while keeping
the desired signals intact. The exercise will utilize a cyber-laboratory learning kit consisting of a
newly-developed Rapid Analysis and Signal Conditioning Laboratory (RASCL) board3, a
National Instruments (NI) myDAQ® USB data acquisition module, and a set of NI LabVIEW®
virtual instruments (VIs).
Electrodes Laboratory – Learning Objectives. Upon completion of this laboratory, each
student should be able to do the following:
•
•
•
Place ECG and EOG electrodes at meaningful locations on the human body
Construct circuitry to acquire differential signals from body-worn electrodes
State the advantages of an instrumentation amplifier over a simple difference amplifier
3
The RASCL board was designed in the KSU Medical Component Design Laboratory in consultation with National Instruments, East Carolina University, the KSU Electronics Design Laboratory, and KSU ECE faculty/students. •
•
•
•
•
•
•
Acquire and analyze signals using the RASCL, myDAQ, and LabVIEW toolset
Utilize the two isolation channels on a RASCL board
Describe the features of time-domain ECGs and EOGs
Relate time-domain features of ECGs and EOGs to their corresponding frequency spectra
Compare characteristics of ECGs and EOGs in the time and frequency domains
Design filter circuitry to remove unwanted signal components in ECG and EOG signals
while retaining desired signal components
Archive the results of such an experience in an electronic format
Electrodes Laboratory – Condensed Protocol. In preparation for this laboratory, the students
first configured the virtual oscilloscope as in the active filters laboratory. They then constructed
the electrocardiograph (ECG) depicted in Figure 10, where one of the primary learning
objectives was to gain familiarity with the isolation channel hookups. They were then asked to
create a follow-on filter sequence (as in Figure 11) that would remove the undesirable signal
components. An ECG virtual instrument (see Figure 12) was created to help them visualize their
signals in the time and frequency domains. Once this circuit was functional, the students were
instructed to place the electrodes on their temples toward the outside of each eye and seek to
obtain an electro‐oculogram (EOG) based on the same principles that guide ECG acquisition. In
this context, a glance to the left should generate a time-domain “pulse,” and a glance to the right
should generate a similar pulse but with the opposite polarity. As before, rather than use written
laboratory notebooks, students were asked to record data/images from each major element in a
Microsoft Word file. The Word files were then used to provide grades and to verify that the
learning objectives were met.
Figure 10. Example circuit for a medical ECG monitor.4
4
Analog Devices. “Low Cost, Low Power Instrumentation Amplifier,” AD620 Data Sheet, ©1999, Analog Devices, Inc. http://www.analog.com. Figure 11. ECG filter cascade.
Figure 12. ECG acquisition and analysis VI.
C. Assessment Surveys
At the end of the semester, the authors gave the 11 students in ECE 628 the following survey in
an effort to better understand their experiences with these new learning tools and their
impressions of the technology. Note that the survey results are also contained on the
following pages in an effort to save space. The numbers in the far right column are the mean (x)
and standard deviation (σ) for the numerical values reported.
This semester we used portable instrumentation kits in ECE 628 that each included National Instruments (NI) LabVIEW virtual instruments, a newly released NI myDAQ personal data acquisition unit, and a KSU‐
designed Rapid Analysis and Signal Conditioning Laboratory (RASCL) board. The following survey was 0.7
0.8
Excellent
Moderate
3.5 0.9 4.3 0.9 3.9 0.9 Much
3.6 1.2 Some
Topical Learning Experiences
How much learning occurred during the …
• active filter session? • instrumentation amplifiers session? How much interest in active filters was added because of …
• the hands‐on element? σ
3.0
3.2
None
Overall Perceptions
Rate your overall experience with the tools themselves.
Rate your overall experience with the topical laboratories.
Rate your ability to acquire and analyze signals with this portable toolset. Note the potential impact that these types of hands‐on exercises, even if simple, could have on the effectiveness of traditionally lecture‐only courses like Circuit Theory I/II or Linear Systems. Note the potential impact of the ability to do hands‐on circuit work at home versus in the Engineering complex. Specify the value of recording experimental results from such experiences in electronic format instead of handwritten notebooks. Poor
created to gather feedback regarding this toolset and the associated learning experiences. Since this form does not employ active check boxes, please use a highlighter tool (or other marker) in Word or Acrobat to identify numerical responses, then upload the updated file to KSU Online or email it to the instructor. σ
2.9 1.0 3.5 1.2
3.2 1.1 • the visual nature of the software interface? How much interest in instrumentation amps was added because of … • the hands‐on element? 3.4 0.6 • the visual nature of the software interface? Regarding circuit construction on the breadboard …
• What level of distraction did it add? 3.5 0.8 • What level of welcome diversion did it add? When you compare your prior filter familiarity with your familiarity with filter concepts after using these portable tools, what level of understanding was added in the following areas? 2.8 0.8 3.1 1.1 2.4 1.2 σ
•
•
How filters affect sinusoids at different frequencies How filters affect non‐sinusoidal signals 1.8
2.3
•
•
Challenges that analog filters pose during construction Theoretical versus experimental filter transfer functions Simulation of frequency‐domain filter performance Performance differences in SK versus MFB filters 2.7 1.3 •
•
0.7
1.3
2.5 1.2 2.3 1.1
3.6 1.1
Much
Some
None
Topical Learning Experiences (cont.)
When you compare your prior instrumentation amplifier familiarity with your familiarity with these same concepts after using these portable tools, what level of understanding was added in the following areas? • The ability of an instrumentation amplifier to help remove common‐mode signals • The benefits that instrumentation amplifiers offer over simple difference amplifiers • The need to follow an instrumentation amplifier with a cascade of suitable filters When you compare your prior biomedical electrode familiarity with your familiarity with this same concept after using these portable tools, what level of understanding was added in the following areas? 3.3 0.7 3.0 0.9 3.3 1.1 σ
•
•
•
3.0
3.5
Placement locations for biomedical electrodes Circuitry to acquire signals from biomedical electrodes Types of signals one can acquire with biomedical electrodes • Time‐domain shapes of signals provided by biomedical electrodes • Frequency content of signals provided by biomedical electrodes • Relationships between the time‐domain components and their corresponding frequency‐domain spectra • Time‐ and frequency‐domain differences between ECG and EOG signals. • Filters appropriate for ECG and EOG signals. What level of ownership and interest would be added on your part if assembling your own RASCL unit was part of the ECE curriculum? Specific Tool Functionality
•
•
•
•
•
•
•
•
3.2 1.3 3.0 1.3 2.6 1.3 3.1 1.2 3.1 1.0
Easy
Neutral
3.9 0.7 σ
4.5
4.0
3.9
2.6
1.8
3.5
3.8
2.9
RASCL prototyping area? RASCL power supply? RASCL quick connect terminal block? RASCL function generator? RASCL electrical isolation channels? myDAQ analog I/O channels? Standard LabVIEW VIs for the myDAQ unit? Electrodes VI? 1.2
1.1
3.8 0.9 Difficult
How easy to use was/were the … σ
0.8
1.5
0.9
1.1
1.0
1.0
0.7
0.9
Written Responses How much time do you estimate was required for each of the two portable labs? 3 - 5 hours is typical (some responses were given in ranges)
Would you prefer to learn instrumentation concepts using handwritten assignments, hands‐on assignments, or both? Handwritten: 1; Hands-On: 5; Both: 5
With the exception of ECE 210/502/628, have you ever built circuits and tested the theoretical concepts learned in lecture‐format classes? Yes: 7; No: 4
What improvements/features might be added to the RASCL/myDAQ system to improve its … Usability? 1. Test the hardware and software before they are used
2. Battery packs for the power. Improved signal generator with LCD screen and
microcontroller. Some circuitry for communication or other emphasis areas.
3. Complexity of isolation channel. Function generator is not working.
4. Better labeling. Better isolation channel layout (make it easy to access)
5. Provide precise information on how to make connections.
6. Noiseless isolation channels, a better manual explaining how to hook up circuit. All the
proper parts. (Missing power cords to connect to the wall). More class instruction on the
software involved.
7. Provide a user manual that defines all of the input/output functions.
8. The frequency generator knobs are small and touchy. A larger interface and even a dipswitch will be preferred.
Durabiilty? 1. The power supply capacitors are easy to explode.
2. Carry-on case and a protective shield over the top circuitry
3. The power supply connection is tight and not rugged
4. Circuitry on the board should be covered and pots are fragile
5. Warning labels on anything that is too sensitive
Capability? 1. RASCL will be neat if all the bugs are figured out in advance.
2. Use of LabVIEW significantly limits the uses of device because of the price, and it can't be
used widely without the full license. It cannot be used but in class projects.
3. Need a cover or case to prevent the board being destroyed.
4. The highest frequency the function generator can reach.
5. Higher sampling rate and bandwidth.
6. More functions, such add a digital dial on the function generator.
7. Isolation circuit does not operate properly.
What is the most you would pay for a system like this if it were used in several classes over the course of your undergraduate career? (Note: An engineering textbook averages around $100, and the current cost of in‐state tuition for a three hour undergraduate engineering course is $262 x 3 = $786, including engineering fees.) ___ $0 ___ $50 ___$100 ___$200 ___$300 ___$400 ___$500 (check one) Average response: ~$205
How would you prefer to pay that amount? ___lump sum ___payments across semesters LS: 4; PAS: 7
Would you prefer to pay a lesser amount as ‘lab fees’ each semester to fund the purchase and upkeep of a set of RASCL units that would be available for check out? ___Yes ___No Yes: 6; No: 5
III. Results and Discussion
A. Learning Objectives
Learning objectives for the two laboratories were primarily assessed based on personal
observations as well as the Word files that the students submitted upon completion of the
laboratories. Regarding the active filter laboratory, the learning objectives were all met by all of
the students. This is not a surprise. First, the students in this course were all seniors or graduate
students in Electrical Engineering, and they had been exposed to these principles in multiple
previous classes, although some had not built multiple-feedback filters prior to this learning
experience. Second, the learning experience was designed to go well so that the students could
familiarize themselves with the toolsets and therefore have a positive impression of the
technologies.
In the electrodes laboratory, all of the learning objectives were not met. Students had difficulty
working with the isolation channels due to a combination of unclear instruction and noise that
was present in the channels due to the isolated DC-to-DC converter that was paired with the
signal isolation chips. Therefore, many of the teams were unable to complete the exercise, so
quantifying these learning objectives in terms of statistical assessments would be awkward.
Given that only two learning experiences were offered with this small group of students, the
authors decided to focus attention instead on the results of the student surveys, which would
yield interesting data regarding student impressions of the technology, as discussed in the next
section.
B. Student Surveys
An ordered summary of the survey responses is a sensible way to address these results. It is
important to note first that the themes bear more value than the survey numbers themselves, as
data only exist for 11 students. From the Overall Perceptions section, the overall response to
these tools was somewhat lackluster relative to expectations. The students indicated that overall
the tools were useful for acquiring and analyzing signals and that these tools could have a
substantive impact on typically lecture-only courses. While we previously assumed that every
student would have access to computing resources at home, it is clear that students still question
the value of the tools for this purpose. In our initial experiences, most students preferred to use
the machines in the laboratory rather than their own laptops, because they did not want to invest
the time to install all of the software on their laptops just to support two extended laboratory
sessions.
In terms of the Topical Learning Experiences, the authors do not find it surprising that minimal
learning occurred in these laboratories given the ages and technical backgrounds of the students
involved. Of the two sessions, the electrodes session offered better learning opportunities
because most of the students had not previously employed biomedical electrodes in their work,
so they were unfamiliar with both the signal shapes and frequency content involved. Learning
also occurred with respect to instrumentation amplifiers, likely because many of the students had
not previously had occasion to make differential measurements in a meaningful context. In the
active filters laboratory, the only learning element of note involved the multiple-feedback filters,
which many of the students had not seen before this class. One positive note is that the
responses imply added interest because of the hands-on and visual nature of the exercises,
although this additional interest was moderate. Students did not particularly mind building the
circuits and did see the process as a moderate positive diversion.
Feedback on the tools themselves was the most encouraging part of the survey results. The
students responded positively to that idea that building such a toolkit (at least populating the
board) would be a good ownership exercise as part of the curriculum. Ease-of-use responses
were high for the primary elements of the RASCL board. The exceptions were the function
generator and the isolated channels. During the lab, some students noted a small range of
frequencies over which a signal could not be provided, and they also noted a cap on the
frequency range that was much lower than the anticipated 1 MHz. Both of these issues have
been fixed. They also expressed frustration with the isolation channels, both in terms of signal
quality and ease of use.
From the responses to the open-ended questions, one can ascertain that the laboratories required
the right amount of student time (~3-5 hours) and that the students overall enjoyed the hands-on
emphasis. The authors found it surprising that almost half of the students had not built and tested
circuitry outside of the three classes that were noted. Students did have good suggestions for
board improvements; these have been noted and will be addressed in version 3.1, which will
include fixes for the function generator and the isolated channels. On average, this group of
students noted that $200 would be a good target price for such a toolset. C. General Lessons Learned
Students can be rough critics when evaluating hardware and software tools created for their use.
The authors experienced this reality on this project as well as in previous efforts.14 Students
expect that products will work immediately and without fault. Further, they expect full technical
support and have little patience. This issue is exacerbated when one considers that students often
design and build products created to help other students learn, and students will make mistakes at
a greater rate than a professional engineer. Consistent with these thoughts, as also seen in
previous efforts, is the notion that significant maintenance and product support are needed with
student tools, as today’s students have little patience for uncertainty and are generally not driven
debuggers. They are more likely to throw up their hands and give up than to fight a problem
until they overcome it.
Regarding the creation of the physical hardware, the development team learned the value of
ground-loop reduction on boards of this size, even at these low frequency ranges. Power
supplies and the durability of components need special scrutiny. For this type of design,
infrequently used areas of the board (i.e., the isolation channels) can be the most costly, and
access to parts can be an issue in a poor economy. E.g., the team had to wait months for
connectors because they had not been stockpiled in an effort to lower costs. Finally, the process
of board population does have a social element, as illustrated in Figure 13: engineering students
like to build things, and the process can be fun as a group.
Figure 13. The social element related to board population/testing.
IV. Conclusions
Portable data acquisition toolkits offer alternatives for traditional benchtop-laboratory-based
learning experiences. This paper presented upgrades to one of those toolkits, which utilizes a
National Instruments myDAQ unit and a custom Rapid Analysis and Signal Conditioning
Laboratory (RASCL) that serves as a hardware interface to the myDAQ platform. The value of
these tools was assessed within the context of two laboratory experiences that addressed active
filter circuits and biomedical electrode circuits. Pre- and post-session surveys and assessments
indicate that (a) learning objectives were effectively met with this technology, (b) students find
the toolset to be a sensible alternative to learning environments that employ desktop
instrumentation, and (c) students would be willing to invest in a such a resource, as it would be
useful for many analog and digital courses offered in standard electrical and computer
engineering curricula.
Acknowledgements
This material is based upon work supported by the National Science
Foundation Course, Curriculum, & Laboratory Improvement (CCLI) Program
(now the Transforming Education in Science, Technology, Engineering, and
Mathematics (TUES) Program) under Type I grant DUE–0942425. Opinions,
findings, conclusions, or recommendations expressed in this material are those
of the author(s) and do not necessarily reflect the views of the NSF.
References
[1]
[2]
[3]
[4]
[5]
[6]
[7]
[8]
[9]
[10]
[11]
[12]
[13]
[14]
Martinez, Angel. "Acquisition of Heart Rate and Core Body Temperature in Cattle Using Ingestible Sensors,"
Electrical & Computer Engineering. Manhattan, KS, Kansas State University, 2007, 77 pages.
Warren, Steve and Jianchu Yao, "Portable Cyber-Laboratories for Electrical Engineering Education," 2010
Annual Conference and Exposition, American Society for Engineering Education, Louisville, KY, June 2023, 2010.
Richard L. Clark, Jr., George H. Flowers, Peter Doolittle, Kathleen Meehan, and Robert W. Hendricks,
"Work in Progress - Transitioning Lab-in-a-Box (LiaB) to the Community College Setting," 39th ASEE/IEEE
Frontiers in Education Conference, San Antonio, TX, October 18-21, 2009, pp. W1J-1 to W1J-6.
Millard, Don, "Workshop - Improving Student Engagement and Intuition with the Mobile Studio Pedagogy,"
38th ASEE/IEEE Frontiers in Education Conference, Saratoga Springs, NY, Oct. 22–25, 2008, pp. W3C-1.
Millard, Don, "Work in Progress: Hands-On Exploration of the "Big Ideas" in Electric Circuits," 36th
ASEE/IEEE Frontiers in Education Conference, San Diego, CA, October 28–31, 2006, pp. M4D-3 to M4D-5.
"Electronics Explorer Board," Digilent, Inc., 2010,
http://www.digilentinc.com/Products/Detail.cfm?NavPath=2,842,843&Prod=EEBOARD.
Yao, Jianchu, Loren Limberis, and Steve Warren2, "Work in Progress – A Ubiquitous Laboratory Model to
Enhance Learning in Electronics Courses Offered by Two Universities with Dissimilar Curricula," 40th
ASEE/IEEE Frontiers in Education Conference, Washington, DC, October 27-30, 2010, pp. F3C-1 to F3C-2.
Warren, Steve and Jianchu Yao, "Work in Progress - Updates to a Mobile Circuits-and-Signals Learning Kit
that Incorporates a USB Data Acquisition Unit," 40th ASEE/IEEE Frontiers in Education Conference,
Washington, DC, October 27-30, 2010, pp. S2H-1 to S2H-2.
Martinez, Angel and Steve Warren, "RASCL: A Portable Circuit Prototyping Laboratory," 2007 Annual
Conference and Exposition, American Society for Engineering Education, Honolulu, HI, June 24-27, 2007.
"NI myDAQ Setup and Support," National Instruments, 2010, http://www.ni.com/mydaq/support.htm.
"NI ELVISmx Help," National Instruments, 2009,
http://digital.ni.com/manuals.nsf/websearch/A824CCCC5C5B768B8625758D0054C466.
"NI ELVIS: Educational Design and Prototyping Platform," National Instruments, 2009,
http://www.ni.com/nielvis/.
Yao, Jianchu, Loren Limberis, and Steve Warren, "Using Portable Electronics Experiment Kits for
Electronics Courses in a General Engineering Program " 118th Annual Conference of the American Society for
Engineering Education, Vancouver, BC, Canada.
Warren, Steve, Nidhi Tare, and Andrew Bennett, "Lessons Learned from the Application of Online
Homework Generation Modules in a Signals and Systems Course," Frontiers in Education 2008, Saratoga
Hotel and Conference Center, Saratoga Springs, NY, Oct. 22-25, 2008, pp. T4B17-T4B22.