1
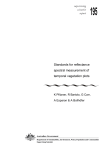
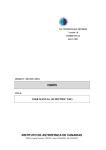
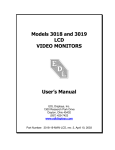
SPECTRAL PRODUCTS
111 Highland Drive • Putnam CT, 06260 • (860) 928-5834
SM32Pro ver2.9
Table of Contents
Warranty and Liability
Quick Start Installation Guide
Upgrade Installation Guide
System Requirements
Requirements for the Hardware
Requirements for the Software
Check System Package Contents
Introduction
Software Installation
Before You Start:
Software CD Installation:
Main Screen:
Menu Bar:
Command Button Bar:
Command Buttons and Dialog Boxes
Graph Control Buttons:
Information Display Area:
Status Display Bar:
Quick Access Controls:
Graph Sliding Bar Controls:
Special Function Tab:
Color Analysis Mode:
1
2
3
4
4
4
4
5
5
5
5
8
9
12
12
20
21
21
22
22
22
23
1
Warranty and Liability
This SM product is warranted against defects in material and workmanship for a
period of one year from the date of shipment. During the warranty period, Spectral
Products will, without charge, repair or replace, at its discretion, the defective product or
component parts.
For warranty service or repair, this product must be returned to a service facility
designated by Spectral Products (SP). For products returned under warranty, the Buyer shall
prepay shipping charges (including shipping charges, duties, and taxes for products returned
to SP from another country), and SP will pay for shipping charges to return the product to
the Buyer.
This warranty does not apply in the event of misuse or abuse of the product or as a
result of unauthorized alterations, modifications or repairs, if the serial number is altered,
defaced or removed, the improper or inadequate maintenance by the Buyer, Buyer-supplied
software or interfacing, or improper site preparation or maintenance. No other warranty is
expressed or implied. SP shall not be liable for any consequential damages, including
without limitation, damages resulting from loss of use, as permitted by law.
1
Quick Start Installation Guide
This quick start guide will instruct you through the installation of the SM32Pro
software package. Please follow the instructions closely to complete the installation. Before
beginning, read through this entire guide.
1. Insert the SM installation CD into the appropriate CD-Rom drive. (The installation
should begin automatically. If not, open the cd through windows explorer and click
on the “setup.exe” file to begin the installation manually.)
¾ In USB applications, it is recommended to leave the unit disconnected from the
computer until the software has been installed and the system has been rebooted.
2. The first screen displayed requires you to input the user name, company name, and
serial number. The full serial number is found on the unit or on the calibration
certificate included in the data package provided by SP.
3. Accept all the defaults of the next three screens by simply pressing next through
each.
¾ After these steps are completed, the installer will begin copying the files into the
designated folders on the system.
4. The installation is now complete. Click finish and manually restart the computer to
finish installation of the software.
2
Upgrade Installation Guide
This upgrade installation guide will instruct through the installation of the SM32Pro
upgrade software package. Please follow the instructions closely to complete the installation.
Before beginning, read through this entire guide and be sure that the unit has been
disconnected from the computer.
Note: Be sure NOT to un-install any previous version of SM32Pro before you
upgrade.
1. Insert the SM installation CD into the appropriate CD-Rom drive. (The installation
should begin automatically. If not, open the cd through windows explorer and click on
the “setup.exe” file to begin the installation manually.)
¾ In USB applications, it is recommended to leave the unit disconnected from the
computer until the software has been installed and the system has been rebooted.
2. The first screen displayed requires you to input the user name, company name, and serial
number. The full serial number is found on the cover of the SM32Pro.ini diskette that
was included in the system package.
3. Accept all the defaults of the next three screens by simply pressing next through each.
¾ After these steps are completed, the installer will begin copying the files into the
designated folders on the system.
¾
4. The installation is now complete. Click finish and manually restart the computer to
finish installation of the software.
3
System Requirements
Check that your computer meets the minimum requirements for the SM32Pro system.
Requirements for the Hardware
Ø One free slot or port of appropriate type to insert board or connection to the
spectrometer
Requirements for the Software
Ø Any IBM compatible computer with a 486 processor or higher (Pentium 100 or
higher is strongly recommended)
Ø A hard drive with at least 50 MB free space
Ø A 3 ½ inch high density floppy drive (1.44 MB)
Ø A CD-ROM
Ø A VGA or compatible display
Ø 16 MB RAM (32 MB recommended)
Ø A mouse or other pointing device
Ø Microsoft Windows® 98, 98SE, ME, NT, 2000, or XP
Check System Package Contents
Check that your SM system package contains all of the required components.
Common system packages contain the following:
•
•
•
•
Spectrometer
A/D board (unless a different interface was requested)
Cable and Adapter
Any accessories ordered
*Note: Package contents may vary from unit to unit and order to order. If you have
any questions about the contents of your package, please contact the support team
referred to in the back of this manual.
4
Introduction
SM32Pro is a Windows based operating software designed for use with SP SM series
spectrometers. SM32Pro is a true 32-bit application and optimized for SM spectrometer
operation control, data acquisition, data manipulation, graphic display, and other features.
This user manual will cover the software installation and the various function buttons and
features. Please refer to appropriate SM spectrometer hardware user manual for hardware
installation and application information.
The SM spectrometers EEPROM contains instrument specific model information as
well as wavelength calibration information. When you run the spectrometer, the data in the
EEPROM will be saved as a text file type in the “Ini” file folder of the software. Users can
use the saved text file to get the calibration data if necessary. Please contact Tech Support if
such a file is in question.
Software Installation
Before You Start:
It is recommended that the user review the SM spectrometer hardware user manual
first to get familiar with the hardware involved. All customers are advised to pay extra
attention to the voltage and other electrical ratings associated with the SM spectrometer
products to avoid any unnecessary equipment damage.
The following section will describe the SM32Pro software installation procedures. It
is recommended that the operating software be installed prior to the hardware installation.
Software CD Installation:
In case of the SM2XX or SM5XX USB spectrometer series users, refer to the
installation manual that SP provides along with the unit.
1. Insert the SM32Pro installation CD into the computer CD ROM.
2. When prompted, enter the instrument serial number as written on the SM spectrometer
and then enter the data acquisition code. The code consists of two letters based on the
data acquisition board manufacturer and interface types:
The SM32ProForUSB is only for USB board users, so the ending of the serial number has
to be always “EU”.
5
3. Choose the destination location to install the program. Click the Next button after
setting the destination directory.
4. You can choose to install the SM32ProForUSB and/or the SDK examples by checking
one or both of them. After selecting, click “Next”.
6
5. Click the “Install” button when you are ready. If you would like to change anything in
the process, just click “Back” until the stage required appears. If you click the “Install”
button, the selected software package will be installed completely and the link icon to the
program will appear on the computer desktop.
7
Getting to Know SM32Pro
Main Screen:
The main screen consists of a menu bar, command buttons bar, cursor value and
timeline recording display area, graph control buttons bar, project and sample information
area, status display area, quick access controls, and a graphic display area.
The graphic display chart consists of two Y scales as well as an X-axis. The Y-axis
on the left displays a relative intensity scale in A/D counts in Scope mode while the right Yaxis is defaulted to percentage. The maximum counts shown on the left Y-axis for a 16-bit
spectrometer is 65536 (USB version). When in Scope mode, the X-axis display is in pixel
number or in wavelength number. The maximum pixel number is, for example 0 to 2048
for Sony ILX511 CCD or to 3648 for Toshiba TCD1304 CCD, or it will display the desired
wavelength range.
8
Menu Bar:
Almost all menus are correlated to the Toolbars so only special functions are explained in this
section.
CALIBRATION - WAVELENGTH:
Custom wavelength calibration is supported by use of the Calibration tool in
Calibration->Wavelength. This menu is activated only under the “pixel” mode.
NOTE: Only the advanced users who have a calibration light source are recommended
using this menu.
CALIBRATION DIALOG BOX:
Custom wavelength calibration is achieved via the use of the Calibration dialog box.
The dialog box consists of a text-editing table for wavelength and pixel value entries, and
five different options for loading existing as well as future calibration sets or templates. In
calibration mode, all other spectrometer control functions are still supported in the
background.
Refresh for Find Peak:
This command button allows the peak finder to update.
different calibration reference sources are involved in the procedure.
9
This is useful when
Load options:
Custom Cal Set:
The wavelength calibration set that the SM32Pro utilizes for conversions between
different X-axis units is the one labeled as Custom Cal Set. When the Custom Cal Set check
box is selected, the display window lists the known wavelength values and corresponding
pixel numbers in a tabular format.
Use the Select Custom Cal Set drop down list to highlight the desired wavelength
calibration set and then click Load to bring the values into the table for adding or
subtracting any custom pixel to wavelength reference lines.
Auto Peak Data:
Upon entering the Calibration mode, Peak Finder is automatically started. To use
these peak values, (pixels) to generate a new calibration set, select the Auto Peak Data option
and click on Load. The pixel values that correspond to the found peaks will be copied into
the Pixel column for further editing.
The matching known wavelength values can be manually typed into the
corresponding cell in the Wavelength column, or click on the Wavelength cell and use the
drop down list to select wavelengths from the built-in wavelength database which is
comprised of known lines for an HgAr lamp.
Cal Data Base:
This option allows the known wavelength database to be brought into the
Wavelength column. Choose a desired wavelength from the Select Data Source drop down
list and click on Load for the data to be imported.
Factory Default Set:
This option allows the import of the factory created calibration set into the
calibration-editing table. Click on Load to make the imported data effective.
New Cal Set:
Selecting this option and then clicking Load clears the calibration editing table for
use to create a new custom calibration set. Wavelengths can be either typed in manually or
selected by use of the drop down list as described earlier.
After the creation of the new calibration set type in the desired name into the Select
Custom Cal Set field and click on “Save” for the changes to be made. Click on Apply as
Default to use this particular calibration set as a default.
10
CALIBRATION - IRRADIANCE:
Custom irradiance calibration is supported by use of the Calibration tool in
Calibration->Irradiance. This menu is activated only under the “pixel” mode and after taking
the dark scan.
NOTE: SP facilitates the irradiance calibration of the unit. Please contact SP to do the
irradiance calibration.
SETUP - CUSTOMIZE:
By use of the Customize option in the Setup menu, one can customize the print
report.
CUSTOMIZE DIALOG BOX:
The Organization name, Operator name and Sample name can be custom changed
to be included on the print report.
11
Command Button Bar:
Most of the system operating functions can be realized by use of the command buttons.
The command buttons are arranged as general control buttons with embedded pull down dialog
boxes, which are opened by clicking on the little arrow on the right side of the button.
Command Buttons and Dialog Boxes
*NOTE: After working with any dialog boxes described in this or later sections,
simply click outside of the dialog box for changes to be effective and to exit.
MENU: SETUP – SM Setup…
The SM Setup function allows you to change operating parameters for the
spectrometers. Clicking the top right arrow can activate the pull down dialog boxes.
SM SETUP DIALOG BOX:
SCOPE MODE is the default-operating mode, which enables the live updating of
the measurements.
MEMORY MODE will be entered automatically when a play back operation is
performed. The play back of recorded spectra can be achieved by using the Import
command button. To exit the repeating play back of recorded spectra, the user needs to use
this dialog box to change from RECORD MODE back to SCOPE MODE.
12
The Integration Time is to set the exposure time of the detector. The Time
Average is to average the given number of scans. It helps to reduce the noise level. The
Binning Average is also used to reduce the noise by averaging the given number of
neighbor pixels’ values so it also can cause some deformation of the real signal. The FFT
Smoothing is to reduce the noise in the translated frequency domain and also can help to
reduce the noise level.
When the Pixel Base display mode is selected, the wavelength display in X-axis by
clicking “W” button on the Graph Display Control at the upper right corner of the main
window will be supported in Scope Mode (see also Graph Display Control Buttons
below). The Pixel Base displays the wavelengths on the X-axis according to the detector
pixels corresponded in appropriate modes. The wavelength increment is the actual
wavelength difference between two adjacent detector pixels.
When Wavelength Base is enabled, the customized wavelength range can be set up
in the extended dialog box (by clicking the green arrow button). The Show
Wavelength(nm) can be enabled in this base. The start wavelength, the end wavelength
and the wavelength interval can be set up after activating the Show Wavelength(nm).
Those values have to be located within the real full wavelength range shown right under the
Show Wavelength(nm) button.
When the External Trigger box is checked, this will allow you to trigger the
spectrometer from an external source. The minimum external triggering available will be
dependent on the integration time, the data transferring rate of the system, and the graphic
display overhead time. The data transferring rate and the graphic display time depends on
the computer performance (CPU speed, memory speed, and graphic card speed and so on).
Generally it takes ~10-15msec for data transferring rate, ~50-200msec for graphic display
time. The lowest duty cycle for the external signal should be more than the consumption
time for the data acquisition.
In the Grid and Color of Background pane, the color of each line and the graphic
window background can be selected. The Grid X and/or the Grid Y are/is to present the
scales on the coordinates. If the X Data and/or the Y Data are/is activated, the X and/or Y
values will be displayed according to the mouse pointer position on the graphic window.
For the Multi-channel user: In the case of using multi-channel configuration, the
SM Setup dialog window will show the “Channel Setting” section. By changing the USB Port
Number, you can select each channel connected. The USB Port Number will be numbered
by the order of plugging to USB ports in your computer.
13
MENU: Operation – Dark Scan/Setup – Dark Scan Conf…
The Dark Scan function allows you to perform a dark scan. It is recommended that you take
a dark scan after the spectrometer integration time is changed. To conduct a dark scan, first
block all light from entering the spectrometer.
DARK SCAN DIALOG BOX:
*NOTE:
The dark scan is required for %T/R, absorbance, and irradiance
measurements. Reference dark materials are essential for accurate measurement
results to be obtained in different measurement modes and wavelength regions.
Current Scan: The current scan option is provided to take a dark scan from the current
data that is being collected. This dark data can be saved for future dark scanning purposes.
Optical Blank: The optical blank option allows you to use the power emissions from the
32 pixels not used in the collection of data, which only emit dark signal.
File: The file option allows you to load the previously saved dark data or save the current
dark data.
MENU: Operation – Ref. Scan/Setup – Ref. Scan Conf…
This allows a reference scan to be taken, which is used in T/R% or absorbance
measurement for normalization. The pull down dialog box supports several reference scan
data sources, from current reference scan, or from a previously saved reference scan data
file.
REFERENCE SCAN DIALOG BOX:
14
Maximum T/R (%): When you wish to use the current reference scan as certain T/R
percents rather than just 100%, set this value as you want.
Current Scan: The current scan option is provided to take a reference scan from the
current data that is being collected. This reference data can be saved for future dark
scanning purposes.
Color Tile: If you chose the Color Tile option, the color tile options for Set Calibration
and Load Color Tile will appear in this dialog box. To use the color tile reference scan, you
first have to set the calibration of the specific color tile you wish to use as your reference.
Once that is done, the text on the Reference button will read Save Tile, you will click on
this to save the tile calibration as the name you have inputted into the box titled Project
Name. When you wish to use the calibrated tile as a reference you will choose the
calibration for the color tile you wish to use then click on the Load Color Tile option. It is
now ready to use the color tile. This function is used as a substitute for a white reference
scan.
File: The file option allows you to load the previously saved reference data or save the
current reference data.
*NOTE: The reference scan is required for %T/R and absorbance measurements.
Reference materials are essential for accurate measurement results to be obtained in
different measurement modes and wavelength regions.
MENU: View – Display Mode
This indicates the current measurement/display being displayed. The button is
enabled only after the dark and reference scans are taken. Click on the button when it is
enabled to change between regular scope mode, T/R%, absorbance
and
irradiance modes.
Display dialog box:
If irradiance is chosen, the irradiance options for absolute or relative measurements
and the distance will appear to the right of the selections. There are two kinds of irradiance
measurements. The Absolute Irradiance needs to be calibrated by using a calibrated light
source which is should be done at SP. Distance, is the distance from the light source to the
unit, and Relative Irradiance needs the calibrations spectrum of the light source, and the
color temperature of the light source. The Max/Min setting is for scaling the y-axis in each
mode.
For the absolute irradiance, please refer to the additional manual.
15
MENU: Operation – Record…
This allows for configurations for automatic sequential spectrum recording at
specified time intervals and to specified data files. The pull down dialog box allows for the
entry of starting time, ending time, and recording time interval in milliseconds (ms) or
seconds (s).
You can choose the duration you want to collect the data by using the time duration
function, or by choosing the actual amount of scans you wish to acquire.
TIMELINE DIALOG BOX:
The Timeline button will become Ready after all timeline recording parameters are
set. Click on the Ready button to start the timed recording process to record spectra
within the set duration as shown in the timeline dialog box.
After the start of the Timeline recording the Ready button will now be the Stop
button. Click on the button during recording process to terminate the recording.
*NOTE: The progress of the recording process is updated in the data display area
just above the graph display area.
MENU: Operation – Peak Find/Setup – Peak Find Conf…
This allows for the spectral peaks and peak values to be found and displayed. After
the peaks are identified, cross hair cursors will appear as you mouse over the peaks. The
peak values will be displayed in the Peak Data display window.
There are two user configurable parameters in the Find Peak pull down dialog box,
which are used by the auto peak finder for peak search. The Peak/Noise Ratio is a value
between 0.0 and 10.0 at an increment of 0.1. The higher the ratio the less sensitive the peak
finder will be. The Threshold (%) can be set between 0.0 and 100.0.
16
FIND PEAK DIALOG BOX:
In addition to the peak find, a cursor bar tool is provided. Right click anywhere in
the graphics display area and a cross cursor bar will appear with the cross point intercepted
by the spectral curve. The cross point values will be displayed in the middle of the display
area.
To move the cursor bar around simply place the mouse pointer to the vertical cursor
until the pointer changes, which indicates that the cursor bar now is selected for move. Left
click the mouse button and drag the cursor to where you desire it. You can also move the
cursor bar by pressing the left or right arrow keys on the keyboard. Right click in the
graphic display area to exit the cursor bar tool.
MENU: File – Load…
This allows for import of previously saved data to be displayed or processed in the
current application. This uses a simple dialog box comprised of 2 sections, the file box, and
the load button.
17
MENU: File – Save…
This allows export of spectral data to another program via OLE, to an excel file,
binary data file, or to a text data file in an ASCII format. The pull down dialog box allows
different file formats to be selected.
EXPORT DIALOG BOX:
Text Data: When this option is chosen, use the File control button to bring up the file
name dialog box for the entry of file name. The text data files will have the .txt extension.
The data values in the file are separated by a space between any pair of data. Data pairs are
separated by carriage returns. When the data is exported to an ASCII file, it is set up in a 3
column, tabular format for Pixel, Wavelength, and Intensity.
Graph Data: When this option is chosen, use the File control button to bring up the file
name dialog box for the entry of file name. The graph data files will be saved in BMP
format with the .bmp extension.
Save Memory: This option is available only when you save the scanned data using the “R”
button for recoding on the “Graph Control” dialog located at the upper right corner of the
main window. Please refer to the Graph Control Buttons section below. When this option is
chosen, use the File control button to bring up the file name dialog box for the entry of the
file name. The file name will be assigned an extension of .sdf for the binary data file format.
And it can be reloaded by the “Import”.
GRAMS/32 SPC:
When this option is chosen, use the File control button to bring up
the file name dialog box for the entry of file name. The data will be saved in GRAMS/32
SPC file format with the .spc extension.
18
MENU: File – Print…
This allows for print of the active spectrum. More specific data such as sample
source, slit, name, and project name are included in the printout, as well as the peak values
for the graph that was printed. These items can be set in the customize option in the
program.
19
Graph Control Buttons:
The Graph Control Bar is a convenient utility that puts all of your necessary graph
controls at your fingertips.
ZOOMING CONTROLS:
The Zoom control buttons provide zoom Reset (R), stepped Zoom In
(+), and stepped Zoom Out (-) controls. Flexible Zoom In can also be achieved
by left clicking and holding the mouse button and dragging to draw a Zoom In view window
inside the graphic display area around the interested portion. Clicking the R button does a
Complete Zoom Out. After a graph is zoomed in, two sliding bars will appear for vertical
and horizontal scroll control use. Move the mouse pointer to any of the sliding bars until
the pointer changes to a double arrow. Click and hold down the left mouse button and slide
to view desired spectral display area in the graph.
*NOTE: In addition to the zoom buttons, simply using the mouse pointer can
perform zoom in. To do so, left click, drag and draw a rectangular view window
around the interested area in the graph.
X AXIS UNIT CONTROLS:
The display control buttons allow for the selection of spectra to be displayed in pixel
(P), wavelength in nm (W) or inverse centimeters (I).
The W and I display modes apply in T/R% and absorbance measurement
modes only if the Wavelength Base is selected in SM Setup Dialog Box.
When Pixel Base is chosen in the SM Setup Dialog Box, the W, wavelength
display mode will also be available in Scope measurement mode.
PLAY BACK CONTROLS:
The play back control buttons provide functions when importing and
playing back recorded spectra.
This allows for continuous frame-to-frame play back of imported (recorded) spectra in
a reverse sequence.
This allows for play back of imported (recorded) spectra in a reverse sequence one
frame at a time.
This allows for the termination of continuous play back operation.
20
This allows for play back of imported (recorded) spectra in a sequence as recorded one
frame at a time. In non-recording mode, this button allows a snap spectral shot to be
taken each time when there is a click on it.
This allows for continuous play back of imported (recorded) spectra in a sequence as
recorded. In non-recording mode (Scope Mode) this button serves as a resume button
for continuous acquisition operation.
RECORDING CONTROL BUTTONS:
The R control will save the current spectrum into memory. The maximum
allowable number of spectra to be saved is dependent on the available memory
size.
After the manual recording of desired spectra, the Export dialog box may be used to
assign a file name for the recorded memory files. Thus, the files may be later imported for
play back purposes.
The D control allows the current displayed spectrum to be deleted from memory
manually.
Information Display Area:
The display area is located on top of the graphic display and is used for display of
mouse pointer positions on X and Y axes in the current spectrum (top left), cursor bar
values (middle), timeline recording progress (bottom left), and memory usage (top right).
Please also see Peak Finder and Timeline recording, for more information.
Status Display Bar:
The status bar provides information regarding the performed and ongoing
operations. These include dark scan status, reference scan status, color measurement status,
etc. After you run the dark scan, if you click the mouse left button on the DARK pane, the
dark scanned data will be displayed on the graphic window as black line (MENU: View –
Disp. Dark line). And if you click the mouse right button on this pane, the dark level will
be subtracted from the original data (MENU: View – Subtract Dark line). After you run
the reference scan, if you click the mouse left button on the REF pane, the reference
scanned data will be displayed on the graphic window as yellow line (MENU: View – Disp.
21
Ref. line). If you click the same mouse button on each pane again, the displayed signal will
be back to normal.
Quick Access Controls:
The quick access controls are located on the bottom right of the status display and
provide easy adjustments to (from left to right) integration time, time average, binning, and
FFT filtering settings. Move the mouse pointer to the desired controls and right click to
reduce the values or left click to increase the values.
Graph Sliding Bar Controls:
There will be two sliding bar controls for vertical and horizontal scroll use when a
zoom in tool is applied to the spectral display. Click on the sliding bar with the mouse
pointer and hold down while sliding to view different parts of the spectrum.
Special Function Tab:
After the dark and reference scans are performed, the Special Function Tab will have
Scope and Color tabs enabled. Clicking on the Color tab will enter the color measurement
mode. However, the color measurement mode will only be meaningful for spectrometers
configured for visible wavelength coverage. To exit the Color mode click on the Scope tab.
22
Color Analysis Mode:
The Color Analysis Mode, as a default, will measure and display color results in the
following main screen. The Stop button may be used for obtaining a snap shot and the view
of the color values.
COLOR SETUP - CUSTOMIZE:
By use of the Customize option in the Setup menu one can customize the print
report.
23
COLOR SOURCE DIALOG BOX:
The pull down dialog box on the top right of the Color command button provides
options for the delta E data source. When the Select Data option is checked reference
L*a*b* values can be entered into the dialog box. The delta E values in the color value
display window will now be the color difference between the current measurement results
and the entered values. Otherwise, the delta E values displayed will represent the color
difference between the current and the previous measurements.
24
Technical Support
Toll Free:
Tel:
Fax:
Website:
Email:
(877) 928-5834
(860) 928-5834
(860) 928-2676
http://www.spectralproducts.com
[email protected]
To help us serve you most efficiently, please collect some information for us before you call:
1. A detailed description of your problem
2. The specific error or error message you received
3. Your system information;
a. Software version
b. Version of Windows (98, ME, 2000, NT, XP, etc.)
c. Unit Serial Number
Our technical staff can be most effective if you are sitting at the computer while consulting
technical support.
25