1
MULTIMEDIA SOFTWARE FOR TEACHING ABOUT BRITISH
EMPIRE
_______________
A Thesis
Presented to the
Faculty of
San Diego State University
_______________
In Partial Fulfillment
of the Requirements for the Degree
Master of Science
in
Computer Science
_______________
by
Asritha Challa
Spring 2011
iii
Copyright © 2011
by
Asritha Challa
All Rights Reserved
iv
DEDICATION
I would like to dedicate my thesis to my family for their motivation, support and love.
v
ABSTRACT OF THE THESIS
Multimedia Software for Teaching about British Empire
by
Asritha Challa
Master of Science in Computer Science
San Diego State University, 2011
British Empire is the largest empire in the history of the world ever known,
influencing all over the globe. It had massive impact on the history of world, dominating for
two centuries and comprising about one quarter of the land area during the late 19th and early
20th centuries.
Motivation for this thesis is to develop an interactive GIS application to help students
learn British Empire history by utilizing modern computer technology. Studies prove that
students learn much more when they learn in an interactive way than by reading or listening.
This software is developed keeping in mind both teachers and students, so that both are
benefited. This software displays some points on the world map, which are read from CSV
(Comma Separated Values) files. The CSV files which will have the corresponding
information about countries ruled by British. Based on the initial year of British rule,
countries have been divided into three categories 18th, 19th and 20th century. Students can
click on these countries with the help of hotlink tool and see the interesting information
displayed on a window. A wiki link is given on this window that is different for each point or
country. Through this wiki link students have access to more interesting information about
the British Empire related to the country. Images, videos, web links etc will be there in the
wiki link, which will be useful for students to study the history.
This software is made with the help Map Objects Java Objects (MOJO) provided by
Environmental Systems Research Institute (ESRI) and Wiki Spaces to create web pages for
each country ruled by the British.
vi
TABLE OF CONTENTS
PAGE
ABSTRACT ...............................................................................................................................v
LIST OF TABLES ................................................................................................................. viii
LIST OF FIGURES ................................................................................................................. ix
ACKNOWLEDGEMENTS .................................................................................................... xii
CHAPTER
1
INTRODUCTION .........................................................................................................1 2
TECHNOLOGIES USED ..............................................................................................3 3
REQUIREMENTS.........................................................................................................5 4
ANALYSIS ....................................................................................................................7 5
COLLECTION AND PREPARATION OF DATA ......................................................8 6
DEVELOPMENT OF SOFTWARE AND ITS FEATURES .....................................15 6.1 Implementation ................................................................................................15 6.2 Tool Bar ...........................................................................................................27 6.2.1 Print Button .............................................................................................27 6.2.2 Add Layer ...............................................................................................28 6.2.3 Arrow ......................................................................................................28 6.2.4 Distance Measure Tool ...........................................................................31 6.2.5 XY Button ...............................................................................................31 6.2.6 Hotlink Tool ............................................................................................31 6.2.7 Help Button .............................................................................................34 6.2.8 Previous Extent .......................................................................................35 6.2.9 Next Extent .............................................................................................35 6.2.10 Zoom to Active Layer ...........................................................................35 6.2.11 Zoom to Full Extent ..............................................................................36 6.2.12 Zoom In .................................................................................................36 6.2.13 Zoom Out ..............................................................................................36 6.2.14 Pan.........................................................................................................37 vii
6.2.15 Pan One Direction .................................................................................37 6.2.16 Identify ..................................................................................................38 6.2.17 Find .......................................................................................................39 6.2.18 Query Builder........................................................................................39 6.2.19 Select Features ......................................................................................41 6.2.20 Clear All Selection ................................................................................41 6.2.21 Buffer ....................................................................................................44 6.2.22 Attributes...............................................................................................46 6.3 Menu Bar .........................................................................................................47 6.3.1 Add Layer ...............................................................................................48 6.3.2 Remove Layer .........................................................................................48 6.3.3 Legend Editor..........................................................................................48 6.3.4 Attribute Table ........................................................................................54 6.3.5 Create Layer From Selection ..................................................................54 6.3.6 Promote Or Demote Selected Layer .......................................................59 7
CONCLUSION ............................................................................................................61 8
FUTURE ENHANCEMENTS ....................................................................................62 BIBLIOGRAPHY ....................................................................................................................63
APPENDIX
USER MANUAL .........................................................................................................65 viii
LIST OF TABLES
PAGE
Table 5.1 Wiki Page URLs ........................................................................................................8 ix
LIST OF FIGURES
PAGE
Figure 5.1. Screenshot of 1700s CSV file................................................................................12 Figure 5.2. Screenshot of 1800s CSV file................................................................................12 Figure 5.3. Screenshot of 1900s CSV file................................................................................13 Figure 5.4. Map of the British Empire at its peak. ...................................................................14 Figure 6.1. Map after adding CSV files. ..................................................................................17 Figure 6.2. Bolt cursor. ............................................................................................................24 Figure 6.3. Information window when clicked on a star. ........................................................25 Figure 6.4. Screen shot of a sample wiki link. .........................................................................25 Figure 6.5. Screen shot of the map tools of the software. ........................................................27 Figure 6.6. Screen shot of the print button in the tool bar. ......................................................28 Figure 6.7. Screen shot of the print command window. ..........................................................28 Figure 6.8. Add Layer button. ..................................................................................................29 Figure 6.9. Add Layer dialog window. ....................................................................................29 Figure 6.10. Screen shot of the map before adding any additional layers. ..............................30 Figure 6.11. Screen shot after adding cities shape file to the map...........................................30 Figure 6.12. The Arrow Button................................................................................................31 Figure 6.13. The Distance Measure button. .............................................................................32 Figure 6.14. Screen shot demonstrating measuring the distance between two points. ............32 Figure 6.15. The XY Layer button...........................................................................................32 Figure 6.16. File Dialog for XY button. ..................................................................................33 Figure 6.17. Map after adding CSV file as a layer using XY button. ......................................33 Figure 6.18. Hotlink icon. ........................................................................................................34 Figure 6.19. Screen shot of the window when clicked with hotlink tool.................................34 Figure 6.20. Help button. .........................................................................................................35 Figure 6.21. Previous Extent icon. ...........................................................................................35 Figure 6.22. Next Extent icon. .................................................................................................35 Figure 6.23. Zoom to active layer. ...........................................................................................35 x
Figure 6.24. Zoom to full extent. .............................................................................................36 Figure 6.25. Zoom in. ..............................................................................................................36 Figure 6.26. Zoom out. ............................................................................................................36 Figure 6.27. Pan. ......................................................................................................................37 Figure 6.28. Drop down menu of the Pan One Direction. .......................................................37 Figure 6.29. Pan One Direction. ..............................................................................................38 Figure 6.30. Identify tool. ........................................................................................................38 Figure 6.31. Screen shot of result of using Identify tool. ........................................................38 Figure 6.32. Find tool...............................................................................................................39 Figure 6.33. Screen shot of using Find tool. ............................................................................39 Figure 6.34. Query Builder. .....................................................................................................40 Figure 6.35. Query Builder dialog window. ............................................................................40 Figure 6.36. Illustration of using Query Builder......................................................................41 Figure 6.37. Select Features icon. ............................................................................................42 Figure 6.38. Showing the options of Select Features...............................................................42 Figure 6.39. Select Features tool options. ................................................................................43 Figure 6.40. Clear All Selection icon.......................................................................................43 Figure 6.41. Clear All selection icon when grayed out............................................................43 Figure 6.42. Map when cleared all selections. .........................................................................44 Figure 6.43. Buffer icon. ..........................................................................................................44 Figure 6.44. Buffer icon when grayed out. ..............................................................................45 Figure 6.45. Screen shot of buffer window..............................................................................45 Figure 6.46. Demonstration of applying buffer. ......................................................................46 Figure 6.47. Attributes icon. ....................................................................................................46 Figure 6.48. Attributes icon when grayed out..........................................................................47 Figure 6.49. Screen shot using attributes feature. ....................................................................47 Figure 6.50. File menu. ............................................................................................................47 Figure 6.51. Theme menu. .......................................................................................................48 Figure 6.52. Layer Control menu. ............................................................................................48 Figure 6.53. Add Layer icon. ...................................................................................................49 Figure 6.54. Add Layer Dialog window. .................................................................................49 Figure 6.55. Map after adding lakes layer. ..............................................................................50 xi
Figure 6.56. Remove layer. ......................................................................................................50 Figure 6.57. Screen shot showing lakes layer selected in the Table of Contents. ...................51 Figure 6.58. Legend Editor. .....................................................................................................52 Figure 6.59. Map before changing the color. ...........................................................................52 Figure 6.60. Legend Editor window. .......................................................................................52 Figure 6.61. Color chooser.......................................................................................................53 Figure 6.62. Map after changing the color using Legend Editor. ............................................53 Figure 6.63. Map after adding CSV files of British Empire. ...................................................55 Figure 6.64. Legend Editor with Labels tab. ...........................................................................55 Figure 6.65. Labels feature using drop down menu.................................................................56 Figure 6.66. Map after adding labels to layer 1700s................................................................56 Figure 6.67. Open Attribute Table option from theme menu. .................................................57 Figure 6.68. Attribute table for layer country. .........................................................................57 Figure 6.69. Create layer from selection. .................................................................................58 Figure 6.70. Screen shot of the map after creating a layer from selections made. ..................58 Figure 6.71. Layer Control Options. ........................................................................................59 Figure 6.72. Moved Layer 1700s all the way to bottom. .........................................................60 Figure 6.73. Some layers unchecked in the table of contents. .................................................60 Figure A.1. Launching the tool. ...............................................................................................66 Figure A.2. Initial screen of the tool. ......................................................................................67 Figure A.3. XY Button highlighted. ........................................................................................67 Figure A.4. File browser to select CSV files. ..........................................................................68 Figure A.5. Map screen after adding the layers. ......................................................................68 Figure A.6. Map screen showing 1900s layer selected on the table of contents. ....................69 Figure A.7. Clicking on the Legend Editor.............................................................................70 Figure A.8. Legend Editor Window with Labels Tab. ...........................................................70 Figure A.9. Labels feature using drop down menu. ................................................................71 Figure A.10. Map after adding labels to 1900s layer. .............................................................71 Figure A.11. Clicking on the help menu. ................................................................................72 xii
ACKNOWLEDGEMENTS
I would like to thank Dr. Carl Eckberg for giving me this opportunity to work on this
thesis. Appreciate for his time and contribution towards the successful completion of this
project.
I thank Dr. Edward Beasley and Dr. Lewis Joseph for their support, contribution, time
and being in my thesis committee.
I thank my family for all the love and support they have given me. Also thank god for
all that he has given me in my life.
1
CHAPTER 1
INTRODUCTION
Geographic Information Science (GIS) is one of the ways that combines both data
and maps to display graphics where users can visualize the data and manipulate it. GIS is
used for local, national and global scale in various industries for example like agriculture,
forest, local housing developments, natural resources, history, population census, geography,
business, education, utilities, etc. Multimedia is very helpful when used in an interactive way
to teach students. Nowadays, the use of maps for representing data has been revolutionized.
GIS allows users to store, display, manipulate, analyze and link the data to the
locations on the maps. The GIS tool stores the data related to maps in each layer. Each layer
represents one specific type of data e.g. cities. Users can edit the layers individually or in
combination of more than one layer. It saves layers of information about a place and displays
the information on the map graphically, which gives users a better understanding of the
place. There are many packages provided by Environmental Systems Research Institute
(ESRI). Classroom usage of GIS encourages critical thinking, promote global awareness,
strengthen and extend technology skills, extend and expand your curriculum, introduce
students to real world technology applications, instill students with a sense of place, and
create in them a sense of community [13].
This GIS tool is developed using Map Objects Java Objects (MOJO). Map Objects
Java is a suite of Java based developer components for creating client or server side mapping
and GIS applications [9]. NetBeans Integrated Development Environment (IDE) is used to
implement the software. NetBeans IDE is a modular, standards-based, integrated
development environment written in the Java programming language [10].
My thesis is about teaching the British Empire in the world, that is developed using
GIS software making it easy for teachers to teach and simultaneously making it interesting
for the students to learn about British history in an interactive way. In this thesis, for each
country ruled by the British, a webpage is prepared using wiki spaces. The web pages can be
easily modified. For this two shape files are taken, one is world and the other is country.
2
The shape files are the ones, which are used to display the world map with countries
bordered on the tool (Graphical User Interface). The data is all about the countries that were
ruled by the British Empire. The countries are divided into three categories 1700s, 1800s and
1900s depending on the year of start of the British Empire in their country. This data is
represented in comma separated value files (i.e. CSV files). So both the shape files and CSV
files acts as the input or data files for the tool. The web pages, which are linked through CSV
files, contain information about the British Empire in their respective countries. Some of the
web pages also contain images, html links, you tube videos, etc.
This thesis report contains seven chapters. Chapter two explains about the
requirements for the software. Chapter three is about the technologies used to build this
software. Chapter four is about analysis of the software. Chapter five is about the data
collection, preparation and organization of data. Chapter six discusses about the
implementation of the software and all the features of the tool that are helpful to the users.
Chapter seven discusses about the scope for the future enhancement of this software.
3
CHAPTER 2
TECHNOLOGIES USED
The technologies used in the development of this software are Java and
Environmental Systems Research Institute’s (ESRI) ArcGIS software. GIS here stands for
Geographic Information Systems. Java is used since it is one of the hottest technologies
presently used in the software industry. Java is robust and it is simple to learn for those who
know C/C++ as it built based upon them. Java technology’s versatility, efficiency, platform
portability and security make it the ideal technology [7]. This software can be run on any
hardware platforms and operating systems as it is developed using Java that is platform
portable. As Java is free software any one can easily download it and use it. Graphical User
Interface (GUI) of this software is built using java’s Abstract Windowing Toolkit (AWT)
mixed with swings. AWT is a general interface between Java and the native system, used for
windowing, events and layout managers [2]. Java swings are a set of class libraries that
support building GUIs and graphics functionality for applications [12]. Swing gets native
look and feel for the user interface. Our GIS is mainly built using Map Objects Java Edition.
Map Objects Java Edition is a set of pure java components that can be used for creating GISenabled applications [6]. Some of the important things that we are going to discuss about
Map Objects Java Edition are cited at [6]. There are two groups of components that can be
used for developing GIS components. One is client-side components and the other is server
side components. Client side is used for mapping user interfaces and applications and server
side is used for integration with internet and enterprise applications. Map Objects essentially
consists of a number of JAR files containing UI java beans (extensions to java swing) and an
API of mapping components. Client side is the one that is used for this software. The
following are some of the core features available through Java Edition.
Displaying maps with dynamic, real time geographic data.
Allowing users to navigate and zoom through map layers.
Performing queries on spatial information.
Performing geometric operations.
4
Labeling and customizing map interfaces.
Map Objects Java Edition allows access to multiple data sources like CAD data, standard
image data and GIS data types.
Alternative technologies would be MOVB, JUMP and UDIG. MOVB is visual basic
based, is not free and is less portable. JUMP and UDIG are java based GIS freeware but
MOJO has more built in features.
5
CHAPTER 3
REQUIREMENTS
This tool is developed for the use of the department of history at San Diego State
University. It will be mainly used for teaching British Empire in the world by Dr. Edward
Beasley, Associate Professor of Modern British History at San Diego State University. This
tool is developed according to Edward Beasley’s needs. Software development guidance is
given by my thesis chair, Dr. Carl Eckberg from the San Diego State University, Computer
Science Department.
The following are the requirements for my thesis:
1. The platform requirements given by Dr. Carl Eckberg are to use GIS Tool with Map
Objects Java Edition.
2. To have any interesting and informational images, videos, html links, books etc in the
information displayed that are related to the British Empire.
3. Information about the British Empire in each country that was ruled by British.
4. Information about when the British rule started and ended approximately in each
country.
5. Information about important events, movements, wars etc for each country under the
British Empire.
6. Provide links to data related to the British Empire that are available on the internet,
like Wikipedia and other informational sites.
7. Information about whether a country is part of Commonwealth of Nations or not.
8. To divide the countries into three categories, depending on the British Rule in 1700s,
1800s and 1900s and represent them on the map with different colors.
9. The input data is read from CSV files that can be added by users.
10. When the user clicks on these points, all the information mentioned should be
displayed on a window for each point on the map.
11. The tool should be user friendly and explain about all the functional capabilities of
the tool in the help, which includes options like zoom in, zoom out, pan, add layers,
print the maps, help, measure distance between any two points on the map etc.
12. The tool should also explain about how to add the labels, change the colors of the
points displayed on the map and also shape of the points displayed.
13. The tool should be able to run on different platforms.
6
14. The links provided should open in any of the available browsers on the machine when
clicked on them.
15. The tool should be easy to download and install from a website.
7
CHAPTER 4
ANALYSIS
I have analyzed all the requirements and came up with these steps to develop the
software:
1. Prepare a list of all the countries that were and are under the British Rule.
2. Collect all the required data for each country that is to be displayed.
3. Prepare wiki pages for each country that was under the British Rule.
4. The content of wiki pages should be easy to modify. The user can delete or add the
content, if he finds any interesting stuff to add or delete any unwanted stuff.
5. Develop the code to read input files (CSV) and display as points on the map. Each
input file is added as a layer on to the map. Each layer should get different color for
its points on the map.
6. When the user clicks on the points displayed, a window should pop up with
information related to the British Empire corresponding to that point or country.
7. The links displayed on the window should be opened in any browser when clicked by
the user.
8. Provide help page explaining the different functionalities of the tool and how to use
the functionalities.
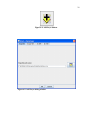
9. Provide user manual about how to get started with the tool (see Appendix).
8
CHAPTER 5
COLLECTION AND PREPARATION OF DATA
This thesis required a large amount of data to be collected, as the British Empire is
very vast.
As for my study searching through the information about the British Empire in the
World, I could list 84 different countries that were ruled by the British. I prepared wiki pages
for each of these countries with related information to the British Empire in that country.
Professor Edward Beasley (Department of History) and Professor Carl Eckberg (Department
of Computer Science) helped me in collecting data about the British Empire. All the wiki
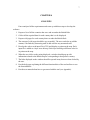
page links that I have prepared for the countries are listed in the Table 5.1.
Table 5.1 Wiki Page URLs
Country
URL
Afghanistan
http://britishempire-afghanistan.wikispaces.com
Anguilla
http://britishempire-anguilla.wikispaces.com
Antigua and Barbuda
http://britishempire-antiguaandbarbuda.wikispaces.com
Aruba
http://britishempire-aruba.wikispaces.com
Australia
http://britishempire-australia.wikispaces.com
Bahamas
http://britishempire-bahamas.wikispaces.com
Bahrain
http://britishempire-bahrain.wikispaces.com
Bangladesh
http://britishempire-bangladesh.wikispaces.com
Belize
http://britishempire-belize.wikispaces.com
Bermuda
http://britishempire-bermuda.wikispaces.com
Botswana
http://britishempire-botswana.wikispaces.com
Brunei
http://britishempire-brunei.wikispaces.com
Burma
http://britishempire-burma.wikispaces.com
Cameroon
http://britishempire-cameroon.wikispaces.com
(table continues)
9
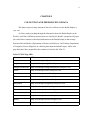
Table 5.1 (continued)
Country
URL
Canada
http://britishempire-canada.wikispaces.com
Cuba
http://britishempire-cuba.wikispaces.com
Cyprus
http://britishempire-cyprus.wikispaces.com
Egypt
http://britishempire-egypt.wikispaces.com
Falkland Islands
http://britishempire-falklandislands.wikispaces.com
Fiji
http://britishempire-fiji.wikispaces.com
Gambia
http://britishempire-gambia.wikispaces.com
Gibraltar
http://britishempire-gibraltar.wikispaces.com
Ghana
http://britishempire-goldcoast.wikispaces.com
Grenada
http://britishempire-grenada.wikispaces.com
Guyana
http://britishempire-guyana.wikispaces.com
Hawaii
http://britishempire-hawaii.wikispaces.com
India
http://britishempire-india.wikispaces.com
Indonesia
http://britishempire-indonesia.wikispaces.com
Iraq
http://britishempire-iraq.wikispaces.com
Ireland
http://britishempire-ireland.wikispaces.com
Israel
http://britishempire-israel.wikispaces.com
Jamaica
http://britishempire-jamaica.wikispaces.com
Jordan
http://britishempire-jordan.wikispaces.com
Kenya
http://britishempire-kenya.wikispaces.com
Kiribati
http://britishempire-kiribati.wikispaces.com
Kuwait
http://britishempire-kuwait.wikispaces.com
Lesotho
http://britishempire-lesotho.wikispaces.com
Malawi
http://britishempire-malawi.wikispaces.com
Malaysia
http://britishempire-malaysia.wikispaces.com
Maldives
http://britishempire-maldives.wikispaces.com
Malta
http://britishempire-malta.wikispaces.com
(table continues)
10
Table 5.1 (continued)
Country
URL
Martinique
http://britishempire-martinique.wikispaces.com
Mauritius
http://britishempire-mauritius.wikispaces.com
Nauru
http://britishempire-nauru.wikispaces.com
Nepal
http://britishempire-nepal.wikispaces.com
New Caledonia
http://britishempire-newcaledonia.wikispaces.com
New Zealand
http://britishempire-newzealand.wikispaces.com
Nigeria
http://britishempire-nigeria.wikispaces.com
Norfolk Island
http://britishempire-norfolk.wikispaces.com
Oman
http://britishempire-oman.wikispaces.com
Pakistan
http://britishempire-pakistan.wikispaces.com
Papua New Guinea
http://britishempire-papuanewguniea.wikispaces.com
Philippines
http://britishempire-philippines.wikispaces.com
Pitcairn Island
http://britishempire-pitcairn.wikispaces.com
Qatar
http://britishempire-qatar.wikispaces.com
Reunion
http://britishempire-reunion.wikispaces.com
St Helena
http://britishempire-sainthelena.wikispaces.com
St Kitts
http://britishempire-saintkitts.wikispaces.com
Seychelles
http://britishempire-seychelles.wikispaces.com
Sierra Leone
http://britishempire-sierraleone.wikispaces.com
Singapore
http://britishempire-singapore.wikispaces.com
Solomon Islands
http://britishempire-solomonislands.wikispaces.com
Somalia
http://britishempire-somalia.wikispaces.com
South Africa
http://britishempire-southafrica.wikispaces.com
Sri Lanka
http://britishempire-srilanka.wikispaces.com
St Lucia
http://britishempire-stlucia.wikispaces.com
St Vincent
http://britishempire-stvincent.wikispaces.com
Sudan
http://britishempire-sudan.wikispaces.com
(table continues)
11
Table 5.1 (continued)
Country
URL
Suriname
http://britishempire-suriname.wikispaces.com
Swaziland
http://britishempire-swaziland.wikispaces.com
Tanzania
http://britishempire-tanzania.wikispaces.com
Thailand
http://britishempire-thailand.wikispaces.com
Tonga
http://britishempire-thailand.wikispaces.com
Trinidad and Tobago
http://britishempire-trinidadandtobago.wikispaces.com
Tuvalu
http://britishempire-tuvalu.wikispaces.com
UAE
http://britishempire-uae.wikispaces.com
Uganda
http://britishempire-uganda.wikispaces.com
USA
http://britishempire-usa.wikispaces.com
Vanuatu
http://britishempire-vanuatu.wikispaces.com
Western Samoa
http://britishempire-westernsomoa.wikispaces.com
Yemen (Aden)
http://britishempire-aden.wikispaces.com
Zambia
http://britishempire-zambia.wikispaces.com
Zimbabwe
http://britishempire-zimbabwe.wikispaces.com
A base map of the world is taken to present all this data. The world map will be in the
shape file format that is one of the GIS formats. Shape files are a simple, non-topological
format for storing the geometric location and attribute information of geographic features [1].
More Information on shape files can be found at [5]. The shape file of world is taken from
the “data” folder that will be in the Map Objects folders. After we got the world map we need
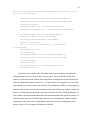
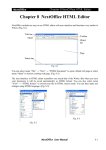
to prepare CSV files. I have divided all these countries into three categories 1700s, 1800s and
1900s, depending upon the starting year of the British Empire in each country. I have
prepared CSV files for all these three categories with the information of location i.e. latitude
and longitude and other information like country name, web link and if the country is part of
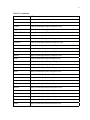
common wealth or not. A screen shot of CSV file for the 1700s is shown in Figures 5.1.
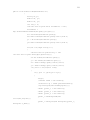
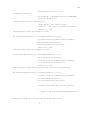
Screen shot of the CSV file for the 1800s is shown in Figures 5.2. Screen shot of the CSV
file for the 1900s is shown in Figure 5.3. The CSV files are the input files for the tool.
12
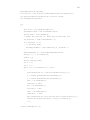
Figure 5.1. Screenshot of 1700s CSV file.
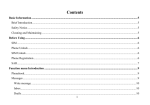
Figure 5.2. Screenshot of 1800s CSV file.
13
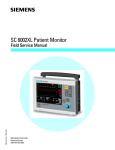
Figure 5.3. Screenshot of 1900s CSV file.
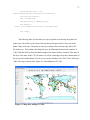
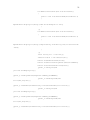
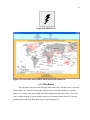
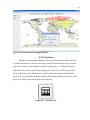
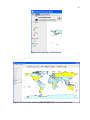
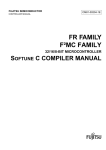
The information from the CSV files will be read and converted into layers on the map
with points in each layer. The points we get depend on the latitudes and longitudes given in
those files. When we click on these points on the map we get a window popped up with the
information particular to that country and other general information about the British Empire
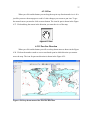
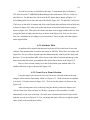
in the World. The general information includes the image in Figure 5.4 to show the peak
stage of the British Empire. The image can be found at [3]. The general information also
includes [8, 14, 16].
14
Figure 5.4. Map of the British Empire at its peak.
15
CHAPTER 6
DEVELOPMENT OF SOFTWARE AND ITS
FEATURES
6.1 IMPLEMENTATION
This software is platform independent and it can run on any machine, as Java is
platform independent. NetBeans is used to develop the software. NetBeans is open source
software available at [11]. NetBeans is a powerful GUI builder supports a sophisticated yet
simplified Swing Application Framework and Beans Building [15]. As Map Objects consists
of JAR files, which contains UI java beans (extensions of Swings), it will be easy to import
all the tool’s libraries or JAR files into a new project on Net Beans. The next thing is to read
the CSV files and creating points/stars on the map. This is attained using the XY tool.
The functionality for the XY tool is to read the data from the CSV file and then
convert the data into a layer of points and add it to the map. So need to implement a
provision to choose the CSV file using the file browser. We should read longitude, latitude,
country name, wiki link and common wealth information for each point from the CSV file.
We need to store the information read for each point into some data structure, so that we can
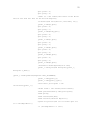
use this information later. The following code allows users to select a CSV file by opening a
file dialog and then reads the data from the chosen CSV file. The longitude and latitudes are
read and converted into points and are added into a base points array.
class AddXYtheme extends JDialog/*start of class AddXYtheme extends
JDialog*/
{
Map map;
JFileChooser jfc = new JFileChooser();
BasePointsArray bpa = new BasePointsArray();
java.text.DecimalFormat df = new java.text.DecimalFormat("0.00");
String country[] = new String[100];
String hotlink[] = new String[100];
String cmnwlth[] = new String[100];
AddXYtheme() throws IOException
{
16
setBounds(100,100,520,430);
File dirInit = new File("C:\\ESRI\\MOJ20\\British Empire\\");
jfc.setCurrentDirectory(dirInit);//initial folder
jfc.showOpenDialog(this);
try
{
File file = jfc.getSelectedFile();
FileReader fred = new FileReader(file);
String text = file.getName();
// where the last dot is. There may be more than one.
int dotPlace = text.lastIndexOf('.');
if ( dotPlace >= 0 )
{
// possibly empty
BritEmp.CSVName = text.substring( 0, dotPlace );
}
BufferedReader in = new BufferedReader(fred);
String s; // = in.readLine();
double x,y;
String sArr,Arr,cArr;
int n = 0;
int i = 0;
while ((s = in.readLine()) != null)
{
StringTokenizer st = new StringTokenizer(s,",");
x = Double.parseDouble(st.nextToken());
y = Double.parseDouble(st.nextToken());
sArr = st.nextToken();
country[i]= sArr;
Arr = st.nextToken();
hotlink[i] = Arr;
cArr = st.nextToken();
cmnwlth[i] = cArr;
bpa.insertPoint(n++,new com.esri.mo2.cs.geom.Point(x,y));
System.out.println("Country: "+x+y+":"+country[i]);
i++;
}
}catch (IOException e){}
17
XYfeatureLayer xyfl = new
XYfeatureLayer(bpa,map,country,hotlink,cmnwlth);
xyfl.setVisible(true);
map = BritEmp.map;
map.getLayerset().addLayer(xyfl);
map.redraw();
public void setMap(com.esri.mo2.ui.bean.Map map1)
{
map = map1;
}
}
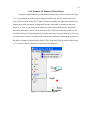
The following lines of code add a new layer of points on to the map using the base
points array into which we have stored the data about each point earlier. I have given the
points’ shape to be stars. The points or stars get a random color each time they add a CSV
file to the map. This random color helps the users to differentiate between the countries of
1700, 1800 and 1900 in which the British Empire first started in those countries. The name of
the layer is the same as the CSV file name as it will be confusing to keep the constant name if
the user needs to add multiple CSV files as we need to add three CSV files 1700s, 1800s and
1900s. The map is shown in the Figure 6.1 after adding the CSV files.
Figure 6.1. Map after adding CSV files.
18
public XYfeatureLayer(BasePointsArray bpa,Map map,String country[],String
hotlink[],String cmnwlth[])
{
createFeaturesAndFields(bpa,map,country,hotlink,cmnwlth);
BaseFeatureClass bfc = getFeatureClass(BritEmp.CSVName,bpa);
setFeatureClass(bfc);
BaseSimpleRenderer srd = new BaseSimpleRenderer();
BaseSimpleLabelRenderer slrd = new BaseSimpleLabelRenderer();
SimpleMarkerSymbol sms= new SimpleMarkerSymbol();
System.out.println("country123:"+country);
sms.setType(SimpleMarkerSymbol.STAR_MARKER);
Random r = new Random();
Color
f = new Color(r.nextInt(256), r.nextInt(256),
r.nextInt(256));
sms.setSymbolColor(f);
sms.setWidth(15);
TrueTypeMarkerSymbol ttm=new TrueTypeMarkerSymbol();
ttm.setFont(new Font("British Empire",Font.PLAIN,40));
srd.setSymbol(sms);
setRenderer(srd);
XYLayerCapabilities lc = new XYLayerCapabilities();
setCapabilities(lc);
}
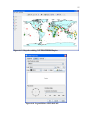
Now that we have got the CSV files added to the map, next thing is to display the
information when the user clicks on these stars or points. The user should click on these
points to get the information window about that point to be displayed using the Identify tool
which is explained in chapter 6 section 6.2.16. If the window is not popped even if you click
on the points try to zoom in to the map and click. The information window is only popped up
when the click is close to the actual coordinates of the point. The pop up window contains an
image of a world map showing all the areas that at one time are part of the British Empire. It
also contains some informational html links and information about that particular country on
which the point is present. The following code takes care of building the window with the
information. It also takes care of organizing the data in the window using buttons, labels,
panels, colors etc. The hot point is the bottom of the bolt.
19
public void mouseClicked(MouseEvent me)
{
String x1,y1;
double x2, y2;
double x3, y3;
int flag = 0;
com.esri.mo2.cs.geom.Point worldPoint = null;
worldPoint =
map.transformPixelToWorld(me.getX(),me.getY());
x1= df.format(worldPoint.getX());
x2= Math.round(worldPoint.getX()*100.0)/100.0;
y1 = df.format(worldPoint.getY());
y2= Math.round(worldPoint.getY()*100.0)/100.0;
for(int i=0;i<bpa.size();i++)
{
com.esri.mo2.cs.geom.Point p = new
com.esri.mo2.cs.geom.Point(bpa.getPoint(i));
x1= df.format(worldPoint.getX());
y1 = df.format(worldPoint.getY());
x3 = Math.round(p.getX()*100.0)/100.0;
y3 = Math.round(p.getY()*100.0)/100.0;
if(( x2+2 >= x3)&&(x2-2 <=x3))
{
if(( y2+2 >= y3)&&(y2-2 <=y3))
{
flag=1;
//JFrame frame = new JFrame();
//Container cp = frame.getContentPane();
//cp.setLayout(new GridBagLayout());
JPanel jpanel_1 = new JPanel();
JPanel jpanel_2 = new JPanel();
JPanel jpanel_3 = new JPanel();
jpanel_1.setBackground(new
Color(255,255,255));
jpanel_1.setLayout(new BoxLayout(jpanel_1,
BoxLayout.Y_AXIS));
20
GridBagConstraints gbc = new
GridBagConstraints();
gbc.gridwidth = GridBagConstraints.REMAINDER;
ImageIcon image = new
ImageIcon("The_British_Empire1.png");
JLabel beimg = new JLabel(image);
JLabel t1 = new JLabel("Informative Links");
JButton b1 = new
JButton("http://www.britishbattles.com");
b1.setBorder(BorderFactory.createEmptyBorder(2,2,2,2));
b1.setHorizontalAlignment(JButton.CENTER);
b1.setBorderPainted(false);
b1.setContentAreaFilled(false);
JButton b2 = new
JButton("http://www.britishempire.co.uk");
b2.setBorder(BorderFactory.createEmptyBorder(2,2,2,2));
b2.setBorderPainted(false);
b2.setHorizontalAlignment(JButton.CENTER);
b2.setContentAreaFilled(false);
JButton b3 = new
JButton("http://empiretheory.fortunecity.net/VictorianLinks.htm");
b3.setBorder(BorderFactory.createEmptyBorder(2,2,2,2));
b3.setHorizontalAlignment(JButton.CENTER);
b3.setBorderPainted(false);
b3.setContentAreaFilled(false);
b1.addActionListener(new ActionListener()
{
public void actionPerformed(ActionEvent e)
{
OpenBrowser.displayurl("http://www.britishbattles.com");
}
});
21
b2.addActionListener(new ActionListener()
{
public void actionPerformed(ActionEvent e)
{
OpenBrowser.displayurl("http://www.britishempire.co.uk");
}
});
b3.addActionListener(new ActionListener()
{
public void actionPerformed(ActionEvent e)
{
OpenBrowser.displayurl("http://empiretheory.fortunecity.net/VictorianLinks
.htm");
}
});
final String url = hotlink[i];
JButton button = new JButton(url);
button.setBorderPainted(false);
button.setHorizontalAlignment(JButton.CENTER);
button.setContentAreaFilled(false);
jpanel_2.setLayout(new
java.awt.GridBagLayout());
jpanel_2.setAlignmentX(Component.CENTER_ALIGNMENT);
jpanel_2.setBackground(new
Color(204,255,255));
jpanel_2.setBorder(BorderFactory.createLineBorder(Color.black));
jpanel_3.setLayout(new
java.awt.GridBagLayout());
jpanel_3.setAlignmentX(Component.CENTER_ALIGNMENT);
jpanel_3.setBackground(new
Color(255,204,100));
jpanel_3.setBorder(BorderFactory.createLineBorder(Color.black));
22
gbc.gridwidth = 1;
gbc.gridx = 0;
gbc.gridy = 0;
jpanel_2.add(new JLabel("Country:
",JLabel.LEFT), gbc);
gbc.gridx = 1;
jpanel_2.add(new
JLabel(country[i],JLabel.LEFT), gbc);
gbc.gridx = 0;
gbc.gridy = 1;
jpanel_2.add(new JLabel("X Co-ordinate:
",JLabel.LEFT),gbc);
gbc.gridx = 1;
jpanel_2.add(new JLabel(x1,JLabel.LEFT),gbc);
gbc.gridx = 0;
gbc.gridy = 2;
jpanel_2.add(new JLabel("Y Co-ordinate:
",JLabel.LEFT),gbc);
gbc.gridx = 1;
jpanel_2.add(new JLabel(y1,JLabel.LEFT),gbc);
gbc.gridx = 0;
gbc.gridy = 3;
jpanel_2.add(new JLabel("Part of Common
Wealth: ",JLabel.LEFT),gbc);
gbc.gridx = 1;
jpanel_2.add(new
JLabel(cmnwlth[i],JLabel.LEFT),gbc);
gbc.gridx = 0;
gbc.gridy = 4;
jpanel_2.add(new JLabel("Hot Link:
",JLabel.LEFT),gbc);
gbc.gridx = 1;
jpanel_2.add(button,gbc);
GridBagConstraints gbc1 = new
GridBagConstraints();
//gbc1.gridwidth =
GridBagConstraints.REMAINDER;
gbc1.gridwidth =1;
23
gbc1.gridx = 0;
gbc1.gridy = 0;
JLabel tt = new JLabel("The Areas Of The World
That At One Time Are Part Of The British Empire");
tt.setFont(new Font("Serif", Font.BOLD, 20));
jpanel_3.add(tt,gbc1);
gbc1.gridx = 0;
gbc1.gridy = 1;
jpanel_3.add(beimg,gbc1);
gbc1.gridx = 0;
gbc1.gridy = 2;
jpanel_3.add(t1,gbc1);
gbc1.gridx = 0;
gbc1.gridy = 3;
jpanel_3.add(b1,gbc1);
gbc1.gridx = 0;
gbc1.gridy = 4;
jpanel_3.add(b2,gbc1);
gbc1.gridx = 0;
gbc1.gridy = 5;
jpanel_3.add(b3,gbc1);
//mainPanel.setBackground(Color.red);
jpanel_1.setLayout(new BoxLayout(jpanel_1,
BoxLayout.Y_AXIS));
jpanel_1.setAlignmentX(Component.LEFT_ALIGNMENT);
jpanel_1.add(jpanel_2);
jpanel_1.add(jpanel_3,gbc);
JScrollPane jscrollpane = new
JScrollPane(jpanel_1);
JFrame frame = new JFrame("JScrollPane");
frame.getContentPane().add(jscrollpane);
frame.pack();
frame.setSize(400,400);
frame.setTitle("British Empire!");
System.out.println("be tool b4 frame open set
to:" +BritEmp.BETool);
if
(BritEmp.BETool == true)
24
{
frame.setVisible(true);
}
button.addActionListener(new ActionListener()
{
public void actionPerformed(ActionEvent e)
{
OpenBrowser.displayurl(url);
}
});
}
}
if(flag == 1)
break;
}
}
});
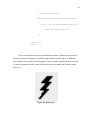
I have used hotlink tool to open the information windows. When the user clicks on
this tool, the cursor is changed to a bolt like image as shown in the Figure 6.2. With this
cursor enabled user should click on the points or stars to get the information window pop up.
A sample information window when clicked on a point with identify tool is shown in the
Figure 6.3.
Figure 6.2. Bolt cursor.
25
Figure 6.3. Information window when clicked on a star.
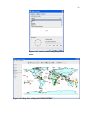
The information displayed also contains html links. The links should be opened when
clicked on them from any of the available internet browsers on that type of machine. As the
software is platform independent, the website links should also be opened on any machine
and any available browsers on that machine. The code to open the links on a web browser,
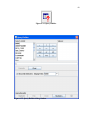
displayed on the pop window is as following. A snapshot of a sample web page is shown in
the Figure 6.4.
Figure 6.4. Screen shot of a sample wiki link.
26
public class OpenBrowser
{
private static final String ErrorMsg = "Error trying to launch web
browser";
public static void displayurl(String url)
{
String OSName = System.getProperty("os.name");
try
{
if (OSName.startsWith("Mac OS")) //For Mac Operating System
{
Class fileManager =
Class.forName("com.apple.eio.FileManager");
Method displayurl =
fileManager.getDeclaredMethod("dispalyurl",
new Class[] {String.class});
displayurl.invoke(null, new Object[] {url});
}
else if (OSName.startsWith("Windows")) //For Windows Operating
System
{
Runtime.getRuntime().exec("rundll32
url.dll,FileProtocolHandler " + url);
}
else //For UNIX or LINUX Operating Systems
{
String browser = null;
String[] b_list = { "safari",
"chrome",
"omniweb",
"dillo",
"shiira",
"midori",
"firefox",
"opera",
"konqueror",
"epiphany",
27
"mozilla",
"netscape"
};
for (int i = 0; i < b_list.length && browser == null; i++)
{
if (Runtime.getRuntime().exec(new String[] {"which",
b_list[i]}).waitFor() == 0)
browser = b_list[i];
}
if (browser != null)
Runtime.getRuntime().exec(new String[] {browser, url});
else
throw new Exception("Can not find internet browser");
}
}
catch (Exception e)
{
JOptionPane.showMessageDialog(null, ErrorMsg + ":\n" +
e.getLocalizedMessage());
}
}
} //End of OpenBrowser
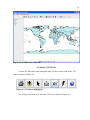
6.2 TOOL BAR
The tool bar of the software is as shown in Figure 6.5. We will discuss each one of
the icons or buttons in detail, how to use them and what they are for.
Figure 6.5. Screen shot of the map tools of the software.
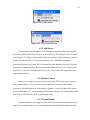
6.2.1 Print Button
This button is used to print the map. The screen shot the print button is as shown in
the Figure 6.6. When you click this button you will get a window asking to select a printer
and mentioning which pages to print etc. The screen shot of the window is shown in Figure
6.7. This behaves like any other normal simple print command.
28
Figure 6.6. Screen shot of the print button in the tool bar.
Figure 6.7. Screen shot of the print command window.
6.2.2 Add Layer
Geographic data is added to the map in the form of a layer. The data can be anything
related to map like roads, cities, lakes, schools, rivers etc. One of the file formats to represent
this data is a shape file. The screen shot of the Add Layer button is as shown in the
Figure 6.8.
So when you click on this button you will get a dialog window asking to select a
shape file as shown in the Figure 6.9. The screen shot of the map before adding any extra
layer is as shown in the Figure 6.10. Now I will add cities to the world map using this tool.
The screen shot of the map after adding the cities shape file is as shown in the Figure 6.11.
6.2.3 Arrow
The Arrow button gets the cursor back to normal i.e. arrow. For example when you
click on the zoom in or pan button your cursor will be changed to respective tool icons and
29
Figure 6.8. Add Layer button.
Figure 6.9. Add Layer dialog window.
30
Figure 6.10. Screen shot of the map before adding any additional layers.
Figure 6.11. Screen shot after adding cities shape file to the map.
31
after using them if you want to return normal cursor icon just click on this button. The screen
shot of the arrow button is as shown in the Figure 6.12.
Figure 6.12. The Arrow Button.
6.2.4 Distance Measure Tool
The distance button is as shown in the Figure 6.13. This button helps us to measure
the distance between two points on the map. The distance is given in both miles and
kilometers at bottom of the map. Suppose you want to measure the distance between Brazil
and South Africa. Simply click on this button then press on Brazil then drag it until South
Africa and then release it. The screen shot demonstrating this is as shown in the Figure 6.14.
6.2.5 XY Button
The XY button is used to read the information from CSV file and then it adds a layer
on to the map as points. The CSV file contains longitude, latitude and any other information
values separated by commas. The icon of the XY feature tool is as shown in the Figure 6.15.
Figure 6.16 shows the file dialog that opens when you click on this button. Select a CSV file
and then click on ok. The screen shot of the map after selecting and adding the CSV file is as
shown in the Figure 6.17.
6.2.6 Hotlink Tool
The hotlink tool is used to click on the points displayed on the map to get the
information about that point on the map. The icon for the hotlink is as shown in the Figure
6.18. When you click on this icon the cursor will change to the hotlink symbol that looks like
a bolt. Now click on any one of the points to get the information window. If the information
window does not pop up when you click on the point try to zoom in and then click on the
point. The sample information window is as shown in the Figure 6.19 when clicked on a star
for country Philippines.
32
Figure 6.13. The Distance Measure button.
Figure 6.14. Screen shot demonstrating measuring the distance between two points.
Figure 6.15. The XY Layer button.
33
Figure 6.16. File Dialog for XY button.
Figure 6.17. Map after adding CSV file as a layer using XY button.
34
Figure 6.18. Hotlink icon.
Figure 6.19. Screen shot of the window when clicked with hotlink tool.
6.2.7 Help Button
The help button gets you to the help page when clicked on. The help icon is as shown
in the Figure 6.20. The universal question mark is taken as the help symbol as everybody
knows it. I created a wiki link for help with all the information about the tool in it. It is also
easy to update the page if anyone wants to add more information about the tool. So having
question mark on the help helps them to get to this help page [4].
35
Figure 6.20. Help button.
6.2.8 Previous Extent
When you click on this button it takes you to the previous state of the map. The icon
for previous extent is shown in the Figure 6.21.
Figure 6.21. Previous Extent icon.
6.2.9 Next Extent
When you click on this button it takes you to the next state of the map. The icon for
next extent is shown in the Figure 6.22. The previous and next extents are like back and
forward in the File Browser.
Figure 6.22. Next Extent icon.
6.2.10 Zoom to Active Layer
When you click on this button it zooms to active layer selected on the left side of the
map in case you cannot see the layer. The icon for zoom to active layer is shown in the
Figure 6.23.
Figure 6.23. Zoom to active layer.
36
6.2.11 Zoom to Full Extent
When you click on this button it shows the whole map in case you zoom into the map
and lose where you are and want to see the whole map again. The icon for zoom to full extent
is shown in the Figure 6.24.
Figure 6.24. Zoom to full extent.
6.2.12 Zoom In
When you click on this button it simply zooms into the map. It also changes your
cursor to zoom in icon. To get the normal cursor you need to click on arrow button. The icon
for zoom in is shown in the Figure 6.25.
Figure 6.25. Zoom in.
6.2.13 Zoom Out
When you click on this button it simply zooms out the map. It also changes your
cursor to zoom out icon. To get the normal cursor you need to click on arrow button. The
icon for zoom in is shown in the Figure 6.26.
Figure 6.26. Zoom out.
37
6.2.14 Pan
When you click on this button you can drag the map in any direction and view it. It is
just like you move the newspaper to read it. It also changes your cursor to pan icon. To get
the normal cursor you need to click on arrow button. The icon for pan is shown in the Figure
6.27. Click and drag the mouse in the direction you want the view of the map.
Figure 6.27. Pan.
6.2.15 Pan One Direction
When you click on this button you will see a drop down menu as shown in the Figure
6.28. Click on the north or south or west or east based upon in which direction you want to
move the map. The icon for pan one direction is shown in the Figure 6.29.
Figure 6.28. Drop down menu of the Pan One Direction.
38
Figure 6.29. Pan One Direction.
6.2.16 Identify
When you click on this button the cursor will change to identify icon. With this you
can click anywhere on the map and it pops a window with any information related to that
point exists on any of the layers. The icon for identify is shown in the Figure 6.30. The
screen shot of the information window is shown in the Figure 6.31. This will display
information that was part of the original shape file.
Figure 6.30. Identify tool.
Figure 6.31. Screen shot of result of using Identify tool.
39
6.2.17 Find
This tool is used to do text search on any layer. To use this, select a layer on the left
side and then click on the icon that is shown in the Figure 6.32. When you click on this
button it will open a window where you can enter the text next to the value field and click on
find. It will search the whole layer and displays any matches found. The value entered to
search is case sensitive so you need to do text searches keeping case sensitive in mind. A
screen shot of this can be seen in Figure 6.33.
Figure 6.32. Find tool.
Figure 6.33. Screen shot of using Find tool.
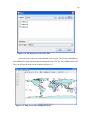
6.2.18 Query Builder
Query Builder helps users to create SQL kind of queries and select certain features on
the map. The icon for this is as shown in the Figure 6.34. Click on this icon and you will see
query builder as shown in the Figure 6.35. Now you can build a query by selecting the fields
or you can write your own query and click on execute. It will display the values returned in
the query builder and also selects those areas on the map. The demonstration of this is shown
in the Figure 6.36.
40
Figure 6.34. Query Builder.
Figure 6.35. Query Builder dialog window.
41
Figure 6.36. Illustration of using Query Builder.
6.2.19 Select Features
The icon to use this tool is as shown in Figure 6.37. To use this tool click on that icon
and it will give four options rectangle, circle, polygon and line as shown in the Figure 6.38.
Select any one of them. Now click on any area of the map which you want to select and it
will turn into yellow bordered showing that you selected that area as shown in the Figure
6.39. You can select multiple areas by using the shift key.
6.2.20 Clear All Selection
The icon for this tool is as shown in the Figure 6.40. This tool is used to erase any
features selected using the Select Features tool. This is grayed out as shown in Figure 6.41, if
you did not make any selections using the Select Features tool. Now to erase the selection
made in Figure 6.39, you simply click on this icon and the map will return to normal as
shown in Figure 6.42.
42
Figure 6.37. Select Features icon.
Figure 6.38. Showing the options of Select Features.
43
Figure 6.39. Select Features tool options.
Figure 6.40. Clear All Selection icon.
Figure 6.41. Clear All selection icon when grayed out.
44
Figure 6.42. Map when cleared all selections.
6.2.21 Buffer
To enable this feature you need to select a layer on the left side and select any area on
the map with the help of Select Features Icon shown in the Figure 6.37. When the feature is
enabled the icon will be seen as shown in Figure 6.43 otherwise it will be grayed out as
shown in the Figure 6.44. This tool is used to buffer the selected area along with the units
selected in the buffer window. When you click on this, a window will be opened called
Buffer as shown in the Figure 6.45. Give the Buffer distance and select the buffer units and
then click on apply. You will see that the selected area is buffered. The demonstration is as
shown in the Figure 6.46.
Figure 6.43. Buffer icon.
45
Figure 6.44. Buffer icon when grayed out.
Figure 6.45. Screen shot of buffer window.
46
Figure 6.46. Demonstration of applying buffer.
6.2.22 Attributes
This tool is used to get the attributes for the selected areas made on selected layers.
To enable this feature you need to select a layer on the left side and select any area on the
map with the help of Select Features Icon shown in the Figure 6.37. When the feature is
enabled the icon will be seen as shown in Figure 6.47, otherwise it will be grayed out as
shown in the Figure 6.48. When you successfully made some selection as shown in the
Figure 6.49, you will get the attributes window when clicked on this icon as you see in the
Figure 6.49. This tool gets all the data at the same time.
Figure 6.47. Attributes icon.
47
Figure 6.48. Attributes icon when grayed out.
Figure 6.49. Screen shot using attributes feature.
6.3 MENU BAR
The Menu bar has four menus file, theme, layer Control and help. I will discuss each
of these, their sub parts, functionality and how to use them. File, theme and layer control
drop down options are shown in the Figures 6.50, 6.51 and 6.52 respectively.
Figure 6.50. File menu.
48
Figure 6.51. Theme menu.
Figure 6.52. Layer Control menu.
6.3.1 Add Layer
Using add layer you can add a layer to the map by selecting a shape file from add
layer dialog which opens when you click on the Add Layer. The add layer icon is as shown
in the Figure 6.53. When you click on this Add Layer option the dialog window is opened
which is shown in Figure 6.54. Now you can browse to C:\ESRI\MOJ20\Samples\
Data\World and select any shape file for example lakes.shp and then click on ok. Now the
lakes layer is added to the map. The screen shot after adding lakes layer is as shown in the
Figure 6.55. You can see that lakes are in blue color. You can also add images files to the
map using this feature.
6.3.2 Remove Layer
Remove layer simply removes a layer from the map. The icon for remove layer is
shown in the Figure 6.56. If you want to remove the lakes layer that we have added
previously. Select the lakes layer on the table of contents i.e. on the left side of the map as
shown in the Figure 6.57. After selecting the lakes layer only go to file menu and then click
remove layer. Now the lakes layer is gone from the map.
6.3.3 Legend Editor
Using the editor we can change the color of the layers and we can add labels to the
map. We can customize the font, size, orientation and color of the labels displayed on the
49
Figure 6.53. Add Layer icon.
Figure 6.54. Add Layer Dialog window.
50
Figure 6.55. Map after adding lakes layer.
Figure 6.56. Remove layer.
51
Figure 6.57. Screen shot showing lakes layer selected in the Table of
Contents.
map. There are also other things that you can customize. I leave it to the users to play and
learn. The icon for legend editor is as shown in the Figure 6.58. To use this feature, first you
need to select a layer on the table of contents as shown in the Figure in 6.59. Now I want to
change the color of the country layer on the map. As I selected that layer I will go to file
menu and then click on the legend editor. Now it opens legend editor dialog window that is
shown in Figure 6.60. I will go to color and then click on the drop down menu and then click
on custom. It shows a color palette window as shown in Figure 6.61. Now I select some
green color and then click on apply and then click ok. It now changes the color of the country
layer to green as shown in Figure 6.62.
52
Figure 6.58. Legend Editor.
Figure 6.59. Map before changing the color.
Figure 6.60. Legend Editor window.
53
Figure 6.61. Color chooser.
Figure 6.62. Map after changing the color using Legend Editor.
54
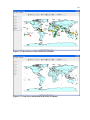
We will also see how to add labels to the map. To demonstrate this I will add my
CSV files located at C:\ESRI\MOJ20\British Empire\dist with names 1700s.csv, 1800s.csv
and 1900s.csv. To add these files I have used the XY button that is shown in Figure 6.15.
After adding these files as layer the map looks like the Figure 6.63. To add labels I will select
1700s layer on the table of contents and click on the legend editor and then click on labels tab
as shown in Figure 6.64. Now click on the drop down menu below labels feature using as
shown in Figure 6.65. Then select the country and then click on apply and then click ok. Now
you get the labels for that particular layer as shown in the Figure 6.66. You can also select
font, size, orientation etc according to your convenience. Users can play with other options
on the legend editor.
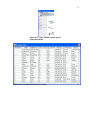
6.3.4 Attribute Table
An attribute table contains data about the layer that will be in the form of rows and
columns. This attribute table is stored in the format of .dbf files. These files come along with
shape files. The size of these depends upon the information they want to provide along with
that layer. To see the attribute table, select a layer on the table of contents and then go to the
theme menu and click on the open attribute table option that is shown in the Figure 6.67.
Here we have selected country layer and clicked on the open attribute table. The
attribute table that we got is shown in the Figure 6.68.
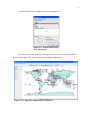
6.3.5 Create Layer From Selection
Using this option you can create a new layer from the selections made on the map
using the select features functionality which is in Figure 6.37. Make selections as explained
in section 6.2.19 and as shown in Figure 6.39. The icon for this option is as shown in the
Figure 6.69.
After selecting some areas on the map using the shift key and select features tool
click on create layer from selection. It will show a prompt to click on and do it. It adds
automatically a new layer to the map. We made some selections and created a layer on the
map that you can see in Figure 6.70. You can change the name of the layer using the legend
editor, which we discussed about earlier.
55
Figure 6.63. Map after adding CSV files of British Empire.
Figure 6.64. Legend Editor with Labels tab.
56
Figure 6.65. Labels feature using drop down
menu.
Figure 6.66. Map after adding labels to layer 1700s.
57
Figure 6.67. Open Attribute Table option
from theme menu.
Figure 6.68. Attribute table for layer country.
58
Figure 6.69. Create layer from selection.
Figure 6.70. Screen shot of the map after creating a layer from selections made.
59
6.3.6 Promote Or Demote Selected Layer
Using these options that are present under the menu layer control as shown in Figure
6.71 we can change the order of layers displayed on the map. Now if I want to move the
layer 1700s to bottom of the TOC (Table of Contents), simply select that layer and click on
demote layer until its position is changed to last one in the table of contents as shown in
Figure 6.72. Now if you observe you cannot see some of the red stars as they are hidden
below the other layers. Now if you want to move the 1700s layer to the top so that you can
see all the red stars. Use the promote layer option in the same way as demote layer. Also you
can make layers visible or invisible on the map area by checking or unchecking the layers in
the table of contents. I unchecked the layers 1700s, 1800s and 1900s as shown in the Figure
6.73 an you can observe that the stars are gone in the map area.
Figure 6.71. Layer Control Options.
60
Figure 6.72. Moved Layer 1700s all the way to bottom.
Figure 6.73. Some layers unchecked in the table of contents.
61
CHAPTER 7
CONCLUSION
This thesis is about building a teaching aid tool for the British Empire for department
of history. Dr. Carl Eckberg and Dr. Edward Beasley played very important roles in shaping
up this software. The whole point of building the software is to satisfy the customers
ultimately. All the software requirements were not given at one time. Requirements were
given or changed every time there was a review about the software which is planned to be
interactive way. So lot of time has been spent upon building the software until the customers
are satisfied with the project.
As the British Empire is so vast and topic is about the whole world, there was lot of
data to be collected about so many countries. It took very long time for collection of data and
preparing the data. As the requirements were changing, it took lot more time to collect the
data. First it took time to know which countries the British ruled. After preparing the list of
countries that were ruled by the British then data about each country has been collected. The
data collection included start of the British rule in that country, year of independence,
commonwealth of nations or not, flags, important movements, important wars, any images
related to the British Empire in that country, videos etc.
Coming to the challenges faced on the technical side, first as I was not proficient in
java and it took some time to get started with the development. As one of the requirements
was easy installation of the software, NetBeans was used. NetBeans was completely new to
me and it took time to configure the map objects in NetBeans. Then making the hotlink
cursor work properly and opening the html links in any available internet browser on any
type of machine were some of the challenges faced in development of the software.
Lot of things were learnt from the thesis. Got hands on experience with Java,
NetBeans, Map Objects that are helpful for my career in this competitive world. Also got
experience working on the ArcGIS Desktop application, one of the challenging and
interesting environments.
62
CHAPTER 8
FUTURE ENHANCEMENTS
This GIS tool is built using Map Objects Java and Java Swings, so adding additional
features or modifying the features can be comfortably done with this software. Most of the
code contains java classes and these classes can be reused or extended easily. It is also easy
to write new classes using Java. Some of the ideas that can be considered for future
enhancements are:
1. This software is developed only for the British Empire, but it can be extended to be
generic to teach any world history like the Russian Empire, the Ottoman Empire, the
French Colonial Republic, etc. It is only that collection of data and preparation of
CSV files matters.
2. Ability to let the user give coordinate and information and then automatically adding
that as a point on the map.
3. Coloring the countries map area in different colors for each category.
4. Adding additional CSV files for country capitals, major rivers or ports, key battles,
etc.
5. Adding self-test quizzes.
6. Adding dynamic map based games.
63
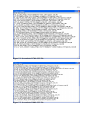
BIBLIOGRAPHY
WORKS CITED
[1]
About shapefiles dBase tables, and file types. ESRI, http://webhelp.esri.com/
arcgisdesktop/9.3/index.cfm?TopicName=About_shapefiles,_dBASE_tables,_and_file_
types, accessed January 2011, Nov. 19, 2008.
[2]
Abstract window toolkit. Wikipedia, http://en.wikipedia.org/wiki/Abstract_Window_
Toolkit, accessed January 2011, n.d.
[3]
British Empire. Wikipedia, http://en.wikipedia.org/wiki/British_Empire, accessed
September 2010, n.d.
[4]
BritishEmpire-Help. Wikispaces, http://britishempire-help.wikispaces.com, accessed
May 2010, n.d.
[5]
ESRI Shapefile technical description. ESRI, http://www.esri.com/library/
whitepapers/pdfs/shapefile.pdf, accessed January 2011, Jul. 1998.
[6]
D. Falkman, Review: ESRI MapObjects Java edition 2. Java boutique,
http://javaboutique.internet.com/reviews/ESRI/, accessed January 2011, n.d.
[7]
Learn about Java technology. Java, http://www.java.com/en/about/, accessed January
2011, n.d.
[8]
Links for Victorian studies. Empiretheory.fortunecity.net, http://empiretheory.
fortunecity.net/VictorianLinks.htm, accesses October 2010, n.d.
[9]
Environmental Systems Research Institute, Inc. MapObjects Java Edition 2.0.1
programmer’s reference help, n.d.
[10] NetBeans IDE 6.1 information. NetBeans, http://netbeans2.org/community/
releases/61/index.html, accessed January 2011, n.d.
[11] NetBeans IDE 6.9.1 download. NetBeans, http://netbeans.org/downloads/index.html,
accessed February 2011, n.d.
[12] New to Java programming. IBM, http://www.ibm.com/developerworks/java/newto/,
accessed January 2011, n.d.
[13] L. Starr, GIS brings “real life” to learning. Education World, http://www.education
world.com/a_tech/tech/tech186.shtml, accessed January 2011, Apr. 23, 2009.
[14] The British Empire. Britishempire.co.uk, http://www.britishempire.co.uk, accessed
August 2010, n.d.
[15] Top reasons to switch to the NetBeans IDE. NetBeans, http://netbeans.org/
switch/why.html, accessed February 2011, n.d.
[16] Welcome to the BritishBattles.com web site. BritishBattles.com, http://www.british
battles.com/, accessed February 2011, n.d.
64
WORKS CONSULTED
C. Eckberg, Notes on Map Objects – Java edition, Handout CS537, San Diego State
University, San Diego, CA, 2007.
Bare Bones browser launch for Java. Centerkey, http://www.centerkey.com/java/browser/,
accessed June 2010, n.d.
Welcome to Wikipedia. Wikipedia, http://en.wikipedia.org/, accessed August 2010, n.d.
The Java Tutorials. Oracle, http://download.oracle.com/javase/tutorial, accessed June 2010,
n.d.
Java Swing tutorial. Java, http://www.javabeginner.com/java-swing/java-swing-tutorial,
accessed June 2010, n.d.
Member States. Commonwealth Secretariat, http://www.thecommonwealth.org/
Internal/191086/142227/members/, accessed June 2010, n.d.
65
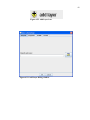
APPENDIX
USER MANUAL
66
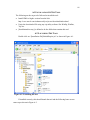
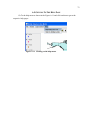
A.1 INSTALLATION OF THE TOOL
The following are the steps to be followed to install the tool:
Install JDK6 or higher version from the link:
http://www.oracle.com/technetwork/java/javase/downloads/index.html
Unzip the downloaded file using any zip utility software like WinZip, WinRar,
7zip etc.
[Installation directory] is defined to be the folder that contains this tool.
A.2 LAUNCHING THE TOOL
Double click on “[Installation Dir]\BritishEmpire.jar” as shown in Figure A.1.
Figure A.1. Launching the tool.
If installed correctly, this should launch the tool and the following home screen
comes up as shown in Figure A.2.
67
Figure A.2. Initial screen of the tool.
A.3 ADDING CSV FILES
To add CSV files on the map as hotspots/stars, you have to first click on the “XY”
button as shown in Figure A.3.
Figure A.3. XY Button highlighted.
You will get a file browser to select the CSV files as shown in Figure A.4.
68
Figure A.4. File browser to select CSV files.
Select each one of them at a time and then click on open. The XY layer should have
been added to the map with the hotspots contained in the CSV file. After adding all the CSV
files you will get the map screen as shown in Figure A.5.
Figure A.5. Map screen after adding the layers.
69
A.4 ADDING LABELS TO THE LAYERS
Using the legend editor we can change the color of the layers and we can add labels
to the map. We can customize the font, size, orientation and color of the labels displayed on
the map. There are also other things that you can customize. I leave it to users to play and
learn. To use the legend editor, first select a layer on the left side of the map to label that
layer as shown in the Figure A.6.
Figure A.6. Map screen showing 1900s layer selected on the table of contents.
Now go to File->Click on Legend Editor as shown in the below Figure A.7.
70
Figure A.7. Clicking on the Legend
Editor.
When you click on the legend editor, you will get the window shown in the
Figure A.8.
Figure A.8. Legend Editor Window with
Labels Tab.
71
To set the labels, click on labels tab as shown in Figure A.9.
Figure A.9. Labels feature using
drop down menu.
Now select the country and then click apply and click ok, you will get the labels as
shown in the Figure A.10. You can do the same thing for other layers.
Figure A.10. Map after adding labels to 1900s layer.
72
A.5 GETTING TO THE HELP PAGE
Go To the help menu as shown in the Figure A.11 and click on them to get to the
respective help pages.
Figure A.11. Clicking on the help menu.