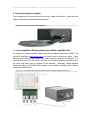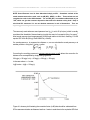
1
Florida Research Instruments, Inc.
http://www.floridaresearchinstruments.com
!
!
!
!
ULTRASONIC MICROPHONE
AND AMPLIFIER
FRI-100-1
USER’S MANUAL
!
!
!
!
!
!
!
!
!
!
!
!
!
!
!
!
!
!
!
!
!
DOC-100
Rev. 1.2
!
Copyright © 2013 All Rights Reserved
!
!
Florida Research Instruments Inc.
1980 North Atlantic Ave, Stes. 502-520
Cocoa Beach, FL 32932
!
!
Phone: 321.613.3862 Fax: 321.613.3863
www.floridaresearchinstruments.com
FRI-100-1 Ultrasonic Microphone and Amplifier
!
!
!
!
!
!
!
!
!
!
!
!
!
!
!
!
!
!
!
!
FRI-100-1 Ultrasonic Microphone and Amplifier
notes
!
!
!
!
!
!
!
!
!
!
!
!
!
!
!
!
!
!
!
!
!
!
!
!
!
!
!
!
!
!
!
!
!
i
FRI-100-1 Ultrasonic Microphone and Amplifier
!
Table of Contents
Chapter 1 | Introduction........................................................................................................1
-------------- Specifications ..................................................................................................... 1
-------------- Notes ................................................................................................................. 1
-------------- Requirements..................................................................................................... 1
Chapter 2 | Hardware ...........................................................................................................2
Chapter 3 | Operation: Example Rodent Ultrasonic Vocalizations ............................................3
Appendix A ..........................................................................................................................6
Quantitative Analysis of Sound Pressure Levels................................................................ 6
Appendix B | Contact Information ..........................................................................................9
!
!
!
!
!
!
!
!
!
!
!
!
!
!
!
!
!
!
!
!
!
!
!
!
!
!
!
!
!
!
!
!
!
!
!
!
ii
FLORIDA RESEARCH INSTRUMENTS INC. FRI-100-1 ULTRASONIC MICROPHONE AND AMPLIFIER
!
CHAPTER 1 | INTRODUCTION
The FRI-100-1 Ultrasonic Microphone and Amplifier accurately measures both the amplitude
and frequency of audio signals in the 500 Hz to 100kHz range. This device is suitable for
measuring machine emissions, vocalizations of mice, rats, birds or bats, and many other
paradigms. More than a simple detector, the FRI-100-1 produces an analog voltage output (on
the BNC Connector) that is proportional to sound pressure level. The analog output can be
connected to third party data acquisition systems (e.g. National Instruments) .
!
!
Specifications
The frequency response of the FRI-100-1 is linear (+/- 4 dB) up to 100
kHz. The analog output is +\- 14 Volts.
The FRI-100-1 microphone and preamplifier combination are calibrated to provide 1 volt peak
output into a high impedance load when excited with a 50 kHz ultrasound sine wave with a peak
pressure level of 1 Pa, or Lp = +94 dB SPL (20 µPa = 0 dB). Peak levels were selected for ease
of setting up associated A-to-D converters, as the peak value could be easily related to the
full-scale count of the converter. This calibration is independent of distance from the sound
source and reflects the actual sound pressure at the face of the microphone.
The output impedance of the FRI-100-1 amplifier is 50 Ohms and must be considered when
connecting the unit to other measurement equipment.
!
Notes
1. The high impedance load assumed for calibration is high relative to 50 Ohms and the loading effect of low impedances must be considered. For example, a 500 Ohm load has an error of less than 1 dB, while a 10 000 Ohm load has an error of less than 0.05 dB.
!
2. If the A-to-D has a 50 Ohm load, the sensitivity is reduced to 0.5 V peak due to the drop across the FRI-100-1 internal impedance. Many instruments have a fixed 50 Ohm input impedance, so the input impedance of your recording hardware should be determined if your goal is to make quantitative measurements of vocalization amplitudes (in dB).
Requirements
- Third party data collection hardware and software
!!
!!
!!
!!
!!
!!
!
-1-
!
DOC-100 Rev 1.2 Copyright © 2013 Florida Research Instruments, Inc.
FLORIDA RESEARCH INSTRUMENTS INC. FRI-100-1 ULTRASONIC MICROPHONE AND AMPLIFIER
!
CHAPTER 2 | HARDWARE
The FRI-100-1 includes a Microphone and an Amplifier. A power supply is also included, which provides a minimum of 12V, 500mA. The brand and type of power supply depends on the user’s country.
The FRI-100-1 Ultrasonic Microphone (Figure 2.1) is designed for sound waves in the 500Hz to
100 KHz range.
!!
Figure 2.1 - FRI-100-1 Microphone with Exploded Views of Connector and Microphone
!
!
!
!
!
!
!
!
The amplifier on the FRI-100-1 is calibrated to provide a relatively flat frequency response for
the microphone (+/-4 dB from 500 Hz through 100KHz). It uses a 12V 500mA DC power and
outputs the signal to a BNC port.
!!
Figure 2.2 - FRI-100-1 Microphone and Amplifier
!!
!!
!!
!!
!!
!!
!!
!!
!!
!!
!!
!!
!!
!!
!!
-2-
!
DOC-100 Rev 1.2 Copyright © 2013 Florida Research Instruments, Inc.
FLORIDA RESEARCH INSTRUMENTS INC. FRI-100-1 ULTRASONIC MICROPHONE AND AMPLIFIER
!
CHAPTER 3 | OPERATION: Example Rodent Ultrasonic Vocalizations
Two output settings are available ‘DIRECT’ and ‘LPF’. The LPF setting allows you to apply a low-
pass anti-aliasing filter to the output signal with a cutoff frequency of 100 KHz. The front panel also has an access for the calibration screw marked ‘CAL.’ This calibration screw adjusts the overall gain of the amplifier. The FRI-100-1 has been pre-calibrated at the factory. DO NOT adjust the instrument gain if you will be using the FRI-100-1 to quantify the actual amplitude
(dB) of rodent vocalization. Refer to Appendix A for more information regarding measurement
of sound pressure level amplitudes.
!
!
!
1. Place the microphone in measurement location
The microphone should be centered over desired location, and pointing at the subject of
interest. As an example, the picture in Figure 3.1 shows a typical setup for mouse open field
ultrasonic vocalization.
!!
!!
!
!!
!!
!!
!!
!!
!!
!!
!!
!!
!!
!!
!!
!!
!!
!!
!
Figure 3.1 - Microphone Placed Over Cage (Microphone Support Not Included)
!
!
-3DOC-100 Rev 1.2 Copyright © 2013 Florida Research Instruments, Inc.
!
FLORIDA RESEARCH INSTRUMENTS INC. FRI-100-1 ULTRASONIC MICROPHONE AND AMPLIFIER
!
2. Attach microphone to amplifier
The microphone jack is ‘keyed’ and only fits one way. Rotate until it slides in. Screw the outer
sleeve to the jack to prevent accidental disconnection.
!!
!
!
!
!
!
!
!
!
!
!
!
Figure 3.2 - Microphone Connected to Amplifier
3. Connect amplifier to Data Acquisition Device (DAQ) using BNC cable
An example of a data acquisition system would be the National Instruments myDAQ. The
myDAQ is available at www.studica.com at a special price to students or faculty. Other
National Instruments or other manufacturer’s data acquisition systems may be used. For
connection from the FRI-100-1 BNC connector to the National Instruments myDAQ device,
the center and ground can be screwed into the terminals. Alternately, Florida Research
Instruments makes an FRI-2000-2 BNC adapter for the myDAQ to interface with a National
Instruments myDAQ device.
Figure 3.3 -Connect National Instruments myDAQ (shown with BNC Adapter) to FRI-100-1
!
!!
!!
!!
!!
!!
!!
!!
!!
!!
!!
!!
!!
!
!
-4-
!
DOC-100 Rev 1.2 Copyright © 2013 Florida Research Instruments, Inc.
FLORIDA RESEARCH INSTRUMENTS INC. FRI-100-1 ULTRASONIC MICROPHONE AND AMPLIFIER
!
4. Plug in power supply and turn on amplifier
The power supply has a 2.1mm connector and supplies 12V, 500mA. Insert the connector into
the port on the back of the Amplifier and flip on the power switch.
!!
Figure 3.4 - Back View of FRI-100-1 Microphone Amplifier
!
!
!
!
!
!
Insert power supply
connector to Power Input port
!
!
!
!
!
!
!
5. Select “LPF” or “Direct”
“Direct” passes the microphone input directly to the DAQ. “LPF” applies a low-pass filter to the
signal. The LPF is an anti-aliasing filter that attenuates signals above 100KHz. The “LPF” setting
is recommended.
!!
Figure 3.5 - Location of Direct/LPF Switch
!
!
!
!
!
!
!
!
!
!!
!!
!!
!!
!
Direct/LPF
Switch
-5-
!
DOC-100 Rev 1.2 Copyright © 2013 Florida Research Instruments, Inc.
FLORIDA RESEARCH INSTRUMENTS INC. FRI-100-1 ULTRASONIC MICROPHONE AND AMPLIFIER
!
APPENDIX A
Quantitative Analysis of Sound Pressure Levels
!
Unlike many instruments on the market, the FRI-100-1 Ultrasonic Microphone and Amplifier is a
specialized device that is calibrated to produce a defined signal amplitude in response to a
standard sound pressure level. Thus, it is useful not only for recording the frequency profile of
rodent vocalizations, but also it can provide an accurate measure of the amplitude, or Sound
Pressure Level, of the vocalizations. For researchers interested in quantifying the amplitude of
vocalizations, special consideration should be given to the calibration specifications of the
FRI100-1 instrument, as well as the physical layout of the recording environment, particularly
the distance between the microphone and the test subject.
To report standard Sound Pressure Levels (Lp), the level should be reported at a distance of 1
meter between the microphone and test subject. However, it is often inconvenient to configure
an arrangement in the lab where the microphone is at a distance of 1 meter from the test
subject. Thus, it is necessary to convert measurements obtained a distance of less than one
meter to the equivalent measure that would be obtained at a distance of 1 meter.
Calculating the 1 meter equivalent sound pressure level depends on the expression of the initial measurement. If the microphone output is recorded as a voltage, the voltage expected at a distance of one-meter is obtained by multiplying the measured voltage by the measurement distance in meters.
Example: If a microphone placed 0.25 m (or 1/4 m) from the source produces a sound pressure level of 30 mV (0.03V), the equivalent pressure at 1 m would be 30 mV * 0.25 = 7.5 mV ( or 30mV / 4). Recall that the FRI-100-1 has a calibration scaling of 1 Pa/V. Thus, the
equivalent sound pressure level at 1 m would be 0.0075 V * 1 Pa/V = 0.0075 Pa.
Considering the large variation of sound pressure levels typically encountered and the need to multiply or divide to obtain sound pressure in Pa at one-meter, it is usually easier to calculate sound pressure using logarithms. A standard system has been developed (ANSI S1.1-1994)1 to yield a logarithmic measure of the effective sound pressure level of one sound relative to a reference value. Thus, effective sound pressure levels are measured in decibels (dB) above a standard reference value.
Sound Pressure Level (SPL), or sound level (Lp), is defined in ANSI S1.1-1994 as1
!
!
!
!
!
!
Where pref is a sound pressure level reference value, and prms is the root mean squared (rms)
value of the sound pressure level for the measured signal.
!!
-6-
!!
!
DOC-100 Rev 1.2 Copyright © 2013 Florida Research Instruments, Inc.
FLORIDA RESEARCH INSTRUMENTS INC. FRI-100-1 ULTRASONIC MICROPHONE AND AMPLIFIER
!
NOTE: Sound Pressure Level is often abbreviated simply as SPL. Sometimes variants of the
actual measurement unit are used, such as dB (SPL), dBSPL, or dBSPL. These variants are not
recognized as units in the ANSI standard. The unit dB (SPL) is sometimes abbreviated to just
"dB", which can give the erroneous impression that a dB is an absolute unit by itself. Keep in
mind that SPL measures (Lp) are not absolute measures in and of themselves.
They are
expressing one sound pressure relative to a reference sound pressure.
!
The commonly used reference sound pressure level (pref) in air is 20 µPa (rms), which is usually
considered the threshold of human hearing (roughly the sound of a mosquito flying 3 m away)1.
Most sound pressure level measurements will be made relative to this level, meaning 1 Pa will
equal a SPL of 94 dB (20 log(1 Pa/0.00002 Pa) = 94 dB).
If a sound pressure p1, is measured at a distance r1, one can calculate the sound pressure p2 at
another position r2 using the following equation:
!
!
Converting the resulting pressure to Sound Pressure Level (in dB) allows the correction for
distance to be accomplished by simply adding logarithms.
20 log(p2) = 20 log(p1*r1/r2) = 20 log(p1) + 20 log(r1) - 20 log(r2)
In the case where r2 = 1 meter,
Lp@1 meter = Lp@r1 + 20 log(r1)
!!
!
!
!
!
!
!
!
!
!
!
!
!
!
!
Figure A.1 - Graph of 20 log(r1) for distances less than 1 meter
Figure A.1 shows a plot illustrating the correction factor (in dB) that should be subtracted from SPL measurements taken at distances less than 1 meter to scale them to the equivalent SPL that
!
-7-
!
DOC-100 Rev 1.2 Copyright © 2013 Florida Research Instruments, Inc.
FLORIDA RESEARCH INSTRUMENTS INC. FRI-100-1 ULTRASONIC MICROPHONE AND AMPLIFIER
!
would be obtained at 1 meter. Some commonly used measurement distances are indicated. To obtain the correction factor for any distance less than one meter, simply take the logarithm of the distance and multiply by 20. Subtract this value from the SPL you measured and this will give you the equivalent SPL at 1 meter. It is convention to express SPL measurements at a distance of 1 meter. However, always be sure to state the distance used in your measurements when publishing papers. This will aid other readers in interpreting your data, and represents good scientific practice.
!
!
Example: Setting up to make measurements that reflect expected pressure levels at one-meter.
1. Determine the distance from the sound source to the microphone, e.g., 0.25 meters.
2. If possible, set the A-to-D converter gain such that the largest expected analog signal provides a digital output slightly smaller than the maximum converter output count.
3. If possible, adjust the scaling factor of the display software such that the peak value of a
1 volt 50 kHz sine-wave input produces a reading of
94 dB + 20 log(distance)
which for a distance of 0.25 m yields
!
94 dB + 20 log(0.25 m) = 94 dB - 12 dB = 82 dB
The above scaling may be accomplished by either using the known gain factor for the A-to-D converter and the display software, or by applying a 1 volt peak (0.707 V rms) 50 kHz signal to the converter input using a signal generator. The test generator output level may be determined either by direct measurement, or, if the generator provides a calibrated output, by using the set value directly. If it is not possible to scale your A-to-D recording hardware and software, you will need to do post hoc scaling of your recording signals using some other data processing method (e.g. export data from your recording system to an Excel spreadsheet).
!
NOTE: if the signal generator output is set using the generator's output level control, be sure to load the generator output with the proper load. For example, if the generator output impedance is 50 Ohms, the output must be loaded with 50 Ohms. In the case where the A-to-D being used has a high input impedance, the stated generator output voltage must be doubled (i.e., a setting of 0.5 V peak will produce a 1 V peak signal into a high impedance load). Finally, if a test signal of 1 V peak causes the output of the A-to-D to saturate, reduce the amplitude of the test signal by a factor of ten to 0.1 V peak and replace the factor of +94 dB with +74 to compensate for the reduced signal level.
A note on rms values
Expressing signal levels in rms equivalent values assumes an averaging over either time or
space, and is usually used to express the spread of a measurement. The rms value of a single
!
-8-
!
DOC-100 Rev 1.2 Copyright © 2013 Florida Research Instruments, Inc.
FLORIDA RESEARCH INSTRUMENTS INC. FRI-100-1 ULTRASONIC MICROPHONE AND AMPLIFIER
!
measurement is the measured value. In the case of a pure sine-wave, the measurement is assumed to be averaged over a full cycle and is typically used to calculate the power of the signal. For example, a sine-wave with an amplitude of 1 V peak measured across a 1 Ohm resistor will cause 0.707 Watts to be dissipated in the resistor, as the rms voltage of a 1 V peak sine-wave is 0.707 V. For more complex signals, such as a rodent vocalization, the rms value must be computed by averaging the square of the vocalization over a selected duration, and then taking the square-root of the result, if indeed the energy put into the vocalization is of interest.
!
Analysis Example: Rodent Ultrasonic Vocalizations
Inexpensive software (Raven) for analysis of rodent Ultrasonic Vocalizations is available from
http://www.birds.cornell.edu/brp/raven/RavenOverview.html . National Instruments offers a
number of software sound analysis packages or the user could write an application in
LabView www.ni.com
!
!
!
References:
1
http://en.wikipedia.org/wiki/Sound_pressure#Sound_pressure_level
!
APPENDIX B | CONTACT INFORMATION
Please contact Florida Research Instruments, Inc. for information regarding any of our products. Visit our website at www.floridaresearchinstruments.com for contact information. For technical questions, email [email protected] or [email protected] .
!
!!
!!
!!
!!
!!
!!
!!
!!
!!
!!
!!
!!
!!
!
!
!
-9DOC-100 Rev 1.2 Copyright © 2013 Florida Research Instruments, Inc.