1
REJ10B0062-0200
H8S/2612 E6000 Emulator
User’s Manual
Renesas Microcomputer Development Environment System
H8S Family / H8S/2600 Series
H8S/2612 E6000 HS2612EPI61HE-U2
Rev.2.00
Revision Date: May. 24, 2005
Keep safety first in your circuit designs!
1. Renesas Technology Corp. puts the maximum effort into making semiconductor products better and
more reliable, but there is always the possibility that trouble may occur with them. Trouble with
semiconductors may lead to personal injury, fire or property damage.
Remember to give due consideration to safety when making your circuit designs, with appropriate
measures such as (i) placement of substitutive, auxiliary circuits, (ii) use of nonflammable material or
(iii) prevention against any malfunction or mishap.
Notes regarding these materials
1. These materials are intended as a reference to assist our customers in the selection of the Renesas
Technology Corp. product best suited to the customer's application; they do not convey any license
under any intellectual property rights, or any other rights, belonging to Renesas Technology Corp. or
a third party.
2. Renesas Technology Corp. assumes no responsibility for any damage, or infringement of any thirdparty's rights, originating in the use of any product data, diagrams, charts, programs, algorithms, or
circuit application examples contained in these materials.
3. All information contained in these materials, including product data, diagrams, charts, programs and
algorithms represents information on products at the time of publication of these materials, and are
subject to change by Renesas Technology Corp. without notice due to product improvements or
other reasons. It is therefore recommended that customers contact Renesas Technology Corp. or
an authorized Renesas Technology Corp. product distributor for the latest product information
before purchasing a product listed herein.
The information described here may contain technical inaccuracies or typographical errors.
Renesas Technology Corp. assumes no responsibility for any damage, liability, or other loss rising
from these inaccuracies or errors.
Please also pay attention to information published by Renesas Technology Corp. by various means,
including the Renesas Technology Corp. Semiconductor home page (http://www.renesas.com).
4. When using any or all of the information contained in these materials, including product data,
diagrams, charts, programs, and algorithms, please be sure to evaluate all information as a total
system before making a final decision on the applicability of the information and products. Renesas
Technology Corp. assumes no responsibility for any damage, liability or other loss resulting from the
information contained herein.
5. Renesas Technology Corp. semiconductors are not designed or manufactured for use in a device or
system that is used under circumstances in which human life is potentially at stake. Please contact
Renesas Technology Corp. or an authorized Renesas Technology Corp. product distributor when
considering the use of a product contained herein for any specific purposes, such as apparatus or
systems for transportation, vehicular, medical, aerospace, nuclear, or undersea repeater use.
6. The prior written approval of Renesas Technology Corp. is necessary to reprint or reproduce in
whole or in part these materials.
7. If these products or technologies are subject to the Japanese export control restrictions, they must
be exported under a license from the Japanese government and cannot be imported into a country
other than the approved destination.
Any diversion or reexport contrary to the export control laws and regulations of Japan and/or the
country of destination is prohibited.
8. Please contact Renesas Technology Corp. for further details on these materials or the products
contained therein.
IMPORTANT INFORMATION
READ FIRST
• READ this user's manual before using this emulator product.
• KEEP the user's manual handy for future reference.
Do not attempt to use the emulator product until you fully understand its mechanism.
Emulator Product:
Throughout this document, the term "emulator product" shall be defined as the following
products produced only by Renesas Technology Corp. excluding all subsidiary products.
• Emulator station
• User system interface cables
• PC interface board
• Optional SIMM memory module
• Optional board
The user system or a host computer is not included in this definition.
Purpose of the Emulator Product:
This emulator product is a software and hardware development tool for systems employing the
Renesas microcomputer (hereinafter referred to as the MCU). This emulator product must only be
used for the above purpose.
Limited Applications:
This emulator product is not authorized for use in MEDICAL, atomic energy, aeronautical or
space technology applications without consent of the appropriate officer of a Renesas sales
company. Such use includes, but is not limited to, use in life support systems. Buyers of this
emulator product must notify the relevant Renesas sales offices before planning to use the product
in such applications.
Improvement Policy:
Renesas Technology Corp. (including its subsidiaries, hereafter collectively referred to as
Renesas) pursues a policy of continuing improvement in design, performance, and safety of the
emulator product. Renesas reserves the right to change, wholly or partially, the specifications,
design, user's manual, and other documentation at any time without notice.
Target User of the Emulator Product:
This emulator product should only be used by those who have carefully read and thoroughly
understood the information and restrictions contained in the user's manual. Do not attempt to use
the emulator product until you fully understand its mechanism.
It is highly recommended that first-time users be instructed by users that are well versed in the
operation of the emulator product.
I
LIMITED WARRANTY
Renesas warrants its emulator products to be manufactured in
accordance with published specifications and free from defects in
material and/or workmanship. Renesas, at its option, will repair or
replace any emulator products returned intact to the factory,
transportation charges prepaid, which Renesas, upon inspection,
determine to be defective in material and/or workmanship.
The foregoing shall constitute the sole remedy for any breach of
Renesas' warranty. See the Renesas warranty booklet for details on
the warranty period. This warranty extends only to you, the original
Purchaser. It is not transferable to anyone who subsequently purchases
the emulator product from you. Renesas is not liable for any claim
made by a third party or made by you for a third party.
DISCLAIMER
RENESAS MAKES NO WARRANTIES, EITHER EXPRESS OR
IMPLIED, ORAL OR WRITTEN, EXCEPT AS PROVIDED
HEREIN, INCLUDING WITHOUT LIMITATION THEREOF,
WARRANTIES AS TO MARKETABILITY, MERCHANTABILITY,
FITNESS FOR ANY PARTICULAR PURPOSE OR USE, OR
AGAINST INFRINGEMENT OF ANY PATENT. IN NO EVENT
SHALL RENESAS BE LIABLE FOR ANY DIRECT, INCIDENTAL
OR CONSEQUENTIAL DAMAGES OF ANY NATURE, OR
LOSSES OR EXPENSES RESULTING FROM ANY DEFECTIVE
EMULATOR PRODUCT, THE USE OF ANY EMULATOR
PRODUCT, OR ITS DOCUMENTATION, EVEN IF ADVISED
OF THE POSSIBILITY OF SUCH DAMAGES. EXCEPT AS
EXPRESSLY STATED OTHERWISE IN THIS WARRANTY,
THIS EMULATOR PRODUCT IS SOLD "AS IS ", AND YOU
MUST ASSUME ALL RISK FOR THE USE AND RESULTS
OBTAINED FROM THE EMULATOR PRODUCT.
II
State Law:
Some states do not allow the exclusion or limitation of implied warranties or liability for
incidental or consequential damages, so the above limitation or exclusion may not apply to you.
This warranty gives you specific legal rights, and you may have other rights which may vary from
state to state.
The Warranty is Void in the Following Cases:
Renesas shall have no liability or legal responsibility for any problems caused by misuse,
abuse, misapplication, neglect, improper handling, installation, repair or modifications of the
emulator product without Renesas' prior written consent or any problems caused by the user
system.
All Rights Reserved:
This user's manual and emulator product are copyrighted and all rights are reserved by
Renesas. No part of this user's manual, all or part, may be reproduced or duplicated in any form,
in hard-copy or machine-readable form, by any means available without Renesas' prior written
consent.
Other Important Things to Keep in Mind:
1. Circuitry and other examples described herein are meant merely to indicate the characteristics
and performance of Renesas' semiconductor products. Renesas assumes no responsibility for
any intellectual property claims or other problems that may result from applications based on
the examples described herein.
2. No license is granted by implication or otherwise under any patents or other rights of any third
party or Renesas.
Figures:
Some figures in this user's manual may show items different from your actual system.
Limited Anticipation of Danger:
Renesas cannot anticipate every possible circumstance that might involve a potential hazard.
The warnings in this user's manual and on the emulator product are therefore not all inclusive.
Therefore, you must use the emulator product safely at your own risk.
III
SAFETY PAGE
READ FIRST
• READ this user's manual before using this emulator product.
• KEEP the user's manual handy for future reference.
Do not attempt to use the emulator product until you fully understand its mechanism.
DEFINITION OF SIGNAL WORDS
This is the safety alert symbol. It is used to alert you to potential personal
injury hazards. Obey all safety messages that follow this symbol to avoid
possible injury or death.
DANGER
WARNING
CAUTION
CAUTION
DANGER indicates an imminently hazardous situation which, if not
avoided, will result in death or serious injury.
WARNING indicates a potentially hazardous situation which, if not
avoided, could result in death or serious injury.
CAUTION indicates a potentially hazardous situation which, if not
avoided, may result in minor or moderate injury.
CAUTION used without the safety alert symbol indicates a
potentially hazardous situation which, if not avoided, may result
in property damage.
NOTE emphasizes essential information.
IV
WARNING
Observe the precautions listed below. Failure to do so
will result in a FIRE HAZARD and will damage the user
system and the emulator product or will result in
PERSONAL INJURY. The USER PROGRAM will be
LOST.
1. Do not repair or remodel the emulator product by
yourself for electric shock prevention and quality
assurance.
2. Always switch OFF the E6000 emulator and user system
before connecting or disconnecting any CABLES or
PARTS.
3. Always before connecting any CABLES, make sure that
pin 1 on both sides are correctly aligned.
4. Supply power according to the power specifications and
do not apply an incorrect power voltage. Use only the
provided power cable.
V
CAUTION
This equipment has been tested and found to comply
with the limits for a Class A digital device, pursuant to part 15
of the FCC Rules. These limits are designed to provide
reasonable protection against harmful interference when the
equipment is operated in a commercial environment. This
equipment generates, uses, and can radiate radio frequency
energy and, if not installed and used in accordance with the
instruction manual, may cause harmful interference to radio
communications. Operation of this equipment in a residential
area is likely to cause harmful interference in which case the
user will be required to correct the interference at his own
expense.
VI
Introduction
The E6000 emulator is an advanced realtime in-circuit emulator, which allows programs to be developed and debugged
for the H8S family microcomputers.
The E6000 emulator can either be used without a user system, for developing and debugging software, or connected via a
user system interface cable to a user system, for debugging user hardware.
High-performance Embedded Workshop (hereafter referred to as HEW) is a Graphical User Interface intended to ease the
development and debugging of applications written in C/C++ programming language and assembly language for Renesas
microcomputers. Its aim is to provide a powerful yet intuitive way of accessing, observing and modifying the debugging
platform in which the application is running.
HEW is a powerful development environment for embedded applications targeted at Renesas microcontrollers. The main
features are:
• A configurable build engine that allows you to set-up compiler, assembler and linker options via an easy to use
interface.
• An integrated text editor with user customizable syntax coloring to improve code readability.
• A configurable environment to run your own tools.
• An integrated debugger which allows you to build and debug in the same application.
• Version control support.
HEW has been designed with two key aims; firstly to provide you, the user, with a set of powerful development tools and,
secondly, to unify and present them in a way that is easy to use.
i
About This Manual
This manual is comprised of two parts: HEW Part and Emulator Debugger Part.
HEW Part:
Information on the basic “look and feel” of the HEW and customizing the HEW environment,
and detail of the HEW’s build function.
Emulator Debugger Part: Preparation before use, E6000 emulator functions, debugging function, tutorial, and hardware
and software specifications of the E6000 emulator.
This manual does not intend to explain how to write C/C++ or assembly language programs, how to use any particular
operating system or how best to tailor code for the individual devices. These issues are left to the respective manuals.
Microsoft®, MS-DOS, Windows®, Windows NT® are registered trademarks of Microsoft Corporation.
Visual SourceSafe is a trademark of Microsoft Corporation.
IBM is a registered trademark of International Business Machines Corporation.
All brand or product names used in this manual are trademarks or registered trademarks of their respective companies or
organizations.
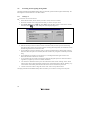
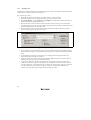
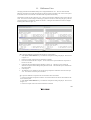
Document Conventions
This manual uses the following typographic conventions:
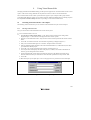
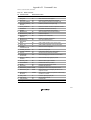
Table 1
Typographic Conventions
Convention
Meaning
[Menu->Menu Option]
Bold text with ‘->’ is used to indicate menu options
(for example, [File->Save As...]).
FILENAME.C
Uppercase names are used to indicate filenames.
“enter this string”
Used to indicate text that must be entered (excluding the “” quotes).
Key + Key
Used to indicate required key presses. For example, CTRL+N means
press the CTRL key and then, whilst holding the CTRL key down,
press the N key.
(The “how to” symbol)
When this symbol is used, it is always located in the left hand margin.
It indicates that the text to its immediate right is describing “how to”
do something.
Components
Check all the components described in the component list unpacking. If the components are not complete, contact a
Renesas sales office.
ii
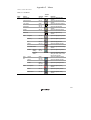
Contents
HEW Part
1.
1.1
1.2
1.3
1.4
1.5
1.6
2.
2.1
2.2
2.3
2.4
2.5
2.6
2.7
2.8
2.9
2.10
2.11
2.12
2.13
2.14
Overview......................................................................................... 1
Workspaces, Projects and Files........................................................................................1
The Main Window...........................................................................................................2
1.2.1 The Title Bar.......................................................................................................2
1.2.2 The Menu Bar.....................................................................................................2
1.2.3 The Toolbars.......................................................................................................3
1.2.4 The Workspace Window.....................................................................................5
1.2.5 The Editor Window.............................................................................................7
1.2.6 The Output Window ...........................................................................................8
1.2.7 The Status Bar.....................................................................................................9
The Help System..............................................................................................................9
Launching the HEW ........................................................................................................10
Exiting the HEW..............................................................................................................10
Component System Overview..........................................................................................10
Build Basics .................................................................................... 11
The Build Process ............................................................................................................11
Project Files .....................................................................................................................12
2.2.1 Adding Files to a Project.....................................................................................13
2.2.2 Removing Files from a Project............................................................................15
2.2.3 Excluding a Project File from Build....................................................................16
2.2.4 Including a Project File in Build .........................................................................16
File Extensions and File Groups ......................................................................................17
Specifying How to Build a File........................................................................................22
Build Configurations........................................................................................................23
2.5.1 Selecting a Configuration....................................................................................24
2.5.2 Adding and Deleting Configurations ..................................................................25
Building a Project ............................................................................................................26
2.6.1 Building a Project ...............................................................................................26
2.6.2 Building Individual Files ....................................................................................26
2.6.3 Stopping a Build .................................................................................................27
2.6.4 Building Multiple Projects ..................................................................................27
2.6.5 The Output Window ...........................................................................................28
2.6.6 Controlling the Content of the Output Window ..................................................28
2.6.7 Displaying out of date files in the workspace window........................................30
File Dependencies............................................................................................................31
Configuring the Workspace Window...............................................................................31
2.8.1 Show Dependencies under Each File ..................................................................31
2.8.2 Show Standard Library Includes .........................................................................32
2.8.3 Show File Paths ..................................................................................................32
2.8.4 Sort files by time order........................................................................................33
Setting the Current Project...............................................................................................33
Inserting a Project into a Workspace................................................................................34
Specifying Dependencies between Projects .....................................................................35
Removing a Project from a Workspace............................................................................36
Loading/unloading a Project into/from a Workspace .......................................................36
Relative projects paths in the workspace..........................................................................37
iii
2.15 User folders in the workspace.......................................................................................... 38
3.
Advanced Build Features.................................................................39
3.1
The Build Process Revisited ............................................................................................ 39
3.1.1 What is a Build?.................................................................................................. 39
3.2 Creating a Custom Build Phase ....................................................................................... 41
3.3 Ordering Build Phases ..................................................................................................... 45
3.3.1 Build Phase Order............................................................................................... 46
3.3.2 Build File Phase Order........................................................................................ 49
3.4 Setting Custom Build Phase Options ............................................................................... 50
3.4.1 Options Tab ........................................................................................................ 51
3.4.2 Output Files Tab ................................................................................................. 51
3.4.3 Dependent Files Tab ........................................................................................... 53
3.5 File Mappings.................................................................................................................. 55
3.6 Controlling the Build ....................................................................................................... 57
3.7 Logging Build Output...................................................................................................... 58
3.8 Changing Toolchain Version ........................................................................................... 59
3.9 Using an External Debugger............................................................................................ 60
3.10 Generating a Makefile ..................................................................................................... 63
3.11 Using a makefile inside the HEW system ........................................................................ 65
3.12 Customizing the HEW linkage order ............................................................................... 67
4.
4.1
4.2
Using the Editor...............................................................................69
The Editor Window ......................................................................................................... 69
Working with Multiple Files............................................................................................ 70
4.2.1 The Editor Toolbars ............................................................................................ 70
4.2.2 Editor Toolbar Buttons ....................................................................................... 70
4.2.3 Search Toolbar Buttons....................................................................................... 72
4.2.4 Bookmarks Toolbar Buttons ............................................................................... 72
4.2.5 Templates Toolbar Buttons................................................................................. 72
4.3 Standard File Operations ................................................................................................. 73
4.3.1 Creating a New File ............................................................................................ 73
4.3.2 Saving a File ....................................................................................................... 73
4.3.3 Saving all Files ................................................................................................... 73
4.3.4 Opening a File .................................................................................................... 74
4.3.5 Closing Files....................................................................................................... 74
4.4 Editing a File ................................................................................................................... 75
4.5 Searching and Navigating through Files .......................................................................... 76
4.5.1 Finding Text ....................................................................................................... 76
4.5.2 Finding Text in Multiple Files ............................................................................ 77
4.5.3 Replacing Text.................................................................................................... 78
4.5.4 Jumping to a Specified Line................................................................................ 79
4.6 Bookmarks....................................................................................................................... 80
4.7 Printing a File .................................................................................................................. 80
4.8 Configuring Text Layout ................................................................................................. 81
4.8.1 Page Set-up......................................................................................................... 81
4.8.2 Changing Tabs.................................................................................................... 83
4.8.3 Auto Indentation ................................................................................................. 84
4.9 Splitting a Window.......................................................................................................... 85
4.10 Configuring Text ............................................................................................................. 86
4.10.1 Changing the Editor Font.................................................................................... 86
4.11 Syntax Coloring............................................................................................................... 87
4.12 Templates ........................................................................................................................ 89
iv
4.12.1 Defining a Template ...........................................................................................89
4.12.2 Deleting a Template............................................................................................91
4.12.3 Inserting a Template ...........................................................................................91
4.12.4 Brace Matching...................................................................................................92
4.13 Editor Column management ............................................................................................93
4.14 Enable tooltip watch ........................................................................................................94
5.
5.1
5.2
5.3
5.4
5.5
5.6
5.7
5.8
5.9
6.
6.1
6.2
6.3
6.4
6.5
6.6
6.7
6.8
6.9
7.
7.1
8.
8.1
8.2
8.3
Tools Administration ...................................................................... 95
Tool Locations ................................................................................................................. 96
HEW Registration Files (*.HRF).....................................................................................96
Registering Components..................................................................................................97
5.3.1 Searching Drives for Components ......................................................................97
5.3.2 Registering a Single Component.........................................................................98
Unregistering Components ..............................................................................................98
Viewing and Editing Component Properties ....................................................................99
Uninstalling Components.................................................................................................101
Technical Support Issues .................................................................................................103
On-Demand components..................................................................................................105
Custom Project Types......................................................................................................106
Customizing the Environment ........................................................ 113
Customizing the Toolbar..................................................................................................113
Customizing the Tools Menu...........................................................................................116
Configuring the Help System...........................................................................................118
Specifying Workspace Options........................................................................................119
6.4.1 Open last workspace at start-up ..........................................................................120
6.4.2 Restore the files on opening workspace ..............................................................120
6.4.3 Display workspace information dialog on opening workspace ...........................120
6.4.4 Save workspace before executing any tools ........................................................121
6.4.5 Prompt before saving workspace ........................................................................121
6.4.6 Prompt before saving session..............................................................................121
6.4.7 Save auto-recovery info ......................................................................................122
6.4.8 Default directory for new workspaces.................................................................122
Using an External Editor..................................................................................................123
Customizing File Save .....................................................................................................124
6.6.1 Save files before executing any tools ..................................................................124
6.6.2 Prompt before saving files ..................................................................................124
Using Custom Placeholders .............................................................................................125
Using the workspace and project log facilities .................................................................127
Using the virtual desktop .................................................................................................127
Version Control............................................................................... 129
Selecting a Version Control System.................................................................................130
Using the Custom Version Control System .................................... 133
Defining Version Control Menu Options .........................................................................133
8.1.1 System menu options and toolbar buttons...........................................................135
8.1.2 User menu options ..............................................................................................137
Defining Version Control Commands..............................................................................139
8.2.1 Executable return code........................................................................................139
Specifying Arguments .....................................................................................................140
8.3.1 Specifying File Locations ...................................................................................141
8.3.2 Specifying Environment .....................................................................................144
v
8.4
8.5
9.
9.1
8.3.3 Specifying Comments......................................................................................... 145
8.3.4 Specifying a User Name and Password............................................................... 146
Controlling Execution...................................................................................................... 148
8.4.1 Prompt before executing command..................................................................... 148
8.4.2 Run in DOS Window.......................................................................................... 148
8.4.3 Use forward slash ‘/’ as version control directory delimiter................................ 148
Importing and exporting a Set-up .................................................................................... 149
Using Visual SourceSafe .................................................................151
9.3
Attaching Visual SourceSafe to a Workspace.................................................................. 151
9.1.1 Selecting Visual SourceSafe ............................................................................... 151
9.1.2 Adding files to Visual SourceSafe ...................................................................... 152
Visual SourceSafe commands.......................................................................................... 153
9.2.1 Removing a File from Version Control............................................................... 153
9.2.2 Getting a Read Only Copy of a File from Version Control................................. 153
9.2.3 Checking Out a Writable Copy of a File from Version Control .......................... 154
9.2.4 Checking In a Writable Copy of a File into Version Control .............................. 154
9.2.5 Undoing a Check Out Operation......................................................................... 154
9.2.6 Viewing the Status of a File................................................................................ 155
9.2.7 Viewing the History of a File.............................................................................. 155
Visual SourceSafe Integration Options ............................................................................ 155
10.
Network Facilities............................................................................157
9.2
10.1 Overview ......................................................................................................................... 157
10.1.1 Enabling network access..................................................................................... 158
10.1.2 Setting the administrator user’s password........................................................... 158
10.1.3 Adding new users to the system.......................................................................... 160
10.1.4 Changing your password..................................................................................... 161
10.1.5 Using the network HEW service......................................................................... 161
11.
Difference View ..............................................................................163
12.
Technical Support............................................................................167
13.
Navigation facilities.........................................................................169
13.1 C++ Navigation component............................................................................................. 171
13.2 C Function and #defines navigation components............................................................. 174
14.
Smart Editor.....................................................................................175
Emulator Debugger Part
Section 1 Overview ...........................................................................................179
1.1
1.2
1.3
1.4
Features ........................................................................................................................... 179
Warnings ......................................................................................................................... 180
Environmental Conditions ............................................................................................... 181
Emulator External Dimensions and Mass ........................................................................ 181
Section 2 Preparation before Use ......................................................................183
2.1
2.2
2.3
vi
Emulator Preparation ....................................................................................................... 183
Installing Emulator’s Software ........................................................................................ 183
Connecting to the User System........................................................................................ 184
2.3.1
Example of Connecting the User System Interface Cable Head
to the User System ..............................................................................................184
2.3.2 Plugging the User System Interface Cable Body into the Emulator ....................185
2.3.3 Plugging the User System Interface Cable Body into the Cable Head ................185
2.4 Power Supply...................................................................................................................186
2.4.1 AC Adapter.........................................................................................................186
2.4.2 Polarity ...............................................................................................................186
2.4.3 Power Supply Monitor Circuit ............................................................................186
2.5 SIMM Memory Module...................................................................................................186
2.5.1 Optional SIMM Memory Module Configuration ................................................186
2.6 Hardware Interface ..........................................................................................................187
2.6.1 Signal Protection on the emulator .......................................................................187
2.6.2 User System Interface Circuits............................................................................187
2.6.3 Clock Oscillator ..................................................................................................187
2.6.4 External Probe 1 (EXT1)/Trigger Output............................................................187
2.6.5 External Probe 2 (EXT2)/Trigger Output............................................................188
2.6.6 Voltage Follower Circuit ....................................................................................189
2.7 System Check .....................................................................................................................190
2.8 Communication Problems................................................................................................194
2.9 Other Methods for Activating the Emulator........................................................................194
2.10 Uninstalling the Emulator’s Software...............................................................................194
Section 3 E6000 Emulator Functions ............................................................... 195
3.1
3.2
3.3
3.4
3.5
Debugging Features .........................................................................................................195
3.1.1 Breakpoints.........................................................................................................195
3.1.2 Trace...................................................................................................................195
3.1.3 Execution Time Measurements...........................................................................195
3.1.4 Performance Analysis .........................................................................................195
3.1.5 Bus Monitoring...................................................................................................196
Complex Event System (CES).........................................................................................196
3.2.1 Event Channels ...................................................................................................196
3.2.2 Range Channels ..................................................................................................196
3.2.3 Breaks .................................................................................................................197
3.2.4 Timing ................................................................................................................197
Hardware Features ...........................................................................................................197
3.3.1 Memory ..............................................................................................................197
3.3.2 Clocks .................................................................................................................198
3.3.3 Probes .................................................................................................................198
Stack Trace Function ..........................................................................................................198
Online Help ........................................................................................................................198
Section 4 Preparation before Use...................................................................... 199
4.1
4.2
Workspaces, Projects, and Files.......................................................................................199
Method for Activating HEW............................................................................................200
4.2.1 Creating a New Workspace (Toolchain Not Used) .............................................201
4.2.2 Creating a New Workspace (Toolchain Used) ......................................................205
4.2.3 Selecting an Existing Workspace ..........................................................................209
4.3 Setting at Emulator Activation.........................................................................................210
4.4 Debug Sessions................................................................................................................212
4.4.1 Selecting a Session..............................................................................................212
4.4.2 Adding and Removing Sessions..........................................................................213
4.4.3 Saving Session Information ................................................................................215
4.5 Connecting the Emulator ....................................................................................................216
vii
4.6 Reconnecting the Emulator................................................................................................. 217
4.7 Ending the Emulator........................................................................................................... 217
Section 5 Debugging .........................................................................................219
5.1
5.2
5.3
5.4
5.5
5.6
viii
Setting the Environment for Emulation............................................................................ 219
5.1.1 Opening the [Configuration Properties] Dialog Box........................................... 219
5.1.2 Selecting an MCU Not Included in the List ........................................................ 221
5.1.3 Selecting the Interface to be Connected .............................................................. 222
5.1.4 Opening the [Memory Mapping] Dialog Box ..................................................... 223
5.1.5 Changing the Memory Map Setting .................................................................... 224
Downloading a Program .................................................................................................. 225
5.2.1 Downloading a Program ..................................................................................... 225
5.2.2 Viewing the Source Code ................................................................................... 226
5.2.3 Viewing the Assembly-Language Code.............................................................. 229
5.2.4 Modifying the Assembly-Language Code........................................................... 229
5.2.5 Viewing a Specific Address................................................................................ 230
5.2.6 Viewing the Current Program Counter Address.................................................. 230
Debugging with the Command Line Interface ................................................................. 231
5.3.1 Opening the [Command Line] Window.............................................................. 231
5.3.2 Specifying a Command File................................................................................ 231
5.3.3 Executing a Command File................................................................................. 232
5.3.4 Stopping Command Execution ........................................................................... 232
5.3.5 Specifying a Log File.......................................................................................... 232
5.3.6 Starting or Stopping Logging.............................................................................. 232
5.3.7 Entering a Full Path to the File ........................................................................... 232
5.3.8 Pasting a Placeholder.......................................................................................... 233
Viewing the Registers...................................................................................................... 234
5.4.1 Opening the [Register] Window ......................................................................... 234
5.4.2 Expanding a Bit Register .................................................................................... 234
5.4.3 Choosing a Register to be Displayed .................................................................. 235
5.4.4 Splitting Up the Window Display ....................................................................... 235
5.4.5 Modifying Register Contents .............................................................................. 236
5.4.6 Using Register Contents ..................................................................................... 236
5.4.7 Saving the Currently Displayed Contents ........................................................... 236
Operating Memory........................................................................................................... 237
5.5.1 Viewing a Memory Area .................................................................................... 237
5.5.2 Displaying Data in Different Formats................................................................. 238
5.5.3 Splitting Up the Window Display ....................................................................... 239
5.5.4 Viewing a Different Memory Area ..................................................................... 239
5.5.5 Modifying the Memory Contents........................................................................ 239
5.5.6 Selecting a Memory Range................................................................................. 239
5.5.7 Finding a Value in Memory ................................................................................ 240
5.5.8 Filling a Memory Area with a Value .................................................................. 241
5.5.9 Copying a Memory Area .................................................................................... 241
5.5.10 Saving and Verifying a Memory Area ................................................................ 242
5.5.11 Disabling Update of the Window Contents......................................................... 243
5.5.12 Updating the Window Contents .......................................................................... 243
5.5.13 Comparing the Memory Contents....................................................................... 244
5.5.14 Loading a Memory Area from a File .................................................................. 245
Viewing the I/O Memory................................................................................................. 246
5.6.1 Opening the [IO] Window .................................................................................. 246
5.6.2 Expanding the I/O Register Display.................................................................... 246
5.6.3 Manually loading an IO file ................................................................................ 247
5.7
5.8
5.9
5.10
5.11
5.12
5.13
5.14
5.15
5.6.4 Modifying the I/O Register Contents ..................................................................247
5.6.5 Saving the Currently Displayed Contents ...........................................................247
Viewing the Current Status ..............................................................................................248
Reading and Displaying the Emulator Information Regularly .........................................249
5.8.1 Opening the [Extended Monitor] Window..........................................................249
5.8.2 Selecting Items to be Displayed ..........................................................................250
Displaying Memory Contents in Realtime .......................................................................251
5.9.1 Opening the [Monitor] Window..........................................................................251
5.9.2 Changing the Monitor Settings ...........................................................................253
5.9.3 Temporarily Stopping Update of the Monitor.....................................................253
5.9.4 Deleting the Monitor Settings .............................................................................253
5.9.5 Monitoring Variables ..........................................................................................253
5.9.6 Hiding the [Monitor] Window ............................................................................254
5.9.7 Managing the [Monitor] Window .......................................................................254
Viewing the Labels ..........................................................................................................256
5.10.1 Listing Labels .....................................................................................................256
5.10.2 Adding a Label ...................................................................................................257
5.10.3 Editing a Label....................................................................................................257
5.10.4 Deleting a Label..................................................................................................258
5.10.5 Deleting All Labels.............................................................................................258
5.10.6 Loading Labels from a File .................................................................................259
5.10.7 Saving Labels into a File.....................................................................................259
5.10.8 Searching for a Label ..........................................................................................259
5.10.9 Searching for the Next Label ..............................................................................260
5.10.10 Viewing the Source Corresponding to a Label....................................................260
Executing Your Program .................................................................................................261
5.11.1 Running from Reset ............................................................................................261
5.11.2 Continuing Run...................................................................................................261
5.11.3 Running to the Cursor.........................................................................................261
5.11.4 Running from a Specified Address .....................................................................262
5.11.5 Single Step..........................................................................................................263
5.11.6 Multiple Steps.....................................................................................................264
Stopping Your Program ...................................................................................................265
5.12.1 Stopping the Program by the [Stop] Toolbar Button ...........................................265
5.12.2 Standard Breakpoints (PC Breakpoints)..............................................................265
Elf/Dwarf2 Support..........................................................................................................267
5.13.1 C/C++ Operators.................................................................................................267
5.13.2 C/C++ Expressions .............................................................................................267
5.13.3 Supporting Duplicate Labels...............................................................................268
5.13.4 Debugging an Overlay Program..........................................................................269
Viewing the Variables......................................................................................................271
5.14.1 Tooltip Watch .....................................................................................................271
5.14.2 Instant Watch ......................................................................................................271
5.14.3 [Watch] Window.................................................................................................272
5.14.4 [Locals] Window ................................................................................................278
Using the Event Points.....................................................................................................279
5.15.1 PC Breakpoints ...................................................................................................279
5.15.2 Event Points........................................................................................................279
5.15.3 Event Detection System ......................................................................................279
5.15.4 Signals to Indicate Bus States and Areas ............................................................280
5.15.5 Opening the [Event] Window .............................................................................281
5.15.6 Setting PC Breakpoints .......................................................................................281
5.15.7 Setting Event Points............................................................................................283
ix
5.16
5.17
5.18
5.19
5.20
x
5.15.8 Setting Trigger Points ......................................................................................... 291
5.15.9 Editing Event Points ........................................................................................... 292
5.15.10 Modifying Event Points ...................................................................................... 292
5.15.11 Enabling an Event Point...................................................................................... 292
5.15.12 Disabling an Event Point .................................................................................... 292
5.15.13 Deleting an Event Point ...................................................................................... 292
5.15.14 Deleting All Event Points ................................................................................... 292
5.15.15 Viewing the Source Line for an Event Point....................................................... 292
Viewing the Trace Information........................................................................................ 293
5.16.1 Opening the [Trace] Window ............................................................................. 293
5.16.2 Acquiring Trace Information .............................................................................. 293
5.16.3 Specifying Trace Acquisition Conditions ........................................................... 295
5.16.4 Searching for a Trace Record.............................................................................. 303
5.16.5 Clearing the Trace Information........................................................................... 312
5.16.6 Saving the Trace Information in a File................................................................ 312
5.16.7 Viewing the [Source] Window............................................................................ 313
5.16.8 Trimming the Source .......................................................................................... 313
5.16.9 Acquiring a Snapshot of the Trace Information .................................................. 313
5.16.10 Temporarily Stopping Trace Acquisition............................................................ 313
5.16.11 Restarting Trace Acquisition .............................................................................. 313
5.16.12 Extracting Records from the Acquired Information............................................ 314
5.16.13 Calculating the Difference in Time Stamping..................................................... 324
5.16.14 Analyzing Statistical Information ....................................................................... 325
5.16.15 Extracting Function Calls from the Acquired Trace Information........................ 326
Viewing the Function Call History .................................................................................. 327
5.17.1 Opening the [Stack Trace] Window.................................................................... 327
5.17.2 Viewing the Source Program .............................................................................. 327
5.17.3 Specifying the View............................................................................................ 328
Displaying Memory Contents as an Image ...................................................................... 329
5.18.1 Opening the [Image View] Window ................................................................... 329
5.18.2 Automatically Updating the Window Contents................................................... 331
5.18.3 Updating the Window Contents .......................................................................... 332
5.18.4 Displaying the Pixel Information ........................................................................ 332
Displaying Memory Contents as Waveforms................................................................... 333
5.19.1 Opening the Waveform View Window............................................................... 333
5.19.2 Automatically Updating the Window Contents................................................... 334
5.19.3 Updating the Window Contents .......................................................................... 334
5.19.4 Zoom-In Display................................................................................................. 334
5.19.5 Zoom-Out Display .............................................................................................. 334
5.19.6 Resetting the Zoom Display................................................................................ 334
5.19.7 Setting the Zoom Magnification ......................................................................... 334
5.19.8 Setting the Horizontal Scale................................................................................ 334
5.19.9 Non-Display of Cursor........................................................................................ 335
5.19.10 Displaying the Sampling Information ................................................................. 335
Analyzing Performance ................................................................................................... 336
5.20.1 Opening the [Performance Analysis] Window.................................................... 338
5.20.2 Setting Conditions for Measurement................................................................... 339
5.20.3 Selecting the Address Detection Mode and Resolution....................................... 346
5.20.4 Starting Performance Data Acquisition............................................................... 346
5.20.5 Deleting a Measurement Condition..................................................................... 346
5.20.6 Deleting All Measurement Conditions................................................................ 346
Section 6 Tutorial.............................................................................................. 347
6.1 Introduction ........................................................................................................................347
6.2 Running the HEW ..............................................................................................................348
6.3 Downloading the Tutorial Program ....................................................................................349
6.3.1 Downloading the Tutorial Program.......................................................................349
6.3.2 Displaying the Source Program.............................................................................350
6.4 Setting a PC Breakpoint......................................................................................................351
6.5 Setting Registers.................................................................................................................352
6.6 Executing the Program .......................................................................................................353
6.7 Reviewing Breakpoints.......................................................................................................355
6.8 Referring to Symbols..........................................................................................................356
6.9 Viewing Memory................................................................................................................357
6.10 Watching Variables ..........................................................................................................358
6.11 Displaying Local Variables ..............................................................................................361
6.12 Stepping Through a Program ............................................................................................362
6.12.1 Executing the [Step In] Command ......................................................................362
6.12.2 Executing the [Step Out] Command....................................................................364
6.12.3 Executing the [Step Over] Command..................................................................365
6.13 Forced Breaking of Program Executions ..........................................................................366
6.14 Resetting the MCU ...........................................................................................................366
6.15 Break Function .................................................................................................................367
6.15.1 PC Break Function ..............................................................................................367
6.15.2 Breaking Execution at Event Points ....................................................................370
6.16 Trace Functions ................................................................................................................373
6.16.1 Displaying a Trace (when Time Stamping is not Available) ...............................374
6.16.2 Displaying a Trace (when Time Stamping is Available) .....................................380
6.16.3 Statistics..............................................................................................................383
6.16.4 Function Calls.....................................................................................................387
6.17 Stack Trace Function ........................................................................................................388
6.18 Performance Measurement Function ................................................................................389
6.18.1 Time Of Specified Range Measurement .............................................................389
6.19 Monitor Function..............................................................................................................392
6.20 What Next?.......................................................................................................................394
Section 7 Hardware Specifications Specific to This Product ........................... 395
7.1
H8S/2612 E6000 Emulator Specifications.......................................................................395
7.1.1 Supported MCUs and User System Interface Cables ..........................................395
7.1.2 Operating Voltage and Frequency Specifications ...............................................395
7.2 User System Interface.........................................................................................................396
7.2.1 Signal Protection.................................................................................................396
7.2.2 User System Interface Circuits............................................................................396
7.3 Differences between MCU and Emulator ........................................................................398
7.3.1 A/D Converter and D/A Converter .....................................................................398
Section 8 Software Specifications Specific to This Product............................. 399
8.1
Software Specifications of the H8S/2612 E6000 Emulator..............................................399
8.1.1 Target Hardware .................................................................................................399
8.1.2 Selectable Platform .............................................................................................399
8.1.3 [Configuration Properties] Dialog Box ([General] Page)....................................400
8.1.4 [Configuration Properties] Dialog Box ([Custom] Page) ....................................403
8.1.5 Memory Mapping Function ................................................................................406
8.1.6 [Status] Window .................................................................................................406
8.1.7 Extended Monitor Function ................................................................................408
xi
8.2
8.1.8 Signals to Indicate Bus States and Areas ............................................................ 409
8.1.9 Monitoring Function ........................................................................................... 409
8.1.10 Trigger Points ..................................................................................................... 409
8.1.11 Trace Information ............................................................................................... 410
8.1.12 Searching for a Trace Record.............................................................................. 411
8.1.13 Trace Filtering Function ..................................................................................... 412
Notes on Usage of the H8S/2612 E6000 Emulator .......................................................... 414
8.2.1 Environment for Execution of the Tutorial Program........................................... 414
8.2.2 I/O Register Differences between the Actual MCU and the Emulator ................ 414
8.2.3 Access to the Reserved Area............................................................................... 414
8.2.4 Using the Internal RAM Area as External Addresses ......................................... 414
8.2.5 Support of Flash Memory ................................................................................... 414
8.2.6 Hardware Standby .............................................................................................. 414
Appendix A Troubleshooting ............................................................................415
Appendix B Regular Expressions......................................................................417
Appendix C Placeholders ..................................................................................419
C.1
C.2
C.3
C.4
What is a Placeholder?..................................................................................................... 419
Inserting a Placeholder..................................................................................................... 419
Available Placeholders .................................................................................................... 421
Placeholder Tips .............................................................................................................. 423
Appendix D I/O File Format .............................................................................425
D.1
D.2
File format (Bit Field Not Supported).............................................................................. 425
File format (Bit Field Supported)..................................................................................... 427
Appendix E Symbol File Format.......................................................................429
Appendix F HMAKE User Guide .....................................................................431
F.1
F.2
F.3
F.4
F.5
Command line.................................................................................................................. 431
F.1.1 Basic structure .................................................................................................... 431
F.1.2 Exit codes ........................................................................................................... 431
F.1.3 Parameters .......................................................................................................... 431
File syntax ....................................................................................................................... 432
F.2.1 Variable declarations .......................................................................................... 432
Description blocks ........................................................................................................... 433
F.3.1 Basic outline ....................................................................................................... 433
F.3.2 Special commands .............................................................................................. 433
F.3.3 Sub command files ............................................................................................. 434
Comments........................................................................................................................ 435
Message commands ......................................................................................................... 435
Appendix G Menus............................................................................................437
Appendix H Command Lines............................................................................441
Appendix I Diagnostic Test Procedure..............................................................445
I.1
I.2
xii
System Set-Up for Test Program Execution .................................................................... 445
Diagnostic Test Procedure Using Test Program............................................................... 446
HEW Part
1.
Overview
The functions for HEW version V.3.01.04 are explained in this manual. This chapter describes the fundamental
concepts of the High-performance Embedded Workshop. It is intended to give users who are new to Windows®
applications, filling in the details that are required by later chapters.
1.1
Workspaces, Projects and Files
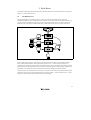
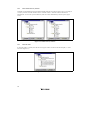
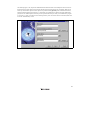
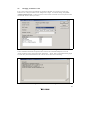
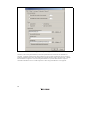
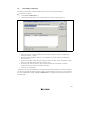
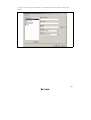
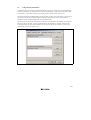
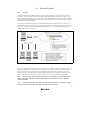
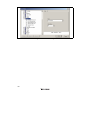
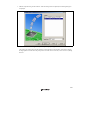
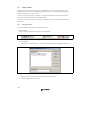
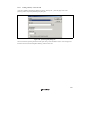
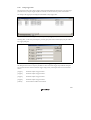
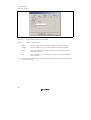
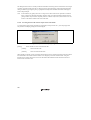
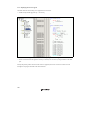
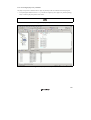
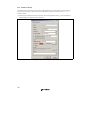
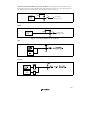
Just as a word processor allows you to create and modify documents, the High-performance Embedded
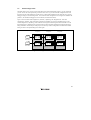
Workshop allows you to create and modify workspaces. A workspace can be thought of as a container of
projects and, similarly, a project can be though of as a container of project files. Thus, each workspace contains
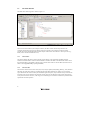
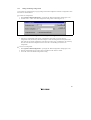
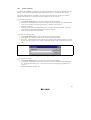
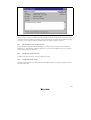
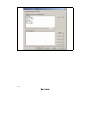
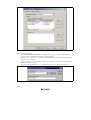
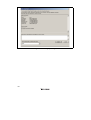
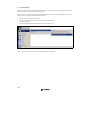
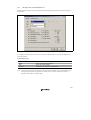
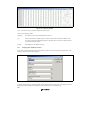
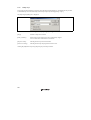
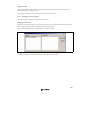
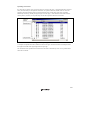
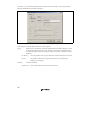
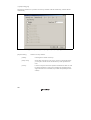
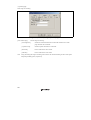
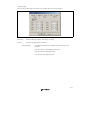
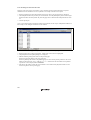
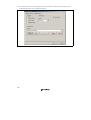
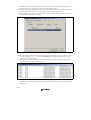
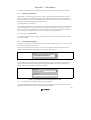
one or more projects and each project contains one or more files. Figure 1.1 illustrates this graphically.
Figure 1.1: Workspaces, Projects and Files
Workspaces allow you to group related projects together. For example, you may have an application that needs
to be built for different processors or you may be developing an application and library at the same time. Projects
can also be linked hierarchically within a workspace, which means that when one project is built all of its “child”
projects are built first.
However, workspaces on their own are not very useful, we need to add a project to a workspace and then add
files to that project before we can actually do anything.
1
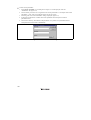
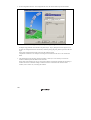
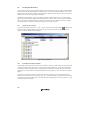
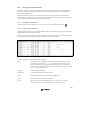
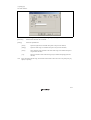
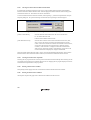
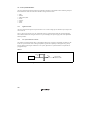
1.2
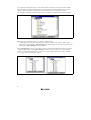
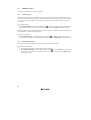
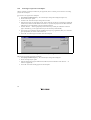
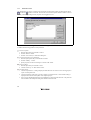
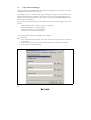
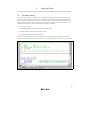
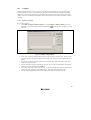
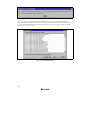
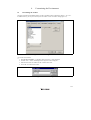
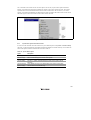
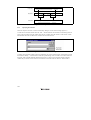
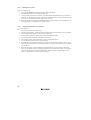
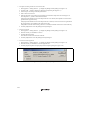
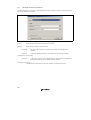
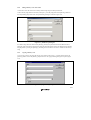
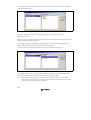
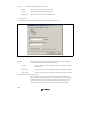
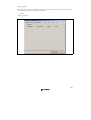
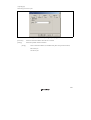
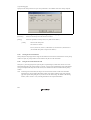
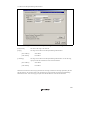
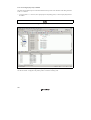
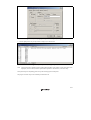
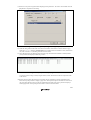
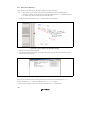
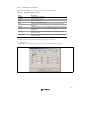
The Main Window
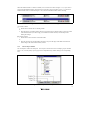
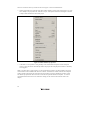
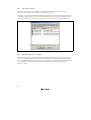
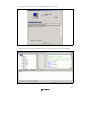
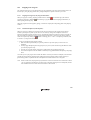
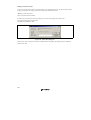
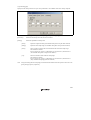
The HEW main window appears as shown in figure 1.2.
Figure 1.2: HEW Main Window
There are three main windows; the workspace window, the editor window and the output window. The
workspace window shows the projects and files which are currently in the workspace, the editor window
provides file viewing and editing facilities and the output window shows the results of a various processes (e.g.
build, version control commands and so on).
1.2.1
The Title Bar
The title bar displays the name of current activate project and file. It also contains the standard minimize,
maximize and close buttons. Click the minimize button to minimize the HEW on the Windows® task bar. Click
the maximize button to force HEW to fill the screen. Click the close button to close the HEW (this has the same
effect as selecting [File->Exit] or pressing ALT+F4).
1.2.2
The Menu Bar
The menu bar contains eleven menus: File, Edit, View, Project, Options, Build, Debug, Memory, Tools, Window
and Help. All of the menu options are grouped logically under these headings. For instance, if you wanted to
open a file then the file menu is where you will find the right menu option, if you wanted to set-up a tool then the
tools menu is the correct selection. The following sections will cover the functions of the various menu options,
as they become relevant. However, at this stage, it is worth taking a few moments to familiarize yourself with the
options that each menu provides.
2
1.2.3
The Toolbars
The toolbars provide a shortcut to the options, which you will use the most often. There are ten default toolbars:
Bookmarks, Debug, Debug Run, Editor, Search, Standard, Templates, Version Control, Difference, and Map (as
shown in figure 1.3 to 1.12). Toolbars can be created, modified and removed via the [Tools->Customize…]
menu option (see chapter 6, “Customizing the Environment”, for further information).
Figure 1.3: Bookmarks Toolbar
Figure 1.4: Debug Toolbar
Figure 1.5: Debug Run Toolbar
Figure 1.6: Editor Toolbar
Figure 1.7: Search Toolbar
3
Figure 1.8: Standard Toolbar
Figure 1.9: Templates Toolbar
Figure 1.10: Version Control Toolbar
Figure 1.11: Difference Toolbar
Figure 1.12: Map Toolbar
4
When the Standard toolbar or a toolbar is docked, it has a control bar as shown in figure 1.13 (i). If you want to
move the docked Standard toolbar, click and drag its control bar to the new location. Figure 1.13 (i) shows the
Standard toolbar when it is docked and figure 1.13 (ii) shows the Standard toolbar when it is floating.
Figure 1.13: Standard Toolbar, Docked and Floating
To dock a toolbar:
1. Double-click on the title bar of a floating toolbar.
or:
2. Drag the title bar of a floating toolbar and draw it toward an edge of a docked window, menu bar, toolbar
or the HEW main frame, on whose edge you would like to dock the window, until the shape of the
floating bar changes.
To float a toolbar:
1. Double-click on the control bar of a docked toolbar.
or:
2. Drag the control bar of a docked toolbar and draw it away from the edge of the HEW main frame and
from an edge of the other docked windows, toolbar.
1.2.4
The Workspace Window
The “Workspace” window has three panes. The “Projects” tab shows the current workspace, projects and files
(figure 1.14). You can quickly open any project file or dependent file by double clicking on its corresponding
icon.
Figure 1.14: Workspace Window Projects Tab
5
The “Navigation” tab provides jumps to various textual constructs within your project’s files. What is actually
displayed within the navigation tab depends upon what components are currently installed. Figure 1.15 shows
ANSI C functions. See chapter 2, “Build Basics”, for more information on the “Workspace” window.
The “Templates” tab displays template settings. See 4.12, “Templates”, for more information about a template.
Figure 1.15: Workspace Window Navigation Tab
To allow the “Workspace” window or the “Output” window docking:
Click the right mouse button anywhere inside the “Workspace” window or the “Output” window. Then a
pop-up menu will be displayed. If [Allow Docking] is checked, docking is allowed; otherwise, docking is not
allowed. Select [Allow Docking] to check or uncheck it.
When [Allow Docking] is checked, you can dock a window to the edge of the HEW main window or to the edge
of another docked window. Also if [Allow Docking] is checked, you can float them “above” the other HEW
windows or outside the HEW main window. Figure 1.16 (i) shows a docked “Workspace” window, and figure
1.16 (ii) shows a floating “Workspace” window.
Figure 1.16: Workspace Window, Docked and Floating
6
When the “Workspace” window or the “Output” window is docked, it has a control bar as shown in figure 1.17.
If you want to move a docked window, click and drag its control bar to the new location.
Figure 1.17: Control Bar of Docking Window
To dock the “Workspace” window or the “Output” window:
[Allow Docking] must be checked on the pop-up menu of the window to dock the “Workspace” window or
the “Output” window. (The pop-up menu will be displayed when you click the right mouse button anywhere
inside the window.) Then you have two ways to dock the window.
1. Double-click on the control bar of a floating window.
or:
2. Drag the title bar of a floating window and draw it toward an edge of a docked window, menu bar or
toolbar, or the HEW main frame, on whose edge you would like to dock the window, until the shape of
the floating window changes.
To float the “Workspace” window or the “Output” window:
[Allow Docking] must be checked on the pop-up menu of the window to float the “Workspace” window or
the “Output” window. (The pop-up menu will be displayed when you click the right mouse button anywhere
inside the window.) Then you have two ways to float the window.
1. Double-click on the control bar of a docking window.
or:
2. Drag the control bar of a docked window and draw it away from the edge of the HEW main frame and
from an edge of the other docked windows, menu bar or toolbar.
To hide the “Workspace” window or the “Output” window:
Click on the close button, which is located in the top right corner of the window. Or push the right mouse
button anywhere inside a floating window and select [Hide] on the pop-up menu.
To display the “Workspace” window or the “Output” window:
Select [View->Workspace] or [View->Output], respectively.
1.2.5
The Editor Window
The editor window is where you will work with the files of your project. The HEW allows you to have many
files open at one time, to switch between them, to arrange them and to edit them in whichever order you want to.
By default, the editor window is displayed in a notebook style, where each text file has a separate tab (as shown
in figure 1.18).
The editor contains a gutter on the left-hand side of the window. The standard column allows the user to
configure the position of bookmarks and software breakpoints quickly and easily.
If you are unsure what purpose a column has or what the information it is displaying is if you place the cursor
over the column a tool tip is displayed showing its identity.
7
Figure 1.18: Editor Window
The editor window can be customized via the “Format Views” dialog box, which can be invoked via the [Tools>Format Views…] menu option. This dialog allows you to configure fonts, colors, tabs and so on for the editor
window. It also allows the user to change the look of other views, which have been installed by HEW. If you
would prefer to use your favorite editor rather than the HEW internal editor then specify your alternative in the
“Options” dialog box, which can be invoked via the [Tools->Option…] menu option. For further details on how
to use and configure the editor, refer to chapter 4, “Using the Editor”.
1.2.6
The Output Window
The “Output” window by default has four tabs on display. The “Build” tab shows the output from any build
process (e.g. compiler, assembler and so on). If an error is encountered in a source file then the error will be
displayed in the build tab along with the source file name and line number. To quickly locate a problem, double
click on the error to jump to the source file and line.
Figure 1.19: Output Window
The “Debug” tab shows the output from any debugger process. Any debug component that needs to display
information will send its output to this window.
8
The “Find in Files” tab displays the results of the last “Find in Files” action. To activate find in files, select the
[Edit->Find in Files…] menu option, the toolbar button. For further details on how to use find in files, refer to
chapter 4, “Using the Editor”.
The “Version Control” tab displays the results of version control actions. The tab is only displayed if a version
control system is in use. For further details on version control, refer to chapter 7, “Version Control”.
1.2.7
The Status Bar
The status bar displays information as to the current state of the HEW. Figure 1.20 shows the eight sections of
the status bar.
Figure 1.20: Status Bar
1.3
The Help System
The help menu is the rightmost menu on the HEW menu bar. It contains the menu option “Contents” which,
when selected, takes you to the main HEW help window.
To obtain help on specific dialogs click on the context sensitive help button, which is located in the top righthand corner of each dialog box (as shown in figure 1.21).
Figure 1.21: Help Button
When this is clicked, the mouse pointer will change to a pointer with a question mark above it. Whilst the mouse
pointer is in this state, click on the part of the dialog box that you require assistance on.
Alternatively, select the control that you require help for and then press the F1 key.
9
1.4
Launching the HEW
To run the HEW, open the “Start” menu of Windows®, select “Programs”, select “Renesas High-performance
Embedded Workshop” and then select the shortcut of the HEW. By default, the “Welcome!” dialog box shown
in figure 1.22 will be displayed.
Figure 1.22: Welcome! Dialog
To create a new workspace, select “Create a new project workspace”, and click “OK”. To open one of recent
project workspaces, select “Open a recent project workspace”, select a workspace from the drop-down list, and
click “OK”. The recent project workspace list displays the same information as that seen in the workspace most
recently used file list. This list appears on the file menu. To open a workspace by specifying a workspace file
(.HWS file), select “Browse to another project workspace”, and click “OK”. To register a tool to or unregister a
tool from the HEW, click the “Administration…” button (see chapter 5, “Tool Administration” for details).
Click the “Cancel” button to use the HEW without opening a workspace.
1.5
Exiting the HEW
The HEW can be exited by selecting [File->Exit], pressing ALT+F4 or by selecting the close option from the
system menu. (To open the system menu, click the icon at the upper-left corner of the HEW title bar.) If a
workspace is open then the same workspace closedown procedure is followed as described in the previous
section.
1.6
Component System Overview
The HEW allows the user to extend the HEW functionality by adding additional components to the system. This
is achieved by registering the component in the Tools Administration dialog box. These components can add
windows, menus and toolbars to the HEW system. Examples of the components are the debugger and builder
components of HEW. The debugger component adds all of the menus and toolbars associated with the debugger
and the builder component does the same for the build functionality. The components you have registered in the
system will modify the look and feel of HEW. In some cases you may not have some of the menus which you
can see in this manual. For instance if the debugger component is not installed you will not have the “Debug”
menu in the HEW main window.
10
2. Build Basics
This chapter explains the general basic functions of the HEW whilst the more advanced features can be found in
chapter 3, “Advanced Build Features”.
2.1
The Build Process
The typical build process is outlined in figure 2.1. This may not be the exact build process, which your
installation of HEW will use as it depends upon the tools that were provided with your installation of HEW (e.g.
you may not have a compiler for instance). In any case, the principles are the same - each step or phase of the
build takes a set of project files and then builds them, if all succeeds then the next step or phase is executed.
Figure 2.1: Typical Build Process
In the example shown in figure 2.1 the compiler is the first phase, the assembler is the second phase and the
linker is the third and final phase. During the compiler phase, the C/C++ source files from the project are
compiled in turn, during the assembler phase, the assembler source files are assembled in turn. During the linker
phase all library files and output files from the compiler and assembler phases are linked together to produce the
load module. This module can then be downloaded and used by the debugger functionality in HEW.
The build process can be customized in several ways. For instance, you can add your own phase, disable a phase,
delete phases and so forth. These advanced build issues are left to chapter 3, “Advanced Build Features”. In this
chapter, only the general principles and basic features will be detailed.
11
2.2
Project Files
In order for the HEW to be able to build your application, you must first tell it, which files should be in the
project, and how each file should be built (figure 2.2).
Figure 2.2: Editing a Project
12
2.2.1
Adding Files to a Project
Before you can build your application you must first inform the High-performance Embedded Workshop, which
files it is composed of.
To add a files to a project:
1. Select [Project->Add Files...], or click the right mouse button on a project icon in the “Projects” tab of
the “Workspace” window and select [Add Files…] from the pop-up menu (see figure 2.3), or press INS
when the “Workspace” window is selected.
Figure 2.3: Projects Tab Pop-up Menu
2. The “Add” dialog will be displayed.
3. Select the file(s), that you want to add and then click “Add”.
13
There are a number of other ways to add new files to the project. These are described below:
•
Clicking right button on an open file in the editor window displays a pop-up menu option (figure 2.4). If the
file is already in the project then the “Add File to Project” menu option is disabled. Selecting the “Add File
to Project” then adds the file to the current project.
Figure 2.4: Editor Window Pop-up Menu
•
In the HEW it is also possible to “Drag and Drop” files from Windows® Explorer onto the workspace
window. These files will be automatically added to the project and are displayed in the folder in which they
were dragged to.
Note: If you add a file to a project when it is an unrecognized file type then it will still be added to the project.
Certain functions will be disabled with reference to this file. When this file is double clicked in the workspace
window instead of opening the file in the editor the open operation is passed to Windows® operating system.
The default open operation is then carried out as if the file was opened in Windows® Explorer. To view the
current defined extensions use the “File Extensions” dialog (see the section on file extensions later in this
chapter).
14
2.2.2
Removing Files from a Project
Files can be individually removed from a project, selections of files can be removed or all files can be removed.
To remove files from a project:
1. Select [Project->Remove Files...], or click the right mouse button on a project icon in the “Projects” tab
of the “Workspace” window and select [Remove Files…] from the pop-up menu (see figure 2.5). The
“Remove Project Files” dialog will be displayed (figure 2.6).
Figure 2.5: Projects Tab Pop-up Menu
Figure 2.6: Remove Project Files Dialog
15
2. Select the file or files which you want to remove from the “Project files” list.
3. Click the “Remove” button to remove the selected files or click “Remove All” to remove all project files.
4. Click “OK” to remove the files from the project.
To remove selected files from a project:
1. Select the files, which you want to remove, in the “Projects” tab of the “Workspace” window. Multiple
files can be selected by holding down the SHIFT or CTRL key.
2. Press the DEL key. The files will be removed.
2.2.3
Excluding a Project File from Build
A file in a project can be individually excluded from build on a configuration by configuration basis.
To exclude a file in a project from build:
1. Push the right mouse button on a file, which you want to be excluded from build, in the “Projects” tab of
the “Workspace” window.
2. Select [Exclude Build file ], where <file> is the selected file, from the pop-up menu (figure 2.5). Then a
red cross will be put on the file’s icon, and the file will be excluded from build.
2.2.4
Including a Project File in Build
An excluded file can be included in the project again.
To include a file which has been excluded from build:
1. Push the right mouse button on a file, which has been excluded from build, on the “Projects” tab of the
“Workspace” window.
2. Select [Include Build file ], where <file> is the selected file, from the pop-up menu. Then a red cross will
be removed from the file’s icon, and the file will be included in build.
16
2.3
File Extensions and File Groups
The HEW can identify files by their extension. The system defines certain extensions depending upon the tools,
which are being used. For example, if you are using a compiler then the .c extension will be in the “C source
file” group and be used as input to the compiler phase (figure 2.1, Typical Build Process). Additionally, the
HEW allows you to define your own extensions. For example, if the project you are developing uses assembler
source files the default extension may be .src. If you would like to use a different extension instead of .src
(e.g. .asm) then you can define a new extension and request that the HEW treats it in the same way as a .src file.
File extensions and file groups can be viewed and modified via the “File Extensions” dialog (figure 2.7). This is
invoked by selecting [Project->File Extensions...]. This dialog displays all of the extensions and file groups,
which are defined within the current workspace.
Figure 2.7: File Extensions Dialog
The “File Extensions” list shown in figure 2.7 is divided into two columns. On the left are the file extensions
themselves, whilst on the right are the file groups. Many file extensions can belong to the same group. For
example, assembler source files may have several extensions in a single project (e.g. .src, .asm, .mar etc) as
shown in figure 2.8.
.SRC
.ASM
.MAR
Assembler source files
.C
.LIB
C source files
.LPF
Library files
Figure 2.8: File Extensions and Groups
When creating a new extension you should consider whether the extension belongs to a group, which is already
defined, or whether you need to create a new file group. If you are adding a completely new type of file then you
will want to create a new file group. This process is described below.
17
To create a new file extension in a new file group:
1. Select [Project->File Extensions...] from the menu bar. The “File Extensions” dialog will be displayed
(figure 2.7).
2. Click the “Add…” button. The “Add File Extension” dialog will be displayed (figure 2.9).
3. Enter the extension, which you want to define into the “File extension” field. It is not necessary to type
the dot ( . ) character. The drop list contains all extensions that are undefined in the current project.
Selecting one of these extensions will add the text to the file extension field automatically.
4. Select the “Extension belongs to a new group” option and enter a description, which defines this new file
group.
5. At this stage it is possible to change the associated application. There are four available choices in the
“Open” with drop list. These are listed below:
• Editor
• None
• Other
• Windows default
If the editor is selected, the open file function in the workspace window causes the file to be opened in the
HEW editor. If none is selected then the open operation is disabled when the open file function is
attempted. Selecting “Other” allows you to configure an another tool for the open file operation. See “To
associate an application with a file group” for more details. If the “Windows default” option is selected
then the open file function in the workspace window passes the open file to the Windows operating
system. This then selects the default behavior for this file extension as defined in Windows® Explorer.
6. Click “OK” to add the extension to the “File Extensions” list.
Figure 2.9: Add File Extension Dialog (New Group)
18
If you want to create a new extension because your project uses a different extension from those accepted by the
HEW. For example, a phase might by default use the extension .asm but the HEW only recognizes .src. Then
you need to create a new extension and add it to an existing file group. This process is described below.
To create a new file extension in an existing file group:
1. Select [Project->File Extensions...] from the menu bar. The “File Extensions” dialog will be displayed
(figure 2.7).
2. Click the “Add…” button. The “Add File Extension” dialog will be displayed (figure 2.10).
3. Enter the extension, which you want to define into the “File extension” field. It is not necessary to type
the period ( . ) character. The drop list contains all extensions that are undefined in the current project.
Selecting one of these extensions will add the text to the file extension field automatically.
4. Select the “Extension belongs to an existing group” option and select which group you would like to add
this new extension.
5. Click “OK” to add the extension to the “File Extensions” list.
Figure 2.10: Add File Extension Dialog (Existing Group)
In addition to opening a file with the editor, the “File Extensions” dialog allows you to associate any application
with any file group so that when you double click on a file in the “Projects” tab of the “Workspace” then the
appropriate application is launched with the file. Figure 2.11 shows the association between a word processor
and the extension .DOC.
19
Figure 2.11: File Groups and Applications
To associate an application with a file group:
1. Select the file group to be associated from the “File Extensions” dialog (figure 2.11).
2. Click the “Open with…” button. The “Modify File Extension” dialog will be displayed (figure 2.12).
Figure 2.12: Modify File Extension Dialog
20
3.
Select “None” to remove any association, select “Editor” to open this type of file in the internal/external
editor or select “Other” if you want to open this type of file with a specific application.
If you select “Other” then you can select from any previously defined application from the drop-down list
or specify a new application.
Click “Add…” to define a new application. The “Add Application” dialog will be displayed (figure 2.13).
Enter the name of the tool into the “Name” field. Enter the full path to the tool in the “Command” field
(do not include any parameters). Enter the parameters that are required to open a file in the “Parameters”
field. Be sure to use the $(FULLFILE) placeholder to specify the location file (see appendix C,
“Placeholders”, for more information on placeholders and their uses). Enter the initial directory, in which
you would like the application to run, into the “Initial directory” field. Click “OK” to create the
application.
Figure 2.13: Add Application Dialog
Click “Modify…” to modify an application. The “Modify Application” dialog will be displayed. This
dialog is the same as the “Add Application” dialog described above except that the “Name” field is read
only. Modify the settings as desired and then click “OK”.
4.
Click “OK” to set the application for the selected file group.
21
2.4
Specifying How to Build a File
Once you have added the necessary files to the project the next step is to instruct the HEW on how to build each
file. To do this, you will need to select a menu option from the “Options” menu. The contents of this menu
depend upon which tools you are using.
To set options for a build phase:
1. Select the options menu and find the phase whose options you would like to modify. Select this option.
2. A dialog will be invoked which allows you to specify the options.
3. After making your selections, click “OK” to set them.
To obtain further information, use the context sensitive help button or select the area in which you need
assistance and then press F1.
22
2.5
Build Configurations
The HEW allows you to store all of your build options into a build configuration (figure 2.14). This means that
you can “freeze” all of the options and give them a name. Later on, you can select that configuration and all of
the options for all of the build phases will be restored. These build configurations also allow the user to specify
debugger settings for a build configuration. This means that each configuration can be targeted at a different end
platform. (See Emulator Debugger Part in this manual, for further information).
Figure 2.14 shows three build configurations; “Default”, “MyDebug” and “MyOptimized”. In the first
configuration, “Default”, each of the phases (compile and assemble) are set to their standard settings. In the
second configuration, “MyDebug”, each of the files are being built with debug information switched on. In the
third configuration, “MyOptimized”, each of the files are being built with optimization on full and without any
debug information. The developer of this project can select any of those configurations and build them without
having to return to the options dialogs to set them again.
"Default"
Configuration
"MyDebug"
Configuration
"MyOptimized"
Configuration
Debug: ON
Optimize: OFF
List File: YES
Debug: ON
Optimize: OFF
List File: NO
Debug: OFF
Optimize: ON
List File: NO
Debug: OFF
Optimize: OFF
List File: YES
Debug: ON
Optimize: OFF
List File: NO
Debug: OFF
Optimize: ON
List File: NO
C
Source Files
Assembler
Source Files
C:\MyProject\Default
C:\MyProject\MyDebug
C:\MyProject\MyOptimized
Figure 2.14: Configurations and File Options
23
2.5.1
Selecting a Configuration
The current configuration can be select in two ways:
Either:
1. Select it from the drop down list box (figure 2.15) in the toolbar.
2. The configuration is selected.
Figure 2.15: Toolbar Selection
or:
1. Select [Options->Build Configurations…]. This will invoke the “Build Configurations” Dialog (figure
2.16).
Figure 2.16: Build Configurations Dialog
2. Select the configuration that you want to use from the “Current configuration” drop down list.
3. Click “OK” to set the configuration.
24
2.5.2
Adding and Deleting Configurations
You can add a new configuration by copying settings from another configuration or delete a configuration. These
three tasks are described below.
To add a new configuration:
1. Select [Options->Build Configurations…] to display the “Build Configurations” dialog (figure 2.16).
2. Click the “Add…” button. The “Add Configuration” dialog will be invoked (figure 2.17).
Figure 2.17: Add Configuration Dialog
3. Enter the new configuration name into the “Configuration name” field. As you enter the new
configuration name, the directory underneath changes to reflect the configuration directory that will be
used. Select one of existing configurations, from which you want to copy a configuration, out of the dropdown list of the “Based on configuration” field. Click “OK” on both dialogs to create the new
configuration.
To remove a configuration:
1. Select [Options->Build Configurations…] to display the “Build Configurations” dialog (figure 2.16).
2. Select the configuration that you want to remove and then click the “Remove” button.
3. Click “OK” to close the “Build Configurations” dialog.
25
2.6
Building a Project
The outline of the build process is shown in figure 2.1.
2.6.1
Building a Project
The build option only compiles or assembles those files that have changed since the last build. Additionally, it
will rebuild source files if they depend upon a file that has changed since the last build. For instance, if the file
“test.c” #include’s the file “header.h” and the latter has changed since the last build, the file “test.c” will be
recompiled.
To perform a build:
Select [Build->Build] or click the build toolbar button ( ) or press F7 or click the right mouse button on a
project icon in the “Projects” tab of the “Workspace” window and select [Build] from the pop-up menu.
The build all option compiles and assembles all source files, irrespective of whether they have been modified or
not, and links all of the new object files produced.
To perform a build all:
Select [Build->Build All], or click the build all toolbar button ( ), or click the right mouse button on a
project icon in the “Projects” tab of the “Workspace” window and select [Build All] from the pop-up menu.
2.6.2
Building Individual Files
The High-performance Embedded Workshop lets you build project files individually.
To build an individual file:
1. Select the file which you want to build from the project window.
2. Select [Build->Build File], click the build file toolbar button ( ) or press CTRL+F7 or click the right
mouse button on a file icon in the “Projects” tab of the “Workspace” window and select [Build <file>]
from the pop-up menu.
26
2.6.3
Stopping a Build
The High-performance Embedded Workshop allows you to halt the build process.
To stop a build:
1. Select [Build->Stop Build] or click the stop build toolbar button ( ). The build will be stop after the
current file has been built.
2. Wait until the message “Compiler Finished” appears in the “Output” window before continuing.
To forcibly terminate a current tool
1. Select [Build->Terminate Current Tool]. The HEW will attempt to stop the tool immediately.
Note: Do NOT assume that any output from the tool you terminated is valid. It is recommended that you delete
any output files produced and ensure that the phase is executed again.
2.6.4
Building Multiple Projects
The High-performance Embedded Workshop lets you build multiple projects and configurations at once.
To build multiple projects:
1. Select [Build->Build Multiple]. The figure displayed in figure 2.18.
2. The build multiple gives you the choice of which projects and configurations should be built. To select
which projects and configurations need to be built select the check box next to the project –
configuration combination you want to build. For example, in figure 2.18 if you wanted to build the
entire “hewtest2” project you would check the “hewtest2-Debug” and the “hewtest2-Release” selections
and leave all other check boxes unchecked.
3. When you are happy with your chosen selection click the build button and the HEW will then build the
projects and configurations you have chosen.
4. If you want to build all the projects, which you choose, you click the build all button.
5. Results from the build are displayed in the build window in the same way as the normal build process.
Figure 2.18: Build Multiple Dialog
27
2.6.5
The Output Window
When a tool executes (i.e. compiler, assembler, linker etc.) its output is displayed in the “Output” window. If any
of the tools produce any errors or warnings then they are displayed along with the source file name and the line
number at which the error is located. To quickly locate a specific bug, double click on a given error/warning to
invoke the current editor.
2.6.6
Controlling the Content of the Output Window
It is often useful to display extra information (such as the command line options that are being applied to a file)
during a build. The HEW allows you to specify whether or not you want such options displayed in the “Output”
window during a build, build all or build file operation via the “Tools Options” dialog.
To view or hide extra information during a build:
1. Select [Tools->Options...]. The “Options” dialog will be displayed.
2. Select the “Build” tab (figure 2.19).
3. Set the three check boxes in the “Show” group as follows. “Command line” controls whether the
command line is shown as each tool is executed. “Environment” controls whether the environment is
shown as each tool is executed. “Initial directory” controls whether the current directory is shown as each
tool is executed.
28
Figure 2.19: Options Dialog Build Tab
29
2.6.7
Displaying out of date files in the workspace window
Files updated later than the file generated by the previous build (i.e. out of date files) are marked in the
workspace window. In figure 2.20 below, file "demo.c" is out of date.
When you click build next time this file will be re-built. This is also displayed for dependent projects of the
current project.
The view of these files is updated whenever something that affects the build occurs, e.g. options changing, file
addition, dependencies changing, files modified, etc.
Figure 2.20: Displaying out of date files
To display out of date files in the workspace window:
1. Select [Tools->Options...]. The “Options” dialog will be displayed.
2. Select the “Build” tab (figure 2.19).
3. Check the “Mark out of date files” check box.
4. Click OK.
30
2.7
File Dependencies
A typical project will contain dependencies between files, for example, one C file may “#include” one or more
header files. In complex projects, source files will include (or depend upon) others and this can quickly become
difficult to manage. However, the HEW provides a dependency scanning mechanism whereby all files in a
project are checked for dependencies. Once complete, the project window will display an up-to-date list with all
the project file dependencies.
To update a project’s dependencies:
Select [Build->Update All Dependencies] or click the right mouse button on a project icon in the “Projects”
tab of the “Workspace” window and select [Update All Dependencies] from the pop-up menu.
Initially, the dependencies for all files are contained within the “Dependencies” folder (figure 2.21.i).
2.8
Configuring the Workspace Window
If you click the right mouse button anywhere inside the “Projects” tab of the “Workspace” window, a pop-up
menu will be invoked. Select the “Configure View…” menu option to modify the way in which information is
displayed. The following four sections detail the effect of each option on the “Configure View” dialog.
2.8.1
Show Dependencies under Each File
If you select “Show dependencies under each file”, the dependent files are shown under the including source file
as a flat structure, i.e. the files themselves become folders (figure 2.21.ii). If this option is not selected then a
separate folder contains all dependencies (figure 2.21.i).
Figure 2.21: Dependencies under Each File
31
2.8.2
Show Standard Library Includes
By default, any dependent files found in standard include paths will not be shown (figure 2.22.i). For example, in
C code, if you write an include statement such as “#include <stdio.h>” then stdio.h will not be listed as a
dependent file. To view such system include files, select the “Show standard library includes” option (figure
2.22.ii).
Figure 2.22: Standard Library Includes
2.8.3
Show File Paths
If “Show file paths” is selected, all of the files in the project window are shown with their full path, i.e. from a
drive letter (figure 2.23).
Figure 2.23: File Paths Shown
32
2.8.4
Sort files by time order
When this option is selected the workspace window is then sorted into file time stamp order.
If files are updated after selecting this option, manually update the order of these files.
To manually update the file order:
1. Select “Refresh order” in the pop-up menu on the “Projects” tab of the “Workspace” window.
2.9
Setting the Current Project
A workspace can contain more than one project but only one of the projects can be active at any time. This
active project is the one, which build actions and debug operations can be performed on. It is also possible to
change the builder or debugger options for the project. This active project is shown as bold characters.
To set a project as the current project:
1. Select a non-active project from the “Projects” tab of the “Workspace” window.
2. Click the right mouse button to display the pop-up menu and select the [Set as Current Project] option.
or:
1. Select the project, which you want to make active from the [Project->Set Current Project] sub-menu.
33
2.10
Inserting a Project into a Workspace
When a workspace is created, it contains only one project but, after it is created, you can insert new or existing
projects into a workspace.
To insert a new project into a workspace:
1. Select [Project->Insert Project…]. The “Insert Project” dialog will be displayed (figure 2.24).
2. Set the “New Project” option.
3. Click OK. The “Insert New Project” dialog will be invoked.
4. Enter the name of the new workspace into the “Name” field. This can be up to 32 characters in length and
contain letters, numbers and the underscore character. As you enter the project name the HEW will add a
subdirectory for you automatically. This can be deleted if desired.
5. Click the “Browse…” button to graphically select the directory in which you would like to create the
project. Alternatively, you can type the directory into the “Directory” field manually.
6. The “Project type” list displays all of the available project types (e.g. application, library etc.). Select the
type of project that you want to create from this list.
7. Click “OK” to create the project and insert it into the workspace.
Figure 2.24: Insert Project Dialog
To insert an existing project into a workspace:
1. Select [Project->Insert Project…]. The “Insert Project” dialog will be displayed.
2. Set the “Existing Project” option.
3. Enter the full path of the project database file (.HWP file) into the edit field or click “Browse…” to
search for it graphically.
4. Click “OK” to insert the existing project into the workspace.
34
2.11
Specifying Dependencies between Projects
The projects within a workspace can be dependent upon one another so that when one project is built, all its
dependent projects are built first. This is useful if another project uses one of the others in the workspace. For
example, imagine that a workspace contains two projects. The first project is a library that is included by an
application project. In this case the library must have been built and up to date before the second application can
build correctly. To achieve this situation we can specify the library as a dependent (i.e. child) project of the
application project. This would then allow the library to be built first if it is out-of-date.
When a dependent project is built the HEW attempts to match the configuration in the dependent project with
that of the current project. This means that if the current configuration is “Debug” then the HEW will attempt to
build the “Debug” configuration in the dependent project. If this matched configuration does not exist then the
HEW will use the configuration that was last used in the dependent project.
To make projects depend upon another:
1. Select [Project->Dependent Projects]. The “Dependent Projects” dialog will be displayed.(figure 2.25)
2. Select the project to which you would like to add dependents to. When you do this, the “Dependent
projects” list will display all of the projects in the workspace (excluding the selected project).
3. The “Dependent projects” list has a check box for each project listed. Set the associated check boxes to
make those projects depend upon the selected project.
4. Click “OK” to confirm the new project dependencies.
Figure 2.25: Dependent Projects dialog
35
2.12
Removing a Project from a Workspace
To remove a project from a workspace:
1. Select the project from the “Projects” tab of the “Workspace” window and click the right mouse button to
invoke a pop-up menu.
2. Select the [Remove Project] option.
3. Dialog box is displayed. You confirm to remove the project. In the “Options” dialog box of the “Tools”
menu, you can select this confirmation is performed or not.
Note: You cannot remove the current project from the workspace.
2.13
Loading/unloading a Project into/from a Workspace
To load a project into a workspace:
1. Select the project from the “Projects” tab of the “Workspace” window and click the right mouse button to
invoke a pop-up menu.
2. Select the [Load Project] option.
To unload a project from a workspace:
1. Select a non-active project from the “Projects” tab of the “Workspace” window and click the right mouse
button to invoke a pop-up menu.
2. Select the [Unload Project] option.
Note: You can load or unload plural projects at a time.
36
2.14
Relative projects paths in the workspace
In the High-performance Embedded Workshop when you add a project to the workspace you can choose to add
the project to the workspace using a relative path. This allows you to position a project above the workspace
directory and it will still be relocated correctly if you relocate the HEW workspace. The project is always
relative to the workspace so if the project is one directory above the workspace before it is moved the HEW will
try to find the project in the same relative location after the relocation procedure. This is especially useful if you
are using a project shared between more than one workspace.
In older versions of the HEW this project would not have been relocated and would have still tried to access the
original project path. The older version of the HEW could only relocate the projects, which were in a
subdirectory of the workspace directory. This is still the standard behavior for the High-performance Embedded
Workshop.
To change a projects relative path flag:
1. Select the project in the workspace window.
2. Right click and then select properties.
3. Click the “Project relative file path” checkbox to switch on or off the relative file path feature. (figure
2.26)
4. Click “OK”.
Figure 2.26: Properties Dialog
37
2.15
User folders in the workspace
In the High-performance Embedded Workshop it is possible to add folders to your workspace window. This
allows you to logically group your files into certain areas within a project. The folder can be set to any name and
this is entered in a dialog.
To add a user folder:
1. Select the project on the “Projects” tab of the workspace window.
2. Right click and then add folder.
3. Enter the name and click OK.
4. You can now drag and drop files into this folder to group them logically.
To remove a user folder:
1. Select the folder on the “Projects” tab of the workspace window.
2. Right click and then select Remove folder. Note that the folder must be empty and that the delete key
can also be used instead of the pop-up.
To modify a user folder name:
1. Select the folder on the “Projects” tab of the workspace window.
2. Right click and then select Modify folder name.
3. Enter the new name in the dialog.
4. Click “OK”.
38
3.
Advanced Build Features
This chapter explains the advanced build concepts.
3.1
The Build Process Revisited
Chapter 2, “Build Basics” began by describing the build process in terms of a compiler, an assembler and a
linker (figure 2.1). This will be the case for most installations of the High-performance Embedded Workshop.
However, if you want to begin changing the build process (e.g. adding and removing phases) then it is important
to understand more about the way in which a build functions.
3.1.1
What is a Build?
Building a project means applying a set of tools upon certain input files in order to produce the desired output.
Thus, we apply a compiler upon C/C++ source files in order to create object files, we apply an assembler upon
assembler source files in order to create object files and so forth. At each step or “phase” of the build, we apply a
different tool upon a different set of input files. Figure 3.1 presents another view of the build process.
BEGIN
PHASE 1
Phase 1 Input Files
Phase 1 Output Files
PHASE 2
Phase 2 Input Files
Phase 2 Output Files
PHASE 3
Phase 3 Input Files
Phase 3 Output Files
PHASE X
Phase X Input Files
Phase X Output Files
END
Figure 3.1: Build Process
39
The High-performance Embedded Workshop provides the ability to change this build process via its “Build
Phases” dialog, which can be, accessed via the [Options->Build Phases…] (figure 3.2). On the left-hand side
are the phases that are defined in the current project (Figure 3.2 shows a standard set of build phases). The
remainder of this chapter details the various functions that the “Build Phases” dialog provides.
Figure 3.2: Build Phases Dialog
40
3.2
Creating a Custom Build Phase
If you want to execute another tool before, during or after a standard build process then this can be achieved by
creating your own (i.e. custom) build phase.
Select [Options->Build Phases…] to invoke the “Build Phases” dialog (figure 3.2) and then click the “Add…”
button. This will invoke the new build phase wizard dialog (figure 3.3a).
The first step (as shown in figure 3.3a) asks whether you want to create an entirely new phase or whether you
want to add a system phase. A system phase is a “ready made” phase which is already defined within the
toolchain you are using (e.g. compiler, assembler, linker, librarian, etc.) or a utility phase (e.g. file copy,
complexity analyzer etc.).
The “Add an existing system phase” button is inactive if no more system phases are available. Select the “Create
a new custom phase” button to create your own build phase.
Figure 3.3a: New Build Phase Dialog (Step 1)
41
The second step (figure 3.3b) asks what type of phase you would like to create. There are two choices: multiple
or single. When a multiple phase is executed, the command is applied to each file in the project of a certain file
group. For example, if you set the input file group to be C source files then the command will be executed once
for each C source file in the project. A single phase is executed once at most during a build.
Figure 3.3b: New Build Phase Dialog (Step 2)
The input file group list contains the current file groups defined for the project. It is possible to define multiple
input file groups by selecting the “Multiple Groups…” entry in the input file group list. Selecting this list entry
displays the dialog in figure 3.3c.
Figure 3.3c: Modify multiple input file groups
Once this choice has been made the input file group selection is displayed as “Multiple Groups…” This dialog
allows the user to choose multiple input file groups for the custom phase being added to the project. To select a
file group check the box next to the file groups name. One or more file groups can be selected in this dialog.
42
The third step (figure 3.3d) requests the fundamental information about the new build phase. Enter the name of
the phase into the “Phase name” field. Enter the location of the program file into the “Command” field (do not
insert any command line options as these options are specified via the [Options] menu of the HEW menu bar).
Specify the default options for the phase (i.e. what options you would like new files to take when added to the
project) into the “Default options” field. If you have a preferred directory in which you would like this program
to run from (i.e. where you want the current working directory to be set to before the tool is executed) then enter
it into the “Initial directory” field.
Figure 3.3d: New Build Phase Dialog (Step 3)
43
The fourth and final step (figure 3.3e) allows you to specify any environment variables, which the phase requires.
Figure 3.3e: New Build Phase Dialog (Step 4)
To add a new environment variable click the “Add…” button (the dialog shown in figure 3.4 will be invoked).
Enter the variable name into the “Variable” field and the variable’s value into the “Value” field and then click
“OK” to add the new variable to the list of the fourth step. To modify an environment variables select the
variable in the list and then click the “Modify…” button. Make the required changes to the “Variable” and
“Value” fields and then click “OK” to add the modified variable to the list. To remove environment variables
select the variable that you want to remove from the list and then click the “Remove” button.
Figure 3.4: Environment Variable Dialog
If the tool you are adding can display its output as the tool is running then use the ‘Read Output On Fly’ option.
This will display the tool output as each line of output happens. If this option is set to off then the HEW will
store all output, which is being displayed by the tool, and display it in the output window when the tool has
finished its operation. This can be a problem when the tool is running an operation that might take many
minutes, as it is difficult to see the progress of the current execution.
Note: Using ‘Read Output On Fly’ can cause problems when using certain tools on certain operating systems.
If you are having problems with tools locking up or freezing in HEW then uncheck the ‘Read Output On
Fly’ option.
Click the “Finish” button to create the new phase. By default the new phase is added to the bottom of the “Build
Phase Order” list in the “Build Order” tab of the “Build Phases” dialog (Figure 3.2).
44
3.3
Ordering Build Phases
In a standard build (shown in figure 3.5), you could add a phase at four different positions: before the compiler,
before the assembler, before the linker or after the linker. You may place your own custom phases or move
system phases to any position in the build order. It is important to remember that if the output of your custom
phase can be input into another phase then the phase order must be correct if the build is to behave as intended.
BEGIN
1
COMPILE
2
ASSEMBLE
3
LINK
4
END
Figure 3.5: Typical Build Process
The build phase dialog provides facilities for ordering build phases via the “Build Phases” dialog. It has two tabs,
which are concerned with the ordering of phases: “Build Order” and “Build File Order”. And then you can click
"OK" button.
45
3.3.1
Build Phase Order
The “Build Order” tab (figure 3.6) displays the current order in which phases will be executed when the build
( ) or build all ( ) operation is selected. The check box to the left of each phase indicates whether or not it is
currently enabled. By clicking this box, the phase can be toggled on or off.
Figure 3.6: Build Phases Dialog Build Order Tab
In addition the following operations can be performed:
To remove a phase:
1. Select the phase that you would like to remove.
2. Click the “Remove” button.
3. Click the "Yes" button, if a confirmation dialog box.
To view the properties of a system phase:
1. Select the system phase that you would like to examine.
2. Click the “Modify…” button.
3. System properties are shown as dialog box. Click the “OK” button.
To move a phase:
1. Select the phase that you would like to move.
2. Click the “Move Up” or “Move Down” button.
To import a phase:
1. Click the import button. A dialog is displayed which allows the user to browse to an existing project to
import a custom phase from.
2. Choose the location of the project you wish to import a custom phase from. Once selected a dialog is
displayed which lists the custom phases in the imported project.
3. Once you have decided which phase to import highlight it in the list and then click OK. The phase will
then be added to the build phases dialog at the bottom of the build order.
46
To modify a custom phase:
1. Select the custom phase that you would like to modify.
2. Click the “Modify…” button. The modify phase dialog will be invoked with the “Command” tab selected
(figure 3.7).
3. Change the contents of the fields as appropriate.
4. Set the “Don’t check for input file(s) existence before executing” check box if you don’t want the HEW
to abort the execution of the phase if any of the input files don’t exist.
Set the “Read Output On Fly” check box if you want to display the command output to stdout during
command execution.
Figure 3.7: Modify Phase Dialog Command Tab
5. Select the “Environment” tab (figure 3.8) to edit the environment settings for the phase.
6. Use the “Add…”, “Modify…” and “Remove” buttons to add, modify and remove environment variables.
The operation is the same as discussed in the previous section.
7. Click “OK” when all modifications have been made.
47
Figure 3.8: Modify Phase Dialog Environment Tab
48
3.3.2
Build File Phase Order
If you were to select a C source file from the “Workspace” window and then activate [Build->Build File] (or
press ) you would expect the file to be compiled. Likewise, if you were to select an assembly source file from
the workspace window and then activate [Build->Build File] you would expect the file to be assembled. The
connection between file group and which phase(s) to execute is managed by the “Build File Order” tab of the
“Build Phases” dialog (figure 3.9).
Figure 3.9: Build Phases Dialog Build File Order Tab
The list displays all of the current phases that will be executed when the build file operation is selected upon the
file group shown in the “File group” list box. In figure 3.9 the “C source file” file group is selected and the
“Compiler” and “MyPhase” phases are associated with it.
Entries in the “Phase order” list, of the “Build File Order” tab, are added automatically as new entries are added
to the “Build Order” tab. For example, if you were to add a phase which takes C source files as input then this
phase will be automatically added to the list of phases to execute when a build file operation is applied to a C
source file. If you don’t want a certain phase to execute when [Build->Build File] is selected then clear the
check box to the left of the phase name in the “Phase order” list.
49
3.4
Setting Custom Build Phase Options
Once you have defined a custom phase, you will want to specify the command line options that should be used
when it is executed. Each defined phase has a menu option on the [Options] menu. To specify options for that
phase select it. The dialog that will be invoked depends upon whether the custom phase selected was a multiple
or single phase (according to the selection of phase type in figure 3.3b).
Figure 3.10: Custom Options Dialog
The dialog in figure 3.10 is a custom phase options dialog. The implementation of which is slightly different
depending on whether you are using a multiple or single shot phase. On the left-hand side is the project and file
list. It is possible to select multiple projects and files in the same way as Windows® explorer to modify the
options for more than one selection. On the right-hand side are the 3 options tabs. This is where you set the
options that you want to apply to the selected file(s). You can also choose which configuration information is
being viewed from the configuration list on the upper left of the dialog box. Each configuration is listed along
with a special entry named “Multiple configurations…”. If you select multiple configurations then a dialog is
displayed which allows you to select more than one configuration. This method is used throughout HEW for
modifying multiple configurations at once.
50
3.4.1
Options Tab
The “Options” tab (figure 3.11) allows you to define the command line options that will be passed to the phase.
The “Command” field displays the command, which was entered when you defined the phase (figure 3.3d).
Enter into the “Options” field the command line arguments that you would like to pass to the command. If you
want to insert a placeholder, select the relevant placeholder from the “Placeholder” drop-down list box and then
click the “Insert” button. For a detailed description of placeholders see appendix C, “Placeholders”.
Figure 3.11: Custom Options Options Tab
3.4.2
Output Files Tab
The “Output Files” tab (figure 3.12) is where you can specify the output file or files that will be produced by the
phase. Before each file is passed into this phase, the HEW checks that the output files are of a less recent date
than the input file. If so, the phase will be executed for that file (i.e. input files have been modified since the
output file or files were last produced). If the files are up to date then the phase will not be executed.
Note: If no output files are specified, the phase will execute regardless.
51
Figure 3.12: Custom Options Output Files Tab
To add an output file:
1. Click “Add…”. The “Add Output File” dialog will be invoked (figure 3.13).
2. Enter the file path or browse to it using the “Browse…” button.
3. Click “OK” to add this output file to the list.
Figure 3.13: Add Output File Dialog
To modify an output file:
1. Select the output file that you would like to modify.
2. Click “Modify…”. The “Modify Output File” dialog, which is the same as figure 3.13 except the title,
will be invoked.
3. Modify the fields as required and then click the “OK” button to add the modified entry back to the list.
To remove an output file:
1. Select the output file that you would like to remove.
2. Click the “Remove” button.
52
3.4.3
Dependent Files Tab
The “Dependent Files” tab (figure 3.14) is where you can specify the dependent files that are needed by the
phase. Before each file is passed into this phase, the HEW checks that the dependent files are of a more recent
date than the input file. If so, the phase will be executed for that file (i.e. dependent files have been modified
since the input file or files were last modified). If not, the phase is not executed for the files.
Figure 3.14: Dependent Files Tab in Custom Options
53
To add a dependent file:
1. Click “Add…”. The “Add Dependent File” dialog will be invoked (figure 3.15).
2. Enter the file path or browse to it using the “Browse…” button.
3. Click “OK” to add this output file to the list.
Figure 3.15: Add Dependent File Dialog
To modify a dependent file:
1. Select the dependent file that you would like to modify.
2. Click “Modify…”. The “Modify Dependent File” dialog, which is the same as figure 3.15 except the title,
will be invoked.
3. Modify the fields as required and then click the “OK” button to add the modified entry back to the list.
To remove a dependent file:
1. Select the dependent file that you would like to remove.
2. Click the “Remove” button.
54
3.5
File Mappings
By default, the files input to a phase are only taken from the project, i.e. all project files of the type specified in
the “Select input file group” drop-down list on the “New Build Phase” dialog (figure 3.3b). If you would like a
phase to take files output from a previous phase (i.e. intermediate files) then you must define this in the “File
Mappings” tab of the “Build Phases” dialog (figure 3.16).
Figure 3.16: Build Phases Dialog File Mappings Tab
55
A file mapping states that you would like the HEW to pass output files of a certain type produced by one phase
(referred to as the source phase) to another phase (referred to as the destination phase). Such intermediate files
are passed in addition to the project files.
To add a file mapping:
1. Click “Add…”. The “Define File Mapping” dialog will be invoked (figure 3.17).
2. Select the file group, which you want to pass between the phases from the “File group” drop-down list
box.
3. Select the source phase (i.e. which phase generates the files) from the “Source phase” drop-down list box.
4. Select the destination phase (i.e. which phase takes these files) from the “Destination phase” drop-down
list box.
5. Click “OK” to create the new mapping.
Figure 3.17: Define File Mapping Dialog
To modify a file mapping:
1. Select the mapping to be modified.
2. Click “Modify…” button. The “Define File Mapping” dialog will be invoked (figure 3.17).
3. Modify the options as necessary.
4. Click “OK” to commit the changes.
56
3.6
Controlling the Build
By default, the High-performance Embedded Workshop will execute all of the phases in a build and only stop if
a fatal error is encountered. You can change this behavior by setting the controls on the “Build” tab of the
“Options” dialog (figure 3.18).
Figure 3.18: Options Dialog Build Tab
Select [Tools->Options…] to invoke the dialog. If you want to stop the build when a certain number of errors
are exceeded then set the “Stop build if the no. of errors exceed” check box and then specify the error count limit
in the edit field to the right. If you want to stop the build when a certain number of warnings are exceeded then
set the “Stop build if the no. of warnings exceed” check box and then specify the warning count limit in the edit
field to the right.
Note: Irrespective of what these controls are set to, the build will always halt if a fatal error is encountered.
In addition to specifying error and warning count limits, the “Build” tab also allows you to request that the
command line, environment and initial directory of each execution should be displayed. Check the appropriate
check boxes as necessary.
57
3.7
Logging Build Output
If you would like to write the results of each build to file then invoke the “Customize” dialog by selecting [Tools
-> Customize…] and select the “Log” tab (figure 3.19). Set the “Generate log file” check box and then enter the
full path of the log file into the “Path” field or browse to it graphically by clicking the “Browse…” button.
Figure 3.19: Tools Customize Dialog Log Tab
58
3.8
Changing Toolchain Version
If two or more versions of the same toolchain are registered in the HEW, you can choose a version of the
toolchain on the “Change Toolchain Version” dialog shown in Figure . To invoke the dialog, select [Tools>Change Toolchain Version…]. Choose one of the versions from the “Toolchain versions” drop-down list and
click the “OK” button to enforce your choice.
Figure 3.20: Change Toolchain Version Dialog
To show information of toolchain components select a tool from the “Toolchain build phases” list on the
“Change Toolchain Version” dialog and click the “Information…” button. Then a tool information dialog (figure
3.21) will show you the information of the tool. Click the “Close” button to close the dialog.
Figure 3.21: Toolchain Information Dialog
59
3.9
Using an External Debugger
The High-performance Embedded Workshop can launch an external debugger tool. If you want to use another
debugger then you must add it to the Tools menu.
The “Debugger” tab of the “Customize” dialog (figure 3.22a, figure 3.22b, figure 3.22c) is where the external
debugger related information is configured. You may wish to use an older version of the debugger if certain
targets are not currently supported in the new environment. Invoke it by selecting [Tools->Customize…] and
then selecting the “Debugger” tab.
The first choice to make is which debug tool you would like to use from the “External debugger selected” dropdown list.
“Hitachi Debugger Interface (version 4.x or greater)”: Use the HDI
“Mitsubishi PD debugger”: Use the PD debugger
“Other external debugger”: Use the other debugger
“Non selected”: Not use the external debugger
Once this has been selected the external debugger must be configured.
To use the HDI:
1. Sets the location of the HDI executable. This must be version HDI 4.0 or greater, otherwise its behavior
is not guaranteed.
2. Sets the location of the session file. This tells the HDI which session to load when it is launched.
3. Sets the location of the download module.
Figure 3.22a: External debugger selected – HDI
60
To use the PD debugger:
1. Sets the location of the PD debugger executable.
2. Sets the location of the PD profile file. This tells the PD debugger which session to load when it is
launched.
3. Sets the command line option. This field allows additional options to be specified which can modify the
behavior of the external debugger.
4. Sets the location of the download module.
Figure 3.22b: External debugger selected – PD debugger
61
To use the other external debugger except on the HDI or the PD debugger:
1. Sets the location of the external debugger executable.
2. Sets the command line option. This field allows additional options to be specified which can modify the
behavior of the external debugger.
3. Sets the location of the download module.
Figure 3.22c: External debugger selected – External debugger except on the HDI or the PD debugger
Click the “Launch External Debugger” toolbar button to invoke the external debugger:
After a build, if the download module has been updated, the HEW will switch back to the debugger to enable
immediate debugging. Whilst using the debugger, double clicking in any source window will switch back to the
HEW with the source file open at the line, which was double clicked. This operation is not possible with the
“Other external debugger”.
62
3.10
Generating a Makefile
The HEW allows you to generate a makefile, which can be used to build parts of your workspace without HEW.
This is particularly useful of you want to send a project to a user who does not have the HEW or if you want to
version control an entire build, including the make components.
This version of HEW also supports the integration of the generated makefile and tools into the HEW framework.
This allows you to click build menu or toolbar button and then launch the makefile rather than the normal
internal HEW build process. For further information, refer to the “Using a makefile inside the HEW system”
section later in this chapter.
To generate a makefile:
1. Ensure that the project, which you want to generate a makefile for, is the current project.
2. Ensure that the build configuration that you want to build the project with is the current configuration.
3. Select [Build->Generate Makefile…].
4. Select the radio button, which is relevant for your makefile. (See figure 3.23.)
5. Ensure you have selected the correct makefile format. HEW is capable of generating GNUMake,
HMake and NMake compatible files.
6. The use static sub-command files check box will generate separate command files in the make
destination directory. This is different to the normal style where the sub-command files are generated by
the make tool. In the case of the GNUMake file format this must be switched on.
7. Checking “Scan dependencies whilst building makefile” will force a dependency scan to ensure the
makefile creation is up to date.
8. Click “OK”.
Figure 3.23: Generate Makefile Dialog
63
The HEW will create a subdirectory “make” within the current workspace directory and then generate the
makefile into it. It is named after the selection, with a .mak extension for example the current project and
configuration (e.g. project_debug.mak). The executable HMAKE.EXE, located in the HEW installation directory,
is provided for you to execute the makefiles generated by the HEW. It is not intended to execute makefiles,
which have been user modified. For further details on HMAKE, refer to Appendix F, “HMAKE User Guide”.
To execute a makefile:
1. Open a command window and change to the “make” directory where the makefile was generated.
2. Execute HMAKE. Its command line is HMAKE.EXE <makefile>.
Note: The degree portability of a generated makefile is entirely dependent upon how portable the project itself
is. For example, any compiler options, which include full paths to an output directory or include file
directory, will mean that, when given to another user with a different installation, the build will probably
fail. In general use placeholders wherever possible – using a full, specific path should be avoided when
possible.
64
3.11
Using a makefile inside the HEW system
The HEW also allows you to configure the internal build to use a particular make file rather than the internal
HEW system when build is clicked.
The standard HEW integrated build should be fine for all of your building requirements. However in some cases
you may feel the need to use makefiles rather than relying on the HEW internal make system. The techniques to
do this are described below:
1.
2.
3.
4.
5.
6.
To set-up the internal makefile execution:
Create a base HEW workspace in which to launch your makefile in. It makes sense if this is the same
toolchain as the one to be used in your makefile. Although this is not essential.
Click on [Tools->Options].
Click the build tab (figure 3.24).
Select the makefile command, which should be used. By default this is set to the Renesas make tool
shipped with HEW. This is called HMAKE.exe and is located in the HEW installation directory
"$(HEWDIR)".
Click the "Use makefile build system" check box. This tells the HEW that when the build button is
clicked that makefile should be executed rather than the internal build.
Setup the makefile path. This defaults to the location, which HEW will generate makefiles to. This
item is configuration based so you can have a different makefile for each configuration.
Note:
You do not need to use a makefile generated by HEW. It can be any format as long as your make tool
supports it.
7.
8.
9.
Setup the makefile options. HMAKE allows the user to specify project or configuration selection
options so that different builds can be launched from the same file. Again this item is configuration
based so you can have a different makefile options for each configuration. For further details on
HMAKE, refer to Appendix F, "HMAKE User Guide", "F.1.3 Parameters".
The final option is the generate make file before build. This will launch the default make file creation
utility before the makefile is executed. This means the makefile will always be up to date with the
HEW project system.
Click OK to save the changes.
65
Figure 3.24: Option Dialog Build tab
Once this system is setup the build button, menu and keyboard shortcuts are linked to the makefile tool
execution. All output is directed to the output window as in the case of the normal build. If you are using a
toolchain supported by HEW errors and warnings can be double-clicked to jump to the source files. The help
link should also be supported. Note when using the HMAKE.exe system the build all button will pass a
command to HMAKE to force a re-build all operation. When using GNUMake this is not supported.
66
3.12
Customizing the HEW linkage order
Object module are linked as alphabetical order in HEW default. You can specify the linkage order, if you wish to.
To switch on manual linkage order facilities:
1. Click the [Build->Linkage Order...] menu item.
2. On the dialog displayed click the Use custom linkage order check box (figure 3.25).
3. Then you can move the objects into whichever order you need. Simply select the module and click the
up and down buttons to position it in the desired location.
4. Each module has a different icon depending on where it originated.
5. Click OK to verify and save the settings.
Figure 3.25: Linkage order Dialog
When you are using multiple configurations it is likely that the linkage order will be very similar. To do this
effectively you can copy the current settings in the dialog to other configurations. This is described below:
To copy the linkage order from one configuration to another:
1. Click the [Build->Linkage order...] menu item.
2. Select the configuration you wish to copy in the current configuration list. This defaults to the currently
loaded configuration.
3. Click the Copy to... button this displays a dialog and asks you which one of the configurations in the
current project you wish to copy the current linkage order to. Select a configuration and click OK.
4. Click OK to verify and save the changes.
67
68
4.
Using the Editor
This chapter describes how to use the editor that is provided with the High-performance Embedded Workshop.
4.1
The Editor Window
The editor window (figure 4.1) contains the file windows that are being viewed or edited. Only one window is
active at anytime. This window is called the active window (or current window) and its title bar will appear a
different color from that of the others (“dbsct.c” is the active window in figure 4.1). All text operations such as
typing, pasting text and so forth only affect the active window. To switch to another source file window (i.e. to
make some other window the active window) there are a number of methods:
•
Click on it if it is visible.
•
Press CTRL+TAB to cycle through the windows one after another.
•
Select the window by name from the “Window” menu.
•
Select its tab at the bottom of the editor window.
When a file has been edited, an asterisk (*) is appended to the window’s title bar. The asterisk remains there
until the file is saved. The asterisk is also removed if all of the edited changes are undone in the current window.
Figure 4.1: Editor Window
69
4.2
Working with Multiple Files
The file area is where you will work with the files of your project. The editor allows you to have many files open
at one time, to switch between them, to arrange them in different configurations and to edit them in whichever
order you want to. The operations that you can perform upon the windows are typical of most Windows®
applications and they can be found under the [Window] menu:
• [Window->Cascade]
Arrange all open windows so that they overlap, with the top left of each window visible.
• [Window->Tile Horizontally]
Arrange all open windows in sequence (horizontally) so that they occupy the entire editor window with no
overlapping edges.
• [Window->Tile Vertically]
Arrange all open windows in sequence (vertically) so that they occupy the entire editor window with no
overlapping edges.
• [Window->Arrange Icons]
Line up all minimized windows at the bottom of the editor window.
• [Window->Close All]
Close all open editor windows.
The files within the editor can be displayed in a “notebook” style. This means that each file has a separate tab
associated with it to aid in navigating between files.
To show files in notebook:
1. Select [Tools->Options…]. The “Tools Options” dialog box will be displayed. Select the “Editor” tab.
2. Set the “Show files in notebook” check box as appropriate.
3. Click “OK” for the new settings to take effect.
4.2.1
The Editor Toolbars
The editor has four related toolbars: Editor, Search, Bookmarks and Templates. They provide a shortcut to the
functions of the editor, which you will use most often. The following sections describe each buttons function.
4.2.2
Editor Toolbar Buttons
New File
The new file button creates a new source file window with a default name. When you save the file, you can
specify your own filename.
Open File
Click this button if you want to open a file. It invokes a standard file chooser - select the file which you want to
open and then click “Open”.
70
Save File
Saves the active source file.
Save All Files
Saves all of the files in the editor.
Print File
To print the contents of the current window, click this button.
Cut
Clicking this button will remove the current text selection and place a copy of it onto the Windows® clipboard
(it can be pasted back to a file with a paste operation).
Copy
This button allows you to copy the current text selection into the Windows® clipboard.
Paste
The paste button copies the contents of the clipboard into the active window at the position of the insertion
cursor.
Match Braces
The match braces button highlights text between braces of type { }, [ ] and ( ). This is particularly useful when
attempting to find out the structure of C/C++ code blocks which are opened with { and closed with }. To use it,
select the open brace to match from, or place the cursor before it, and then click this button. For further
information on brace matching, refer to the “Brace Matching” section later in this chapter.
Insert Template
To insert a pre-defined template at the current cursor position, click this toolbar button. The “Insert Template”
dialog box will be invoked. Select a template name and then click OK. For further information on templates,
refer to the “Templates” section later in this chapter.
Toggle Bookmark
The High-performance Embedded Workshop editor provides standard bookmark capabilities. To set a bookmark,
select the line to mark and click this button (a green mark will then appear in the blank on the left side of the
editor window). To remove a bookmark, select the line to remove a bookmark and click this button (the mark in
the blank on the left side of the editor window will disappear). For further information on bookmarks, refer to the
“Bookmarks” section later in this chapter.
71
4.2.3
Search Toolbar Buttons
Find in Files
To search several files for a text string then click this button. All find results are displayed in the “Find in Files”
tab of the “Output” window. For further information, refer to the “Searching and Navigating Through Files”
section later in this chapter.
Find
Click this button if you want to find a certain text string in the current file. It invokes a find dialog box where
you can specify the search parameters.
Find Next
Finds the next occurrence of the current search string.
Find Previous
Finds the previous occurrence of the current search string.
4.2.4
Bookmarks Toolbar Buttons
Toggle Bookmarks
Sets a bookmark at the current line or clears a bookmark at the current line.
Next Bookmark
Jumps to the next bookmark in the current file from the current line.
Previous Bookmark
Jumps to the previous bookmark in the current file from the current line.
Clear All Bookmarks
Clears all bookmarks in the current file.
4.2.5
Templates Toolbar Buttons
Define Template
Specify template text for subsequent insertion.
Insert Template
Insert the template selected in the drop-down list at the current cursor position.
72
4.3
Standard File Operations
4.3.1
Creating a New File
To create a new editing window:
Select [File->New] or click the new file toolbar button (
) or press CTRL+N.
The window will be given an arbitrary name by default. You can provide a new name when you save the file.
4.3.2
Saving a File
To save the contents of an editing window:
1. Ensure that the window, whose contents you want to save, is the active window.
2. Select [File->Save] or click the save file toolbar button ( ) or press CTRL+S.
3. If the file has not been saved before, a file save dialog box will be displayed. Enter a filename, specify a
directory and then click OK to create the file with the name given, in the directory specified.
4. If the file has been saved before, then the file will be updated (no dialog box will be displayed).
To save the contents of an editing window under a new name:
1. Ensure that the window, whose contents you want to save, is the active window.
2. Select [File->Save As...].
3. A file save dialog box will be displayed. Enter a filename, specify a directory and then click OK to create
the file with the name given, in the directory specified.
4.3.3
Saving all Files
To save the contents of every open editor window:
1. Select [File->Save All] or click the save all files toolbar button ( ).
2. If any of the files has not been saved before, a file save dialog box will be displayed. Enter a filename,
specify a directory and then click OK to create the file with the name given, in the directory specified.
3. If any of the files have been saved before, then the file will be updated (no dialog box will be displayed).
73
4.3.4
Opening a File
To open a file:
1. Select [File->Open...] or click the open file toolbar button ( ) or press CTRL+O.
2. An open file dialog box will be displayed. Use the directory browser (on the right) to navigate to the
directory in which the file you want to open is located. Use the “Files of type” combo box to select the
type of file you want to open (or set it to “All Files (*.*)” to see every file in a directory).
3. Once you have located the file select it and click “Open”.
The High-performance Embedded Workshop keeps track of the last four files that you have opened and adds
them to the file menu under the “Recent Files” sub-menu. This gives you a shortcut to opening files which you
have used recently.
To open a recently used file:
Select the [File->Recent Files] menu option and from this sub-menu select the desired file.
You can also open a file via the “Projects” tab of the “Workspace” window. Either double click the file you want
to open or select it, click the right mouse button (to invoke a pop-up menu) and then choose the [Open <file>]
menu option (where <file> is the name of the file selected).
4.3.5
Closing Files
To close individual files select one of the following methods:
1. Double click on the editor window’s system menu (located at the top left of each window when not
maximized).
2. Click on the editor window’s system menu (located at the top left of each window when not maximized)
and select the “Close” menu option.
3. Ensure that the window that you want to close is the active window and then press CTRL+F4.
4. Ensure that the window that you want to close is the active window and then select [File->Close].
5. Click on the close button (located at the top right of each window when not maximized).
To close all windows at once:
Select [Window->Close All].
74
4.4
Editing a File
The High-performance Embedded Workshop editor supports standard editing functionality. This is available
through the usual methods (i.e. the menu, toolbar and keyboard shortcuts) and is additionally supported via a
pop-up menu (or local menu) that is local to each editor window. To invoke it, place the pointer in an open
window and click the right mouse button. Table 4.1 outlines the basic operations that are provided by the editor.
Table 4.1
Basic Editing Operations
Operation
Effect
Action
Cut
Removes highlighted text and places it on the Click the cut toolbar button
Windows® clipboard
Select [Edit->Cut]
Select [Cut] - local menu
Press CTRL+X
Copy
Places a copy of the highlighted text into the
Windows® clipboard
Click the copy toolbar button
Select [Edit->Copy]
Select [Copy] - local menu
Press CTRL+C
Paste
Copies the contents of the Windows®
clipboard into the active window at the
position of the insertion cursor
Click the paste toolbar button
Select [Edit->Paste]
Select [Paste] - local menu
Press CTRL+V
Delete
Removes highlighted text (it is not copied to
the Windows® clipboard)
Select [Edit->Clear]
Select [Clear] - local menu
Press Delete
Select All
Selects (i.e. highlights) the entire contents of
the active window
Select [Edit->Select All]
Undo
Reverses the last editing operation
Select [Edit->Undo]
Select [Select All] - local menu
Select [Undo] - local menu
Press CTRL+Z
Redo
Repeats the last “undone” editing operation
Select [Edit->Redo]
Select [Redo] - local menu
Press CTRL+Y
75
4.5
Searching and Navigating through Files
The High-performance Embedded Workshop editor provides find, replace and file navigation functionality. The
following three sections detail how to use these features.
4.5.1
Finding Text
To search for text in the current file:
1. Ensure that the window, whose contents you want to search, is the active window.
2. Position the insertion cursor at the point from which you want to start your search.
3. Select [Edit->Find...], press CTRL+F, select [Find...] from the editor window’s local menu or click the
find toolbar button ( ). The “Find” dialog box will be displayed (figure 4.2).
Figure 4.2: Find Dialog
4. Enter the text that you want to search for into the “Find what” field, or select a previous search string
from the drop-down list box. If you select text before invoking the find operation, the selected text will be
automatically placed into the “Find what” field.
5. If you would like to search for character string as a whole word then check the “Match whole word only”
check box. When this option is not selected, the search will be for any string that is matched by the search
string.
6. If you would like your search to be case sensitive (i.e. to distinguish between upper and lower case
letters) then check the “Match case” check box.
7. If your search string uses regular expressions then check the “Regular expressions” check box. Refer to
Appendix B, “Regular Expressions” for further information.
8. The “Direction” radio buttons allow you to select the direction of the search. Selecting “Down” means
that the search will be performed from the insertion cursor towards the bottom of the file. Selecting “Up”
means that the search will be performed from the insertion cursor towards the top of the file.
9. Click the “Find Next” button to begin the search. Click “Cancel” to stop the find action.
The High-performance Embedded Workshop editor also allows you to search for a string across many files.
76
4.5.2
Finding Text in Multiple Files
To search for text in many files:
1. Select [Edit->Find in Files...], select [Find in Files...] from the editor window’s local menu or click the
find in files toolbar button ( ). The “Find in Files” dialog box will be displayed (figure 4.3).
Figure 4.3: Find in Files Dialog
2. Enter the text that you want to search for into the “Find” field, or select a previous search string from the
drop-down list box. If you select text before invoking the find operation, the selected text will be
automatically placed into the “Find” field.
3. Enter the file extensions of the files you would like to search into the “In files/types” field. If several
extensions are specified be sure to separate them with a semicolon (e.g. *.c;*.h).
4. Enter the directory in which you would like to search files into the “Directory” field. Alternatively you
may browse to the desired directory graphically if you click the “Browse…” button.
5. If you would like to search the directory specified and all directories below it then check the “Search sub
directories” check box. If you just want to search the single directory specified in the “Directory” field
then ensure that this check box is not checked.
6. If you would like to search for character string as a whole word then check the “Match case” check box.
When this option is not selected, the search will be for any string that is matched by the search string.
7. If you would like your search to be case sensitive (i.e. to distinguish between upper and lower case
letters) then check the “Match case” check box.
8. Click “Find” to begin the search. Any matches found will be displayed in the “Find in Files” tab of the
“Output” window. To jump to an instance of the string, double click on the desired entry in the “Output”
window.
77
4.5.3
Replacing Text
Replacing text is similar to finding text, as discussed in the previous section. The difference is that when the text
is found you have the option to replace it with other text.
To replace text in a file:
1. Ensure that the window, whose contents you want to replace, is the active window.
2. Position the insertion cursor at the point from which you want to start your search.
3. Select [Edit->Replace...], press CTRL+H or select [Replace...] from the editor window’s local menu. A
replace dialog box will be displayed (figure 4.4).
4. Enter the text that you want to search for into the “Find what” field, or select a previous search string
from the drop-down list box. If you select text before invoking the replace operation, the selected text will
be automatically placed into the “Find what” field.
5. Enter the text that you want to replace the search string with into the “Replace with” field, or select a
previous replace string from the drop-down list box.
Figure 4.4: Replace Dialog
6. If you would like to search for character string as a whole word then check the “Match whole word only”
check box. When this option is not selected, the search will be for any string that is matched by the search
string.
7. If you would like your search to be case sensitive (i.e. to distinguish between upper and lower case
letters) then check the “Match case” check box.
8. If your search string uses regular expressions then check the “Regular expressions” check box. Refer to
appendix B, “Regular Expressions” for further information.
9. If you clicked “Find Next”, the editor will search for the first occurrence of the search string. Click
“Replace” if you want to replace it. Click “Replace All” to replace all occurrences or click “Cancel” to
stop the replace action. If you select “Selection” in “Replace In”, selected range of the text is replaced. If
you select “whole file”, the whole files are replaced. If you select all open files, all files that are
currently open in the editor have the replace operation carried out on them.
78
4.5.4
Jumping to a Specified Line
To jump to a line in a file:
1. Ensure that the window, whose contents you want to replace, is the active window.
2. Select [Edit->Goto Line...], press CTRL+G. or select [Goto Line...] from the editor window’s local
menu. A goto line dialog box will be displayed (figure 4.5).
3. Enter into the dialog box the number of the line that you want to go to, and then click “OK”.
4. The insertion cursor will be placed at the start of the line number specified.
Figure 4.5: Goto Dialog
79
4.6
Bookmarks
When working with many large files at a time, it can become difficult to locate specific lines or areas of interest.
Bookmarks enable you to specify lines that you want to jump back to at a subsequent time. One example of its
use is in a large C file where you may want to set a bookmark on each function definition. Once a bookmark has
been set, it exists until it is removed or the file is closed.
To set a bookmark:
1. Place the insertion cursor on the line to mark.
2. Select [Edit->Bookmarks->Toggle Bookmark], press CTRL+F2, select [Bookmarks
->Toggle Bookmark] from the local menu or click the toggle bookmark toolbar button (
).
3. A green mark appears in the blank on the left side of the line to indicate the presence of an active
bookmark.
To remove a bookmark:
1. Place the insertion cursor on the marked line.
2. Select [Edit->Bookmarks->Toggle Bookmark], press CTRL+F2, select [Bookmarks
->Toggle Bookmark] from the local menu or click the toggle bookmark toolbar button (
3. The mark will be removed and the line will return to normal text.
To jump to the next bookmark in a file:
1. Ensure that the insertion cursor is somewhere within the file to be searched.
).
2. Select [Edit->Bookmarks->Next Bookmark], press F2 or select [Bookmarks->Next Bookmark] from
the local menu or click the next bookmark toolbar button (
).
To jump to the previous bookmark in a file:
1. Ensure that the insertion cursor is somewhere within the file to be searched.
2. Select [Edit->Bookmarks->Previous Bookmark], press SHIFT+F2 or select [Bookmarks->Previous
Bookmark] from the local menu or click the previous bookmark toolbar button (
).
To remove all bookmarks in a file:
1. Ensure that the window, whose bookmarks you want to remove is the active window.
2. Select [Edit->Bookmarks->Clear All Bookmarks] or select [Bookmarks->Clear All Bookmarks]
from the local menu or click the clear all bookmarks toolbar button (
).
4.7
Printing a File
To print a file:
1. Ensure that the window, whose contents you want to print, is the active window.
2. Select [File->Print...], or click the print toolbar button ( ) or press CTRL+P.
80
4.8
Configuring Text Layout
The following sections detail how to set-up the layout of the text within the editor windows.
4.8.1
Page Set-up
When you print a file from the High-performance Embedded Workshop editor, the settings in the print dialog
box affect the way in which the file is printed (e.g. double or single sided). Control over how the text is
formatted on the page can also be controlled via the page set-up option. This allows you to specify the margins
(top, bottom, left and right) of your printouts. It is often necessary to set this because some printers cannot print
to the edges of an A4 page. Furthermore, some users have their own layout requirements (e.g. a large left hand
margin so that code can be placed in an A4 binder).
To set-up the page margins:
1. Select [File->Page Setup...]. The “Page Setup” dialog will be invoked (figure 4.6).
2. Enter into the edit fields the margins required (set the “inch” or “mm” radio buttons to set the
measurements).
3. Click “OK” for the new settings to take effect.
Figure 4.6: Page Setup Dialog
81
To set-up the page header and footers:
1. Select [File->Page Setup...]. The “Page Setup” dialog will be invoked (figure 4.6).
2. Enter into the header and footer edit fields the text required to be displayed. All normal placeholders are
available along with page numbering, text justification and date fields. These are all expanded before
the page is to be printed.
3. Click “OK” for the new settings to take effect.
To set-up print wrapping
1. Select [File->Page Setup...]. The “Page Setup” dialog will be invoked (figure 4.6).
2. Click the wrap text check box. This switches on the wrap text facility when printing so no text is
truncated and everything is visible.
3. Click “OK” for the new settings to take effect.
82
4.8.2
Changing Tabs
To change tab size:
1. Select [Tools->Options...]. The “Options” dialog will be displayed. Select the “Editor” tab (figure 4.7)).
2. Enter into the “Tab size” field the number of desired tabs.
3. Click “OK” for the tab setting specified to take effect.
Figure 4.7: Options Dialog Editor Tab
When a TAB key is pressed in the editor a tab character is usually stored in the file. However, sometimes it is
preferable to store spaces instead. The representation of tab characters can be controlled via the “Options” dialog.
To use spaces as tabs:
1. Select [Tools->Options...]. The “Options” dialog will be displayed. Select the “Editor” tab (figure 4.7).
2. Set the “Use spaces as tabs” check box as appropriate.
3. Click “OK” for the tab setting specified to take effect.
83
4.8.3
Auto Indentation
When you press return in a standard editor the insertion cursor will move to the next line down, at the first
column (i.e. against the left hand side of a window). Auto Indentation is a feature which, when return is pressed,
places the insertion cursor on the next line (as before) but under the first non-white space character of the
previous line. This enables you to type neat C/C++ or assembler code faster as you don’t have to type leading
spaces or tabs yourself.
Figure 4.8 illustrates two examples. The first (i) shows the effect of pressing return when the auto indentation
feature is disabled - the insertion cursor returns to the left-hand side of the window on the next line. When the
line “int z=20” is typed, it is not aligned with the previous two lines. The second example (ii) shows the effect of
pressing return when auto indentation is enabled - the insertion cursor drops underneath the “i” of the previous
line. Now, when the line “int z=20” is typed, it is automatically aligned (i.e. automatically indented).
Figure 4.8: Effect of Auto Indentation
To enable/disable Auto Indentation:
1. Select [Tools->Options...]. The “Options” dialog will be displayed. Select the “Editor” tab (figure 4.7).
2. Set the “Enable auto indentation” check box accordingly.
3. Click “OK” for the setting of the auto indentation check box to take effect.
84
4.9
Splitting a Window
The High-performance Embedded Workshop editor allows you to split a text window into two. Figure 4.9 shows
the split bar button which is located just underneath the maximize button at the top right hand corner of any text
window.
Figure 4.9: Split Bar Button
To split a window:
Double click on the split bar button to split the window in half or click on the split bar button, keep the button
pressed, move the mouse down and then release the mouse button at the point you want to split the window.
To adjust the position of the split bar:
Click on the split bar itself, keep the button pressed then move the bar to the new position and then release
the button.
To remove the split bar:
Double click on the split bar or move the split bar to the top or bottom of the window.
85
4.10
Configuring Text
The following sections detail how to change the appearance of the text displayed in the editor windows.
4.10.1
Changing the Editor Font
The High-performance Embedded Workshop allows you to specify the font to be used in its internal editor. All
editor windows, regardless of the file type, use the same font.
To change the editor font:
1. Select [Tools->Format Views...]. The “Format Views” dialog will be displayed. Select the Source icon
in the tree (figure 4.10).
2. Select the desired font from the “Font” list.
3. Select the size of the font from the “Size” list.
4. Click “OK” to confirm the new editor settings.
Figure 4.10: Format Views Dialog Font Tab
86
4.11
Syntax Coloring
To enhance code readability, the HEW editor can display specific strings (i.e. keywords) in different colors. For
instance, C source code comments could be shown in green and C types (e.g. int) could be shown in blue.
The coloring method used can be specified on a file group by file group basis. For example, you can define
different color schemes for a C source files, text files, map files or even your own files.
To change existing colors:
1. Select [Tools->Format Views...]. The “Format Views” dialog will be displayed.
2. Select the item underneath the icon in the tree you wish to modify the colour for. This should be the file
type (e.g. C source file) and correct keyword group (e.g. identifier or pre-processor).
3. Select the “Colour” tab.
4. Modify the “Foreground” and “Background” color lists as desired. The color “SYSTEM” refers to the
current window foreground and background settings in control panel.
5. Click “OK” for the new colors to take effect.
To create new keyword groups:
1. Select [Tools->Format Views...]. The “Format Views” dialog will be displayed.
2. Select the file type in the tree to which you wish to add the new keyword group.
3. Click “Add…” underneath the tree. The “Add Category” dialog box will be displayed (figure 4.11). Enter
the name of the keyword group in the “Category Title” field, then click “OK” to create the new keyword
group.
Figure 4.11: Add Category Dialog
To create new keywords:
1. Select [Tools->Format Views...]. The “Format Views” dialog will be displayed.
2. Select the item underneath the source view icon in the tree you wish to modify the syntax highlighting
for. This should be the file type (e.g. C source file) and correct keyword group (e.g. identifier or preprocessor).
3. Select the “Keywords” tab (figure 4.12).
87
Figure 4.12: Format Views Dialog Keywords Tab
4. Click the “Add…” button to add a keyword. Then the “Add Keyword” dialog (figure 4.13) will be
launched. Specify a keyword in the “Keyword” field and click “OK” to close the dialog. To remove a
keyword, select the keyword and click the “Remove” button.
Figure 4.13: Add Keyword Dialog
When you create a new file, syntax coloring will not be active as a new file does not initially have an extension
(new files are named arbitrarily by the editor without an extension). In order to activate syntax coloring, you
must save the new file with a name, which has one of the above extensions.
To disable/enable syntax coloring:
1. Select [Tools->Options...]. The “Options” dialog will be displayed. Select the “Editor” tab (figure 4.7).
2. Set the “Enable syntax coloring” check box as necessary and then click “OK”.
88
4.12
Templates
When developing software it is often necessary to enter the same text repeatedly, for instance, when typing a
function definition, for loop or a comment block for a function. The High-performance Embedded Workshop
editor allows you to specify a block of text (or template), which can be inserted into the currently active editor
window. Thus, once a template has been defined, it can be automatically inserted without the need to re-enter it
manually.
4.12.1
Defining a Template
To define a template:
1. Select [Edit->Templates->Define Templates...], select [Templates->Define Templates...] from the
local menu, or click on the define template toolbar button (
). The dialog shown in figure 4.14 will be
displayed.
Figure 4.14: Define Template Dialog
2.
3.
4.
5.
6.
Click “Add”. A dialog is displayed that asks you to enter your chosen template name. This name must
be unique otherwise a duplicated template name message will be displayed and the template will not be
added.
If you want to modify an existing template use the “Template name” drop down menu to select which
template you want to modify.
Enter the desired text into the “Template text” text area. You can copy text from another editor window
and then paste it into this dialog using CTRL+V.
There are 10 shortcut keys reserved for templates. If you want to designate one of these select the key in
the drop list at the bottom of the edit template dialog. These range from CTRL+0 to CTRL+9.
Enter the following placeholder to insert special information when the template is inserted:
89
Table 4.2
Placeholders Used in Templates
Menu Entry
Placeholder
Replaced With
File path + name
$(FULLFILE)
Filename (including full path)
File name
$(FILENAME)
Filename (excluding path including extension)
File leaf
$(FILELEAF)
Filename (excluding path and extension)
Workspace name
$(WORKSPNAME)
Workspace name
Project name
$(PROJECTNAME)
Project name
Line number
$(LINE)
First line number of template insertion
Time
$(TIME)
Current time
Date, text
$(DATE_TEXT)
Current date in text form
Date, day/month/year
$(DATE_DMY)
Current date, in dd/mm/yy form
Date, month/day/year
$(DATE_MDY)
Current date, in mm/dd/yy form
Date, year/month/day
$(DATE_YMD)
Current date, in yy/mm/dd form
User name
$(USER)
Current windows user
Cursor position
$(CURSOR)
Insertion cursor – Positions the cursor in this
position after template has been inserted
7. Enter the $(CURSOR) character to specify where the insertion cursor is to be placed after the template
has been inserted. If this is not specified then the insertion cursor will be placed after the last character in
the template (as in a normal paste operation).
User Input
When defining a template it is possible to define a user input field. Using the following placeholder specifies
this $(USERINPUT<n:1-10>|”<some text>”). The n is a number, which identifies the user input identifier.
These placeholders can be added manually but the user input button on the define templates dialog adds these
placeholders in an automated manner. When the template is inserted into a file a dialog is displayed which
allows you to enter some custom text for each of these fields. This text is then inserted instead of the
placeholder. You can define ten of these user input fields.
Figure 4.15 shows a list of templates, which is located on the “Templates” tab of the “Workspace” window.
90
Figure 4.15: Templates view
Any new templates, which have been added to the HEW, are displayed under the templates folder. The
toolchain templates folder is for templates, which are read only and have been provided for use in the HEW
system by the current toolchain. Templates in this view can be dragged for insertion into an editor file. It is also
possible to drag an area of text from the editor into the templates folder for quick template creation. Right
clicking on this view displays a pop-up so that you can quickly add a new template, remove the current selection
and edit the current selection.
4.12.2
Deleting a Template
To delete a template:
1. Select [Edit->Templates->Define Templates...], select [Templates->Define Templates...] from the
local menu or click on the define template bookmark toolbar button (
). The dialog shown in figure
4.14 will be displayed.
2. Use the Template name drop down list to select the name of the template you wish to remove and then
click the “Remove” button.
3. Clicking “OK” saves the template changes and dismisses the dialog.
4.12.3
Inserting a Template
To insert a template:
1. Select a template in the toolbar, then click the insert template toolbar button (
), select [Edit->
Templates->Insert Template...] or select [Templates-> Insert Template...] from the local menu. The
dialog is dismissed and the chosen template is added to the current editor window.
Note: It is also possible to use the defined keyboard shortcut or drag the template from the templates
view.
91
4.12.4
Brace Matching.
Complicated source code can often become unwieldy, especially when blocks of C code are deeply nested within
each other or when complex logic statements are expressed within an ‘if’ clause. To help in such situations, the
High-performance Embedded Workshop editor provides a match brace feature which highlights text between
braces of type { }, ( ) and [ ].
To find a matching brace:
1. Either highlight the open brace to match from or place the cursor before it.
2. Click the match braces toolbar button ( ), press SHIFT+CTRL+M, select [Edit->Match Braces] or
select [Match Braces] from the local menu.
To check the structure of an entire file, place the cursor at its start and then repeatedly invoke the match brace
operation. The editor will successively highlight each pair of braces in turn until there are no more to match.
92
4.13
Editor Column management
The editor in HEW has the ability to manage columns apart from the main editor column. These can be added
and used by debugger feature. You can choose the column to display/undisplay.
Figure 4.16: Editor columns
To switch off a column in all source files:
1. Right click on the editor window.
2. Click the “Define Column Format…” menu item.
3. The “Global Editor Column States” dialog is displayed (figure 4.17).
4. The “Check status” shows whether the column is enabled or not. If it is checked it is enabled if the
check box is gray this means that in some files the column is enabled and in other files it is not.
5. Click “OK” for the new column settings to take effect.
To switch off a column in one source files:
1. Right click on the editor window, which you wish to remove a column from, and the editor pop-up is
displayed.
2. Click the Columns menu item and a cascaded menu item appears. Each column is displayed in this popup menu. If the column is enabled it has a tick next to its name. Clicking the entry will toggle whether
the column is displayed or not.
93
Figure 4.17: Global column state Dialog
4.14
Enable tooltip watch
Select [Tools->Options…] and then select the “Editor” tab (figure 4.7). By checking “Enable tooltip watch”,
you can use the Tooltip Watch feature, the quickest way to look at a variable in the source program.
To view a tooltip watch on the Editor window:
1. Display the source file containing the variable that you want to examine on the Editor window (figure
4.18).
2. Rest the mouse cursor over the variable name that you want to examine - a tooltip will appear near the
variable showing a value of that variable.
Figure 4.18: Viewing a tooltip watch
94
5.
Tools Administration
You control the components, which can be used by the High-performance Embedded Workshop via the “Tools
Administration” dialog (figure 5.1), which is invoked via [Tools->Administration…]. Modification of the
“Tools Administration” dialog box is only possible when no workspace is open, while only reference is possible
when a workspace is open.
Figure 5.1: Tools Administration Dialog
There are five standard types of component:
• Toolchains - a set of build phases (e.g. compiler, assembler, and linker). These components provide the build
capability.
• System Tool - an application (.EXE), which can be launched from the “Tools” menu. They are often
provided as extra applications, which support the toolchain (e.g. an external debugger like the Hitachi
Debugging Interface (HDI) or an interactive graphical librarian).
• Utility Phase - a “ready made” build phase which supports some specific build functionality (e.g. analyze
complexity of source code, count lines of source code, etc.). These components provide added functionality
to the build that is not toolchain specific.
• Debugger Component – a component that supports some specific debugger functionality (e.g. Target
platform, Object reader, etc).
• Extension Component – a component that provides key functionality in a certain area of the HEW system.
These components cannot be unregistered when installed (e.g. The HEW builder, debugger and flash
support).
95
5.1
Tool Locations
The HEW maintains the locations of HEW compatible components automatically as each new tool is installed.
After installation, the HEW stores information about the component (including its location) – this is referred to
as registration. Although initial registration is automatic, during the course of development or if you want to
manage the tools being used in your projects more effectively, you may need to register components yourself.
The remainder of this chapter discusses registration and how it affects you.
5.2
HEW Registration Files (*.HRF)
When a HEW compatible component (i.e. toolchain, system tool or utility phase) is installed, part of its
installation will include a file with the extension .HRF (figure 5.2.i). This file, named a “HEW Registration File”,
describes the component to the HEW. The process of registration refers to loading a component’s .HRF file into
the tools administration dialog (figure 5.2.ii).
Figure 5.2: HRF File Location and Registration
In order to use a component with HEW it must first be registered. The “Tools Administration” dialog (figure 5.1)
shows all currently registered components. To access it, ensure no workspaces are open and then select
[Tools->Administration…]. If you attempt to access tools administration when there is a workspace open the
tools administration dialog is opened but cannot be modified. When HEW is installed by default any new tools
are automatically registered.
HEW stores tool information in a tool database file. By default this is created in the HEW application directory,
however if you are working in a network environment this directory may be set to another location. It is possible
to change the tool directory location.
To change the tools location:
1. Select [Tools->Administration…].
2. Click the “Modify” button for the “Current HEW tools database location” field.
3. Select the directory under which the new tool is located, then click “OK”.
4. This will switch the directory and change the tool location to the new directory. It will be necessary to
scan for any new tools that may be in this location this is achieved by using the scan disk or register tool
functionality.
96
5.3
Registering Components
The HEW will automatically attempt to register any new components installed since the last time it was invoked.
However, in some circumstances you may need to register components yourself.
5.3.1
Searching Drives for Components
In some cases it is useful to search a drive for HEW compatible components. This is especially useful if the
HEW installation was deleted or corrupted as it can recreate your tool information instantly.
To search for components:
1. Click the “Search Disk…” button on the “Tools Administration” dialog (figure 5.1). The “Search Disk for
Components” dialog will be displayed (figure 5.3).
Figure 5.3: Search Disk for Components Dialog
2. Enter the directory in which you would like to search into the top field or browse to it graphically by
clicking the “Browse…” button.
3. Check the “Include subfolders” check box if you would like to search the directory specified and all
directories below it.
4. Click the “Start” button to begin the search. During the search, the “Start” button will change to a “Stop”
button. Click the “Stop” button to halt the search at any time.
5. The results of the search are shown in the “Located components” list. Select a component and click
“Register” to register an individual component or click “Register All” to register all located components.
6. Click “Close” to exit the dialog.
97
5.3.2
Registering a Single Component
The HEW allows you to navigate directly to a single component in order to register it. The HEW Registration
File (*.HRF) is located in the root directory of a component’s installation.
To register a component:
1. Click the “Register…” button on the “Tools Administration” dialog. A standard file open dialog will be
launched with its file filter set to “HEW Registration Files (*.hrf)”.
2. Navigate to the .HRF file of the component you would like to register, select it and then click “Select”.
3. A dialog will be invoked which displays information regarding the selected tool. Click “Register” to
confirm that you want to register the tool or click “Close” to abort the operation.
5.4
Unregistering Components
The components, which are registered with the HEW, affect the way in which it behaves. For example, every
compatible system tool, which is registered, will be added to the tools menu when a new project is created.
Sometimes this may not be desirable. If so, open the “Tools Administration” dialog, select the component from
the “Registered components” list and then click the “Unregister” button. A dialog will be invoked which asks
you to confirm this action. Click “Yes” to confirm the action.
Note: Unregistering a component does not remove its installation from hard disk. It simply removes the
information, which the HEW was storing about that component (i.e. it “disconnects” it from the HEW).
The action can be easily reversed at anytime by registering the tool (see above). If you want to remove a
component from the hard disk (i.e. uninstall a component) then refer to the section “Uninstalling
Components” later in this chapter.
98
5.5
Viewing and Editing Component Properties
To view information regarding a component, select it from the “Registered components” list and then click the
“Properties” button. The properties dialog will be displayed with the “General” tab selected (figure 5.4). This tab
displays the name, version and location of the selected component. None of the information on this tab is
editable.
Figure 5.4: Properties Dialog General Tab
Select the “Information” tab to view any information about the component (figure 5.5). This may include
copyright information, enhancements, bug fixes, user notes and so on.
Figure 5.5: Properties Dialog Information Tab
Note that if the tool has a compatibility issue the problem may be reported in this information edit field.
99
Select the “Environment” tab, if it exists, to view and edit a component’s environment settings (figure 5.6). This
dialog is most commonly used to modify the environment of a toolchain.
Figure 5.6: Properties Dialog Environment Tab
To add a new environment variable, click the “Add…” button (the dialog shown in figure 5.7 will be invoked).
Enter the variable name into the “Variable” field, the variable’s value into the “Value” field and then click “OK”
to add the new variable to the “Environment” tab. Placeholder pop-up menus are included to ensure that the
environment can be specified as flexibly as possible. For a detailed description of placeholders see appendix C,
“Placeholders”.
To modify an environment variable, select the variable that you want to modify from the “Environment” tab and
then click the “Modify…” button. Make the required changes to the “Variable” and “Value” fields, and then
click “OK” to add the modified variable to the “Environment” tab. To remove an environment variable, select it
and then click the “Remove” button.
Figure 5.7: Environment Variable Dialog
100
5.6
Uninstalling Components
The HEW provides a built in uninstaller method, which can remove unregistered components.
To uninstall a component:
1. Select [Tools->Administration…].
2. Click on the uninstaller button. The “Uninstall HEW Tool” dialog is invoked (figure 5.8).
Figure 5.8: Uninstall HEW Tool
3. Enter the directory in which you would like to search into the top field or browse to it graphically by
clicking the “Browse…” button.
4. Check the “Include subfolders” check box if you would like to search the directory specified and all
directories below it.
5. Click the “Start” button to begin the search. During the search, the “Start” button will change to a “Stop”
button. Click the “Stop” button to halt the search at any time.
6. The results of the search are shown in the “Located Tools which can be uninstalled” list. Select a
component and click “Uninstall” to uninstall a component.
7. Click “Exit” to exit the dialog.
A component may only be uninstalled if it is not currently registered with the HEW. If you attempt to uninstall a
tool, which is registered, then the dialog shown in figure 5.9 will be displayed. In such a case, you must return to
the “Tools Administration” dialog via [Tools->Administration…], unregister the tool and then invoke the tool
uninstaller again.
101
Figure 5.9: Unable to Uninstall Tool
If a tool is not registered with the HEW then the dialog shown in figure 5.10 will be displayed when the
“Unregister” button is clicked. This confirmation dialog displays all of the files and folders that will be deleted.
If you are certain that these files and folders can be deleted then click the “Yes” button. To abort the uninstall
click the “No” or “Cancel” buttons.
Figure 5.10: Confirmation Dialog
102
5.7
Technical Support Issues
The “Tools Administration” dialog is also capable of displaying information regarding “hidden” system
components. These are part of the HEW itself that cannot be unregistered/registered manually. If you check the
“Show all components” check box on the tools administration dialog, extra component folders are displayed (see
figure 5.11).
Figure 5.11: All Components Shown
When seeking technical support, you may be asked to give details about some or all of these components. To do
so, open the respective folder, select a component and click the “Properties” button. The properties dialog that
will be invoked behaves in the same way as discussed previously in this chapter, with the exception that there is
no “Environment” tab.
The HEW also has a feature, which outputs tool information regarding the registered components to a file. This
allows you to retrieve information on the entire HEW system. This information can then be sent to your
technical support contact if you are experiencing problems with the HEW.
To output tool information:
1. Click the [Tools->Administration] menu item.
2. Click the “Tool information…” button. A standard windows file save dialog is displayed.
3. Choose the file location and click OK.
4. A file is created in the chosen location with the current registered tool setup of the HEW.
103
If any of the components have problems these can be seen in the tools administration dialog. If the icon has an
additional icon this explains the problem. There are two additional icons that can be displayed. If a component
is found but cannot be used due to it being an old version or another dependent component is not available then
the icon in figure 5.12 is used to show this. If the component is not located where the registration file says it is
then the icon in figure 5.13 is used to show this.
Figure 5.12: Incompatible component found icon
Figure 5.13: Component not found icon
Note:
If the tool has one of these errors then it is possible to get more information by the following method:
To get tool error feedback:
1. Click the [Tools->Administration] menu item.
2. Select the tool in the list that has an issue.
3. Click “Properties…”
4. Select the information tab and scroll the edit field to the bottom.
5. The reason for the problem will be displayed in this area.
104
5.8
On-Demand components
The HEW version 3.0 onwards has the concept of on-demand components. These components are not
automatically loaded by the application or the debugger component. These components can be loaded by the
user or as part of the project generation process.
To load or unload an on-demand component manually:
1. Click the [Project->Components…] menu item.
2. The component gallery dialog is displayed. This is displayed in figure 5.14.
3. Select the component you wish to load. Click the load button. The components image should change to
the loaded state.
4. If you wish to unload a component. Select the component. Click the unload button. The components
image should change to the unloaded state.
5. Click OK to verify the changes.
Figure 5.14: Component Gallery
Note:
Each project in your workspace can have different components loaded and unloaded. If you have multiple
projects you can use the “Multiple projects…” and “All projects” items to change a components load status over
more than one project. If you select a combination which means the component is loaded in one project and not
anther then the intermediate state icon is displayed.
105
5.9
Custom Project Types
The [Project->Create Project Type…] menu item in HEW allows you to create a template for your project.
This menu item takes the settings of the current project and then creates a project type for you. The user can
specify the name of the new type and style of the project generation wizard. Once created these project types
appear in the “Tools Administration” dialog and are initially hidden in the system components part of the tools
administration tree. To export one of the custom project generators select the “Export” button on the “Tools
Administration” dialog. The execution environments of the custom project generators are packaged on the
execution file that can be installed. When this file is executed on the target user’s machine, the custom project
generator is installed.
Once created custom project type will then appear in the New workspace dialog and can be used to create
identical copies of your project.
To create custom project generator:
1. Open the workspace that contains the project you wish to convert into a custom project generator.
2. Set the project you wish to convert as the current project.
3. Click the [Project->Create project type…] menu item.
4. The following dialog is displayed:
Figure 5.15: New project type wizard – Step 1 Dialog
5.
6.
7.
106
The edit field is set to the current projects name. This will become the name of the new project
generator project type that will appear in the new workspace dialog. Change the contents of the fields
as appropriate.
At this stage you can choose to include the configuration directories or not. In this case it is normal to
not include the contents of these directories because normally these are only intermediate files.
Then click next. The following dialog is displayed.
Figure 5.16: New project type wizard – Step 2 Dialog
8.
At this stage you can change the wizard graphic and the project icon. By default no dialog is displayed
for this wizard. When you wish to display “Project information” dialog box, you should either
information dialog with default bitmap or information dialog with bitmap. This selection affects to
show icon in the “Project information” dialog.
9. You can also decide to change the icon for the project type at this stage. The default icon is shown but
you can choose to use your own custom icon and this will be displayed on the new workspace dialog.
10. When you are happy with the setup of the generator click finish. If you click “Next” button, Step 3
dialog box is shown.
107
Figure 5.17: New project type wizard – Step 3 Dialog
11. You can enter project information. It will be shown “Project information” in Project information dialog
box.
12. You can click “Finish” button. Now the generator will be created in the HEW\system\pgc directory in
your HEW installation. It will also automatically appear in the new workspace dialog.
108
You can see a new project type (In this example, “Current Project Name”) after creating by custom project
generator.
Figure 5.18: New Project Workspace Dialog
109
You can select a project type and enter workspace and project name then click, OK. This dialog contents come
from “Project type wizard - Step 2” and step 3 setting.
Figure 5.19: Project information Dialog
110
These can then be exported from the HEW system and be given to other users you need to use your project.
To export a custom project generator to another user:
1. Click on [Tools->Administration].
2. Check the “Show all components” checkbox.
3. Expand the “Project Generators – Custom” folder.
4. Select the custom project generator you wish to export.
5. Click the “Export...” button.
Figure 5.20: Tool Administration Dialog
6.
You should enter export directory for custom project generator and click “Export” button. HEW creates
some files. When another HEW uses its project, it needs all files under your specified directory.
Figure 5.21: Export Custom Project Generator Dialog
111
This will export the required files along with a “Setup.exe” file which can be then be executed on another HEW.
This will ask the location of the new users HEW and when Install is clicked the project generator will be added
to their HEW system.
Figure 5.22: Install custom generator Dialog
Once completed the project type will appear in the new workspace dialog.
Note:
A custom project generator can only be used in a HEW which is the same or greater version. If you attempt to
use the project generator in an old HEW an error message will be reported.
If your project generator contains a different toolchain to the destination HEW then this will be upgraded when
the project is first created.
112
6.
6.1
Customizing the Environment
Customizing the Toolbar
The High-performance Embedded Workshop provides 2 standard toolbars as detailed in chapter 1, “Overview”.
In addition to these, you may also construct your own toolbars via the “Customize” dialog (figure 6.1).
Figure 6.1: Customize Dialog Toolbars Tab
To create a new toolbar:
1. Select [Tools->Customize…]. The dialog shown in figure 6.1 will be displayed.
2. Click the “New...” button. The dialog shown in figure 6.2 will be displayed.
3. Enter the name of the new toolbar into the “Toolbar name” field.
4. Click “OK” to create the new toolbar.
Figure 6.2: New Toolbar Dialog
113
When a new toolbar is created it will appear undocked (i.e. “floating”) and empty.
To add buttons to a toolbar:
1. Select [Tools->Customize…]. The dialog shown in figure 6.1 will be displayed. Select the “Commands”
tab (see figure 6.3).
2. Browse the available buttons by selecting the button categories from the “Categories” list. Select a button
from the “Buttons” area to display information on its operation.
3. Click and drag a button from the dialog onto the toolbar.
Figure 6.3: Customize Dialog Commands Tab
114
To remove buttons from a toolbar:
1. Select [Tools->Customize…]. The dialog shown in figure 6.1 will be displayed. Select the “Commands”
tab (see figure 6.3).
2. Click and drag a button from the toolbar onto the “Buttons” area.
To remove a user defined toolbar:
1. Select [Tools->Customize…]. The dialog shown in figure 6.1 will be displayed.
2. Select the user-defined toolbar from the “Toolbars” list, and the “Reset” button in figure 6.1 changes to
the “Delete” button. Then click the “Delete” button.
To reset a standard toolbar back to its original state:
1. Select [Tools->Customize…]. The dialog shown in figure 6.1 will be displayed.
2. Select the standard toolbar from the “Toolbars” list and then click the “Reset” button.
To show or hide toolbar tooltips:
1. Select [Tools->Customize…]. The dialog shown in figure 6.1 will be displayed.
2. Set the “Show Tooltips” check box as desired.
To modify the toolbar name of a toolbar created by a user:
1. Select [Tools->Customize…]. The dialog shown in figure 6.1 will be displayed.
2. In the “Toolbars” list, select a toolbar, which has been created by a user and whose name you want to
modify.
3. Modify the name of the toolbar in the “Toolbar name” filed.
115
6.2
Customizing the Tools Menu
The “Tools” menu can be customized to include your own menu options.
To add a new menu option:
1. Select [Tools->Customize…]. The dialog shown in figure 6.1 will be displayed. Select the “Menu” tab
(see figure 6.4). The first thing for you to decide is whether you are adding a global application wide
tool (“Application wide tools:”), which will be available to all of your workspaces. Or whether you wish
to add a workspace wide tool (“Workspace wide tool:”), which is only valid for the current workspace.
Once you have made the choice choose the relevant section of the dialog.
Figure 6.4: Customize Dialog Menu Tab
2. Click the “Add…” button (the dialog shown in figure 6.5 will be invoked). If you would like to add an
existing system tool to the menu then select the “Select from existing system tools” radio button, choose
the tool from the drop-down list and then click “OK”.
3. Enter the name of the tool into the “Name” field.
4. Enter the command, excluding arguments, into the “Command” field.
5. Enter any arguments that you would like to pass to the command into the “Arguments” field.
6. Enter an initial directory in which you would like the tool to run, into the “Initial directory” field.
7. Click “OK” to add the menu option to the “Tools” menu.
116
Figure 6.5: Add Tool Dialog
New menu options are added to the bottom of the list (i.e. bottom of the tools menu). The order of menu options
in the “Tools” menu can also be modified.
To modify a menu option:
1. Select [Tools->Customize…]. The dialog shown in figure 6.1 will be displayed. Select the “Menu” tab
(see figure 6.4).
2. Select the menu option that you would like to modify and then click the “Modify…” button.
3. Make the desired changes on the “Modify Tool” dialog (figure 6.6) and then click “OK”.
Figure 6.6: Modify Tool Dialog
To remove a menu option:
1. Select [Tools->Customize…]. The dialog shown in figure 6.1 will be displayed. Select the “Menu” tab
(see figure 6.4).
2. Select the menu option that you would like to remove and then click the “Remove” button.
117
6.3
Configuring the Help System
The High-performance Embedded Workshop provides context sensitive help within the editor window. In other
words, if you select some text in the editor window and then press F1, the High-performance Embedded
Workshop will attempt to locate help on that selected item. The help files, which will be searched, are listed in
the “Help” tab of the “Customize” dialog.
To add a new help file:
1. Select [Tools->Customize…]. The dialog shown in figure 6.1 will be displayed. Select the “Help” tab
(see figure 6.7).
Figure 6.7: Customize Dialog Help Tab
2. Click the “Add…” button. The “Add Help File” dialog will be displayed (figure 6.8).
3. Enter a description of the help file into the “Title” field.
4. Enter the full path of the help file into the “Path” field (or browse to it graphically by clicking on the
“Browse…” button).
5. Click “OK” to define the new help file.
Figure 6.8: Add Help File Dialog
118
To make a help file the default choice, select it from the “Default help file” drop-down list or set it to “(None)” if
you would like to be prompted for a help file when F1 is pressed.
6.4
Specifying Workspace Options
The High-performance Embedded Workshop allows you to control several aspects of a workspace via the
“Options” dialog (figure 6.9). To invoke it select [Tools->Options…], and select the “Workspace” tab.
Figure 6.9: Options Dialog Workspace Tab
The following sections explain the options available on this tab.
119
6.4.1
Open last workspace at start-up
Set this check box if you would like the High-performance Embedded Workshop to automatically open the last
workspace you opened when it is launched.
6.4.2
Restore the files on opening workspace
When you close a workspace, the HEW stores, which files were open. When you open a workspace, the HEW
can restore (i.e. open) the same files so that you can continue your session in exactly the same state as when you
left it. If you would like the files associated with a workspace to be opened when you open a workspace then set
this check box.
6.4.3
Display workspace information dialog on opening workspace
When many workspaces are being used, it is sometimes difficult to remember exactly what was contained within
each workspace. To help resolve this, the High-performance Embedded Workshop allows you to enter a textual
description of each workspace.
To enter a workspace description:
1. Select the workspace icon from the “Projects” tab of the ”Workspace” window.
2. Click the right mouse button to invoke the pop-up menu and then select the “Properties” option. The
dialog shown in figure 6.10 will be displayed.
3. Enter the description into the “Information” field.
4. Check the “Show workspace information on workspace open” check box if you want a workspace
properties dialog to be launched on opening a workspace. This check box has the same role as the
“Display workspace information dialog on opening workspace” on the “Workspace” tab of the “Options”
dialog.
5. Click “OK” to save the description on the “Information” dialog. Click the “Cancel” button not to save the
description.
120
Figure 6.10: Workspace Properties Dialog
When a workspace is opened, the High-performance Embedded Workshop can display this information so that it
is possible to determine whether the workspace is the desired workspace. To display this information on opening
a workspace, set the “Display workspace information dialog on opening workspace” check box.
6.4.4
Save workspace before executing any tools
To force the High-performance Embedded Workshop into saving the current workspace before executing any
build phases (i.e. build, build all or build file operations) or version control commands set the “Save workspace
before executing any phases” check box.
6.4.5
Prompt before saving workspace
In addition to the above check box, set this to prompt before saving.
6.4.6
Prompt before saving session
Checking this option will force the High-performance Embedded Workshop into displaying a prompt before the
session is saved to disk.
121
6.4.7
Save auto-recovery info
When you click this option, every ten minutes (as default) HEW saves workspace, project and session
temporality. Any changes you have made will be saved to temporary files.
If you open your workspace and the following dialog is displayed it means that the last time the workspace was
used problems were encountered. To recover the files check the checkbox alongside the filenames you wish to
recover and click OK. Clicking cancel will discard the auto-recovery files and load from the original files.
Figure 6.11: HEW Workspace Auto-Recovery Dialog
6.4.8
Default directory for new workspaces
When a new workspace is created the High-performance Embedded Workshop invokes the “New Workspace”
dialog. One of the fields on this dialog is the directory in which the new workspace will be created. By default,
this is the HEW installation directory. However, if you would like to set this default directory to another location
(e.g. “C:\Workspaces”) then enter the desired directory into the field or browse to it graphically via the
“Browse…” button.
122
6.5
Using an External Editor
The High-performance Embedded Workshop allows you to use an external editor. Once an external editor has
been specified, it will be launched when the following actions are performed:
•
•
•
•
•
•
Double clicking on a file in the “Projects” tab of the “Workspace” window.
Double clicking on an entry in the “Navigation” tab of the “Workspace” window.
Double clicking on an error/warning in the “Build” tab of the “Output” window.
Double clicking on an entry in the “Find in Files” tab of the “Output” window.
Selecting the [Open <file>] option from the “Workspace” windows pop-up menu.
Clicking the “Launch Editor” toolbar button.
To specify an external editor:
1. Select [Tools->Options…]. The “Options” dialog will be displayed. Select the “Editor” tab (figure 6.12).
Figure 6.12: Options Dialog Editor Tab
123
2. Check the “Use external editor” check box.
The “External Editor” dialog will be displayed (figure 6.13).
Figure 6.13: External Editor Dialog
3. Enter the path of the executable (without any arguments) into the “Command” field.
4. Enter the arguments required to open a file into the “Arguments to open file” field. Use the $(FULLFILE)
placeholder to represent the path of the file to be opened.
5. Enter the arguments required to open a file at a specific line into the “Arguments to open file at line” field.
Use the $(FULLFILE) placeholder to represent the path of the file to be opened and the $(LINE)
placeholder to represent the line number at which the cursor should be initially positioned.
6. Click “OK” to define the editor.
Note: When using an external editor be aware of the following issues:
• Each time you invoke the external editor, in whichever way, a separate instance of the editor will be launched.
• You must save your own files before you perform a build file, build or build all operation.
• If debugging the external editor will not be used.
6.6
Customizing File Save
The High-performance Embedded Workshop allows you to customize file save on the “Editor” tab of the
“Options” dialog (figure 6.12). To open the tab, select [Tools->Options…] and click the “Editor” tab.
The following sections explain the options related to file save.
6.6.1
Save files before executing any tools
To force the High-performance Embedded Workshop into saving edited files before executing any build phases
(i.e. build, build all or build file operations) or version control commands, set the “Save files before executing
any tools” check box.
6.6.2
Prompt before saving files
In addition to the above check box, set this to prompt before saving.
124
6.7
Using Custom Placeholders
Throughout the High-performance Embedded Workshop the user can use a number of pre-defined placeholders
for directory definitions. For example the user can use the “$(PROJDIR)” variable to signify the current HEW
project directory. This makes it much easier to relocate projects and keep all of the paths correct.
The High-performance Embedded Workshop also has the ability to define custom placeholders. This means you
can enter your own custom placeholder definition and decide upon its directory value. Once defined this
placeholder becomes available throughout the rest of the HEW system.
The placeholders can be defined on an application wide level so the placeholders are available to all workspaces
and projects that use the HEW. The other method of defining the placeholders is using the workspace wide
custom placeholders this means the placeholders can only be used in the current workspace. This list is only
available when you have a workspace open.
Figure 6.14: Customize Dialog Placeholder Tab
125
To add a custom placeholder:
1. Select [Tools->Customize…]. The dialog shown in figure 6.1 will be displayed. Select the
“Placeholders” tab (figure 6.14).
2. Choose whether you need to use an “Application wide custom placeholder” or “Workspace wide custom
placeholder”. Click “Add” on the adjacent button to the list you require.
3. The dialog, add “New Custom Placeholder” dialog is displayed. (figure 6.15)
4. In the fields provided choose a suitable name for the placeholder and a description of what the
placeholder means.
5. Then choose a directory, which relates to this placeholder. It is possible to use placeholders that are
already defined in this field such as $(PROJDIR).
Figure 6.15: New Custom Placeholder Dialog
126
6.8
Using the workspace and project log facilities
The HEW 3.0 has workspace and project logging facilities integrated into the application. These facilities can be
switched on via the log tab on the Tools customize dialog. This option is especially useful when the network
database is in operation. This is because user names and changes are logged to this file. This dialog is shown in
figure 6.16.
When the workspace log is clicked any workspace changes will be logged to a file with the same name as the
workspace with a “.log” extension. This file will be located in the same directory as the workspace file.
When the generate log for projects log is clicked any projects in the current workspace that have changes made
to them will be logged to a file with the same name as the project with a “.log” extension. This file will be
located in the same directory as the project file.
The log file is updated when the workspace is saved.
Figure 6.16: Tools customize log tab
6.9
Using the virtual desktop
HEW has implemented the concept of the virtual desktop. This allows window configurations to be defined that
can be switched with the click of a button. When a particular button is clicked the windows are hidden or
displayed depending on the current settings of that window configuration.
It is possible to have a maximum of 4 desktop configurations in use. When the session is saved the window
positions for each configuration are saved to the session file. You can then switch simply between each
configuration to gain access to the other windows. The toolbars and windows are dependent on the virtual
desktop configuration. Source files are independent of the virtual desktop system and will remain in view.
127
1.
2.
3.
4.
5.
To rename your configuration to a more meaningful name:
Click the [Window->Virtual Desktop] menu item. Select is cascaded menu.
Select the Desktop Manager dialog.
Select the window configuration you wish to change the name for.
Click the rename button. Enter the new meaningful name in the edit field and click OK.
Click OK to keep the changes and revert to the HEW main window.
To switch desktop configurations:
There are a number of ways to switch desktop configuration. The first and easiest method is using the virtual
desktop buttons located on the status bar. These are shown in figure 6.17.
Figure 6.17: Desktop button
In this example the selected desktop is number 1. This has been given the name "Build" by the user. Its
description is seen in the edit box to the right on the buttons. Clicking a different desktop selects that button and
changes the description control. Once clicked HEW then loads the windows in the new configurations style.
Another method of changing the desktop configuration is as follows:
1.
2.
3.
Click the [Window->Virtual Desktop] menu item. Select is cascaded menu.
Then select the desktop configuration you wish to view on this menu. The selected item is ticked.
Select the menu item and the setup is altered automatically.
Note:
If the configuration has never been used then HEW will copy the current window configuration to the new
configuration. You can then modify this setup. When you save the session it will store the positions of your
windows for each window configuration.
128
7.
Version Control
The High-performance Embedded Workshop provides facilities for connecting to a version control tool. Some of
the reasons why version control tools are used with a project are:
• To maintain the integrity of a project.
• To store each stage of a project.
• To enable different users to co-develop a project by controlling revisions to its source files.
Figure 7.1 illustrates a typical project where a version control system is in use. This shows three users who all
use the same-shared network drive to exchange source code. The version control system provides access and
updates to the source files.
Figure 7.1: Version Control
129
7.1
Selecting a Version Control System
Initially, the version control sub-menu will appear as shown in figure 7.2. At this time only the [Version
Control -> Select…] option is available because a version control system is not yet active for the current
workspace.
Figure 7.2: Version Control Sub-Menu
To select a version control system:
1. Select [Version Control->Select…]. The dialog shown in figure 7.3 will be displayed. This dialog lists
all of the supported version control systems.
2. Select the desired version control system from the “Version control systems” list and click the “Select”
button. The “Current version control system” is changed to reflect the new selection.
3. Click the “OK” button to confirm the selection.
130
Figure 7.3: Select Version Control System Dialog
Note: Only those version control systems, which have been installed with the HEW, will appear in the “Select
Version Control System” dialog (figure 7.3).
Once a version control tool is selected you will notice that the [Version Control->Configure…] option has now
become available.
The next chapter discusses the usage of the custom version control system.
131
132
8.
Using the Custom Version Control System
The custom version control system is a configurable addition to the High-performance Embedded Workshop,
which allows you to connect to a version control system already installed on your machine. To clarify further,
the High-performance Embedded Workshop does not provide a version control tool itself, only a means by
which you can integrate the version control system, which you use into your workspaces and projects.
8.1
Defining Version Control Menu Options
The custom version control system allows you to invoke a version control command either by selecting an
option from the [Tools-> Version Control] sub-menu or by clicking a version control toolbar button. When
either of these actions are performed, the associated commands are executed and the output is displayed in the
“Version Control” tab of the “Output” window.
To execute a version control menu option or toolbar button:
1. Select whichever items you would like to apply the version control command to from the “Workspace”
window. This may include a workspace, project(s), folder(s) and file(s). When the command is selected,
all of the files will be extracted from the selected items and passed, in turn, to the version control
command. For example, if you select the workspace icon then all of the files in all of the projects will be
passed, in turn, to the version control command. This will include any system files. For example if you
select the project item then
2. Select the required menu option from the [Tools->Version Control] sub-menu or click the desired
version control toolbar button.
The custom version control support allows you the most flexibility in specifying how a version control system is
to be used. To configure it, select [Version Control->Configure…]. The “Version Control Setup” dialog will be
displayed (figure 8.1).
133
Figure 8.1: Version Control Setup Dialog Commands Tab
134
The “Commands” tab contains two lists of menu options. The first list, “System menu options and toolbar
buttons”, represents those menu options which always appear on the version control sub-menu. These menu
options also have an associated toolbar button on the version control toolbar. The second list, “User menu
options”, represents those additional user defined options which are added to the bottom of the version control
sub-menu. Figure 8.2 shows the structure of the version control sub-menu.
Figure 8.2: Version Control Sub-Menu
8.1.1
System menu options and toolbar buttons
In order to invoke commands from the toolbar or the system defined options of the [Tools->Version Control]
sub-menu, you must first define the associated commands that should be executed when they are activated. The
names of the options and their intended action are listed in table 8.1.
Table 8.1: System Menu Option
Option
Description
Add File(s)
Add selected file(s) to version control system.
Remove File(s)
Remove selected file(s) from version control system.
Get File(s)
Get a read only local copy of the selected file(s) from version control system.
Check In File(s)
Put back, i.e. update, the selected file(s) in version control system with the
local copy.
Check Out File(s)
Get a writable local copy of the selected file(s) from version control system.
Status of File(s)
View the status of the selected file(s).
135
To modify a system menu / toolbar option:
1. Select [Version Control->Configure…]. The dialog shown in figure 8.1 will be displayed.
2. Select the option to be modified from the “System menu options and toolbar buttons” list and then click
the “Modify…” button. The dialog shown in figure 8.3 will be displayed. This figure shows a dialog
when “Add File(s)” has been selected for example.
3. Commands are added via the “Add…” button. See the section, “Defining Version Control Commands”,
later in this chapter for further information.
4. Close the “Define Command for “<command>”” dialog by clicking “OK”.
5. Close the “Version Control Setup” dialog by clicking “OK”.
Figure 8.3: Modify System Menu Option (Example)
136
8.1.2
User menu options
You can create as many user defined menu options as you like, name them how you want and define their order
in the menu. User defined menu options do not appear on the version control toolbar.
To create a new version control menu option:
1. Select [Version Control->Configure…]. The dialog shown in figure 8.1 will be displayed.
2. Click the “Add..” button. The dialog shown in figure 8.4 will be displayed.
3. Enter the name of the menu option into the “Option” field.
4. Commands are added to the menu option via the “Add…” button. See the section, “Defining Version
Control Commands”, later in this chapter for further information.
5. Close the “Add Menu Option” dialog by clicking “OK”.
6. Close the “Version Control Setup” dialog by clicking “OK”.
Figure 8.4: Add Menu Option Dialog
137
To remove an existing version control menu option:
1. Select [Version Control->Configure…]. The dialog shown in figure 8.1 will be displayed.
2. Select the menu option to be removed from the “User menu options” list and then click the “Remove”
button.
3. Close the “Version Control Setup” dialog by clicking “OK”.
To modify an existing version control menu option:
1. Select [Version Control->Configure…]. The dialog shown in figure 8.1 will be displayed.
2. Select the menu option to be modified from the “User menu options” list and then click the “Modify…”
button beside the list. The dialog shown in figure 8.4 will be displayed. (The title of the dialog is “Modify
Menu Option”.)
3. Modify the commands as necessary and then click “OK”.
4. Close the “Version Control Setup” dialog by clicking “OK”.
To change the ordering of version control menu options:
1. Select [Version Control->Configure…]. The dialog shown in figure 8.1 will be displayed.
2. Select the menu option to be moved and then click the “Move up” and “Move down” buttons as
necessary.
3. Close the “Version Control Setup” dialog by clicking “OK”.
138
8.2
Defining Version Control Commands
Commands are defined when the “Add…” or “Modify…” buttons are clicked on the dialogs shown in figure 8.3
and figure 8.4. In either case, the dialog shown in figure 8.5 is invoked.
Figure 8.5: Add/Modify Command Dialog
To define a command:
1. Enter the full path of the command into the “Version control executable” field or browse to it graphically
by clicking the “Browse…” button.
2. Enter the arguments for the command into the “Arguments” field.
3. Enter the initial directory in which you would like to run the executable from into the “Initial directory”
field or browse to it graphically by clicking the “Browse…” button. In most cases this should be set to the
“$(FILEDIR)” placeholder, i.e. execute the command from the same directory as the file.
4. Set the “Executable return code” options as described in the following section.
5. Click “OK” to define the new command.
8.2.1
Executable return code
If the return code of the command(s) can be used to indicate a failure then you should select the “Command has
failed if the return code is” option and set the two fields to the right as required.
If the “Command has failed if the return code is” option is selected then the HEW will check the return code of
each command to determine whether a failure occurred. If so, no further commands will be executed and any
other processes which would follow the commands (e.g. build) will not be executed.
If the “Return code of tool is not meaningful” option is selected then the HEW will not check the return code of
each. Consequently, all commands will execute regardless.
139
8.3
Specifying Arguments
It is obvious that arguments must be specified correctly, otherwise the version control tool executed will not
function as intended. However, it is also important, when using custom version control support, to specify the
arguments in a flexible way as a single version control command can be applied to more than one file. To
facilitate this, the “Arguments” field has a placeholder button (refer to appendix C, “Placeholders”, for an in
depth discussion of placeholders) which, when clicked on, invokes a pop-up menu of available placeholders
(figure 8.6). An explanation of each placeholder and how their values are derived can be found in table 8.2,
Arguments Field Placeholders.
Figure 8.6: Arguments Field Placeholder Pop-up Menu
140
Table 8.2: Arguments Field Placeholders
Placeholder
Value and How its Determined
User login name
Current user login (“General” tab)
User login password
Current user password (“General” tab)
Version control directory
“Virtual” version control mapping (“Projects” tab)
Comment
Comment specified before command execution
File path + name
Full path and name of file involved in operation
Filename
Filename (including extension) of file involved
File leaf
Filename (excluding extension) of file involved
File extension
Extension of file involved in operation
File directory
Directory of file involved in operation
Configuration directory
Current configuration directory
Project directory
Current project directory
Workspace directory
Current workspace directory
Temp directory
Temporary directory
Command directory
Version control executable directory
Windows directory
Directory where Windows® is installed
Windows system directory
Directory where Windows® system files exist
Workspace name
Current workspace name
Project name
Current project name
Configuration name
Current configuration name
8.3.1
Specifying File Locations
When referring to a file’s location, be sure to use a placeholder, otherwise the command will only relate to a
hardwired file. For example, let’s imagine that a version control executable has been selected which uses a –GET
command to obtain a read only copy of a file. The “Arguments” field could be specified as:
-GET “c:\vc\files\project\main.c”
However, when executed, this command can only ever get the file MAIN.C. To resolve this problem, HEW uses
a system of placeholders and directory mappings. The latter tell the HEW which “working” directories (i.e.
where source files are being worked on) map to which “controlled” directories (i.e. where the source files are
stored in the version control system). Mappings between these two directory systems can be specified via the
“Projects” tab of the ”Version Control Setup” dialog (figure 8.7).
141
Figure 8.7: Version Control Setup Dialog Projects Tab
To define a new mapping:
1. Select [Version Control->Configure…]. The dialog shown in figure 8.1 will be displayed. Select the
“Projects” tab, and the dialog shown in figure 8.7 will be displayed.
2. Click the “Add…” button that is next to the “Version control directory mappings” list. The dialog shown
in figure 8.8 will be displayed.
3. Enter the source (i.e. “working”) directory into the “Source directory” field or browse to it graphically by
clicking the “Browse…” button.
4. Enter the version control directory (i.e. “controlled”) directory into the “Version control directory”.
Figure 8.8: Version Control Directory Mapping Dialog
142
To modify an existing mapping:
1. Select [Version Control->Configure…]. The dialog shown in figure 8.1 will be displayed. Select the
“Projects” tab, the dialog shown in figure 8.7 will be displayed.
2. Select the mapping to be modified from the “Version control directory mappings” list and then click the
“Modify…” button. The dialog shown in figure 8.8 will be displayed.
3. Make the necessary changes to the two directories and then click “OK” to confirm the edits.
To remove an existing mapping:
1. Select [Version Control->Configure…]. The dialog shown in figure 8.1 will be displayed. Select the
“Projects” tab, the dialog shown in figure 8.7 will be displayed.
2. Select the mapping to be removed from the “Version control directory mappings” list and then click the
“Remove” button.
Once the mappings have been defined you can use the “Version control directory” placeholder, $(VCDIR), to
represent the directory in which the project file is stored. Consider the scenario shown in figure 8.9. Here are
three directories, which are mapped from a shared version control drive (X:\) to a local drive where the
development is being done (C:\).
Figure 8.9: Example Mappings
Now let’s imagine that a version control executable has been selected which uses a –GET command to obtain a
read only copy of a file. In order to get all of the files in a project we need to use the following command:
-GET “$(VCDIR)\$(FILENAME)”
When the HEW executes the command for a given project file, it will replace $(VCDIR) for the equivalent
version control directory in the file mapping.
For example, suppose FILE1.C is located at:
c:\work\application\project1\file1.c
If the get command is applied to FILE1.C then:
(1) x:\vc\sw\app\project1 is substituted for $(VCDIR) as this is the version control directory mapping for
c:\work\application\project1.
(2) FILE1.C is substituted for $(FILENAME).
143
Project File:
C:\work\application\project1 \ file1.c
Arguments:
$(VCDIR) \ $(FILENAME)
(1)
(2)
X:\vc\sw\app\project1 \ file1.c
Command:
Figure 8.10: Example of Substitution
8.3.2
Specifying Environment
Select the “Projects” tab of the “Version Control Setup” dialog to view the current settings (figure 8.7).
To add a new environment variable click the “Add…” button beside the “Environment” list (the dialog shown in
Figure will be invoked). Enter the variable name into the “Variable” field, the variable’s value into the “Value”
field and then click “OK” to add the new variable to the “Environment” list.
Figure 8.11: Environment Variable Dialog
To modify an environment variable, select the variable that you want to modify from the “Environment” list and
then click the “Modify…” button beside it. Make the required changes to the “Variable” and “Value” fields and
then click “OK” to add the modified variable back to the list. To remove an environment variable, select the
variable that you want to remove from the “Environment” list and then click the “Remove” button beside it.
144
8.3.3
Specifying Comments
If a command contains the placeholder “$(COMMENT)” then the HEW will request that you enter the comment
when the command is executed (via the dialog as shown in figure 8.12).
Figure 8.12: Please Enter Comment Dialog
You may specify a comment for each file or, if you would like to specify the same comment for all files, check
the “Apply comment to all files” check box before clicking “OK”.
145
8.3.4
Specifying a User Name and Password
Most version control tools will require you to pass a user name and password on the command line in order to
keep files secure and to keep a record of which files were changed by which users. The custom version control
support provides two placeholders “User login name”, $(USERNAME), and “User login password”,
$(PASSWORD). When the command is executed, these placeholders will be replaced with the current settings in
the “General” tab of the “Version Control Setup” dialog (figure 8.13).
Figure 8.13: Version Control Setup Dialog General Tab
146
In order to give the $(USERNAME) and $(PASSWORD) fields a value you will first need to login. If you have
not logged in before a command is executed which uses either of these placeholders then you will be prompted
to do so before the command can be executed.
To login (i.e. specify a user name and password):
1. Click the “Log in…” button. The dialog shown in figure 8.14 will be displayed.
2. Enter your user name into the “User name” field.
3. Enter your password into the “Password” field.
4. Re-type your password again into the “Confirm password by retyping it below” field.
5. Click “OK” to set the new user name and password. If there is any inconsistency between the two
versions of the password which you entered then you will be requested to type your password again.
Figure 8.14: Log in Dialog
147
8.4
Controlling Execution
The “General” tab of the “Version Control Setup” dialog (figure 8.13) allows you to control the way in which
the version control tool is executed. It also shows the full path to the current version control configuration file.
8.4.1
Prompt before executing command
If this check box is set then, before any version control commands are executed, a dialog is displayed (figure
8.15) which lists all of the files involved in the operation. Files may be deselected by clearing the associated
check box. Clicking “OK” will apply the command to each of the selected files. Clicking “Cancel” will abort the
operation.
Figure 8.15: Command Prompt Dialog
8.4.2
Run in DOS Window
By default, the output of the version control commands is redirected to the “Version Control” tab of the “Output”
window. If you would rather run each command in a separate DOS window then set this check box.
8.4.3
Use forward slash ‘/’ as version control directory delimiter
By default, when the HEW substitutes the placeholder $(VCDIR) it uses the backward slash character ‘\’ to
divide directories. However, if the version control system you are using uses a forward slash character (e.g.
Visual SourceSafe) to divide directories then set the “Use forward slash ‘/’ as version control directory
delimiter”.
148
8.5
Importing and exporting a Set-up
Each workspace can have a different version control set-up. The HEW allows you to store the version control
settings independently so that you can import them into other workspaces. This greatly reduces the amount of
time it takes to configure the same version control settings across several workspaces.
To export a version control set-up:
1. Select [Version Control->Configure…]. The dialog shown in figure 8.1 will be displayed.
2. Click the “Export…” button. A standard file save dialog will be displayed. Browse to the directory in
which you would like to save the configuration.
3. Enter the name of the file and then click “OK”.
To import a version control set-up:
1. Select [Version Control->Configure…]. The dialog shown in figure 8.1 will be displayed.
2. Click the “Import…” button. A standard file open dialog will be displayed. Browse to the *.HVC file
which you would like to import.
3. Select the file and then click “OK”.
149
150
9.
Using Visual SourceSafe
The High-performance Embedded Workshop provides specific support for the Visual SourceSafe version control
system. At the time of writing, the HEW can only attach to versions 5.0 and 6.0 of Visual SourceSafe.
The Visual SourceSafe version control system associates a project in your workspace with a project inside a
Visual SourceSafe database. It allows you to quickly invoke the standard commands either by selecting an option
from the [Tools->Version Control] sub-menu or by clicking a version control toolbar button.
9.1
Attaching Visual SourceSafe to a Workspace
The following sections describe how you can associate Visual SourceSafe with your current workspace.
9.1.1
Selecting Visual SourceSafe
First, you need to select Visual SourceSafe as the version control system.
To use Visual SourceSafe 5.0 or 6.0:
1. Select [Tools->Version Control->Select…]. The “Select Version Control System” dialog will be
displayed (figure 7.3) which lists all of the supported version control systems.
2. Select the “Visual SourceSafe 5.0/6.0” entry from the Version Control Systems list and click the “Select”
button.
3. Click “OK” to confirm the selection. The SourceSafe Login dialog is displayed (figure 9.1).
4. Enter your Visual SourceSafe login into “Username” and password into “Password”.
5. Enter into Database path the full path to the Visual SourceSafe database (i.e. SRCSAFE.INI) into which
you would like to add this project.
6. Click “OK”. The “Create SourceSafe Project” dialog is invoked (figure 9.2).
7. The “Project name” field displays the name of the project (i.e. folder) to be created in the database. If
necessary you can change this name to another.
8. The tree underneath the “Project name” field shows the structure of the database specified in step 6.
Select the folder into which you would like to create the folder specified in the “Project name” field.
9. Click “OK”.
10. HEW will require you to repeat steps 7-9 for as many projects as are present in the current workspace.
Figure 9.1: SourceSafe Login Dialog
151
Figure 9.2: Create SourceSafe Project dialog
The HEW has now created the necessary projects within Visual SourceSafe and sets-up the version control
toolbar and menu for immediate access. However, although the Visual SourceSafe projects themselves have
been created, no files have been added to them.
9.1.2
Adding files to Visual SourceSafe
The previous section has only established the mappings between the project directory on your hard disk (i.e. the
working directory) and the project directory in Visual SourceSafe (i.e. the controlled directory). Although the
project directory (and any subdirectories) on your hard disk may contain many source files whereas the directly
its mapped to in Visual SourceSafe will be initially empty.
Firstly, you must select Visual SourceSafe as the version control system.
To add a file or files to Visual SourceSafe:
1. Select the file(s), which you would like to add to Visual SourceSafe. You may also select a file folder,
project folder, a workspace folder or combination thereof. When selecting the project or workspace
folder then the system files will be added to the selected file list. For example, selecting the project folder
will also add the project file to the file list. If the project file is then checked out and the version is newer
than when it was last loaded you will be asked whether you want to reload the project.
2.
Click the Add Files toolbar button (
option.
) or select the [Tools->Version Control->Add Files] menu
When you add files to Visual SourceSafe the local versions in your working directory will become read only. To
check that the add files operation was carried out as you expected, or to quickly review the status of all of the
files in a project:
1. Select the project folder whose files you want to check.
2.
3.
152
Click the Status of Files toolbar button (
) or select the [Tools->Version Control->Status of Files]
menu option.
The status of each file will be displayed in the “Version Control” tab of the “Output” window. The
information shown includes whether the file is added to the project, if the file is checked out and, if it is
checked out, who did so.
9.2
Visual SourceSafe commands
The following 8 operations are available:
•
•
•
•
•
•
•
•
Add a file to version control
Remove a file from version control
Get a read only copy of a file or files
Check out a read/write copy of a file or files (i.e. for editing)
Check in a previously checked out file or files (i.e. update Visual SourceSafe with the edits made)
Undo a previously check out operation on a file or files (i.e. cancel any edits made)*
View the status of a file
View the history of a file*
*These commands can only be accessed via the [Tools->Version Control] sub-menu whereas all of the other
commands can be accessed from both the toolbar and menu.
9.2.1
Removing a File from Version Control
Although files appear in your HEW project (in the “Projects” tab of the “Workspace” window, Visual
SourceSafe is not necessarily controlling them.
To remove a file or files from Visual SourceSafe:
1. Select the file(s), which you would like to remove from Visual SourceSafe. You may also select a file
folder, project folder, a workspace folder or combination thereof.
2.
9.2.2
Click the Remove Files toolbar button (
menu option.
) or select the [Tools->Version Control->Remove Files]
Getting a Read Only Copy of a File from Version Control
Visual SourceSafe protects your source files and ensures that only one user can have a writable copy of a
controlled file at any one time. However, it is possible for any user to obtain a read only copy of any file.
To get a read only copy of a file or files from Visual SourceSafe:
1. Select the file(s), which you would like to get from Visual SourceSafe. You may also select a file folder,
project folder, a workspace folder or combination thereof.
2.
Click the Get Files toolbar button (
option.
) or select the [Tools->Version Control->Get Files] menu
153
9.2.3
Checking Out a Writable Copy of a File from Version Control
Visual SourceSafe protects your source files and ensures that only one user can have a writable copy of a
controlled file at any one time. The check out operation takes a writable copy of the file from Visual SourceSafe
and places it on your local drive. This can only be done if another user does not already check out the file or files
in question.
To check out a writable copy of a file or files from Visual SourceSafe:
1. Select the file(s), which you would like to check out from Visual SourceSafe. You may also select a file
folder, project folder, a workspace folder or combination thereof.
2. Click the Check Out Files toolbar button (
) or select the [Tools->Version Control->Check Out
Files] menu option.
3.
9.2.4
When the operation is finished the file has a red tick next to its name. This means you as the current
user of HEW has checked it out.
Checking In a Writable Copy of a File into Version Control
Visual SourceSafe protects your source files and ensures that only one user can have a writable copy of a
controlled file at any one time. The check out operation takes a writable copy of the file from Visual SourceSafe
and places it on your local drive. Once a file is checked out it is edited and then checked back in so that the edits
can be made available to other users.
To check in edits made to a file or files in Visual SourceSafe:
1. Select the file(s) upon which you would like to check back into Visual SourceSafe. You may also select a
file folder, project folder, a workspace folder or combination thereof.
2.
9.2.5
Click the Check In Files toolbar button (
option.
) or select the [Tools->Version Control->Check In] menu
Undoing a Check Out Operation
Visual SourceSafe protects your source files and ensures that only one user can have a writable copy of a
controlled file at any one time. The check out operation takes a writable copy of the file from Visual SourceSafe
and places it on your local drive. Once a file is checked out it is edited and then checked back in so that the edits
can be made available to other users. However, if the check out operation was carried out by mistake, or perhaps
is no longer required, then the operation can be undone.
To undo a check out of a file or files from Visual SourceSafe:
1. Select the file(s) upon which you would like to undo a previous check out operation. You may also select
a file folder, project folder, a workspace folder or combination thereof.
2. Select the [Tools->Version Control->Undo Check Out] menu option.
154
9.2.6
Viewing the Status of a File
Although files appear in your HEW project (in the Projects tab of the Workspace window), Visual SourceSafe is
not necessarily controlling them. Of those files, which are being controlled by Visual SourceSafe, some will be
checked in and others will be checked out (i.e. being edited by a user). The status command displays the current
status of a file or file(s).
To view the status of a file or files in Visual SourceSafe:
1. Select the file(s) whose status you would like to view. You may also select a file folder, project folder, a
workspace folder or combination thereof.
2. Click the Status of Files toolbar button (
menu option.
) or select the [Tools->Version Control->Status of Files]
3. If a file has a blue tick next to it a user different to you has checked it out.
9.2.7
Viewing the History of a File
Visual SourceSafe controls the edits to the files in its projects and allows you to view the complete history of
these edits right back to the time that the file was first added to the project.
To view the history of a file or files in Visual SourceSafe:
1. Select the file(s) whose history you would like to view. You may also select a file folder, project folder, a
workspace folder or combination thereof.
2. Select the [Tools->Version Control->Show History] menu option.
9.3
Visual SourceSafe Integration Options
You can control the way in which the history and status commands are displayed by selecting [Tools->Version
Control->Configure…].
To display the results of a history command in a dialog box then check the “Display dialog box for history”
check box or clear it if you would rather display the output in the “Version Control” tab of the “Output” window.
To display the results of a status command in a dialog box then check the “Display dialog box for file status”
check box or clear it if you would rather display the output in the “Version Control” tab of the “Output” window.
155
156
10. Network Facilities
10.1
Overview
The High-performance Embedded Workshop is capable of sharing workspaces and projects across a network.
This allows users to concurrently work on shared projects and see each other’s changes as they happen. This
system can be used in conjunction with version control. The major difference with using this system is that each
user can modify and update the workspace and project without making all of the other users reload their project
and potentially lose all their changes.
This system is implemented by making one of the machines attached to the network the server machine. All
other client machines then use the service this machine is providing. So if one of the client machines adds a new
file, the server machine is notified. The server then notifies all other clients the action has taken place. This
structure is shown below in figure 10.1.
Figure 10. 1: Network database access structure
The network system allows users to be given access rights to files. This allows the project administrator to make
sure the only people who can modify the project and source files are allowed to do so. This might allow the
administrator to limit each user to only have write capabilities for their own area of the project, other areas
would be read only. This could limit any potential conflict or damage one user could do to other areas of the
project. These limitations can be set to a number of different levels. This is outlined later in this section.
Note: Certain operations are locked when other clients are carrying them out. This means that if one
machine is currently changing the toolchain options all of the other machines can only see read only
versions of this data.
Note: The performance of HEW does suffer when using the network facilities. If working in a small
team it might be more suitable to use the single user mode and version control.
157
10.1.1
Enabling network access
To use network access:
1. Select [Tools->Options]. The HEW tools options dialog is displayed.
2. Select the network tab. This is displayed in figure 10.2.
3. Click the enable network access checkbox. This should add an administrator to the system without a
password. The administrator is the only user that can add additional users to the system and change user
access rights. The administrator has the highest level of access.
4. Before leaving the network dialog the administrator must set their password. It is not possible to leave
this dialog until this is completed. This is described below.
10.1.2
Setting the administrator user’s password
To set the password:
1. Continue from the previous sections steps.
2. Click the password button. This should have been enabled when the network data access was enabled.
3. The password dialog is displayed. This is shown in figure 10.3.
4. The user name is read only in the top field. In this case it should be Admin.
5. Type the new password into both of the fields and click OK.
6. This should set the user and password on the [Tools->Options] network tab.
7. It is now possible to leave the [Tools->Options] dialog.
8. When the dialog is closed you are asked if you want to save the workspace and then re-open it. This is
because the workspace must be re-opened in the shared access mode. If the changes are not saved then
they will be lost.
9. When the workspace is re-opened a dialog is displayed which asks you to log back into the system.
Once you have logged in a dialog is displayed which shows your current access rights. For example if
you are the admin user the level will be administrator. When this dialog is closed the HEW server
window is opened and the network facilities are enabled.
158
Figure 10. 2: Initial setup of Network tab
Figure 10. 3: Change password dialog
159
10.1.3
Adding new users to the system
The initial setting of the network database adds an administrator user and a guest user to the system. The
following levels of access are possible in the HEW system:
•
Administrator:
Full access to every aspect of HEW. The user can add and remove users from the projects and
change access rights. The administration user can change the workspace and project files and also
the source files.
•
Full read/write access:
The workspace and project files can be modified, as can the source files. But it is not possible to
change user access rights from this access level.
•
Read/write file access:
Only the source files can be modified. All project settings can only be viewed not modified.
•
Read only:
All source files and project files can only be viewed as read only. Nothing can be modified.
When any user opens a network-enabled project they must type in their user name and password. Until this is
done no access can be granted. Once entered the user is given one of the levels of access as seen above.
To add a new user to the system:
1. Log in with a user who has administrator access rights. The process for doing this is described above.
2. Select [Tools->Options]. The HEW tools options dialog is displayed.
3. Select the network tab. This is displayed in Figure 10.2.
4. Click the access rights button. The dialog displayed in Figure 10.4 is displayed.
5. Click the add button. The log in dialog is displayed. This allows you as the administration user to add
a new log in name and password. Normally the password should be set to some default text or left
blank. Then click OK.
6. Once OK is clicked the user is added with read only rights. To change the access level select the user
you wish to modify and then click the required radio button. Then click OK to save the access rights
changes.
To remove an existing user to the system:
1. Log in with a user who has administrator access rights. The process for doing this is described above.
2. Select [Tools->Options]. The HEW tools options dialog is displayed.
3. Select the network tab. This is displayed in Figure 10.2.
4. Click the access rights button. The dialog displayed in Figure 10.4 is displayed.
5. Select the user you wish to remove in the users list.
6. Press the remove button.
7. Then click OK to save the access rights changes.
160
Figure 10. 4: User access rights dialog
10.1.4
Changing your password
To change your password:
1. Log into the HEW network database you are changing your password for. Select [Tools->Options].
The HEW tools options dialog is displayed.
2. Select the network tab. This is displayed in Figure 10.2.
3. Click the password button.
4. Enter your new password and confirm it in the second edit box.
5. Click OK.
6. Then click OK to save the password change.
10.1.5
Using the network HEW service
When you connect to a networked project for the first time the HEW automatically connects you to the correct
network HEW service. This is defined using machine name. If the service cannot be found using the machine
name in the workspace then the dialog displayed in figure 10.5 is shown. Simply type or browse to the machine
where the service is located and click OK. If you want to be the server machine then leave the radio button on
its default selection, use local machine.
161
Figure 10. 5: Select machine name
If you have previously been the server of a workspace then the following message will be displayed when you
attempt connection to another machine. This dialog is displayed in figure 10.6. Clicking OK then connects your
machine to the new location.
Figure 10. 6: Select machine name
Note: If the network is running multiple HEW workspaces with the network service enabled then a user can
only access one of them at one time. The only instance when this is not the case is if the same machine is
serving all of the network workspaces.
162
11. Difference View
The High-performance Embedded Workshop has an integrated difference view. This view allows detailed
difference comparisons to be made with local files on the drive and also with files in the version control system.
In the HEW version 3.0 onwards the Visual SourceSafe component has this facility.
The difference window can be invoked two ways. The first is from the show differences menu item on the tools
menu. The second is via the workspace window pop-up with the same name. When using the pop-up menu the
current file selection is automatically added to the edit box. Clicking the show differences menu item displays
the dialog shown below in figure 11.1.
Figure 11. 1: Difference view
1.
2.
3.
4.
5.
6.
To perform a difference comparison with two files on your local drive:
Select [Tools->Show Differences…]. The difference compare files dialog is displayed. This is shown
in figure 11.2.
Ensure the compare with file on drive radio button is enabled.
Enter the first and second file to compare. You can either select a previous difference comparison or
browse to a new file.
Clicking the advanced button displays the dialog in figure 11.3. This allows you to perform the
difference comparison without taking white space into account. Click OK when you are finished with
this options dialog.
Click compare.
The difference view is displayed. The two files being compared are loaded into each side of the split
view. Their names are at the top of each window.
To perform a difference comparison with a local file and a file in SourceSafe:
1. Ensure the SourceSafe component is enabled. Also note that the file must be have been added into the
version control system.
2. Select [Tools->Show Differences…]. The difference compare files dialog is displayed. This is shown
in figure 11.2.
3. Ensure the compare with version control radio button is enabled.
163
4. Enter the first file to compare. You can either select a previous difference comparison or browse to a
new file.
5. Clicking the advanced button displays the dialog in figure 11.3. This allows you to perform the
difference comparison without taking white space into account. Click OK when you are finished with this
options dialog.
6. Click Compare.
7. The difference view is displayed as shown in figure 11.1.
Figure 11. 2: Difference compare files dialog
Figure 11. 3: Difference advanced options dialog
The difference view functionality can be accessed in two different ways. The difference view has its own
toolbar this is shown in figure 11.4. This functionality can also be accessed via the difference window right
mouse button pop-up. This is shown in figure 11.5.
Figure 11. 4: Difference toolbar
164
Figure 11. 5: Difference popup menu
The functionality for each menu item is described below:
• Compare: This opens a new compare window so that some new files can be comapred and the
differences displayed.
• Export results to file: This opens a dialog which allows you to choose a file to export the current
difference results to a textual format.
• Ignore white space: The ignore white space option which is on the advanced options dialog can be
toggled via this menu item.
•
Find: Displays a standard find dialog. This uses the same find dialog as the HEW editor.
•
Find next: Finds the next string that meets the find requirements.
•
Find previous: Finds the next previous string that meets the find requirements.
•
Previous Difference: Automatically jumps the view to the next previous difference.
•
Next Difference: Automatically jumps the view to the next difference.
• Refresh comparison: Refreshs the view to manually run the difference comparison again. This can be
used if either file has been modified since the last comparison.
The difference window also allows the colours in the view to be customised. This procedure is outlined below:
To change the colors viewed in the difference window:
1. Select [Tools->Format Views…]. The format views dialog is displayed.
2. Expand the difference view. The dialog is shown and looks the same as figure 11.6.
3. Select the category you want to change. The color display tab is displayed and allows modification.
The categories available are Left hand side moved lines, Left hand side different lines, Right hand side
moved lines and Right hand side different lines,
4. Click OK to keep the changes.
165
Figure 11. 6: Format views dialog
166
12. Technical Support
The High-performance Embedded Workshop has a number of integrated technical support features.
To check for HEW product updates or service packs:
1. Select [Help->Technical support->Check website for updates].
2. Your default web browser is invoked and defaults to the HEW download page for your region.
3. Browse this area for HEW updates to fix bugs or add new features.
Occasionally you may experience some unforeseen problems with the HEW application. If a problem does
occur that results in a application crash the HEW bug tracking program will be invoked automatically. This
allows you to compile a bug report and this can then be sent to your technical support contact in a variety of
ways. It is also possible to invoke this tracker program manually. This is described below:
To create and send a HEW bug report:
1. Select [Help->Technical support->Create Bug Report].
2. Detailed information is generated from your HEW system. This may take some time. The bug report
dialog is then displayed. This is shown in figure 12.1.
3. It is possible to then add additional information concerning the exact issue you have found in the large
edit box.
4. Once you are happy with your report, you can choose the method of sending the report in the submit
drop list. You can print it, e-mail it, or save it to a disk.
5. Then click submit. This will send the report by the selected method.
167
Figure 12. 1: Submit bug report dialog
168
13. Navigation facilities
The High-performance Embedded Workshop has a number of integrated navigation facilities. The navigation
window is located alongside the project and templates window. This view is shown below in Figure 13.1.
Figure 13.1: Navigation view
The navigation view contains categories for all supported navigation types. In HEW 3.0 the following
navigation components are supported as standard:
• C Defines: All #defines for C and C++ source files are displayed.
• C Functions: All ANSI C standard functions are for C source files displayed.
• C++ Classes: All classes, functions and members are displayed for C++ source files.
Each category is displayed in the top level of the view. Underneath each category each project in the workspace
is displayed. Then the items belonging to that particular project are displayed below the project icon.
169
It is possible to disable scanning for certain navigation categories if you do not require the information.
To switch off a navigation category:
1. Right click on the Navigation window. The pop-up menu displayed in figure 13.2 is shown.
2. Select the “Select Categories…” menu item.
3. The dialog in figure 13.3 is displayed.
4. Uncheck any categories you are not interested in seeing definitions for.
5. Click OK.
Figure 13. 2: C++ Navigation pop-up menu
Figure 13. 3: C++ Navigation select categories dialog
Note: The navigation items are displayed gradually as the files are scanned. This means it may take some
time if there are many files to fully complete the Navigation view update.
Files are rescanned when they are saved. This means that navigation information will not be available for
new classes and functions until the file or files are saved.
170
13.1
C++ Navigation component
The C++ navigation component is the most complicated of the three supported navigation components. It
supports the following structures in the view for C++ source files. The basic structure of the information is
shown below in figure 13.4.
Figure 13. 4: C++ Navigation information
The C++ navigation view uses a number of icons to describe the type of function or variable the icon belongs too.
These are listed in the table below:
171
Figure 13. 5 C++ Navigation Icons
The navigation view allows you to move around your source code quickly and efficiently. Double clicking on a
navigation item by default jumps you to the associated navigation items definition. Normally the definition is
found in the source file and the declaration is found in the header file.
This default behavior can be modified for this action. This can be achieved via the configure view dialog. The
configure view dialog modifies the way data in the Navigation view is displayed.
To configure the C++ navigation views data:
1. Right click on a C++ navigation item in the navigation window. The pop-up menu displayed in figure
13.2 is shown.
2. Select the “Configure view” menu item.
3. The dialog in figure 13.6 is displayed.
4. Decide what items you wish to modify and click OK to accept the changes.
Figure 13. 6 C++ Configure view dialog
The following items are available on the configure view dialog.
• Group by access: This option groups the display of public, protected and private member variables and
functions together in the Navigation view.
172
•
Jump to definition on double click: By default this option is checked. If this option is switched off then
a dialog is displayed which asks you where you wish to jump. You rather than HEW resolve the
ambiguity. This dialog is shown in figure 13.7.
Figure 13. 7 Select Query Location dialog
Another useful facility is the capability of viewing the base or derived classes for a certain selection.
To view the Base or derived classes
1. Select the class that interests you in the Navigation view.
2. Right click and view the pop-up menu.
3. To see the derived classes for the selection click the “Show Derived Classes” menu item. To see the
base classes for the selection click the “Show Base Classes” menu item.
4. Depending on the selection a dialog is displayed which shows the class structure selected in an
expanded tree format.
5. Click Close to close this dialog once you have the information you require.
173
13.2
C Function and #defines navigation components
These components simply add the function and #define definitions to the Navigation view. It is then possible to
jump to these definitions by double clicking on the label you wish to view.
Figure 13. 8 C Function and #defines navigation information
174
14. Smart Editor
Another feature of the High-performance Embedded Workshop is its smart edit facility. This is enabled by
default for all C++ source files. This feature allows the HEW editor to access C++ navigation information and
provide auto-completion help when using C++ classes and member functions.
To view the Smart edit status:
1. Click on the [Tools->Options] menu item.
2. Select the “Editor” tab of the tools options dialog.
3. The dialog in figure 14.1 is displayed. The “Enable Smart-edit for C++ files” should be checked.
4. Click OK.
Figure 14.1: Options Dialog Editor Tab
With this option switched on if you are working on a C++ file the smart-edit capability should be enabled.
Note: If the C++ Class navigation category has been switched off the Smart-edit capability of HEW will
not be active.
During normal usage the following editor operations will make the smart edit facilities visible.
If you are using an object and are trying to access the members using the ‘.’ or ‘->’. If you do this a
pop-up will be displayed which may help you select the correct member more efficiently than typing.
Whilst typing the pop-up will keep track of the keys you have pressed to help your selection. If you press
175
return then the currently selected member will be added. This pop-up is also used when using the ‘::’
method and it is displayed in figure 14.2.
If you are trying to use a C++ function then the dialog in Figure 14.3 is displayed when the first open
bracket is entered. This dialog allows you to see what functions are available for the current object.
Selecting the function automatically enters the remaining parameters for you.
Figure 14.2: Smart-edit member selection
Figure 14.3: Smart -edit function selection
176
Note: Smart-edit auto completion may not pop-up for a variety of reasons. HEW can only provide help
when the file has been scanned by the navigation component. For this to work the file must have been
saved.
Another issue is that #defines are not considered so this means that redundant areas of code may still be
visible.
Another important consideration is if the syntax of your code is incorrect the smart editor may not be able
to parse your code correctly and the smart edit functionality will fail. In this case no pop-up will be
displayed.
Please note that Smart-edit does not support macro usage.
177
178
Emulator Debugger Part
Section 1 Overview
1.1
Features
• The breakpoint, memory map, performance, and trace can be set through the dialog box.
Intuitive user interface
Online help
Common display and operability
• Supported host interfaces
The PCI interface, PC card (PCMCIA) interface, USB interface, or LAN interface can be used for connecting
to the host computer.
• Realtime emulation
Realtime emulation of the user system is enabled at the maximum operating frequency of the CPU.
• Excellent operability
Using the HEW enables user program debugging using a pointing device such as a mouse. The HEW
enables high-speed downloading of load module files.
• Various debugging functions
Various break and trace functions enable efficient debugging. Breakpoints and break conditions can be set
by the specific window, trace information can be displayed on a window, and command-line functions can be
used.
• Memory access during emulation
During emulation, the memory contents can be read and modified.
179
1.2
Warnings
CAUTION
READ the following warnings before using the emulator product.
Incorrect operation will damage the user system and the emulator
product. The USER PROGRAM will be LOST.
1. Check all components against the component list after unpacking the emulator.
2. Never place heavy objects on the casing.
3. Do not place the emulator in places where:
• The temperature becomes high such as in direct sunlight or near a heater. For details, refer to section 1.3,
Environmental Conditions.
• The temperature or humidity changes greatly.
• There is a lot of dust.
• There is a lot of vibration. For details, refer to section 1.3, Environmental Conditions.
4. Protect the emulator from excessive impacts and stresses.
5. Only supply the specified voltage and power-supply frequency.
6. When moving the emulator, take care not to vibrate or damage it.
7. After connecting the cable, check that it is connected correctly. For details, refer to section 2, Preparation
before Use. Supply power to the connected equipment after connecting all cables. For the supplying
procedures, refer to section 2.7, System Check. Cables must not be connected or disconnected while the
power is on.
180
1.3
Environmental Conditions
CAUTION
Observe the conditions listed in table 1.1 when using the emulator.
Failure to do so will cause illegal operation in the user system, the
emulator product, and the user program.
Table 1.1 Environmental Conditions
Item
Specifications
Temperature
Operating: +10°C to +35°C
Storage: –10°C to +50°C
Humidity
Operating: 35% RH to 80% RH, no condensation
Storage: 35% RH to 80% RH, no condensation
Vibration
Operating:
2.45 m/s2 max.
2
Storage:
4.9 m/s max.
2
Transportation: 14.7 m/s max.
Ambient gases
No corrosive gases may be present
1.4
Emulator External Dimensions and Mass
Table 1.2 Emulator External Dimensions and Mass
Item
Specifications
Dimensions
219 × 170 × 54 mm
Mass
Approximately 1,000 g
181
182
Section 2 Preparation before Use
2.1
Emulator Preparation
Unpack the emulator and prepare it for use as follows:
WARNING
READ the reference sections shaded in figure 2.1 before using the
emulator product. Incorrect operation will damage the user system and
the emulator product. The USER PROGRAM will be LOST.
Reference
Unpack the emulator
Component list
Check the components against
the component list
Setup
Set up the emulator
- Insert the optional board
- Install the HEW
- Connect the interface cable
Turn on the user system
(Only when the user system is connected)
Section 3
Section 4
Turn on the emulator
Activation
Start the HEW
Figure 2.1 Emulator Preparation Flowchart
2.2
Installing Emulator’s Software
To install the HEW, refer to the Setup Guide for the E6000 Emulator supplied together with the emulator.
183
2.3
Connecting to the User System
To connect the emulator to a user system, proceed as follows:
• Connect the user system interface cable head to the user system.
• Plug the cable body into the emulator.
• Plug the cable body into the cable head.
For details of these steps, refer to the User System Interface Cable User’s Manual.
Figure 2.2 gives details of the connectors provided on the emulator.
PC interface cable
connector
User system
interface connector
Power connector
POWER RUN
Power switch
External probe
connector
Screw
Screw
Figure 2.2 E6000 Emulator Connectors
2.3.1
Example of Connecting the User System Interface Cable Head to the User System
Screw (× 4)
User system interface
cable head
IC socket
Figure 2.3 Example of Connecting User System Interface Cable Head to User System
• Ensure that all power is off to the emulator and the user system.
• Insert the cable head into the socket on the user system.
Note: Depending upon the package, it may be possible to orientate this cable head in any position on the socket,
so care should be taken to correctly identify pin 1 on the emulator and socket when installing.
184
• Screw the cable head to the socket with the screws provided. Progressively tighten the screws in the sequence
shown in figure 2.4 until all are ‘finger tight’.
1
3
4
2
Figure 2.4 Sequence of Screw Tightening
Note: Be careful not to over-tighten the screws as this may result in contact failure on the user system or
damage the cable head. Where provided, use the ‘solder lugs’ on the QFP socket to provide extra
strength to the emulator/user system connection.
2.3.2
Plugging the User System Interface Cable Body into the Emulator
Plug the cable body into the emulator, taking care to insert it straight, and push it firmly into place.
User system interface cable body
User system interface cable head
EXT2
POWER RUN
EXT1
Emulator
User system interface cable
Figure 2.5 Plugging User System Interface Cable Body to Emulator
2.3.3
Plugging the User System Interface Cable Body into the Cable Head
Plug the cable body into the cable head on the user system.
185
2.4
Power Supply
2.4.1
AC Adapter
The AC adapter supplied with the emulator must be used at all times.
2.4.2
Polarity
Figure 2.6 shows the polarity of the power-supply plug.
5 V (outside)
GND (inside)
Figure 2.6 Polarity of Power Supply Plug
2.4.3
Power Supply Monitor Circuit
The emulator incorporates a power supply monitor circuit which only lights the red LED when a voltage higher
than 4.75 V is supplied. If this LED is not illuminated, you should check the emulator voltage level. An input
voltage less than 4.75 V could indicate that enough current cannot be supplied to the emulator.
Note: Use the provided AC adapter for the emulator.
2.5
SIMM Memory Module
E6000 emulator’s optional SIMM memory modules are available which provide emulation memory for user
code without needing a user system. The optional SIMM memory modules are available in different memory
size, but all are partitioned into four equal banks. These banks can be relocated on page boundaries anywhere in
the user area. Note that, however, some products do not support the SIMM memory module.
2.5.1
Optional SIMM Memory Module Configuration
The configuration of the optional SIMM memory module is controlled by the mapping RAM. Opening the
[Memory] sheet of the [System Status] window allows you to check which optional SIMM memory module, if
any, is installed and also allows the four banks to be relocated to the required addresses from the [Memory
Mapping] dialog box.
186
2.6
Hardware Interface
All signals are directly connected to the MCU in the emulator with no buffering with the exception of those
listed in section 7, Hardware Specifications Specific to This Product.
2.6.1
Signal Protection on the emulator
All signals are over/under voltage protected by use of diode arrays. The only exceptions being the AVCC and Vref.
All ports have pull-up resistors except for analog port.
All VCC pins on the cable head assembly are connected together (with the exception of the AVCC pin), and are
then monitored by the emulator to detect powered user system presence.
2.6.2
User System Interface Circuits
The interface circuit between the MCU in the emulator and the user system has a signal delay of about 8 ns due
to the user system interface cable and it includes pull-up resistors. Therefore, high-impedance signals will be
pulled up to the high level. When connecting the emulator to a user system, adjust the user system to compensate
for propagation delays.
The following diagrams show the equivalent circuit examples of the interface signals. The interface circuits
depend on the MCU type. For details, refer to section 7, Hardware Specifications Specific to This Product.
2.6.3
Clock Oscillator
The oscillator circuit has been implemented on the user system interface cable head. For details on the oscillator
circuit, refer to the user's manual for each user system interface cable.
2.6.4
External Probe 1 (EXT1)/Trigger Output
An 8-pin connector, marked EXT1 (on the right under the user system interface cable connector), on the
emulator case accommodates four external probe inputs and two trigger outputs. The pin assignment of this
connector is shown in figure 2.7.
EXT1
1
2
3
Probe
4
GND GND
TUVCC T5V
Trigger output
Figure 2.7 External Probe Connector 1
187
The interface circuit for the external probe 1 is shown in figure 2.8.
Vcc
10 kΩ
External probe 1, 2, 3, 4
HD151015
22 Ω
Figure 2.8 Interface Circuit for External Probe 1
The trigger output is controlled by event channel 8 and is an active low signal. The trigger output is available as
either T5V (within the range from 2.5 V to 5 V; does not depend on the user VCC level) or TUVCC (the user VCC
level).
2.6.5
External Probe 2 (EXT2)/Trigger Output
A 6-pin connector, marked EXT2 (on the left under the user system interface cable connector), on the emulator
case accommodates four trigger outputs. The pin assignment of this connector is shown in figure 2.9.
EXT2
5
1
2
3
6
4
Trigger output
Figure 2.9 External Probe 2 Connector
The trigger output is an active high signal which is output during the read or write cycles when a trace condition
(1 to 4) of the bus monitor function is satisfied. The trigger output is available as user VCC level. Note that,
however, some products do not support the external probe 2 (EXT2).
188
2.6.6
Voltage Follower Circuit
CAUTION
1. Do not connect the user system interface cable to the emulator
without user system connection.
2. Turn on the user system before starting up the emulator.
A voltage follower circuit is implemented on the emulator which allows the user system voltage level from the
user system to be monitored. This monitored voltage level is automatically supplied to the logic on the emulator
and is derived from the emulator power supply unit. This means that no power is taken from the user system
board.
If no user system interface cable is connected to the emulator, the emulator will operate at a specified voltage
and all clock frequencies will be available to the user. If the user system interface cable is attached, the emulator
will match the voltage supplied to the user target in all cases; i.e. even when the user VCC is below the operating
voltage for the MCU. You must be careful not to select an invalid clock frequency. When the emulator is
connected to the user system and the user system is turned off, the voltage follower circuit output voltage level is
0 V. In this case, the emulator will not operate correctly.
You can set a user VCC threshold in the range Vcc max. – 0 V by using the emulator configuration dialog box. If
the user VCC drops below this threshold, [User System Voltage] in the [Extended Monitor] window will display
Down, otherwise OK is displayed.
3.3 V
User
threshold
User Vcc level
0V
User Vcc
threshold
OK
Down
3.3 V
E6000
Vcc level
0V
The user system interface
cable is not connected.
Figure 2.10 Voltage Level Monitoring (Example for Vcc = 3.3 V)
189
2.7 System Check
When the software is executed, use the procedure below to check that the emulator is connected correctly. Here,
use the workspace for a tutorial provided on the product.
Refer to section 2.9, Other Methods for Activating the Emulator, for the other activating method to create a new
project or use a workspace for the HEW of the old version.
1.
2.
3.
4.
Connect the emulator to the host computer.
Connect the user system interface cable to the connector of the emulator.
Turn on the emulator.
Activate the HEW from the [Programs] in the [Start] menu (figure 2.11).
Figure 2.11 [Start] Menu
Note: If ‘LAN Driver’ is not selected at installation, [Tools] is not displayed.
190
5. The [Welcome!] dialog box is displayed.
Figure 2.12 [Welcome!] Dialog Box
To use a workspace for the tutorial, select the [Browse to another project workspace] radio button and click the
[OK] button.
When the [Open Workspace] dialog box is opened, specify the following directory:
HEW installation destination directory\Tools\Renesas\DebugComp\Platform\E6000\xxxx\Tutorial
After the directory has been specified, select the following file and click the [Open] button.
Figure 2.13 [Open Workspace] Dialog Box
191
When no compiler package or that of a different version is installed, the following message box will be displayed.
Figure 2.14 Message Box
6. The [E6000 Driver Details] dialog box is displayed. This dialog box is only displayed at the first initiation.
When only one of interface drivers is selected, this dialog box is not displayed.
Figure 2.15 [E6000 Driver Details] Dialog Box
• In the [Driver] combo box, select the driver to connect the emulator.
• [Interface] displays the name of the interface to be connected.
• Click the [Close] button.
192
7. Set up the emulator. During this process, the following dialog box is displayed.
Figure 2.16 [Connecting] Dialog Box
8. When "Connected" is displayed in the [Output] window of the HEW, the emulator initiation is completed.
Figure 2.17 HEW Window
193
2.8
Communication Problems
The following message box will be displayed when the emulator power is turned off or the PC interface cable is
not correctly connected.
Figure 2.18 Error Message
For information on other errors, refer to the Setup Guide for the E6000 Emulator.
2.9 Other Methods for Activating the Emulator
Refer to section 4, Preparation before Use.
2.10 Uninstalling the Emulator’s Software
For details on uninstallation, refer to the Setup Guide for the E6000 Emulator.
194
Section 3 E6000 Emulator Functions
3.1
Debugging Features
3.1.1
Breakpoints
The emulator provides a comprehensive range of alternative types of breakpoints, to give you the maximum
flexibility in debugging applications and user system.
Hardware Break Conditions: Up to 12 break conditions can be defined using the event and range channels in
the complex event system (CES). For more information about the hardware break conditions, see section 3.2,
Complex Event System (CES).
Program Breakpoints (PC Breakpoints): Up to 256 program breakpoints can be defined. These program
breakpoints are set by replacing the user instruction by a BREAK instruction. In target ROM, only one
breakpoint (on-chip break) can be set.
3.1.2
Trace
The emulator incorporates a powerful realtime trace facility which allows you to examine MCU activity in detail.
The realtime trace buffer holds up to 32768 bus cycles, and it is continuously updated during execution. The
buffer is configured as a rolling buffer, which can be stopped during execution and read back by the host
computer without halting emulation.
The data stored in the trace buffer is displayed in both source program and assembly languages for ease of
debugging. However, if trace filtering is used, only assembly language can be displayed.
The buffer can be set up to store all bus cycles or just selected cycles. This is called trace acquisition and uses the
complex event system (CES) to select the parts of the program you are interested in.
It is also possible to store all bus cycles and then just look at selected cycles. This is called trace filtering.
3.1.3
Execution Time Measurements
The emulator allows you to measure the total execution time, or to measure the time of execution between
specified events in the complex event system. You can set the resolution of the timer to any of the following
values:
20 ns, 125 ns, 250 ns, 500 ns, 1 µs, 2 µs, 4 µs, 8 µs, or 16 µs.
At 20 ns the maximum time that can be measured is about six hours, and at 16µs the maximum time is about 200
days.
3.1.4
Performance Analysis
The emulator provides functions for measuring the performance of a program. The performance of the specified
program range can be displayed either as a histogram or in percentage form. A timer resolution of 20 ns, 40 ns,
or 160 ns can be selected. In addition, the execution count of the specified program range can be measured (1 to
65535).
195
3.1.5
Bus Monitoring
The emulator incorporates a bus monitoring function that monitors and displays the contents of the accessed area
in HEW windows without stopping the program execution. Up to eight blocks of 256 bytes can be monitored.
In addition, the emulator can output trigger signals from external probe 2 (EXT2) when specified addresses (four
points max.) are accessed. Note that, however, some products do not support the bus monitoring function.
3.2
Complex Event System (CES)
In most practical debugging applications, the program or hardware errors that you are trying to debug occur
under a certain restricted set of circumstances. For example, a hardware error may only occur after a specific
area of memory has been accessed. Tracking down such problems using simple PC breakpoints can be very
time-consuming.
The emulator provides a very sophisticated system for giving a precise description of the conditions you want to
examine, called the complex event system. This allows you to define events which depend on the state of a
specified combination of the MCU signals.
The complex event system provides a unified way of controlling the trace, break, and timing functions of the
emulator.
3.2.1
Event Channels
The event channels allow you to detect when a specified event has occurred. The event can be defined as a
combination of one or more of the followings:
•
•
•
•
•
•
•
•
•
Address or address range
Address outside range
Read or Write or either
Data, with an optional mask
MCU access type (e.g., DMAC and instruction prefetch)
MCU access area (e.g., on-chip ROM and on-chip RAM)
A signal state on one or more of the four external probes
A certain number of times that the event must be triggered
Delay cycles after an event
Up to eight events can be combined into a sequence, in which each event is either activated or deactivated by the
occurrence of the previous event in the sequence. For example, you can cause a break if an I/O register is written
to after a specified area of RAM has been accessed.
3.2.2
Range Channels
The range channels can be set up to be triggered on a combination of one or more of the following:
•
•
•
•
•
•
•
Address or address range (inside the range)
Read or Write or either
Data, with an optional mask
MCU access type (e.g., DMAC and instruction prefetch)
MCU access area (e.g., on-chip ROM and on-chip RAM)
A signal state on one or more of the four external probes
Delay cycles after an event
The complex event system can be used to control the following functions of the emulator:
196
3.2.3
Breaks
Use breaks to interrupt program execution when a specified event, or sequence of events, is activated. For
example, you can set up a break to halt execution when the program reads from one address, and then writes to
another address. The break can also optionally be delayed by up to 65535 bus cycles.
3.2.4
Timing
You can set up two events and then measure the execution time of the program between the activation of the first
event and second event.
3.3
Hardware Features
3.3.1
Memory
The emulator provides standard emulation memory as the substitute for on-chip ROM memory and on-chip
RAM memory. When a device type or device mode without an on-chip ROM or on-chip RAM is selected, the
standard emulation memory is disabled. When debugging with only the emulator and the user program and data
are stored in an external address space, an optional SIMM memory module must be used. The optional SIMM
memory modules can be separately purchased.
The emulation memory can be mapped in 64-byte units to any number of separate memory blocks in the MCU
address space. Each memory block can be specified using the memory mapping function as user (Target) or
emulator (SIMM memory module) and, in each case, the access can be specified as read-write, read-only, or
guarded.
The definition of each type of memory is as follows:
Table 3.1
Memory Types
Memory Type
Description
On-chip
Uses the MCU on-chip memory.
User
Accesses the user system memory.
Emulator
Accesses the emulator SIMM memory module.
The contents of a specified block of memory can be displayed using the memory function. The contents of
memory can be modified at any time, even during program execution and the results are immediately reflected in
all other appropriate windows.
Note that modifying memory contents during program execution has the following time requirements:
1. MCU on-chip ROM or RAM, or emulator SIMM memory module
The emulator modifies the memory contents by temporarily switching the memory bus to the emulator side
without stopping the user program execution. Therefore, the emulator uses the memory bus for up to 80 µs in
reading of 256 bytes (25 MHz, on-chip ROM).
2. MCU on-chip I/O, DTCRAM, or user system memory
The emulator stops the user program execution, then modifies the memory contents. Therefore, the user
program stops for a maximum of 2 ms in reading 256 bytes (25 MHz, emulation memory).
197
3.3.2
Clocks
The clock can be specified as emulator internal clock or target clock. The frequencies that can be specified as
the emulator internal clock depend on the MCU. For details, refer to section 8, Software Specifications Specific
to This Product.
3.3.3
Probes
External probes 1 and 2 (EXT1 and EXT2) can be connected to the emulator, to make use of signals on the user
system for break or trace. The signal for external probe 1 can be set as the condition for the event detection
system depending on the low or high level. Since the signal for external probe 2 outputs high level when the
trigger setting (1 to 4) condition is matched in the bus monitor function, the signal can be used for the trigger
condition for such as an oscilloscope.
3.4 Stack Trace Function
The emulator uses the stack’s information to display the name of the calling function for a function at which the
program counter is currently pointing. This function can be used only when the load module that has the
Dwarf2-type debugging information is loaded. For the usage of this function, refer to section 6.17, Stack Trace
Function.
3.5 Online Help
An online help explains the usage of each function or the command syntax that can be entered from the
command line window.
Select [Emulator Help] from the [Help] menu to view the emulator help.
198
Section 4 Preparation before Use
4.1
Workspaces, Projects, and Files
Just as a word processor allows you to create and modify documents, HEW allows you to create and modify
workspaces. A workspace can be thought of as a container of projects and, similarly, a project can be though of
as a container of project files. Thus, each workspace contains one or more projects and each project contains one
or more files. Figure 4.1 illustrates this graphically.
PROJECT
FILE
PROJECT
FILE
WORKSPACE
FILE
PROJECT
Figure 4.1 Workspaces, Projects, and Files
Workspaces allow you to group related projects together. For example, you may have an application that needs
to be built for different processors or you may be developing an application and library at the same time. Projects
can also be linked hierarchically within a workspace, which means that when one project is built all of its “child”
projects are built first.
We need to add a project to a workspace and then add files to that project before we can actually do anything.
199
4.2
Method for Activating HEW
To activate the HEW, follow the procedure listed below.
1. Connect the emulator to the host computer.
2. Connect the user system interface cable to the connector of the emulator if you use the user system interface
cable. This is not necessary when you do not use the user system interface cable.
3. Turn on the emulator. Be sure to turn on the user system before supplying power to the emulator if you use
the user system.
4. Activate the HEW from [Programs] in the [Start] menu.
5. The [Welcome!] dialog box is displayed.
Figure 4.2 [Welcome!] Dialog Box
[Create a new project workspace] radio button: Creates a new workspace.
[Open a recent project workspace] radio button: Uses an existing workspace and displays the history of the
opened workspace.
[Browse to another project workspace] radio button: Uses an existing workspace; this radio button is used when
the history of the opened workspace does not remain.
In this section, we describe the following three ways to start up the HEW:
•
[Create a new project workspace] - a toolchain is not in use
•
[Create a new project workspace] - a toolchain is in use
•
[Browse to another project workspace]
The method to create a new workspace depends on whether a toolchain is or is not in use. Note that this emulator
product does not include a toolchain. Use of a toolchain is available in an environment where the H8S, H8/300
series C/C++ compiler package has been installed. For details on this, refer to the manual attached to the H8S,
H8/300 series C/C++ compiler package.
200
4.2.1
Creating a New Workspace (Toolchain Not Used)
1. In the [Welcome!] dialog box that is displayed when the HEW is activated, select [Create a new project
workspace] radio button and click the [OK] button.
Figure 4.3 [Welcome!] Dialog Box
201
2. Creation of a new workspace is started. The following dialog box is displayed.
Figure 4.4 [New Project Workspace] Dialog Box
[Workspace Name] edit box: Enter the new workspace name.
[Project Name] edit box: Enter the project name. When the project name is the same as the workspace name,
it needs not be entered.
[Directory] edit box: Displays the directory in which the workspace will be created. Click the [Browse…]
button to select a directory name or enter a directory name in the [Directory] edit box.
Other list boxes are used for setting the toolchain; the fixed information is displayed when the toolchain has not
been installed.
202
3. Make the required setting for the toolchain. When the setting has been completed, the following dialog box
is displayed.
Figure 4.5 [New Project – Step 7] Dialog Box
The target for the session file used when the HEW is activated must be selected here. Check the box
against the target platform and then click the [Next] button. For details on the session file, refer to section
4.4, Debug Sessions.
203
4. Set the configuration file name. The configuration file saves the state of HEW except for the emulator.
Figure 4.6 [New Project – Step 8] Dialog Box
If multiple target platforms were selected in the [New Project – Step 7] dialog box shown in figure 4.5, set
the name of a configuration file for each of them, each time pressing the [Next] button to proceed to the next
target.
Setting of the configuration file name is the end of the emulator settings.
Click the [Finish] button to display the [Summary] dialog box. Pressing the [OK] button activates the HEW.
5. After the HEW has been activated, the emulator is automatically connected. The message “Connected” is
displayed on the [Debug] tab in the [Output] window to indicate the completion of connection.
204
4.2.2 Creating a New Workspace (Toolchain Used)
1. In the [Welcome!] dialog box that is displayed when the HEW is activated, select [Create a new project
workspace] radio button and click the [OK] button.
Figure 4.7 [Welcome!] Dialog Box
205
2. Creation of a new workspace is started. The following dialog box is displayed.
Figure 4.8 [New Project Workspace] Dialog Box
[Workspace Name] edit box: Enter the new workspace name. Here, enter ‘test’.
[Project Name] edit box: Enter the project name. When the project name is the same as the workspace name,
it needs not be entered.
[Directory] edit box: Displays the directory in which a workspace will be created. Click the [Browse…]
button to select a directory or enter the name of a directory in the [Directory] edit box.
[CPU family] combo box: Select the target CPU family.
[Tool chain] combo box: Select the target toolchain name when using the toolchain. Otherwise, select
[None].
[Project type] list box: Select the project type to be used.
Notes: 1. When [Demonstration] is selected in the emulator, note the followings:
The [Demonstration] is a program for the simulator attached to the H8S, H8/300 compiler package.
To use the generated source file, delete the Printf statement in the source file.
206
3. Make the required setting for the toolchain. When the setting has been completed, the following dialog box
is displayed.
Figure 4.9 [New Project – Step 7] Dialog Box
The target for the session file used when the HEW is activated must be selected here. Check the box against
the target platform and then click the [Next] button. For details on the session file, refer to section 4.4, Debug
Sessions.
207
4. Set the configuration file name. The configuration file saves the state of HEW except for the emulator.
Figure 4.10 [New Project – Step 8] Dialog Box
If multiple target platforms were selected in the [New Project – Step 7] dialog box shown in figure 4.9, set
the name of a configuration file for each of them, each time pressing the [Next] button to proceed to the next
target.
Setting of the configuration file name is the end of the emulator settings.
Complete the creation of a new workspace according to the instructions on the screen. This activates the
HEW.
5. After the HEW has been activated, connect the emulator. However, it is not necessary to connect the
emulator immediately after the HEW has been activated.
Select either of the following two ways to connect the emulator: connecting the emulator after the setting at
emulator activation or without the setting at emulator activation. For details on the connection of the
emulator, refer to section 4.5, Connecting the Emulator.
208
4.2.3 Selecting an Existing Workspace
1. In the [Welcome!] dialog box that is displayed when the HEW is activated, select [Browse to another project
workspace] radio button and click the [OK] button.
Figure 4.11 [Welcome!] Dialog Box
2. The [Open Workspace] dialog box is displayed. Select a directory in which you have created a workspace.
After that, select the workspace file (.hws) and press the [Open] button.
Figure 4.12 [Open Workspace] Dialog Box
3. This activates the HEW and recovers the state of the selected workspace at the time it was saved.
When the saved state information of the selected workspace includes connection to the emulator, the
emulator will automatically be connected. To connect the emulator when the saved state information does not
include connection to the emulator, refer to section 4.5, Connecting the Emulator.
209
4.3
Setting at Emulator Activation
When the emulator is activated, the command chain can automatically be executed. It is also possible to register
multiple load modules to be downloaded. The registered load modules are displayed on the workspace window.
1. Select [Debug Settings…] from the [Options] menu to open the [Debug Settings] dialog box.
Figure 4.13 [Debug Settings] Dialog Box ([Target] Page)
2. Select the product name to be connected in the [Target] combo box.
3. Select the format of the load module to be downloaded in the [Default Debug Format] combo box, then
register the corresponding download module in the [Download Modules] list box.
4. Click the [Options] tab.
210
Figure 4.14 [Debug Settings] Dialog Box ([Options] Page)
The command chain that is automatically executed at the specified timing is registered. The following three
timings are available:
• At connecting the emulator
• Immediately before downloading
• Immediately after downloading
Specify the timing for executing the command chain in the [Command batch file load timing] combo box. In
addition, register the command-chain file that is executed at the specified timing in the [Command Line Batch
Processing] list box.
211
4.4
Debug Sessions
The HEW stores all of your builder options into a configuration. In a similar way, the HEW stores your
debugger options in a session. The debugging platforms, the programs to be downloaded, and each target
platform’s options can be stored in a session.
Sessions are not directly related to a configuration. This means that multiple sessions can share the same
download module and avoid unnecessary program rebuilds.
Each session’s data should be stored in a separate file in the HEW project. Debug sessions are described in
detail below.
4.4.1
Selecting a Session
The current session can be selected in the following two ways:
• From the toolbar
Select a session from the combo box (figure 4.15) in the toolbar.
Figure 4.15 Toolbar Selection
• From the dialog box
1. Select [Options -> Debug Sessions…]. This will open the [Debug Sessions] dialog box (figure 4.16).
Figure 4.16 [Debug Sessions] Dialog Box
2. Select the session you want to use from the [Current session] combo box.
3. Click the [OK] button to set the session.
212
4.4.2
Adding and Removing Sessions
A new session can be added by copying settings from another session or removing a session.
• To add a new empty session
1. Select [Options -> Debug Sessions…] to display the [Debug Sessions] dialog box (figure 4.16).
2. Click the [Add…] button to display the [Add new session] dialog box (figure 4.17).
3. Check the [Add new session] radio button.
4. Enter a name for the session.
5. Click the [OK] button to close the [Debug Sessions] dialog box.
6. This creates a file with the name entered in step 4. If a file with this name already exists, an error is
displayed.
Figure 4.17 [Add new session] Dialog Box
213
• To import an existing session into a new session file
1. Select [Options -> Debug Sessions…] to display the [Debug Sessions] dialog box (figure 4.16).
2. Click the [Add…] button to display the [Add new session] dialog box (figure 4.17).
3. Check the [Use an existing session file] radio button.
4. Enter a name for the session.
5. Enter the file name of an existing session file that you would like to import into the current project or
click the [Browse…] button to select the file location.
If the [Open and maintain link to session file] check box is not checked, the imported new session file is
generated in the project directory.
If the [Open and maintain link to session file] check box is checked, a new session file is not generated in
the project directory but is linked to the current session file.
If the [Make session file link read only] check box is checked, the linked session file is used as read-only.
6. Click the [OK] button to close the [Debug Sessions] dialog box.
• To remove a session
1. Select [Options -> Debug Sessions…] to display the [Debug Sessions] dialog box (figure 4.16).
2. Select the session you would like to remove.
3. Click the [Remove] button.
Note that the current session cannot be removed.
4. Click the [OK] button to close the [Debug Sessions] dialog box.
• To view the session properties
1. Select [Options -> Debug Sessions…] to display the [Debug Sessions] dialog box (figure 4.16).
2. Select the session you would like to view the properties for.
3. Click the [Properties] button to display the [Session Properties] dialog box (figure 4.18).
Figure 4.18 [Session Properties] Dialog Box
214
• To make a session read-only
1. Select [Options -> Debug Sessions…] to display the [Debug Sessions] dialog box (figure 4.16).
2. Select the session you would like to make read-only.
3. Click the [Properties] button to display the [Session Properties] dialog box (figure 4.18).
4. Check the [Read only] check box to make the link read-only. This is useful if you are sharing debuggersetting files and you do not want data to be modified accidentally.
5. Click the [OK] button.
• To save a session with a different name
1. Select [Options -> Debug Sessions…] to display the [Debug Sessions] dialog box (figure 4.16).
2. Select the session you would like to save.
3. Click the [Save as] button to display the [Save Session] dialog box (figure 4.19).
4. Specify the location to save the new file.
5. If you want to export the session file to another location, leave the [Maintain link] check box unchecked.
If you would like the HEW to use this location instead of the current session location, check the
[Maintain link] check box.
6. Click the [OK] button.
Figure 4.19 [Save Session] Dialog Box
4.4.3
Saving Session Information
• To save a session
Select [File -> Save Session].
215
4.5 Connecting the Emulator
Select either of the following two ways to connect the emulator:
(a) Connecting the emulator after the setting at emulator activation
Select [Debug Settings…] from the [Options] menu to open the [Debug Settings] dialog box. It is possible to
register the download module or the command chain that is automatically executed at activation. For details
on the [Debug Settings] dialog box, refer to section 4.3, Setting at Emulator Activation.
When the dialog box is closed after setting the [Debug Settings] dialog box, the emulator will automatically
be connected.
(b) Connecting the emulator without the setting at emulator activation
Connect the emulator by simply switching the session file to one in which the setting for the emulator use has
been registered.
Figure 4.20 Selecting the Session File
In the list box that is circled in figure 4.20, select the session name including the character string that has been
set in the [Target name] text box in figure 4.10, [New Project – Step 8] dialog box. The setting for using the
emulator has been registered in this session file.
After the session name is selected, the emulator will automatically be connected. For details on the session file,
refer to section 4.4, Debug Sessions.
216
4.6 Reconnecting the Emulator
When the emulator is disconnected, use the following way for reconnection:
Select [Build -> Debug -> Connect] or click the [Connect] toolbar button (
). The emulator is connected.
Note: Before reconnecting the emulator, a load module must be registered to the HEW. For registration, refer
to section 4.3, Setting at Emulator Activation.
4.7 Ending the Emulator
When using the toolchain, the emulator can be exited by using the following two methods:
• Canceling the connection of the emulator being activated
• Exiting the HEW
(1) Canceling the connection of the emulator being activated
Select [Disconnect] from the [Debug] menu or click the [Disconnect] toolbar button (
).
(2) Exiting the HEW
Select [Exit] from the [File] menu.
A message box is displayed. If necessary, click the [Yes] button to save a session. After saving a session, the
HEW exits. If not necessary, click the [No] button to exit the HEW.
Figure 4.21 [Session has been modified] Message Box
217
218
Section 5 Debugging
This section describes the debugging operations and their related windows and dialog boxes.
5.1
Setting the Environment for Emulation
5.1.1
Opening the [Configuration Properties] Dialog Box
Selecting [Options -> Emulator -> System…] or clicking the [Emulator System] toolbar button (
Configuration Properties] dialog box.
) opens the
Figure 5.1 [Configuration Properties] Dialog Box ([General] Page)
This dialog allows the user to set conditions for the target MCU before downloading a program to the emulator.
219
[General] page
[Device]
Selects the MCU to be emulated. To use an MCU not included in the list,
select CUSTOM to specify the functions required for this MCU. See the
hardware manual for details.
[Mode]
Selects the MCU's operating mode.
[Clock]
Selects the speed of the MCU’s clock and sub-clock.
[Timer Resolution]
Selects the resolution of the timer for use in execution time measurement.
The value 20 ns, 125 ns, 250 ns, 500 ns, 1 us, 2 us, 4 us, 8 us, or 16 us
can be selected.
The timer for execution time measurement has a 40-bit counter.
At 20 ns the maximum time that can be measured is about six hours, and
at 16 µs the maximum time is about 200 days.
When the counter overflows, the maximum time possible for
measurement will be displayed with prompt “>” that indicates that the
counter has overflowed.
[Enable read and write on the
fly]
When this box is checked, it is possible to access the target system
memory while the user program is running. Do not check this check box if
you require realtime emulation.
[Break on access error]
When this box is checked, a break (the user program stops) occurs if
your program accesses a guarded memory area or writes to a writeprotected area.
[Enable internal ROM area write]
When this box is checked, writing to the internal ROM area is enabled.
For the result of writing, see the [Extended Monitor] window.
[User VCC Threshold]
Sets the voltage level for the user system.
[User Signals]
When this box is checked, the reset, NMI, standby, and bus request
signals from the user system are enabled.
[Driver]
Displays the E6000 driver that is currently installed.
[Change driver in start up]
When this box is checked, selection of a driver will be available next time
the emulator is connected.
Note: The items that can be set in this dialog box vary according to the emulator in use. For details, refer to
section 8, Software Specifications Specific to This Product, or the online help.
220
5.1.2
Selecting an MCU Not Included in the List
Selecting [Custom] in [Device] of the [Configuration Properties] dialog box adds the [Custom Device] page to
the dialog box.
Figure 5.2 [Configuration Properties] Dialog Box ([Custom Device] Page)
Use this page to specify functions for an MCU not included in the list of MCUs. The items are adopted by the
device last selected.
[Custom Device] page
[ROM]
Specify the internal ROM area size.
[RAM]
Specify the internal RAM area size.
[Pin]
Specify the product package.
[Modules]
Check this box to validate on-chip peripherals.
Note: The items that can be set in this dialog box vary according to the emulator in use. Some emulators may
not support the [Custom Device] function. For details, refer to section 8, Software Specifications
Specific to This Product, or the online help.
221
5.1.3
Selecting the Interface to be Connected
Checking [Change driver in start up] on the [Configuration Properties] dialog box allows a selection of the driver
next time the emulator is connected.
Figure 5.3 [Driver Details] Dialog Box
[Driver]:
Selects the driver that connects the HEW and the emulator.
[Details]:
Sets the details of the driver being connected.
[Interface]:
The name of the interface to be connected. This should not be changed in this
emulator.
[Channel]:
Channel for the selected interface. This should not be changed in this emulator.
[Configuration]: Driver setting.
[Configure…]:
A dialog box for setting will be displayed when the driver supports the configuration
dialog. Note that this item is not available with this emulator.
[Change driver in start up]:
Checking this box selects the driver when the emulator is connected the next time.
222
5.1.4
Opening the [Memory Mapping] Dialog Box
Selecting [Options -> Emulator -> Memory Resource…] or clicking the [Emulator Memory Resource] toolbar
button ( ) opens the [Memory Mapping] dialog box.
Figure 5.4 [Memory Mapping] Dialog Box
This dialog box displays the current memory map. The E6000 H8S or H8/300 series supports four blocks of user
memory. These can be 256 kbyte or 1 Mbyte each, depending on the SIMM fitted. Each block can be placed in
the address space on a 256-kbyte or 1-Mbyte boundary.
The memory mapping has a granularity of H'40 (D'64) byte. Each 64-byte block can be set to the internal
(emulation) or external memory and can be guarded (access-prohibited), write-protected or read-write.
The H8/300 series E6000 generally incorporates an emulation memory.
In the memory map, the memory can be set as an internal (emulation) or external, guarded (access-prohibited),
write-protected, or read/write in a byte unit.
[Add...]:
Displays the [Edit Memory Mapping] dialog box, allowing the user to modify the address
range and attributes of a memory map.
[Modify...]:
Displays the [Edit Memory Mapping] dialog box, allowing the user to modify the address
range and attributes of a memory map.
[Reset]:
Resets the map memory to its default settings.
[Close]:
Closes the dialog box.
The memory configuration of the device being emulated is displayed by the [Memory] sheet in the [Status]
window.
Note: Some emulators may not support the emulation memory or the memory mapping function. For details,
refer to section 8, Software Specifications Specific to This Product, or the online help.
223
5.1.5
Changing the Memory Map Setting
Clicking the [Add…] button on the [Memory Mapping] dialog box or clicking the [Modify…] button after
selecting the information on the memory map setting you want to change opens the [Edit Memory Mapping]
dialog box.
Figure 5.5 [Edit Memory Mapping] Dialog Box
Use this dialog box to change the address range and attributes of a memory map.
[From]:
Enter the start address of the map range.
[To]:
Enter the end address of the map range.
[Setting]:
Enter the memory map setting.
The choices given are listed below. The User (external memory) and Emulator (emulation
memory) attributes can be modified.
224
•
On-chip Read-write (Cannot be changed)
•
On-chip Read-only (Cannot be changed)
•
On-chip Guarded (Cannot be changed)
•
User Read-write (Cannot be selected when the single chip mode is selected.)
•
User Read-only (Cannot be selected when the single chip mode is selected.)
•
User Guarded
•
Emulator Read-write
•
Emulator Read-only
•
Emulator Guarded
5.2
Downloading a Program
This section describes how to download a program and view it as source code or assembly-language mnemonics.
Note: After a break occurs, the HEW displays the location of the program counter (PC) on the editor. In most
cases, for example if an Elf/Dwarf2 based project is moved from its original path (at the build), the
source file may not be automatically found. In this case, the HEW will open a source file browser dialog
box to allow you to manually locate the file. This path will then be used to update any other source files
in this debug project.
5.2.1
Downloading a Program
A load module to be debugged must be downloaded.
To download a program, select the load module from [Debug -> Download] or select [Download] from the
popup menu opened by clicking the right-hand mouse button on the load module in [Download modules] of the
[Workspace] window.
Note: Before downloading a program, it must be registered to the HEW as a load module. For registration,
refer to section 4.3, Setting at Emulator Activation.
225
5.2.2
Viewing the Source Code
Select a source file name in the [Workspace] window and click [Open] in the popup menu to make the HEW
open the source file in the integrated editor. It is also possible to display your source files by double-clicking on
their names in the [Workspace] window.
Figure 5.6 Source Window
In this window, the following items are shown on the left as information on lines.
•
First column (Source address column): Displays the address information for the source line
•
Second column (Event column): Event information (break)
•
Third column (EXT.2 Trigger column): EXT.2 Trigger information
•
Fourth column (Editor column): PC, bookmark, and breakpoint information
The Editor window is displayed in the right part of the Source window.
226
Source address column
When a program is downloaded, an address for the current source file is displayed on the Source address column.
These addresses are helpful when setting the PC value or a breakpoint.
Event column
The Event column displays the following items:
: Address condition break by an event or a range channel
: Starts time measurement by an event channel
: Ends time measurement by an event channel
: Starts a point-to-point range trace
: Ends a point-to-point range trace
: Halts trace
These are also set by using the popup menu.
EXT.2 Trigger column
The EXT.2 Trigger column displays the following items:
: EXT.2-1 trigger condition
: EXT.2-2 trigger condition
: EXT.2-3 trigger condition
: EXT.2-4 trigger condition
: Two or more EXT.2 trigger conditions
It is also possible to set them by using the popup menu.
Editor column
Editor column displays the following items:
: A bookmark is set.
: A PC Break is set.
: PC location
227
To switch off a column in all source files
1.
2.
3.
4.
Right-click on the [Editor] window or select the [Edit] menu.
Click the [Define Column Format…] menu item.
The [Global Editor Column States] dialog box is displayed.
A check box indicates whether the column is enabled or not. If it is checked, the column is enabled. If
the check box is gray, the column is enabled in some files and disabled in others. Deselect the check box
of a column you want to switch off.
5. Click the [OK] button for the new column settings to take effect.
Figure 5.7 [Global Editor Column States] Dialog Box
To switch off a column in one source file
1. Click the right-hand mouse button on the [Editor] window which contains the column you want to
remove to display the popup menu.
2. Click the [Columns] menu item to display a cascaded menu item. The columns are displayed in this
popup menu. If a column is enabled, it has a tick mark next to its name. Clicking the entry will toggle
whether the column is displayed or not.
228
5.2.3
Viewing the Assembly-Language Code
If there is an address at the cursor position in the [Editor] window, selecting [Go to Disassembly] in the pop-up
menu opens the [Disassembly] window.
The first address displayed in the [Disassembly] window is the address where the cursor is placed in the [Editor]
window.
If you do not have a source file, but wish to view code in the assembly-language level, either choose [View ->
Disassembly…], or click on the [Disassembly] window’s toolbar button ( ).
Figure 5.8 [Disassembly] Window
5.2.4
Modifying the Assembly-Language Code
You can modify the assembly-language code by double-clicking on the instruction that you want to change. The
[Assembler] dialog box will be opened.
Figure 5.9 [Assembler] Dialog Box
229
The address, instruction code, and mnemonic are displayed. Enter the new instruction or edit the old instruction
in the [Mnemonics] field. Pressing the [Enter] key will replace the memory content with the new instruction and
move on to the next instruction. Clicking the [OK] button will replace the memory content with the new
instruction and close the dialog box. Clicking the [Cancel] button or pressing the [Esc] key will close the dialog
box without modifying the memory contents.
Note: The assembly-language code being displayed is the current memory content. If the memory contents are
changed the [Assembler] dialog box and the [Disassembly] window will show the new assemblylanguage code, but the source file displayed in the [Editor] window will be unchanged. This is the same
even if the source file contains an assembler.
5.2.5
Viewing a Specific Address
When you are viewing your program in the [Disassembly] window, you may wish to look at another area of your
program's code. Rather than scrolling through a lot of code in the program, you can go directly to a specific
address. Select [Set Address…] from the popup menu, and the dialog box shown in figure 5.10 is displayed.
Figure 5.10 [Set Address] Dialog Box
Enter the address in the [Address] edit box and either click on the [OK] button or press the Enter key. A label
name can also be specified as the address. The [Disassembly] window will be updated to show the code at the
new address. When an overloaded function or a class name is entered, the [Select Function] dialog box opens for
you to select a function. For details, refer to section 5.13.3, Supporting Duplicate Labels.
5.2.6
Viewing the Current Program Counter Address
Wherever you can enter an address or value into the HEW, you can also enter an expression. If you enter a
register name prefixed by the hash character, the contents of that register will be used as the value in the
expression. Therefore, if you open the [Set Address] dialog box and enter the expression #pc, the [Source] or
[Disassembly] window will display the current PC address. It also allows the offset of the current PC to be
displayed by entering an expression with the PC register plus an offset, e.g., #PC+0x100.
230
5.3
Debugging with the Command Line Interface
Use the [Command Line] window to enter text-based commands instead of window menus and commands.
5.3.1
Opening the [Command Line] Window
Choose [View -> Command Line] or click the [Command Line] toolbar button (
Line] window.
) to open the [Command
Figure 5.11 [Command Line] Window
This window allows the user to control the debugging platform by sending text-based commands. A series of
predefined command lines can be called from a file and the output can be recorded in a file. The command can
be executed by pressing the [Enter] key after the command is input at the prompt (<) on the last line. For
information on the available commands, refer to appendix G, Command Lines, and the on-line help.
If available, the window title displays the current batch and log file names separated by colons.
Pressing the Ctrl + ↑ or Ctrl + ↓ keys on the last line displays the command line previously executed.
5.3.2
Specifying a Command File
It is useful to use a command file when a series of predefined command lines need to be executed. Create a
command file by a text editor and write necessary command lines. The default extension of a command file
is .hdc.
Choose [Set Batch File...] from the popup menu to open the [Set Batch File] dialog box, in which the name of a
command file (*.hdc) can be specified. Clicking the [OK] button displays the specified command file name as
the window title. Clicking the [Cancel] button closes the dialog box without changing the setting.
231
Figure 5.12 [Set Batch File] Dialog Box
5.3.3
Executing a Command File
Click the [Play] button in the [Set Batch File] dialog box or choose [Play] from the popup menu to execute the
command file. The [Play] menu is displayed in gray while the file is running and can be used when the command
file execution stops and control returns to the user.
5.3.4
Stopping Command Execution
Choose [Stop] from the popup menu to stop command execution. The [Stop] menu becomes valid during
command execution.
5.3.5
Specifying a Log File
Choose [Set Log File...] from the popup menu to open the [Open Log File] dialog box, in which a log file to
store the command execution results can be specified.
Figure 5.13 [Open Log File] Dialog Box
Enter the name of a log file (*.log). The logging option is automatically set and the name of the file is shown on
the window title bar.
Opening a previous log file will ask the user if they wish to append or overwrite the current log.
5.3.6
Starting or Stopping Logging
Choose [Logging] from the popup menu to toggle logging to file on and off. When logging is active, the button
becomes effective. Note that the contents of the log file cannot be viewed until logging is completed, or
temporarily disabled by clearing the check box. Re-enabling logging will append to the log file.
5.3.7
Entering a Full Path to the File
It is recommended that the full path to a file is specified as a file name in the [Command line] window because
the current directory can be moved. However, care must be taken to enter the correct full path to a file when it is
entered from the keyboard. To save this trouble, a full path can be easily specified by browsing through files.
232
Choose [Browse...] from the popup menu to open the [Browse] dialog box. Select a file and click [Open] to paste
the full path to the selected file to the cursor location. This option can only be used when the cursor is located on
the last line.
5.3.8
Pasting a Placeholder
Select a placeholder from the [Placeholder] submenu in the popup menu to paste the selected placeholder to the
cursor location. This function is only available when the cursor is located on the last line.
233
5.4
Viewing the Registers
If you are debugging at assembly-language level, then you will find it useful to see the contents of the CPU's
general registers. You can do this by using the [Register] window.
5.4.1
Opening the [Register] Window
To open the [Register] window, choose [View->CPU->Registers] or click the [Register] toolbar button (
The [Register] window opens showing all of the CPU's general registers and the values, displayed in
hexadecimal.
).
Figure 5.14 [Register] Window
5.4.2
Expanding a Bit Register
If a register is used as a set of flags at the bit level for the control of state, its one-character symbol rather than its
state indicate each bit. Double-click on the register’s name to display the [Register] dialog box and switch each
bit on or off. Checking the box for any bit specifies it as holding a 1, while removing the check specifies it as a 0.
Figure 5.15 Expanding a Bit Register
234
5.4.3
Choosing a Register to be Displayed
To choose a register to be displayed in the [Register] window, choose [Settings…] from the pop-up menu. This
dialog box is shown in figure 5.16.
Figure 5.16 [Settings] Dialog Box
5.4.4
Splitting Up the Window Display
To vertically divide the [Register] window display into two, select [Split] from the pop-up menu and move the
split-up bar.
235
5.4.5
Modifying Register Contents
To change a register's content, open the [Register] dialog box in one of the following methods:
• Double-click the register you want to change.
• Select the register you want to change, and choose [Edit…] from the popup menu.
Figure 5.17 [Register] Dialog Box
You can enter a number or C/C++ expression in the [Value] field. You can choose whether to modify the whole
register contents, a masked area, floating or flag bits by selecting an option from the combo box (the contents of
this list depend on the CPU model and selected register).
When you have entered the new number or expression, click the [OK] button or press the [Enter] key; the dialog
box closes and the new value is written into the register.
5.4.6
Using Register Contents
Use the value contained in a CPU register by specifying the register name prefixed by the “#” character, e.g.:
#R1, #PC, #R6L, or #ER3 when you are entering a value elsewhere in the HEW, for example when displaying a
specified address in the [Disassembly] or [Memory] windows. Available register names depend on the target
MCU being emulated.
5.4.7
Saving the Currently Displayed Contents
The contents currently displayed in the window can be saved in a text file. Select [Save to File…] from the popup menu.
236
5.5
Operating Memory
This section describes how to control memory contents, such as viewing a memory area in different formats,
filling and moving a memory block, and loading and verifying a load module file.
5.5.1
Viewing a Memory Area
To look at a memory area, choose [View -> CPU ->Memory…] or click the [View Memory] toolbar button (
to open the [Memory] window. This will open the [Format] dialog box shown in figure 5.18.
)
Figure 5.18 [Format] Dialog Box
Enter the range you want to display as an address value or an equivalent symbol in the [Begin] and [End] fields.
Select the data size and format for the display from the [Display Value As] and [Format] drop-down lists,
respectively. Select the number of bytes displayed in one line from the [Bytes Count For One Line] drop-down
list. Click the [OK] button or press the Enter key, and the dialog box closes and the [Memory] window opens.
The display can be scrolled within the range of the entered display start and end addresses.
237
Figure 5.19 [Memory] Window
Note: Each item in the [+n] column is called as the memory unit.
There are three display columns:
[Address]:
First address of the memory data displayed on this row.
[+n]
Memory data read from [Address] and ‘n’ means the offset value from the first address of the
row. Data is read from the debugging platform’s physical memory in the access width, and then
converted to the display width.
[Value]:
Data displayed in an alternative format.
5.5.2
Displaying Data in Different Formats
If you want to change the display format of the [Memory] window, select [Format] from the popup menu. The
dialog box shown in figure 5.20 is displayed.
Figure 5.20 [Format] Dialog Box
To display and edit memory in different widths, use the [Display Data As] combo box. For example, choose the
[Byte] option and the display will be updated to show the memory area as individual bytes.
238
The data can be converted into different formats, as shown in the [Value] column. The list of formats depends on
the data selection.
To change the number of bytes displayed on one line, use the [Bytes Count For One Line] drop-down list. For
example, choose the [8 Byte] option and the display will be updated to show the 8-byte data on one line.
5.5.3
Splitting Up the Window Display
To vertically divide the [Memory] window display into two, select [Split] from the popup menu and move the
split-up bar.
5.5.4
Viewing a Different Memory Area
To change the memory area displayed in the [Memory] window, use the scroll bars. To quickly look at a new
address, use the [Format] dialog box. This can be opened by choosing [Format] from the popup menu.
Enter the new address value, and click the [OK] button or press the [Enter] key. The dialog box closes and the
[Memory] window display is updated with the data at the new address. When an overloaded function or a class
name is entered, the [Select Function] dialog box opens for you to select a function.
5.5.5
Modifying the Memory Contents
The memory contents can be modified via the [Edit Memory] dialog box. Move the cursor on the memory unit
(according to the [Memory] window display choice) that you wish to change. Either double-click on the memory
unit or press the [Enter] key. The dialog box shown in figure 5.21 is displayed.
Figure 5.21 [Edit Memory] Dialog Box
A number or C/C++ expression can be entered in the [New Value] field. After you have entered the new number
or expression, click the [OK] button or press the [Enter] key. Then the dialog box closes and the new value is
written into memory.
The memory contents can also be modified by moving the cursor on the memory unit and entering the new value
in hexadecimal through the keyboard.
5.5.6
Selecting a Memory Range
If the memory address range is in the [Memory] window, you can select the range by clicking on the first
memory unit (according to the [Memory] window display choice) and dragging the mouse to the last unit. The
selected range is highlighted.
239
5.5.7
Finding a Value in Memory
To find a value in memory, open the [Memory] window and select [Search…] from the popup menu or from the
[Memory] drop-down menu. The [Search Memory] dialog box shown in figure 5.22 is displayed.
Figure 5.22 [Search Memory] Dialog Box
Enter the start and end addresses of the range in which to search and the data value to search for, and select the
search format. If pattern search is selected as the search format, a byte string of up to 256 bytes can be searched
for. The end address can also be prefixed by a plus (+); the end address will become the (start address) + (entered
value).
Search conditions other than pattern search are data match/mismatch and search direction. Note that only data
match and forward direction can be selected with pattern search.
Click the [OK] button or press the Enter key. The dialog box closes and the HEW searches the range for the
specified data. If the data is found, it is highlighted.
If the data could not be found, the [Memory] window display remains unchanged and a message box informing
that the data could not be found is displayed.
If [Search Next] is selected from the popup menu in the state where data has been found, the search will continue
from the next address.
240
5.5.8
Filling a Memory Area with a Value
A value can be set as the contents of a memory address range using the memory fill function.
To fill a memory range with the same value, select [Fill…] from the popup menu of the [Memory] window or
from the [Memory] drop-down menu. The [Fill Memory] dialog box is shown in figure 5.23.
Figure 5.23 [Fill Memory] Dialog Box
If an address range has been selected in the [Memory] window, the specified start and end addresses will be
displayed. Select a format from the [Format] combo box and enter the data value in the [Data] field. On clicking
the [OK] button or pressing the [Enter] key, the dialog box closes and the new value is written into the memory
range.
5.5.9
Copying a Memory Area
You can copy a memory area using the memory copy function. Select [Copy…] from the popup menu of the
[Memory] window or from the [Memory] drop-down menu. The [Copy Memory] dialog box is opened (figure
5.24).
Figure 5.24 [Copy Memory] Dialog Box
241
The source start address and end address selected in the [Memory] window will be displayed in the [Begin] and
[End] fields. Checking the [Verify] check box enables copying while comparing the copy source and copy
destination. The copy unit can be selected in the [Format] combo box. Enter the destination start address in the
[Destination] field and click the [OK] button or press the [Enter] key. This will close the dialog box and copy the
memory block to the new address.
5.5.10
Saving and Verifying a Memory Area
A memory area in the address space can be saved into a disk file using the memory save function. Open the
[Save Memory As] dialog box by choosing [File -> Save memory...].
Figure 5.25 [Save Memory As] Dialog Box
Enter the start and end addresses of the memory block that you wish to save, and a name and format for the file.
The [File name] combo box contains the previous four file names used for saving memory.
Clicking the […] button can open the standard [File Save As] dialog box. On clicking the [OK] button or
pressing the [Enter] key, the dialog box closes and the memory block will be saved into the disk as a file of the
specified format type. The access size for saving data can be selected from the [Access Size] drop-down list.
When the data is saved in memory with little endian, the order of data depends on the access size.
242
A memory area in the address space can be verified using the memory verify function. Open the [Verify
Memory] dialog box by choosing [File -> Verify Memory...]. The access size at verification can be selected from
the [Access Size] drop-down list.
Figure 5.26 [Verify Memory] Dialog Box
5.5.11
Disabling Update of the Window Contents
Automatic update of the [Memory] window contents, which is performed when user program execution stops
and in other cases, can be disabled. This is done by checking [Lock Refresh] in the popup menu. The [Memory]
window will be grayed.
5.5.12
Updating the Window Contents
The [Memory] window contents can be forcibly updated. This is done by checking [Refresh] in the popup menu.
243
5.5.13
Comparing the Memory Contents
The contents of two memory blocks can be compared. Open the [Compare Memory] dialog box by selecting
[Memory -> Compare…] from the main menu or by selecting [Compare…] from the popup menu of the
[Memory] window.
Figure 5.27 [Compare Memory] Dialog Box
Enter the comparison format ([Format]), the start address ([Begin]) and end address ([End]) of the source
memory area, and the start address ([Start Compare]) of the destination memory area. If the memory block is
already highlighted in the [Memory] window, the start and end addresses will be automatically filled in when the
[Compare Memory] dialog box is opened.
If there is a mismatch, the address where it was found is displayed in a message box.
244
5.5.14
Loading a Memory Area from a File
A file can be loaded to the debugging platform’s memory. Select [Load…] from the popup menu of the
[Memory] window to open the [Load Program] dialog box.
Figure 5.28 [Load Program] Dialog Box
Enter the file format ([Format]) and the file name ([File name]). If the load address value is to be changed, enter
the offset value in the offset field ([Offset address]), otherwise enter zero.
245
5.6
Viewing the I/O Memory
A microcomputer contains on-chip peripheral modules. The exact number and type of peripheral modules differ
between devices but the typical modules are a DMA controller, serial communications interface, A/D converter,
integrated timer unit, bus state controller, and watchdog timer. Registers that are mapped to the microcomputer’s
address space controls the on-chip peripheral modules.
The [Memory] window enables you to look at data in continuous memory addresses as byte, word, longword,
single-precision floating-point, double-precision floating-point, or ASCII values. However, registers of different
sizes are allocated to non-continuous memory addresses in the I/O memory. To handle this memory, the HEW
has the [IO] window to facilitate checking and setting up of these kinds of registers.
5.6.1
Opening the [IO] Window
To open the [IO] window, select [View -> CPU -> IO] or click the [View IO] toolbar button ( ). Modules that
match the on-chip peripheral modules organize the I/O register information. When the [IO] window is first
opened, only a list of module names is displayed.
Figure 5.29 [IO] Window
5.6.2
Expanding the I/O Register Display
To display the names, addresses, and values of the I/O registers, click the [+] mark at the left of the module name
or select the module name by clicking on it or using the cursor keys and press the [->] key. The module display
will expand to show the individual registers of that peripheral module and their names, addresses, and values.
Clicking the [-] mark at the left of the expanded module name or pressing the [<-] key will close the I/O register
display.
For a display in the bit level, click the [+] mark at the left of the register name or select the register name by
clicking on it or using the cursor keys and press the [->] key. The register display will expand to show the names
of register bits and values. Clicking the [-] mark at the left of the expanded register name or pressing the [<-] key
will close the register bits display.
246
5.6.3
Manually loading an IO file
To manually load an IO file right click on the [IO] window and select the “Load IO file…” menu item on the IO
window pop-up. A standard file browser is invoked. Simply select the file you require to load and click OK.
The IO file will be loaded into the window.
5.6.4
Modifying the I/O Register Contents
To edit the value in an I/O register, double-click or press the [Enter] key on the register to open a dialog box to
modify the register contents. When you have entered the new number or expression, click the [OK] button or
press the [Enter] key; the dialog box closes and the new value is written into the register.
5.6.5
Saving the Currently Displayed Contents
The contents currently displayed in the window can be saved in a text file. Select [Save to File…] from the popup menu.
247
5.7
Viewing the Current Status
Choose [View -> CPU -> Status] or click the [View Status] toolbar button (
see the current status of the debugging platform.
) to open the [Status] window and
Figure 5.30 [Status] Window
The [Status] window has three sheets:
• [Memory] sheet
Contains information about the current memory status including the memory mapping resources and the
areas used by the currently loaded object file.
• [Platform] sheet
Contains information about the current status of the debugging platform, typically including CPU type and
mode; and run status.
• [Events] sheet
Contains information about the current event (breakpoint) status, including resource information.
Note: The items that can be set in this dialog box vary according to the emulator in use. For details, refer to
section 8, Software Specifications Specific to This Product, or the online help.
248
5.8
Reading and Displaying the Emulator Information Regularly
Use the [Extended Monitor] window to know the changing information on the emulator no matter the user
program is running or halted.
Note:
5.8.1
The Extended Monitor function does not affect the execution of the user program since it monitors the
user system or the signal output from the MCU in the emulator by using the emulator’s hardware circuit.
Opening the [Extended Monitor] Window
Selecting [View -> CPU -> Extended Monitor] or clicking the [Extended Monitor] toolbar button ( ) displays
this window. The interval of updating the display is approximately 100 ms during user program execution or
1,000 ms while breaking, respectively.
Figure 5.31 [Extended Monitor] Window
249
5.8.2
Selecting Items to be Displayed
Selecting [Properties…] from the popup menu displays the [Extended Monitor Configuration] dialog box.
Figure 5.32 [Extended Monitor Configuration] Dialog Box
This dialog box allows the user to set the items to be displayed in the [Extended Monitor] window.
Note: The items that can be set in this dialog box vary according to the emulator in use. For details, refer to
section 8, Software Specifications Specific to This Product, or the online help.
250
5.9
Displaying Memory Contents in Realtime
Use the [Monitor] window to monitor the memory contents during user program execution. In the Monitor
function, the realtime operation is retained since the bus monitoring circuit of the emulator sets the read/write
signal of the MCU as a trigger and holds the address bus and data bus values to update the displayed contents of
the memory.
Up to eight points can be set by using the eight monitoring channels on the bus monitoring circuit. 1 to 256 bytes
can be monitored at one point. It is possible that a part or all of monitoring ranges is overlapped.
Note: Monitoring is impossible for an area, such as an internal timer counter, where no internal read/write
signal is generated to update a value.
5.9.1
Opening the [Monitor] Window
To open the [Monitor] window, select [View -> CPU -> Monitor -> Monitor Setting...] or click the [Monitor]
toolbar button ( ) to display the [Monitor Settings] dialog box.
Figure 5.33 [Monitor Setting] Dialog Box
251
[Name]:
Decides the name of the monitor window.
[Options]:
Sets monitor conditions.
[Address]:
Sets the start address for monitoring.
[Size]:
Sets the range for monitoring.
[Access]:
Sets the access size to be displayed in the monitor window.
[Auto-Refresh at rate (ms)]:
Sets the interval for acquisition by monitoring (500 ms at minimum).
[Reading the Initial Value]:
Selects reading of the values in the monitored area when the monitor
window is opened.
[Color]:
Sets the method to update monitoring and the attribute of colors.
[Change Indicator]:
Selects how to display the values that have changed during monitoring
(available when [Reading the Initial Value] has been selected).
No change: No color change.
Change: Color is changed according to the [Foreground] and [Background]
options.
Gray: Those data with values that have not been changed are displayed in
gray.
Appear: A value is only displayed after changed.
[Foreground]:
Sets the color used for display (available when [Change] has been selected).
[Background]:
Sets the background color (available when [Change] has been selected).
[Mayfly]:
A check in this box selects restoration of the color of those data which have
not been updated in a specified interval to the color selected in the
[Background] option. The specified interval is the interval for monitor
acquisition (available when [Change], [Gray], or [Appear] has been selected).
[Detail]:
Sets the items specific to the emulator. Not used with this emulator.
[History]:
Displays the previous settings.
Notes: 1. In this emulator, odd addressees cannot be specified as the start addresses for monitoring.
2. Selection of the foreground or background color may not be available depending on the operating
system in use.
After setting, clicking the [OK] button displays the [Monitor] window.
252
Figure 5.34 [Monitor] Window
During user program execution, the display is updated according to the setting value of the auto-update interval.
Note: Select [Refresh] from the popup menu when data is not displayed correctly after changing the address or
content of memory.
5.9.2
Changing the Monitor Settings
Selecting [Monitor Setting…] from the popup menu of the [Monitor] window displays the [Monitor Setting]
dialog box, which allows the settings to be changed.
Colors, the size of accesses, and the display format can be easily changed from [Color] or [Access] of the popup
menu.
5.9.3
Temporarily Stopping Update of the Monitor
During user program execution, the display of the [Monitor] window is automatically updated according to the
auto-update interval. Select [Lock Refresh] from the popup menu of the [Monitor] window to stop the update of
display. The characters in the address section are displayed in black, and the update of display is stopped.
Selecting [Lock Refresh] again from the popup menu cancels the stopped state.
5.9.4
Deleting the Monitor Settings
Selecting [Close] from the popup menu of the [Monitor] window to be deleted closes the [Monitor] window and
deletes the monitor settings.
5.9.5
Monitoring Variables
Using the [Watch] window refers to the value of any variables.
When the address of the variable registered in the [Watch] window exists within the monitoring range that has
been set by the Monitor function, the value of the variable can be updated and displayed.
This function allows checking the content of a variable without affecting the realtime operation.
For the [Watch] window, refer to section 5.14.3, [Watch] Window.
253
5.9.6
Hiding the [Monitor] Window
When using the Monitor function to monitor the value of a variable from the [Watch] window, hide the
[Monitor] window for the effective use of the screen.
The current monitoring information is listed as the submenu when selecting [Display -> CPU -> Monitor]. The
list consists of the [Monitor] window name and the address to start monitoring.
When the left of the list is checked, the [Monitor] window is being displayed.
Selecting items of the [Monitor] window you want to hide from the monitor setting list displays no [Monitor]
window and removes the check mark at the left of the list.
To display the [Monitor] window again, select the hidden the [Monitor] window.
Figure 5.35 Monitor Setting List
5.9.7
Managing the [Monitor] Window
Selecting [Display -> CPU -> Monitor -> Windows Select…] displays the [Windows Select] dialog box. In this
window, the current monitoring condition is checked and the new monitoring condition is added, edited, and
deleted in succession.
Selecting multiple monitoring conditions enables a temporary stop of update, hiding, and deletion.
Figure 5.36 Selection in the [Monitor] Window
254
[Add]:
Adds a new monitoring condition.
[Edit]:
Changes the settings of the selected [Monitor] window (disabled when selecting multiple
items).
[Lock Refresh/Unlock Refresh]:
Automatically updates or stops updating the display of the selected [Monitor] window.
[Hide/UnHide]: Displays or hides the selected [Monitor] window.
[Remove]:
Removes the selected monitoring conditions.
[Close]:
Closes this dialog box.
255
5.10
Viewing the Labels
When the user program that includes the debugging information is loaded, the labels are registered at that time.
The [Disassembly] window shows the first eight characters of each label instead of the corresponding address or
as a part of an instruction operand.
Note: When a label value matches an operand, the corresponding instruction operand is replaced by the label.
If two or more labels have the same value, the one that comes first in alphabetical order is displayed.
5.10.1
Listing Labels
Choose [View -> Symbol -> Labels] or click the [View Labels] toolbar button (
the current debug session.
) to list all labels defined in
Figure 5.37 [Label] Window
You can view symbols sorted either alphabetically (by ASCII code) or by address value by clicking on the
respective column heading.
Double-clicking in the [BP] column can set or clear a software breakpoint at the start of the function.
256
5.10.2
Adding a Label
Choose [Add..] from the popup menu and open the [Add Label] dialog box to add a label:
Figure 5.38 [Add Label] Dialog Box
Enter the new label name into the [Name] field and the corresponding value into the [Address] field and press
[OK]. The [Add Label] dialog box closes and the label list is updated to show the new label. When an
overloaded function or a class name is entered in the [Address] field, the [Select Function] dialog box opens for
you to select a function. For details, refer to section 5.13.3, Supporting Duplicate Labels.
5.10.3
Editing a Label
Choose [Edit...] from the popup menu and open the [Edit Label] dialog box to edit a label:
Figure 5.39 [Edit Label] Dialog Box
Edit the label name and value as required and then press [OK] to save the modified version in the label list. The
list display is updated to show the new label details. When an overloaded function or a class name is entered in
the [Address] field, the [Select Function] dialog box opens for you to select a function. For details, refer to
section 5.13.3, Supporting Duplicate Labels.
257
5.10.4
Deleting a Label
To delete a label, select the label and choose [Delete] from the popup menu. A confirmation message box
appears:
Figure 5.40 Message Box for Confirming Label Deletion
If you click [OK], the label is removed from the list and the window display is updated. If the message box is not
necessary then check the [Don’t ask this question again] check box.
5.10.5
Deleting All Labels
To delete all the labels from the list, choose [Delete All] from the popup menu. A confirmation message box
appears:
Figure 5.41 Message Box for Confirming All Label Deletion
If you click [OK], all the labels are removed from the HEW system’s symbol table and the list display will be
cleared. If the message box is not necessary then check the [Don’t ask this question again] check box.
258
5.10.6
Loading Labels from a File
A symbol file can be loaded and merged into the HEW's current symbol table. Choose [Load...] from the popup
menu to open the [Load Symbols] dialog box:
Figure 5.42 [Load Symbols] Dialog Box
The dialog box operates like a standard Windows® [open file] dialog box; select the file and click [Open] to start
loading. The standard file extension for symbol files is “.sym”.
5.10.7
Saving Labels into a File
Choose [Save As...] from the popup menu to open the [Save Symbols] dialog box. The [Save Symbols] dialog
box operates like a standard Windows® [Save File As] dialog box. Enter the name for the file in the [File name]
field and click [Save] to save the HEW's current label list to a symbol file. The standard file extension for
symbol files is “.sym”.
See appendix E, Symbol File Format, for the symbol file format.
Once a file is specified by the [Save As...] menu, the current symbol table can be saved in the same symbol file
just by choosing [Save] from the popup menu.
5.10.8
Searching for a Label
Choose [Find...] from the popup menu to open the [Find Label] dialog box:
Figure 5.43 [Find Label] Dialog Box
Enter all or part of the label name that you wish to find into the edit box and click [OK] or press the [Enter] key.
The HEW searches the label list for a label name containing the text that you entered.
259
Note: Only the label is stored by 1024 characters of the start, therefore the label name must not overlap
mutually in 1024 characters or less. Labels are case sensitive.
5.10.9
Searching for the Next Label
Choose [Find Next] from the popup menu to find the next occurrence of the label containing the text that you
entered.
5.10.10 Viewing the Source Corresponding to a Label
Select a label and choose [View Source] from the popup menu to open the [Source] or [Disassembly] window
containing the address corresponding to the label.
260
5.11
Executing Your Program
This section describes how you can execute your program's code. You will learn how to do this by either running
your program continuously or stepping single or multiple instructions at a time.
5.11.1
Running from Reset
To reset your user system and run your program from the reset vector address, choose [Debug->Reset Go], or
click the [Go Reset] toolbar button ( ).
The program will run until it hits a breakpoint or a break condition is met. You can stop the program manually
by choosing [Debug->Halt], or by clicking the [Stop] toolbar button ( ).
Note: The program will start running from whatever address is stored in the Reset Vector location. Therefore it
is important to make sure that this location contains the address of your startup code.
5.11.2
Continuing Run
When your program is stopped, the HEW will display an yellow arrow mark in the gutter of the line in the editor
and [Disassembly] windows that correspond to the CPU's current program counter (PC) address value. This will
be the next instruction to be executed if you perform a step or continue running.
To continue running from the current PC address, click the [Go] toolbar button (
), or choose [Debug->Go].
To continue running from a specified address which is not the stop address, change the PC value in one of the
following ways, and click the [Go] toolbar button ( ) or choose [Debug->Go].
• Change the PC value in the [Register] window. Refer to section 5.4.3, Modifying Register Contents.
• Place the text cursor (not the mouse cursor) to a target line in the [Source] or [Disassembly] window, and
choose [Set PC Here] from the popup menu.
5.11.3
Running to the Cursor
Sometimes as you are going through your application you may want to run only a small section of code, that
would require many single steps to execute. You can do this using the Go To Cursor feature.
How to use the Go To Cursor
1. Make sure that a [Source] or [Disassembly] window is open showing the address at which you wish to stop.
2. Position the text cursor on the address at which you wish to stop by either clicking in the [Address] field or
using the cursor keys.
3. Choose [Go To Cursor] from the popup menu.
The debugging platform will run your code from the current PC value until it reaches the address indicated by
the cursor's position.
Notes: 1. If your program never executes the code at this address, the program will not stop. If this happens,
code execution can be stopped by pressing the Esc key, choosing [Debug->Halt], or clicking on the
[Stop] toolbar button ( ).
2. The Go To Cursor feature requires a PC breakpoint - if you have already used all those available, then
the feature will not work.
261
5.11.4
Running from a Specified Address
The [Run Program] dialog box allows the user to run the program from any address. Choose [Debug -> Run...]
to open the [Run Program] dialog box.
Figure 5.44 [Run Program] Dialog Box
The following execution conditions can be specified in this dialog box:
[Program Counter]:
Instruction address to start execution. The initial value is
the current PC value.
[Temporary PC Breakpoints]:
A temporary PC breakpoint. When execution started
by this dialog box stops, this breakpoint is cleared.
Note: The [Temporary PC Breakpoints] feature requires a PC breakpoint - if you have already used all those
available then the feature will not work.
Clicking the [Go] button starts execution according to the settings. Clicking the [Reset Go] button starts
execution from the reset vector. Clicking the [Cancel] button closes this dialog box without executing
instructions.
262
5.11.5
Single Step
To debug your code it is very useful to be able to step a single line or instruction at a time and examine the effect
of that instruction on the system. In the [Source] window, then a step operation will step a single source line. In
the [Disassembly] window, a step operation will step a single assembly-language instruction. If the instruction
calls another function or subroutine, you have the option to either step into or step over the function. If the
instruction does not perform a call, then either option will cause the debugger to execute the instruction and stop
at the next instruction.
• Stepping Into a Function
If you choose to step into the function the debugger will execute the call and stop at the first line or instruction of
the function. To step into the function either click the [Step In] toolbar button ( ), or choose [Debug->Step In].
• Stepping Over a Function Call
If you choose to step over the function the debugger will execute the call and all of the code in the function (and
any function calls that that function may make) and stop at the next line or instruction of the calling function. To
step over the function either click the [Step Over] toolbar button ( ), or choose [Debug->Step Over].
• Stepping Out of a Function
There are occasions when you may have entered a function, finished stepping through the instructions that you
want to examine and would like to return to the calling function without tediously stepping through all the
remaining code in the function. Or alternatively you may have stepped into a function by accident, when you
meant to step over it and so want to return to the calling function without stepping all the way through the
current function. You can do this with the Step Out feature.
To step out of the current function either click the [Step Out] toolbar button (
), or choose [Debug->Step Out].
263
5.11.6
Multiple Steps
You can step several instructions at a time by using the [Step Program] dialog box. The dialog box also provides
an automated step with a selectable delay between steps. Open it by choosing [Debug-> Step...].
The [Step Program] dialog box is displayed:
Figure 5.45 [Step Program] Dialog Box
[Steps]:
Number of steps to be executed.
[Delay (seconds)]:
Delay between steps when the program is automatically stepped.
0 to 3 seconds can be selected in 0.5 second units.
[Step Over Calls]:
Selecting this box steps over function calls.
[Source Level Step]:
Selecting this box steps the program at the source level.
Clicking the [OK] button or pressing the [Enter] key starts step execution.
264
5.12
Stopping Your Program
This section describes how you can halt execution of your application's code. This section describes how to do
this directly by using the [Stop] button and by setting breakpoints at specific locations in your code.
5.12.1
Stopping the Program by the [Stop] Toolbar Button
When your program is running, the [Stop] toolbar button is enabled ( ) (a red STOP sign), and when the
program has stopped it is disabled ( ) (the STOP sign is grayed out). Click on the [Stop] toolbar button, or
choose [Debug->Halt Program].
When the program has been stopped by [Stop], "User Break" is displayed in the [Debug] sheet of the [Output]
window.
5.12.2
Standard Breakpoints (PC Breakpoints)
When you are trying to debug your program you will want to be able to stop the program running when it
reaches a specific point or points in your code. You can do this by setting a PC breakpoint on the line or
instruction at which to want the execution to stop. The following instructions will show you how to quickly set
and clear simple PC breakpoints. If more complex breakpoint operation is required, use the [Event] window,
which can be opened by clicking the ( ) button or choosing [View -> Code -> Eventpoints]. For details, refer
to section 5.15, Using the Event Points.
• To set a PC breakpoint in the [Source] window
1. Make sure that the [Disassemble] or a [Source] window is open at the place you want to set a PC
breakpoint.
2. Choose [Toggle Breakpoint] from the popup menu, or press F9, at the line showing the address at which
you want the program to stop.
3. You will see a red circle appear in the gutter to indicate that a PC breakpoint has been set.
4. The current breakpoint set can be enabled or disabled by using [Enable/Disable Breakpoint] in the popup
menu.
Now when you run your program and it reaches the address at which you set the PC breakpoint, execution halts
with the message "PC Break" displayed in the [Debug] sheet of the [Output] window, and the [Source] or
[Disassembly] window is updated with the PC breakpoint line marked with an arrow in the gutter.
Note: When a break occurs, the program stops just before it is about to execute the line or instruction at which
you set a program PC breakpoint. If you choose Go or Step after stopping at the PC breakpoint, then the
line marked with an arrow will be the next instruction to be executed.
265
• To set a PC breakpoint by using the [Breakpoints] dialog box
Selecting [Edit -> Source Breakpoint…] displays the [Breakpoints] dialog box.
Figure 5.46 [Breakpoints] Dialog Box
The [Breakpoints] dialog box allows the user to view the current breakpoints set. Clicking the [Edit Code] button
displays the source where each breakpoint is set. The [Remove] or [Remove All] button deletes one or all
breakpoints, respectively. The check box of each breakpoint enables or disables the breakpoint.
• To toggle PC breakpoints
It is possible to toggle the [PC Breakpoints] setting by either double-clicking in the [BP] column of the line
where the PC breakpoint is set or placing the cursor on the line and pressing the [F9] key. The setting to be
toggled depends on the debugging platform.
266
5.13
Elf/Dwarf2 Support
The HEW supports the Elf/Dwarf2 object file format for debugging applications written in C/C++ and assembly
language for Renesas microcomputers.
Key Features
•
•
•
•
•
•
•
Source level debugging
C/C++ operators
C/C++ expression (casting, pointers, references, etc.)
Ambiguous function names
Overlay memory loading
Watch - locals, and user defined
Stack Trace
5.13.1
C/C++ Operators
The C/C++ language operators are available:
+, -, *, /, &, |, ^, ~, !, >>, <<, %, (, ), <, >, <=, >=, ==, !=, &&, ||
Buffer_start + 0x1000
#R1 | B'10001101
((pointer + (2 * increment_size)) & H'FFFF0000) >> D'15
!(flag ^ #ER4)
5.13.2
C/C++ Expressions
Expression Examples
Object.value
p_Object->value
Class::value
*value
&value
array[0]
Object.*value
::g_value
Class::function(short)
(struct STR) *value
//Specifies direct reference of a member (C/C++)
//Specifies indirect reference of a member (C/C++)
//Specifies reference of a member with class (C++)
//Specifies a pointer (C/C++)
//Specifies a reference (C/C++)
//Specifies an array (C/C++)
//Specifies reference of a member with pointer (C++)
//Specifies reference of a global variable (C/C++)
//Specifies a member function (C++)
//Specifies cast operation (C/C++)
267
5.13.3
Supporting Duplicate Labels
In some languages, for example C++ overloaded functions, a label may represent more than one address. When
such a label name is entered in a dialog box, the HEW will display the [Select Function] dialog box to display
overloaded functions and member functions.
Figure 5.47 [Select Function] Dialog Box
Select overloaded functions or member functions in the [Select Function] dialog box. Generally, one function
can be selected at one time; only for setting breakpoints, multiple functions can be selected. This dialog box has
three areas.
[Select Function Name]: Displays the same-name functions or member functions and
their detailed information.
[Set Function Name]:
Displays the function to be set and their detailed information.
[Counter]:
[All Function]
Displays the number of same-name functions
or member functions.
[Select Function] Displays the number of functions displayed
in the [Select Function Name] list box.
[Set Function]
Displays the number of functions displayed
in the [Set Function Name] list box.
Selecting a Function
Click the function you wish to select in the [Select Function Name] list box, and click the [>] button. You will
see the selected function in the [Set Function Name] list box. To select all functions in the [Select Function
Name] list box, click the [>>] button.
Deselecting a Function
Click the function you wish to deselect from the [Set Function Name] list box, and click the [<] button. To
deselect all functions, click the [<<] button. The deselected function will be moved from [Set Function Name]
list box back to the [Select Function Name] list box.
268
Setting a Function
Click the [OK] button to set the functions displayed in the [Set Function Name] list box. The functions are set
and the [Select Function] dialog box closes.
Clicking the [Cancel] button closes the dialog box without setting the functions.
5.13.4
Debugging an Overlay Program
This section explains the settings for using the overlay functions.
Displaying Section Group
When the overlay mode is used, that is, when several section groups are assigned to the same address range, the
address ranges and section groups are displayed in the [Overlay] dialog box.
Open the [Overlay] dialog box by choosing [Memory->Configure Overlay].
Figure 5.48 [Overlay] Dialog Box (at Opening)
This dialog box has two areas: the [Address] list box and the [Section Name] list box.
269
The [Address] list box displays the address ranges used in the overlay mode. Click to select one of the address
ranges in the [Address] list box.
Figure 5.49 [Overlay] Dialog Box (Address Range Selected)
The [Section Name] list box displays the section groups assigned to the selected address range.
 Setting section group
When using the overlay function, the highest-priority section group must be selected in the [Overlay] dialog box;
otherwise the HEW will operate incorrectly.
First click one of the address ranges displayed in the [Address] list box. The section groups assigned to the
selected address range will then be displayed in the [Section Name] list box.
Click to select the section group with the highest-priority among the displayed section groups.
Figure 5.50 [Overlay] Dialog Box (Highest-Priority Section Group Selected)
After selecting a section group, clicking the [OK] button stores the priority setting and closes the dialog box.
Clicking the [Cancel] button closes the dialog box without storing the priority setting.
Note: Within the address range used by the overlay function, the debugging information for the section
specified in the [Overlay] dialog box is referred to. Therefore, the same section of the currently loaded
program must be selected in the [Overlay] dialog box.
270
5.14
Viewing the Variables
This section describes how you can look at variables in the source program.
5.14.1
Tooltip Watch
The quickest way to look at a variable in your program is to use the Tooltip Watch feature.
 To use Tooltip Watch:
Open the [Source] window showing the variable that you want to examine.
Rest the mouse cursor over the variable name that you want to examine - a tooltip will appear near the variable
containing basic watch information for that variable.
Figure 5.51 Tooltip Watch
5.14.2
Instant Watch
Open the [Source] window showing the variable that you want to examine.
Rest the mouse cursor over the variable name that you want to examine and choose [Instant Watch...] from the
popup menu; the [Instant Watch] dialog box will appear and display the variable at the cursor location.
Figure 5.52 [Instant Watch] Dialog Box
“+” shown to the left of the variable name indicates that the information may be expanded by clicking on the
variable name, and “-” indicates that the information may be collapsed. Clicking [Add] registers the variable in
the [Watch] window. Clicking [Close] closes the window without registering the variable in the [Watch] window.
271
5.14.3
[Watch] Window
You can view any value in the [Watch] window.
Opening a [Watch] Window
To open a [Watch] window, choose [View->Symbol->Watch] or click on the [Watch] toolbar button (
visible. A [Watch] window opens. Initially the contents of the window will be blank.
) if it is
Figure 5.53 [Watch] Window
This window allows the user to view and modify C/C++-source level variables. The contents of this window are
displayed only when the debugging information available in the absolute file (*.abs) includes the information on
the C/C++ source program. The variable information is not displayed if the source program information is
excluded from the debugging information during optimization by the compiler. In addition, the variables that are
declared as macro cannot be displayed.
The following items are displayed.
[Name]:
Name of the variable
[Value]:
Value and assigned location.
The assigned location is enclosed by { }.
[Type]:
Type of the variable
272
The [R] mark shows that the value of the variable can be updated during user program execution.
For updating of the content of the variable that has been registered in the [Watch] window, there are the
following three methods:
1. Use the Monitor function without halting the user program
The read/write signal of the MCU is set as a trigger and holds the address bus and data bus values to update the
value of the variable.
Note: Although the realtime operation is retained, the size and number points to be monitored are limited. For
the Monitor function, refer to section 5.9, Displaying Memory Contents in Realtime.
2. Read the memory content directly from the HEW to update the values without halting the user program since
the bus mastership is owned by the emulator
Note: While the emulator reserves the bus mastership, the realtime operation is disabled because the CPU stops
operation. This method is only available for accessing the internal ROM, internal RAM, and emulation
memory.
The area used here or this method may not be available depending on the emulator in use. For details,
refer to section 8, Software Specifications Specific to This Product, or [Enable read and write on the fly]
on the [General] page of the [Configuration Properties] dialog box in the online help.
3. Temporarily stops the user program and reads the memory contents
Note: The realtime operation is disabled because the user program is stopped temporarily. This method is only
available for accessing the areas (internal I/O, DTCRAM, and user memory) other than those in item 2
mentioned above.
It is possible to recognize the method for updating the value during user program execution according to the
color of the [R] mark.
Blue-outline [R]:
The variable's address is within the range that has been set for the monitoring function and
the data is readable by using the monitoring function.
Blue [R]:
An updated value of the data at this location has been read by the monitoring function.
Black-outline [R]:
The variable's address is outside the range that has been set for the monitoring function and
the data is not readable by using the monitoring function.
Black [R]:
A value has been updated by reading the normal data.
Notes: 1. This function can be set per variable or per element or body for structures of data.
2. The color of an [R] in the [Name] column changes according to the trace and monitoring settings.
3. A variable that is allocated to a register cannot be selected for monitoring.
273
Adding a Watch Item
Use the [Add Watch] dialog box in the [Watch] window to add Watch items to the [Watch] window.
 To use Add Watch from a [Watch] window:
Open the [Watch] window.
Choose [Add Watch] from the popup menu.
The [Add Watch] dialog box opens:
Figure 5.54 [Add Watch] Dialog Box
Enter the name of the variable that you wish to watch and click [OK]. The variable is added to the [Watch]
window. A variable can be dragged from the [Source] window and dropped into the [Watch] window.
Note: If the variable that you have added is a local variable that is not currently in scope, the HEW will add it
to the [Watch] window but its value will be 'Not available now'.
274
Expanding a Watch Item
If a watch item is a pointer, array, or structure, then you will see a plus sign (+) expansion indicator to left of its
name, this means that you can expand the watch item. To expand a watch item, double click on it. The item
expands to show the elements (in the case of structures and arrays) or data value (in the case of pointers)
indented by one tab stop, and the plus sign changes to a minus sign (-). If the elements of the watch item also
contain pointers, structures, or arrays then they will also have expansion indicators next to them.
Figure 5.55 Expanding a Watch Item
To collapse an expanded watch item, double click on the item again. The item's elements will collapse back to
the single item and the minus sign changes back to a plus sign.
The watch item can be expanded for the number of levels when a numerical key from 1 to 9 is pressed while a
watch item is selected.
275
Editing a Watch Item's Value
You may wish to change the value of a watch variable, e.g. for testing purposes or if the value is incorrect due to
a bug in your program. To change a watch item's value use the Edit Value function.
 Editing a watch item's value:
Enter a value directly in the window.
In another way, select the item to edit by clicking on it, you will see a flashing cursor on the item.
Choose [Edit Value] from the popup menu.
The [Edit Value] dialog box opens:
Figure 5.56 [Edit Value] Dialog Box
Enter the new value or expression in the [New Value] field and click [OK]. The [Watch] window is updated to
show the new value.
276
Deleting a Watch Item
To delete a watch item, select it and choose [Delete] from the popup menu. The item is deleted and the [Watch]
window is updated.
To delete all watch items, choose [Delete All] from the popup menu. All items are deleted and the [Watch]
window is updated.
Specifying Realtime Update
The R mark shown to the left of each variable indicates whether the variable is updated in real time. When an R
mark is displayed in bold face, the value of the corresponding variable will be updated in realtime during user
program execution.
A popup menu containing the following options is available in the [Watch] window:
• Auto Update
Marks the selected variable with a bold R and updates the variable in real time.
• Auto Update All
Marks all variables with bold Rs and updates all variables in real time.
• Delete Auto Update
Marks the selected variable with an outlined R and cancels realtime update.
• Delete Auto Update All
Marks all variables with outlined Rs and cancels realtime update.
Modifying the Radix
The radix for the selected variable display can be modified by choosing [Radix] from the popup menu.
Saving the [Watch] Window Contents in a File
To save the contents of the [Watch] window, choose [Save As...] from the popup menu; the Save As dialog box
opens. It allows the user to specify the name of a file and to save the contents of the [Watch] window in the file.
If the [Append] check box is selected, the window contents are appended to the existing file, and if it is not
selected, the existing file is overwritten.
Opening a [Memory] Window
The contents of the memory area to which the selected variable is assigned can be displayed in the [Memory]
window. Choose [Go To Memory...] from the popup menu; the [Set Address] dialog box opens, showing the
information (start address, end address, and size) of the selected variable as default. Clicking [OK] opens the
[Memory] window.
277
5.14.4
[Locals] Window
The local variables and their values can be displayed in the [Locals] window.
Opening the [Locals] Window
To open the [Locals] window, choose [View->Symbol->Locals] or click the [Locals] toolbar button (
).
Figure 5.57 [Locals] Window
If a local variable is not initialized when defined, then the value of the local variable will be incorrect until
another value is assigned to the local variable.
The local variable values and the radix for local variable display can be modified in the same manner as in the
[Watch] window.
278
5.15
Using the Event Points
The emulator has the event point function that performs breaking, tracing, and execution time measurement by
specifying higher-level conditions along with the PC breakpoints standard for the HEW.
5.15.1
PC Breakpoints
When the instruction of the specified address is fetched, the user program is stopped. Up to 256 points can be set.
Note that, however, only one PC breakpoint can be set in the ROM area of the user system. This particular
breakpoint is called the on-chip breakpoint, which stops the user program after executing the instruction of the
specified address.
When it is necessary to set two or more PC breakpoints to the external ROM area of the user system, allocate
this area to the emulation memory, copy the code, and then set the PC breakpoints.
5.15.2
Event Points
Event points can be used for higher-level conditions such as the data condition as well as specification of the
single address. Up to 12 event points can be set by using event channels and range channels in the event
detection system.
When the condition is satisfied, event points are also used as the start/end conditions for execution time
measurement or trace acquisition in addition to halting the user program. Several event points can be used to set
more complex conditions.
Note: Event points acquire the data, test conditions, and execute an action (such as halting the user program)
by the hardware circuit of the emulator. Therefore, a delay of several cycles will occur from the
satisfaction of the condition to the execution of an action.
5.15.3
Event Detection System
In addition to the 4 range channels, the emulator also has 8 event channels. The event channels have more
functions (such as sequencing or counting) than the range channels.
Event Channels (Ch1 to Ch8):
The emulator has 8 event channels. The event channel can be defined as a combination of one or more of the
followings:
•
An address or an address range
•
Outside of an address range
•
A read, a write, or either
•
Data with a mask specification
•
Bus state
•
Area
•
The value of four external probe signals
•
The number of times the event has occurred
•
The number of delay cycles after the event has occurred
A maximum of eight points can be used as a combination in a sequence. The program is activated or halted by an
occurrence of the previous event in each sequence.
279
Range Channels (Ch9 to Ch12):
The emulator has 4 range channels. The range channel can be defined as a combination of one or more of the
followings:
•
An address or an address range
•
Outside of an address range
•
A read, a write, or either
•
Data with a mask specification
•
Bus state
•
Area
•
The value of four external probe signals
•
The number of delay cycles after the event has occurred
5.15.4
Signals to Indicate Bus States and Areas
In the event detection system, signals indicating the MCU’s bus states and the accessed areas can be specified as
the event detection condition.
These signals are output from the MCU on the emulator; the signals to be acquired will vary according to the
emulator in use.
The signals to indicate bus states and areas are used to set the [Bus/Area] condition of the event point. They can
also be acquired as the trace information.
The bus state signals are also used to set the condition not to acquire the trace ([Suppress] option) and in the
Access Count Of Specified Range Measurement mode for measuring the hardware performance ([Access Type]
option).
For the trace function, refer to section 5.16, Viewing the Trace Information. For the hardware performance
function, refer to section 5.20, Analyzing Performance.
The following tables show examples of signals to indicate the bus states and areas that can be acquired by the
emulator.
Table 5.1
Bus State Signals Acquired by the Emulator
Bus State
Trace Display (Status)
Description
CPU Prefetch
PROG
CPU prefetch cycles
CPU Data
DATA
CPU data access cycles
Refresh
REFRESH
Refresh cycles
DMAC
DMAC
DMAC cycles
DTC
DTC
DTC cycles
Other
OTHER
Others
280
Table 5.2
Area Signals Acquired by the Emulator
Area
Trace Display (Status)
Description
On-chip ROM
ROM
ROM
On-chip RAM
RAM
RAM
On-chip I/O 16bit
I/O-16
16-bit I/O
On-chip I/O 8bit
I/O-8
8-bit I/O
External I/O 16bit
EXT-16
16-bit EXT (external)
External I/O 8bit
EXT-8
8-bit EXT (external)
DTC RAM
RAM/DTC
DTCRAM
Note: The signals to indicate the bus states and areas vary according to the emulator in use. For details, refer to
section 8, Software Specifications Specific to This Product, or the online help.
5.15.5
Opening the [Event] Window
Select [View -> Code -> Eventpoints] or click the [Eventpoints] toolbar button (
) to open the [Event] window.
The [Event] window has the following three sheets:
[Breakpoint] sheet:
Displays the settings made for PC breakpoints. It is also possible to set, modify, and
cancel PC breakpoints.
[Event] sheet:
Displays or sets event points.
[Trigger] sheet:
Displays or sets trigger points.
5.15.6
Setting PC Breakpoints
It is possible to display, modify, and add PC breakpoints on the [Breakpoint] sheet.
Figure 5.58 [Event] Window ([Breakpoint] Sheet)
281
Select [Add...] or the PC breakpoint displayed in this window and then select [Edit...] from the popup menu to
display the [Breakpoint/Event Properties] dialog box.
Figure 5.59 [Breakpoint/Event Properties] Dialog Box (Setting a PC Break)
In this dialog box, select the address condition to set PC breakpoints.
[Type]:
Select the type of a breakpoint. Note that the [Breakpoint/Event Properties] dialog box is used
for setting PC breakpoints and event points. Selecting a particular type of breakpoint enables
or disables other pages and parts of the dialog according to the options available to that type of
breakpoint.
[PC Break]:
Only a single address with a program fetch can be selected. Other options are invalid.
[Event]:
Set conditions in detail with other options on this page, or on the [Bus/Area],
[Signals], or [Action] page.
[Address]:
Set address conditions.
[Adderess Lo]:
282
Select a single address where a PC breakpoint will be set.
5.15.7
Setting Event Points
On the [Event] sheet, the settings for event points are displayed, modified, and added.
Figure 5.60 [Event] Window ([Event] Sheet)
Select [Add...] or the event point displayed in this window and then select [Edit...] from the popup menu to
display the [Breakpoint/Event Properties] dialog box.
The conditions for the event point are set on the [General], [Bus/Area], [Signals], and [Action] pages. The search
condition for the event point is set by multiple conditions set on these pages.
Notes: 1. Channel 8 has the trigger output function. When the condition on channel 8 is satisfied, the low-level
signal will be output from the external probe 1 (EXT1) for a bus cycle.
2. When the event point is used as the condition for acquiring the trace information, select [Trace
Acquisition…] from the popup menu. For the trace function, refer to section 5.16, Viewing Trace
Information.
3. If a condition that is unavailable for a range channel is set in editing of the range channels (Ch9 to
Ch12), the selected channel is automatically replaced by an unused event channel (Ch1 to Ch8).
Table 5.3
Conditions Unavailable for a Range Channel
Condition
Related Options
Selecting outside the
specified address range
[Outside Range] on the [General] page
Selecting the start or
end of the execution
time measurement
[Start Timer] and [Stop Timer] on the [Action] page
Specifying the count
when an event occurs
(twice or more)
[Required number of event occurrences] on the [Action] page
Specifying sequencing
[Enable Sequencing] on the [Action] page
283
(1) [General] page
The address and data conditions are set.
Figure 5.61 [Breakpoint/Event Properties] Dialog Box ([General] Page)
[Type]:
Select the type of a breakpoint. Note that the [Breakpoint/Event Properties] dialog box is used
for setting PC breakpoints and event points. Selecting a particular type of breakpoint enables
or disables other pages and parts of the dialog according to the options available to that type of
breakpoint.
[PC Break]:
Only a single address with a program fetch can be selected. Other options are invalid.
[Event]:
Set conditions in detail with other options on this page, or on the [Bus/Area],
[Signals], or [Action] page.
[Address]:
Sets the address condition.
[Don’t care]:
Sets no address condition.
[Address]:
Allows a single address to be selected.
[Range]:
Allows an address range to be selected.
[Adderess Lo]:
Set a single address or the start of an address range (available when [Address] or
[Range] has been selected).
[Adderess Hi]:
Set the end of an address range (available when [Range] has been selected).
[Outside Range]: Used to negate the range (i.e., the event will occur when the address is outside the
range). This is available when [Address] or [Range] has been selected.
284
[Data Compare]: Sets the data condition.
[Compare]:
Checking this box compares data.
[Use Mask]:
Sets a mask condition (available when [Compare] has been selected).
[Value]:
Specifies the data bus value as numerics. The size of data for access can also be
selected (available when [Compare] has been selected).
[Byte]:
Sets access in bytes as the condition (available when [Compare] has been selected).
[Word]:
Sets access in words as the condition (available when [Compare] has been selected).
[Mask]:
Sets a value to be masked. This value will be ANDed with the value of the data bus
and data condition. The result will be used to compare data (available when [Use
Mask] has been selected).
[Direction]:
Selects a condition with read or write cycles.
[Read]:
Sets read cycles as the condition.
[Write]:
Sets write cycles as the condition.
[Either]:
Sets either read or write cycles as the condition.
285
(2) [Bus/Area] page
Use this page to set the bus status and the memory area being accessed.
Figure 5.62 [Breakpoint/Event Properties] Dialog Box ([Bus/Area] Page)
[Bus State]:
Sets the bus status as the condition. When the [Don't care] check box is checked, the event will
be satisfied with any bus status.
[Area]:
Specifies the area for searching. When the [Don't care] check box is checked, the event will be
satisfied in any area.
Note: Items set for the bus state and memory access area vary according to the emulator in use. For details,
refer to section 5.15.4, Signals to Indicate Bus States and Areas.
286
(3) [Signals] page
Use this page to set external signals.
Figure 5.63 [Breakpoint/Event Properties] Dialog Box ([Signals] Page)
[Probe4]:
Detects the status of the input probe signal 4
[High]:
Detects the high level of the input probe signal
[Low]:
Detects the low level of the input probe signal
[Don’t care]:
The status of the input probe signal is not detected
[Probe3]:
Detects the status of the input probe signal 3
[High]:
Detects the high level of the input probe signal
[Low]:
Detects the low level of the input probe signal
[Don’t care]:
The status of the input probe signal is not detected
[Probe2]:
Detects the status of the input probe signal 2
[High]:
Detects the high level of the input probe signal
[Low]:
Detects the low level of the input probe signal
[Don’t care]:
The status of the input probe signal is not detected
287
[Probe1]:
Detects the status of the input probe signal 1
[High]:
Detects the high level of the input probe signal
[Low]:
Detects the low level of the input probe signal
[Don’t care]:
The status of the input probe signal is not detected
(4) [Action] page
Use this page to decide what action the emulator takes when the defined event occurs.
Figure 5.64 [Breakpoint/Event Properties] Dialog Box ([Action] Page)
[Action]:
Selects an action that occurs when the event is satisfied. This cannot be used for an
event point being used as the trace acquisition condition.
[Break]:
Causes a break (stop) in the user program when the event occurs. This is the
default action.
[Start Timer]:
Starts the run timer (the run timer value is displayed in the [Status] window).
[Stop Timer]:
Stops the run timer (the run timer value is displayed in the [Status] window).
[Delay after detection before break occurs]:
Sets a 16-bit delay (in bus cycles) after the event has occurred before the action is
taken. The delay is only applicable to break events and there is only one delay counter
in hardware, therefore only one breakpoint can have a non-zero delay. The range of
values is D’0 to D’65,535 (only available when [Break] has been selected). This
cannot be used for an event point being used as the trace acquisition condition.
288
[Required number of event occurrences]:
Allows a 16-bit pass count to be set. The event must occur the specified number of
times before the action is taken. The range of values is D’0 to D’65,535.
[Enable Sequencing]:
Allows the event to take part in a sequence of events (setting this requires the event to
use an event detector).
[Configure Sequence…]: Displays the [Event Sequencing] dialog box to allow the event sequencing to be
configured (only available when [Enable Sequencing] has been selected).
(5) [Event Sequencing] dialog box
This dialog box allows the user to define which events are triggered by other events. If this dialog box is
accessed (directly or indirectly) from [Trace Acquisition…], only those events assigned to the trace subsystem
are displayed. If accessed from the [Eventpoint] window, only the breakpoint or timer events are shown.
Figure 5.65 [Event Sequencing] Dialog Box
[Event]:
Selects an event point to be set.
[Is Armed By]:
Arms the selected event.
[Is Reset By]:
Resets the selected event.
[No occurrence of]:
Arms an event when the set of events being selected does not occur (only available
when [Is Armed By] has been selected).
The test of conditions on event points is started with the execution of the user program. The conditions on event
points have not been satisfied immediately after the execution of the user program is started.
Satisfaction of the condition on an event point allows a transition of the state to that where the condition is
satisfied.
289
The state where the condition is satisfied is retained until the user program is stopped or the event point is reset.
When the condition on the event point is satisfied, no action will be taken even if the condition is satisfied again.
If you want the action to be taken again, reset the event point so that the state transits to that where no condition
is satisfied.
When the user program is stopped, the states of all the event points transit to that where no condition is satisfied.
When an event point must be in the state where its condition is satisfied or not (when [No occurrence of] is
selected) as the satisfaction condition of another event point, this event point is called the arm event.
An event point can reset the tested states of conditions of other event points or itself by satisfying the condition.
This event point is called a reset event.
A reset event resets event points regardless of their states where the condition is satisfied or not (e.g., resetting
the pass count).
Select an event point from the [Event] combo box. To set an arm event on the selected event point, select [Is
Armed By] and check the box corresponding to each event. The [No occurrence of] check box is used to set a
condition that the arm event is in the state where its condition is not satisfied.
To set a reset event on the selected event point, select [Is Reset By] and check the box corresponding to each
event.
At the bottom of the screen is a diagram showing the current sequencing of the events (figure 5.65). The S input
sets (arms) an event and the R input resets it. The legend ~S indicates the event is set (armed) by the nonoccurrence of the input events.
Figure 5.65 is an example that Ch1 is the arm event for Ch2, Ch3, and Ch4. Ch3 is the arm event for Ch4. Ch2
and Ch4 are the reset events for Ch1 and Ch2, respectively.
To satisfy the condition of the event point having an arm event, the arm event must be in the state where the
condition is satisfied or not (when [No occurrence of] is selected). When multiple arm events exist on one event
point, one of the arm events must be in the state where the condition is satisfied or not (when [No occurrence of]
selected) to satisfy the condition of the event point.
As the condition of the arm event on one event point, either of the states where the condition is satisfied or not
should be set.
To reset an event point with a reset event, the condition of the reset event must be satisfied. While the condition
of the reset point is satisfied, no event point is reset even if the condition of the reset event is satisfied again.
When multiple reset events exist on one event point, the event point is reset when the condition of one of reset
events is satisfied.
290
5.15.8
Setting Trigger Points
The trigger point is an event to output a trigger when the specified address has been accessed. Up to four trigger
points can be set by using the trigger outputs (four channels) on the bus monitoring circuit of the emulator.
The settings of the trigger point are displayed and modified on the [Trigger] sheet.
Figure 5.66 [Event] Window ([Trigger] Sheet)
Selecting [Add...] or the event point and [Edit...] from the popup menu in this window displays the [Set Address
For Trigger] dialog box.
Figure 5.67 [Set Address For Trigger] Dialog Box
This dialog box allows the user to specify the address to be accessed as the trigger output condition during the
user program execution. Enable or disable the trigger output point by checking the check box on the left in the
screen.
[Trigger1]:
Enables the output of trigger channel 1.
[Trigger2]:
Enables the output of trigger channel 2.
[Trigger3]:
Enables the output of trigger channel 3.
[Trigger4]:
Enables the output of trigger channel 4.
[Address]:
Sets the address condition of the channel.
291
Notes: 1. When the condition set for the trigger output (1 to 4) is satisfied, the high-level signal will be output
from the corresponding pin (1 to 4) of the external probe 2 (EXT2) during reading or writing.
2. Some emulators may not support the trigger point. For details, refer to section 8, Software
Specifications Specific to This Product, or the online help.
5.15.9
Editing Event Points
Handlings for settings other than PC breakpoints, event points, and trigger points are common. The following
describes examples of such handling.
5.15.10 Modifying Event Points
Select an event point to be modified, and choose [Edit...] from the popup menu to open the dialog box that
corresponds the event, which allows the user to modify the event conditions. The [Edit...] menu is only available
when one event point is selected.
5.15.11 Enabling an Event Point
Select an event point and choose [Enable] from the popup menu to enable the selected event point.
5.15.12 Disabling an Event Point
Select an event point and choose [Disable] from the popup menu to disable the selected event point. When an
event point is disabled, the event point will remain in the list, but an event will not occur when the specified
conditions have been satisfied.
5.15.13 Deleting an Event Point
Select an event point and choose [Delete] from the popup menu to remove the selected event point. To retain the
event point but not have it cause an event when its conditions are met, use the [Disable] option (see section
5.15.12, Disabling an Event Point).
Note: No trigger point can be deleted. Use the [Disable] option to clear the settings.
5.15.14 Deleting All Event Points
Choose [Delete All] from the popup menu to remove all event points.
Note: No trigger point can be deleted. If [Delete All] is selected, the settings of all channels become disabled.
5.15.15 Viewing the Source Line for an Event Point
Select an event point and choose [Go to Source] from the popup menu to open the [Source] or [Disassembly]
window at address of event point. The [Go to Source] menu is only available when one event point that has the
corresponding source file is selected.
292
5.16
Viewing the Trace Information
The emulator acquires the results of each instruction execution into the trace buffer as trace information and
displays it in the [Trace] window. The conditions for the trace information acquisition can be specified in the
[Trace Acquisition] dialog box.
Since trace information in bus-cycles is acquired by the hardware circuit and stored in the trace buffer, the
realtime operation is retained. The [Trace] window displays the content of the trace buffer, which records up to
32,768 bus cycles from the last program run and is always updated.
5.16.1
Opening the [Trace] Window
To open the [Trace] window, choose [View -> Code -> Trace] or click the [Trace] toolbar button (
5.16.2
).
Acquiring Trace Information
When the emulator does not set the acquisition condition of the trace information, all bus cycles are acquired by
default without any condition (free trace mode).
In the free trace mode, trace acquisition is started with the execution of the user program and stopped by halting
the user program. The acquired trace information is displayed in the [Trace] window.
Figure 5.68 [Trace] Window
This window displays the following trace information items:
[PTR]:
Cycle number in the trace buffer. When the most recent record is record 0, earlier
record numbers go backwards (-1, -2, ...). If a delay count has been set, the cycle
number where the trace stop condition has been satisfied is record 0. For the cycle
(during delay) executed until the trace has stopped, earlier record numbers go forward
(+1, +2, ...) the most recent record.
[Address]:
Address (6-digit hexadecimal)
[Instruction]:
Disassembled code of the executed instruction
[Data]:
Data bus value, displayed as 2-digit or 4-digit hexadecimal
[R/W]:
Whether access was read (RD) or write (WR)
[Area]:
Memory area being accessed; ROM, RAM, 8- or 16-bit I/O, 8- or 16-bit EXT
(external), or DTC RAM (not available when a time stamp is acquired)
293
[Status]:
Bus status during this cycle; DTC operation, PROG (prefetch), Data (CPU data access
cycle), Refresh (refresh cycle), or DMAC (DMAC cycle) (not available when a time
stamp is acquired)
[Clock]:
Number of clock cycles in bus cycle as 1 to 8. To indicate more clock cycles, “OVR”
is displayed (not available when a time stamp is acquired).
[Probes]:
A 4-bit binary number showing the four probe pins in the order of Probe 4, Probe 3,
Probe 2, and Probe 1 from the left (not available when a time stamp is acquired).
[NMI]:
Status of the NMI input (not available when a time stamp is acquired)
[IRQ7-0]:
Status of eight IRQ inputs (not available when a time stamp is acquired)
[Timestamp]:
Time stamp of the record. Time stamps start from zero each time the user program is
executed. The timer resolution depends on the time stamp clock rate selected in the
trace acquisition (only available when a time stamp is acquired).
[Source]:
Source program
[Label]:
Label information that corresponds to the address (if defined)
[Timestamp-Difference]: Displays the difference from the timestamp value shown on the previous line (only
available when a time stamp is acquired).
Note: Items other than [PTR], [Address], [Instruction], [Data], [R/W], [Area], [Status], [Probes], [Timestamp],
[Source], [Label], and [Timestamp-Difference] vary according to the emulator in use. For details, refer to
section 8, Software Specifications Specific to This Product, or the online help.
It is possible to hide any column not necessary in the [Trace] window. Selecting a column you want to hide from
the popup menu displayed by clicking the right-hand mouse button on the header column hides that column. To
display the hidden column, select the column from the said popup menu again.
294
5.16.3
Specifying Trace Acquisition Conditions
The capacity of the trace buffer is limited. When the buffer becomes full, the oldest trace information is
overwritten. Setting the trace acquisition condition allows acquisition of useful trace information and effective
use of the trace buffer. The condition is enabled by the event point to control starting, stopping, and ending the
trace acquisition. For event points, refer to section 5.15, Using the Event Points.
The trace acquisition condition is set in the [Trace Acquisition] dialog box that is displayed by selecting
[Acquisition…] from the popup menu.
The [Trace Acquisition] dialog box has the following pages:
Table 5.4
[Trace Acquisition] Dialog Box Pages
Page
Item
[General]
Sets trace acquisition conditions.
[Stop]
Sets trace stop conditions (without a delay).
[Delayed Stop]
Sets trace stop conditions (with a delay).
[1] to [4]
Sets the range trace (only available when the free trace mode is
disabled).
(1) [General] page
Sets trace acquisition conditions.
Figure 5.69 [Trace Acquisition] Dialog Box ([General] Page)
295
[Suppress]:
Acquires no trace information of the specified types of bus cycle.
[Time Stamp]:
Sets a condition for time stamping.
[Clock]:
[Free Trace]:
Select either from Disabled, 125 ns, 250 ns, 500 ns, 1 us, 2 us, 4 us, 8 us, 16 us, or
100 us as the resolution for time stamping. A time stamp has a 32-bit counter. At 125
ns the maximum time that can be measured is about 9 minutes, and at 100 µs the
maximum time is about 5 days.
When the counter overflows, its content will be cleared to continue counting. No time
stamp information will be acquired when Disabled is selected.
Checking this box enables the free trace mode.
When the free trace mode is enabled: Starts acquiring the data immediately after program
execution has been started. Only the trace halt condition is available. The range trace is
unavailable and four range-trace pages (1 to 4) become disabled.
When the free trace mode is disabled: Sets the start and halt conditions of trace acquisition.
[Trace Events]: Sets event points to be used as trace acquisition conditions.
[Event]:
Lists the event points to be used as trace acquisition conditions.
[Add…]:
Adds a new event point.
[Edit…]:
Changes the setting for the selected event point.
[Sequence…]:
Configures an event sequence for the event point being used as a trace acquisition
condition. To set up the sequence, an event must have been set.
[Delete]:
Deletes the selected event point.
[Del All]:
Deletes all event points.
Notes: 1. The bus cycles that can be specified by the [Suppress] option vary according to the emulator in use.
For details, refer to section 5.15.4, Signals to Indicate Bus States and Areas.
2. The trace buffer is used for the time stamp information and some of the trace information. Therefore,
when the time stamp is acquired, it is impossible to acquire the trace information other than PTR,
Address, Instruction, Data, R/W, Source, Label, Timestamp, and Timestamp-Difference.
3. If an event that is used for the range trace or trace stop function is deleted, that function becomes
disabled.
296
(2) [Stop] page
Sets trace stop conditions. It is possible to set trace stop conditions with and without delay, with both allowed
simultaneously.
Figure 5.70 [Trace Acquisition] Dialog Box ([Stop] Page)
[Stop Without Delay]:
Defines a trace stop condition.
[Enable]:
Checking this box enables a trace stop.
[Events]:
Lists the event points where trace acquisition conditions have been set. If the
box that corresponds to an event point is checked, trace acquisition will be
stopped when that event is satisfied (only available when [Enable] has been
selected).
297
(3) [Delayed Stop] page
Sets trace stop conditions. It is possible to set trace stop conditions with and without delay, with both allowed
simultaneously.
Figure 5.71 [Trace Acquisition] Dialog Box ([Delayed Stop] Page)
[Stop With Delay]:
298
Defines a trace stop condition.
[Enable]:
Checking this box enables a trace stop.
[Delay Count]:
Sets the delay count (in bus cycles, range 1 to 65535). This function allows
you to acquire a number of trace records after any of the specified events
occur.
[Events]:
Lists the event points where trace acquisition conditions have been set. If the
box that corresponds to an event point is checked, trace acquisition will be
stopped when that event is satisfied (only available when [Enable] has been
selected).
(4) [1] to [4] pages
Sets a range trace. This is only available when the free trace mode is disabled. Select either of the following four
modes: [Disabled], [Point to Point], [Range], and [Event].
•
Disabled
Disables a range trace.
Figure 5.72 Range Trace Setting (Disabled)
299
•
Point to Point
Acquires trace information in the specified range.
Figure 5.73 Range Trace Setting (Point to Point)
[Start Address]:
Address where trace acquisition starts
[Stop Address]:
Address where trace acquisition stops
[Cyclic]:
When this box is checked, the event sequencing is configured so that the events reset
themselves which causes tracing to be restarted when the start event occurs after the stop event.
Sets the event points that are required to start or stop trace acquisition when the start or end address is accessed,
respectively.
Point to Point mode is an easy method to set up the event mode. The event to start or sop trace acquisition is an
access to a single address.
Select [Cyclic] to continue acquisition of the trace information only in the specified address range.
Note: This function automatically configures a sequence of event points. Note, however, that an unexpected
result may arise. In such cases, modify the setting of the sequence in the [Event Sequencing] dialog box.
300
•
Range
Only acquires the trace information that satisfies the specified condition.
Figure 5.74 Range Trace Setting (Range)
[Range Event]:
Selects an event point for which a trace acquisition condition has been set.
[Edit…]:
Changes the setting for the selected event point.
Only acquires trace information from all bus cycles that matches the condition set in the selected event. This
mode uses one event channel or range channel.
301
•
Event
Acquires trace information, controlling the start and end of trace acquisition with the specified condition.
Figure 5.75 Range Trace Setting (Event)
[Start Event]:
Selects the event point for which the condition to start trace acquisition has been set.
[Stop Event]:
Selects the event point for which the condition to stop trace acquisition has been set.
[Edit…]:
Changes the setting for the selected event point.
[Cyclic]:
When this box is checked, the event sequencing is configured so that the events reset
themselves which causes tracing to be restarted when the start event occurs after the stop event.
Starts and stops trace acquisition when the conditions for starting and ending are satisfied, respectively. Selecting
[Cyclic] allows a continuous acquisition of trace information that can be acquired with the specified condition.
302
5.16.4
Searching for a Trace Record
Use the [Trace Find] dialog box to search for a trace record. To open this dialog box, choose [Find...] from the
popup menu.
The [Trace Find] dialog box has the following options:
Table 5.5
[Trace Find] Dialog Box Pages
Page
Description
[General]
Sets the range for searching.
[Address]
Sets an address condition.
[Data]
Sets a data condition.
[R/W]
Selects the type of access cycles.
[Area]
Selects the area being accessed (not available when a time stamp is
acquired).
[Status]
Selects the status of a bus (not available when a time stamp is acquired).
[Probes]
Selects the status of four probe signals (not available when a time stamp
is acquired).
[IRQ7-0]
Selects the status of eight probe input signals (not available when a time
stamp is acquired).
[Timestamp]
Specify the time stamp value for bus cycles (only available when a time
stamp is acquired).
Note: Items other than [General], [Address], [Data], [R/W], [Area], [Status], [Probes], and [Timestamp] vary
according to the emulator in use. For details, refer to section 8, Software Specifications Specific to This
Product or the online help.
Clicking the [OK] button after setting conditions in those pages stores the settings and starts searching. Clicking
the [Cancel] button closes this dialog box without setting of conditions.
When a trace record that matches the search conditions is found, the line for the trace record will be highlighted.
When no matching trace record is found, a message dialog box will appear.
Only the trace information that satisfies all the conditions set in above pages will be searched.
If a find operation is successful, selecting [Find Next] from the popup menu will move to the next found item.
303
(1) [General] page
Set the range for searching.
Figure 5.76 [Trace Find] Dialog Box ([General] Page)
[Trace search range]:
Sets the range for searching.
[Not designation]:
Searches for information that does not match the conditions set in other
pages when this box is checked.
[Upward search]:
Searches upwards when this box is checked.
[Start PTR]:
Enters a PTR value to start a search.
[End PTR]:
Enters a PTR value to end a search.
Note: Along with setting the range for searching, PTR values to start and end searching can be set in the [Start
PTR] and [End PTR] options, respectively.
304
(2) [Address] page
Set an address condition.
Figure 5.77 [Trace Find] Dialog Box ([Address] Page)
[Don't care]:
Detects no address when this box is checked.
[Setting]:
Detects the specified address.
[Value]:
Enter the address value (not available when [Don’t care] has been checked).
305
(3) [Data] page
Set a data condition.
Figure 5.78 [Trace Find] Dialog Box ([Data] Page)
[Don't care]:
Detects no data when this box is checked.
[Setting]:
Detects the specified data.
[Value]:
306
Enter the data value (not available when [Don’t care] has been checked).
(4) [R/W] page
Select the type of access cycles.
Figure 5.79 [Trace Find] Dialog Box ([R/W] Page)
[Don't care]:
Detects no read/write condition when this box is checked.
[Setting]:
Detects the specified read/write condition.
[String]:
Select a read/write condition (not available when [Don’t care] has been checked).
RD: Read cycle
WR: Write cycle
307
(5) [Area] page
Select the area being accessed. The selection is not available when a time stamp is acquired.
Figure 5.80 [Trace Find] Dialog Box ([Area] Page)
[Don't care]:
Detects no area condition when this box is checked.
[Setting]:
Detects the specified area condition.
[String]:
Select an area condition (not available when [Don’t care] has been checked).
Note: Available areas vary according to the emulator in use. For details, refer to section 5.15.4, Signals to
Indicate Bus States and Areas.
308
(6) [Status] page
Select the status of a bus. The selection is not available when a time stamp is acquired.
Figure 5.81 [Trace Find] Dialog Box ([Status] Page)
[Don't care]:
Detects no bus condition when this box is checked.
[Setting]:
Detects the specified bus condition.
[String]:
Select a bus condition (not available when [Don’t care] has been checked).
Note: Available bus conditions vary according to the emulator in use. For details, refer to section 5.15.4,
Signals to Indicate Bus States and Areas.
309
(7) [Probes] page
Select the status of four probe signals. The selection is not available when a time stamp is acquired.
Figure 5.82 [Trace Find] Dialog Box ([Probes] Page)
[Don't care]:
Detects no probe signal condition when this box is checked.
[Setting]:
Detects the specified probe signal condition.
[Probe4] to [Probe1]:
Select probe conditions (not available when [Don’t care] has been checked).
Don't care: Detects no selected probe condition.
High: The status of the probe signal is high.
Low: The status of the probe signal is low.
310
(8) [IRQ7-0] page
Select the status of IRQ signals. The selection is not available when a time stamp is acquired.
Figure 5.83 [Trace Find] Dialog Box ([IRQ7-0] Page)
[Don't care]:
Detects no IRQ input condition when this box is checked.
[Setting]:
Detects the specified IRQ input condition.
[IRQ7] to [IRQ0]:
Select IRQ input conditions (not available when [Don’t care] has been
checked).
Don't care: Detects no selected IRQ input condition.
High: The status of the IRQ input is high.
Low: The status of the IRQ input is low.
311
(9) [Timestamp] page
Specify the time stamp value for bus cycles. The specification is not available when a time stamp is acquired.
Figure 5.84 [Trace Find] Dialog Box ([Timestamp] Page)
[Don't care]:
Detects no time stamp value when this box is checked.
[Setting]:
Detects the specified time stamp value. (Every field must be filled in.)
[Value]:
Enter the time stamp value.
The format is as follows:
hour: h, minute: min, second: s, millisecond: ms, microsecond: us, nanosecond: ns
(Not available when [Don’t care] has been checked.)
5.16.5
Clearing the Trace Information
Select [Clear] from the popup menu to empty the trace buffer that stores the trace information. If several [Trace]
windows are open, all [Trace] windows will be cleared as they all access the same buffer.
5.16.6
Saving the Trace Information in a File
Select [Save...] from the popup menu to open the [Save As] file dialog box, which allows the user to save the
information displayed in the [Trace] window as a text file. A range can be specified based on the [PTR] number
(saving the complete buffer may take several minutes). Note that this file cannot be reloaded into the [Trace]
window.
Note: In filtering of trace information, the range to be saved cannot be selected. All the trace information
displayed in the [Trace] window after filtering will be saved. Select a filtering range on the [General]
page in the [Trace Filter] dialog box if you want to save the selected range. For details on the filtering
function, refer to section 5.16.12, Extracting Records from the Acquired Information.
312
5.16.7
Viewing the [Source] Window
The [Source] window corresponding to the selected trace record can be displayed in the following two ways:
• Select a trace record and choose [View Source] from the popup menu.
• Double-click a trace record
The [Source] or [Disassembly] window opens and the selected line is marked with a cursor.
5.16.8
Trimming the Source
Choose [Trim Source] from the popup menu to remove the white space from the left side of the source.
When the white space is removed, a check mark is shown to the left of the [Trim Source] menu. To restore the
white space, choose [Trim Source] while the check mark is shown.
5.16.9
Acquiring a Snapshot of the Trace Information
A snapshot can be acquired when you need to check the trace information during execution of the user program.
This is useful for checking time stamping or probe input signals. To acquire a snapshot of trace information,
select [Snapshot] from the popup menu. Trace acquisition is temporarily stopped to display a record of the latest
trace information, and then restarted. A snapshot of trace information is only acquired during execution of the
user program.
5.16.10 Temporarily Stopping Trace Acquisition
To temporarily stop trace acquisition during execution of the user program, select [Halt] from the popup menu.
This stops trace acquisition and updates the trace display. Use this method to check the trace information without
stopping execution of the user program.
5.16.11 Restarting Trace Acquisition
To restart trace acquisition being stopped during execution of the user program, select [Restart] from the popup
menu.
313
5.16.12 Extracting Records from the Acquired Information
Use the filtering function to extract the records you need from the acquired trace information. The filtering
function allows the trace information acquired by hardware to be filtered by software. Unlike the settings made
in the [Trace Acquisition] dialog box for acquiring trace information by conditions, changing the settings for
filtering several times to filter the acquired trace information allows easy extraction of necessary information,
which is useful for analysis of data. The content of the trace buffer will not be changed even when the filtering
function is used. Acquiring useful information as much as possible by the [Trace Acquisition] settings improves
the efficiency in analysis of data because the capacity of the trace buffer is limited.
Use the filtering function in the [Trace Filter] dialog box. To open the [Trace Filter] dialog box, select [Filter…]
from the popup menu.
The [Trace Filter] dialog box has the following pages:
Table 5.6
[Trace Filter] Dialog Box Pages
Page
Description
[General]
Selects the range for filtering.
[Address]
Sets address conditions.
[Data]
Sets data conditions.
[R/W]
Selects the type of access cycles.
[Area]
Selects the area being accessed (not available when a time stamp is
acquired).
[Status]
Sets the status of a bus (not available when a time stamp is acquired).
[Probes]
Selects the states of four probe signals (not available when a time stamp
is acquired).
[IRQ7-0]
Selects the states of eight IRQ input signals (not available when a time
stamp is acquired).
[Timestamp]
Specifies the time stamp value for bus cycles (only available when a time
stamp is acquired).
Note: Items other than [General], [Address], [Data], [R/W], [Area], [Status], [Probes], and [Timestamp] vary
according to the emulator in use. For details, refer to section 8, Software Specifications Specific to This
Product or the online help.
Set filtering conditions and then press the [OK] button. This starts filtering according to the conditions. Clicking
the [Cancel] button closes the [Trace Filter] dialog box, which holds the settings at the time when the dialog box
was opened.
In filtering, only the trace information that satisfies one or more filtering conditions set in the above pages will
be displayed in the [Trace] window.
Filtering conditions can be changed several times to analyze data because the content of the trace buffer is not
changed by filtering.
314
(1) [General] page
Set the range for filtering.
Figure 5.85 [Trace Filter] Dialog Box ([General] Page)
[Don't care other pages]: Only selects the cycle number when this box is checked. Other options become
invalid.
[Enable Filter]:
Enables the filter when this box is checked.
[No]:
Filters information that does not match the conditions set in those pages when this
box is checked.
[Trace display range]:
Sets the range for filtering.
[Start PTR]:
Enters a PTR value to start filtering.
[End PTR]:
Enters a PTR value to end filtering.
Note: Along with setting the range for filtering, PTR values to start and end filtering can be set in the [Start
PTR] and [End PTR] options, respectively.
315
(2) [Address] page
Set address conditions.
Figure 5.86 [Trace Filter] Dialog Box ([Address] Page)
[Don't care]:
Detects no address when this box is checked.
[Setting]:
Detects the specified address.
[Point]:
Specifies a single address (not available when [Don’t care] has been checked).
[Range]:
Specifies an address range (not available when [Don’t care] has been checked).
[From]:
Enter a single address or the start of the address range (not available when [Don’t
care] has been checked).
[To]:
Enter a single address or the end of the address range (only available when [Range]
has been selected).
Note: Along with setting the address range, the start and end of the address range can be set in the [From] and
[To] options, respectively.
316
(3) [Data] page
Set a data condition.
Figure 5.87 [Trace Filter] Dialog Box ([Data] Page)
[Don't care]:
Detects no data when this box is checked.
[Setting]:
Detects the specified data.
[Point]:
Specifies single data (not available when [Don’t care] has been checked).
[Range]:
Specifies a data range (not available when [Don’t care] has been checked).
[From]:
Enter single data or the minimum value of the data range (not available when [Don’t
care] has been checked).
[To]:
Enter the maximum value of the data range (only available when [Range] has been
selected).
Note: Along with setting the data range, the minimum and maximum values can be set in the [From] and [To]
options, respectively.
317
(4) [R/W] page
Select the type of access cycles.
Figure 5.88 [Trace Filter] Dialog Box ([R/W] Page)
[Don't care]:
Detects no read/write condition when this box is checked.
[Setting]:
Detects the specified read/write condition.
318
RD:
Detects read cycles when this box is checked (not available when [Don’t care] has
been checked).
WR:
Detects write cycles when this box is checked (not available when [Don’t care] has
been checked).
(5) [Area] page
Select the area being accessed. The selection is not available when a time stamp is acquired.
Figure 5.89 [Trace Filter] Dialog Box ([Area] Page)
[Don't care]:
Detects no area condition when this box is checked.
[Setting]:
Detects the specified area condition (not available when [Don’t care] has been checked).
Note: Available area conditions vary according to the emulator in use. For details, refer to section 5.15.4,
Signals to Indicate Bus States and Areas.
319
(6) [Status] page
Select the status of a bus. The selection is not available when a time stamp is acquired.
Figure 5.90 [Trace Filter] Dialog Box ([Status] Page)
[Don't care]:
Detects no bus condition when this box is checked.
[Setting]:
Detects the specified bus condition (not available when [Don’t care] has been checked).
Note: Available bus conditions vary according to the emulator in use. For details, refer to section 5.15.4,
Signals to Indicate Bus States and Areas.
320
(7) [Probes] page
Select the status of four probe signals. The selection is not available when a time stamp is acquired.
Figure 5.91 [Trace Filter] Dialog Box ([Probes] Page)
[Don't care]:
Detects no probe signal condition when this box is checked.
[Setting]:
Detects the specified probe signal condition.
[Probe4] to [Probe1]:
Select probe conditions (not available when [Don’t care] has been checked).
Don't care: Detects no selected probe condition.
High: The status of the probe signal is high.
Low: The status of the probe signal is low.
321
(8) [IRQ7-0] page
Select the status of IRQ signals. The selection is not available when a time stamp is acquired.
Figure 5.92 [Trace Filter] Dialog Box ([IRQ7-0] Page)
[Don't care]:
Detects no IRQ input condition when this box is checked.
[Setting]:
Detects the specified IRQ input condition.
[IRQ7] to [IRQ0]:
Select IRQ input conditions (not available when [Don’t care] has been
checked).
Don't care: Detects no selected IRQ input condition.
High: The status of the IRQ input is high.
Low: The status of the IRQ input is low.
322
(9) [Timestamp] page
Specify the time stamp value for bus cycles. The specification is not available when a time stamp is acquired.
Figure 5.93 [Trace Filter] Dialog Box ([Timestamp] Page)
[Don't care]:
Detects no time stamp value when this box is checked.
[Setting]:
Detects the specified time stamp value.
[Point]:
Specifies a single time stamp (not available when [Don’t care] has been checked).
[Range]:
Specifies a time stamp range (not available when [Don’t care] has been checked).
[From]:
Enter a single time stamp value or the minimum value of the time stamp range.
The format is as follows:
hour: h, minute: min, second: s, millisecond: ms, microsecond: us, nanosecond: ns
(Not available when [Don’t care] has been checked.)
[To]:
Enter the maximum value of the time stamp range.
The format is as follows:
hour: h, minute: min, second: s, millisecond: ms, microsecond: us, nanosecond: ns
(Only available when [Range] has been selected.)
Note: Along with setting the time stamp range, the minimum and maximum time stamp values can be set in the
[From] and [To] options, respectively.
323
5.16.13 Calculating the Difference in Time Stamping
Select [Timestamp Difference…] from the popup menu to calculate the time difference between the two points
selected by the result of tracing in acquisition of time stamp information.
Figure 5.94 [Timestamp Difference] Dialog Box
[Select 2 line]:
Select trace records to calculate the time stamp difference.
[First PTR]:
Specifies the first pointer to measure the difference. The pointer of the line
selected on the Trace window is displayed by default.
[Second PTR]:
Specifies the second pointer to measure the difference.
[Timestamp Difference]: Displays the results of calculation.
[Get Difference]:
Calculates the difference between the specified two points and display its result in the
[Timestamp Difference] list.
[Clear]:
Clears all the results in the [Timestamp Difference] list.
[OK]:
Closes the dialog box. All the results in the [Timestamp Difference] list are cleared.
324
5.16.14 Analyzing Statistical Information
Choose [Statistic] from the popup menu to open the [Statistic] dialog box and analyze statistical information
under the specified conditions.
Figure 5.95 [Statistic] Dialog Box
[Statistic Analysis]:
Setting required for analysis of statistical information.
[Default]:
Sets a single input value or character string.
[Range]:
Sets the input value or character string as a range.
[Item]:
Sets the item for analysis.
[Start]:
Sets the input value or character string. To set a range, the start value must be
specified here.
[End]:
Specify the end value if a range has been set (only available when [Range] has been
selected).
[Set]:
Adds a new condition to the current one.
[New]:
Creates a new condition.
[Result]:
Obtains the result of statistical information analysis.
[Clear]:
Clears all conditions and results of statistical information analysis.
[Close]:
Closes this dialog box. All the results displayed in the [Result] list will be cleared.
325
This dialog box allows the user to analyze statistical information concerning the trace information. Set the target
of analysis in [Item] and the input value or character string by [Start] and [End]. Click the [Result] button after
setting a condition by pressing the [New] or [Add] button to analyze the statistical information and display its
result in the [Result] list.
Note: In this emulator, only [PTR] can be set as a range. Each of other items must be specified as a character
string. In analysis of statistical information, character strings are compared with those displayed in the
[Trace] window. Only those that completely match are counted. Note, however, that this test is not case
sensitive. The number of blanks will not be cared either.
5.16.15 Extracting Function Calls from the Acquired Trace Information
To extract function calls from the acquired trace information, select [Function Call…] from the popup menu.
The [Function Call Display] dialog box will be displayed.
Figure 5.96 [Function Call Display] Dialog Box
[Setting]:
Selects whether or not to extract function calls.
[Enable]:
Extracts function calls.
[Disable]:
Does not extract function calls.
When [Enable] is selected, only the cycles that include function calls are extracted for display from the acquired
trace information. The content of the trace buffer is not changed by extraction of function calls. Using this
function for the result of the free trace or the trace information that includes function calls allows the user to
know the order of function calls.
326
5.17
Viewing the Function Call History
The [Stack Trace] window shows the function call history.
5.17.1
Opening the [Stack Trace] Window
To open the [Stack Trace] window, choose [View -> Code -> Stack Trace] or click the [Stack Trace] toolbar
button ( ).
Figure 5.97 [Stack Trace] Window
The following items are displayed.
[Kind]:
Indicates the type of the symbol.
F: Function
P: Function parameter
L: Local variable
[Name]:
Indicates the symbol name.
[Value]:
Indicates the value, address, and type of the symbol.
5.17.2
Viewing the Source Program
Select a function and choose [Go to Source] from the popup menu to display, in the [Source] window, the source
program corresponding to the selected function.
327
5.17.3
Specifying the View
Choose [View Setting...] from the popup menu to open the [Stack Trace Setting] dialog box, which allows the
user to specify the [Stack Trace] window settings.
Figure 5.98 [Stack Trace Setting] Dialog Box
[Nest level]:
Specifies the level of function call nesting to be displayed in the [Stack Trace] window.
[Display symbol]:
Specifies the symbol types to be displayed in addition to functions.
[Display Radix]:
Specifies the radix for displays in the [Stack Trace] window.
328
5.18
Displaying Memory Contents as an Image
The memory contents can be displayed as an image in the [Image View] window.
5.18.1
Opening the [Image View] Window
Choose [View -> Graphic -> Image…] or click the [Image] toolbar button (
dialog box shown in figure 5.99.
) to open the [Image Properties]
Figure 5.99 [Image Properties] Dialog Box
The [Image Properties] dialog box is used to specify the display method of the [Image View] window.
329
The following items are to be specified:
[Color Information]:
Specifies the color information of the image to be displayed.
[Mode]:
Specifies the format.
[MONOCHROME]: Black and white.
[RGB]:
R (red), G (green), and B (blue)
[BGR]:
B (blue), G (green), and R (red)
[YCbCr]:
Y (luminance), Cb (color difference for blue),
and Cr (color difference for red)
[Bit/Pixel]:
Specifies bits/pixel (valid when RGB or BGR is selected).
[Sampling]:
Specifies the format of sampling (valid when YCbCr is selected).
[Format]:
Specifies chunky/planar (valid when YCbCr is selected).
[Buffer Information]:
Specifies the area to store data, size, and the address of the palette.
[Data Address]:
Specifies the first address in memory of the area for display as image data (in
hexadecimal notation).
[Palette Address]:
Specifies the first address in memory of the color-palette data
(in hexadecimal notation; valid when “8Bit” has been selected for RGB or BGR).
[Width/Height Size]: Specifies the width and height of the image.
[Width (Pixel)]:
Specifies the width of the image (unless a
prefix is included, values are treated as
decimal numbers).
[Height (Pixel)]:
Specifies the height of the image (unless a
prefix is included, values are treated as
decimal numbers).
[Buffer Size]:
Displays the size of the buffer required for
image display as obtained from the width and
height (in hexadecimal notation).
[View Information]:
[View Mode]:
Specifies the location, size, and data start location of the part to be
displayed among the entire image.
Specifies whether display is on all or part of the screen.
[Full Size]:
The image is displayed on the whole screen.
[Part Size]:
The image is displayed on part of the screen.
[Start Position]:
[Top]:
[Bottom]:
[Position]:
330
Display of data starts at the upper-left
position.
Display of data starts at the lower-left
position.
Specifies the position on the screen from which image display is to start (valid when
[Part Size] is selected).
[X Position]:
Specifies the X-coordinate of the start
position (unless a prefix is included, values
are treated as decimal numbers).
[Y Position]:
Specifies the Y-coordinate of the start
location (unless a prefix is included, values
are treated as decimal numbers).
[Width/Height Size]: Specifies the height and width of an image to be displayed on part of the screen.
[Width (Pixel)]:
Specifies the width of the display (unless a
prefix is included, values are treated as
decimal numbers).
[Height (Pixel)]:
Specifies the height of the display (unless a
prefix is included, values are treated as
decimal numbers).
After the settings have been made in the [Image Properties] dialog box, clicking the [OK] button opens the
[Image View] window.
Even after the [Image View] window is displayed, the display contents can be modified by opening this dialog
box by choosing [Properties…] from the popup menu.
Figure 5.100 [Image View] Window
The memory content is displayed as an image.
5.18.2
Automatically Updating the Window Contents
Checking [Auto Refresh] in the popup menu will allow the window contents to be automatically updated when
user program execution stops.
331
5.18.3
Updating the Window Contents
Selecting [Refresh Now] from the popup menu immediately updates the window contents.
5.18.4
Displaying the Pixel Information
Double-clicking within the window displays information on the pixel on which the mouse pointer is located in
the [Pixel Information] dialog box.
Figure 5.101 [Pixel Information] Dialog Box
This dialog box displays pixel information on the cursor location.
[Color Mode]:
Displays the format of the image.
[Pixel]:
Displays color information on the pixel under the cursor (in decimal notation).
[Position]:
Displays the cursor location as X and Y coordinates (in decimal notation).
[X]:
X coordinate of the cursor.
[Y]:
Y coordinate of the cursor.
[Buffer Size]:
Displays the buffer size in decimal notation.
[Width]:
Width of the buffer.
[Height]:
Height of the buffer.
[Image Size]:
Displays the width and height of the display in decimal notation.
[Width]:
Width of the display.
[Height]:
Height of the display.
332
5.19
Displaying Memory Contents as Waveforms
Memory contents can be displayed as waveforms in the [Waveform View] window.
5.19.1
Opening the Waveform View Window
Choose [View -> Graphic -> Waveform…] or click the [Waveform] toolbar button (
Properties] dialog box shown in figure 5.102.
) to open the [Waveform
Figure 5.102 [Waveform Properties] Dialog Box
Specifies the waveform format. The following items can be specified.
[Data Address]: Specifies the start address of data in memory (displayed in hexadecimal).
[Data Size]:
Selects 8Bit or 16Bit.
[Channel]:
Selects Mono or Stereo.
[Buffer Size]:
Specifies the buffer size of data (displayed in hexadecimal).
After the settings have been made in the [Waveform Properties] dialog box, clicking the [OK] button opens the
[Waveform View] window.
Even after the [Waveform View] window is displayed, the display contents can be modified by opening this
dialog box by choosing [Properties…] from the popup menu.
333
Figure 5.103 [Waveform View] Window
Displays the memory contents as waveforms. The X axis shows the number of sampling data and the Y axis
shows the sampling value.
5.19.2
Automatically Updating the Window Contents
Checking [Auto Refresh] in the popup menu will allow the window contents to be automatically updated when
user program execution stops.
5.19.3
Updating the Window Contents
Selecting [Refresh Now] from the popup menu immediately updates the window contents.
5.19.4
Zoom-In Display
Selecting [Zoom In] from the popup menu displays the waveforms with the horizontal axis enlarged.
5.19.5
Zoom-Out Display
Selecting [Zoom Out] from the popup menu displays the waveforms with the horizontal axis reduced.
5.19.6
Resetting the Zoom Display
Selecting [Reset Zoom] from the popup menu displays the waveforms in its original size.
5.19.7
Setting the Zoom Magnification
In the [Zoom Magnification] submenu of the popup menu, the zoom magnification can be selected from 2, 4, or
8.
5.19.8
Setting the Horizontal Scale
In the [XScale] submenu of the popup menu, the size of the X axis can be selected from 128, 256, or 512 pixels.
334
5.19.9
Non-Display of Cursor
Selecting [Clear Cursor] from the popup menu hides the cursor display.
5.19.10 Displaying the Sampling Information
Selecting [Sample Information…] from the popup menu displays the [Sample Information] dialog box.
Figure 5.104 [Sample Information] Dialog Box
Displays the sampling information of the cursor location in the [Waveform View] window. The following
information is displayed.
[Data Size]:
Displays 8bit or 16bit.
[Channel]:
Displays the data channel.
[Value]: [X]
[Y]
Displays the X axis of cursor location.
Displays the Y axis of cursor location (displays Y axes for both the upper and
lower plots when Stereo is selected).
335
5.20
Analyzing Performance
Use the performance analysis function to measure the rate of execution time. The performance analysis function
does not affect the realtime operation because it measures the rate of execution time in the specified range by
using the circuit for measurement of hardware performance included in the emulator.
Select either of the following five modes according to the purpose of measurement.
Table 5.7
Available Measurement Modes
Mode
Description
Purpose
Time Of Specified Range
Measurement
Measures the execution time and
execution count in the specified
range.
Measurement of time taken for
processing of functions except for
that required for child functions
called from the functions.
Start Point To End Point
Measurement
Measures the execution time and
execution count between the
specified addresses.
Measurement of time taken for
processing of functions.
Start Range To End
Range Measurement
Measures the execution time
from a specified range to another
specified range.
Measurement of execution time
spent from calling of any of
sequential subroutines to calling of
any of another sequential
subroutines in a program that
includes subroutines in sequence,
such as an assembly program.
Access Count Of
Specified Range
Measurement
Measures the number of times a
specified range is accessed from
another specified range.
Measurement of the number of
times a global variable is accessed
from a specific function.
Called Count Of
Specified Range
Measurement
Measures the number of times a
specified range has called
another specified range.
Measurement of the number of
times a function is called from a
specific function.
Use eight performance channels installed on the circuit for measurement of hardware performance in the
emulator for setting of conditions for measurement. Up to eight points can be set.
Note, however, that up to four points can be set in Start Range To End Range Measurement, Access Count Of
Specified Range Measurement, or Called Count Of Specified Range Measurement because two sequential points
are used for setting a condition in these modes.
336
Table 5.8
Mode Settings for Measurement
Point
Page
1
2
3
4
5
6
7
8
Time Of Specified Range
Measurement
Ο
Ο
Ο
Ο
Ο
Ο
Ο
Ο
Start Point To End Point
Measurement
Ο
Ο
Ο
Ο
Ο
Ο
Ο
Ο
Start Range To End
Range Measurement
Ο
Ο
Ο
Ο
Access Count Of
Specified Range
Measurement
Ο
Ο
Ο
Ο
Called Count Of
Specified Range
Measurement
Ο
Ο
Ο
Ο
Note: Ο: Available
: Not available
Note: Only one point is used in Time Of Specified Range Measurement and Start Point To End Point
Measurement, while two sequential points are used in Start Range To End Range Measurement, Access
Count Of Specified Range Measurement, and Called Count Of Specified Range Measurement. The
conditions that have been set will be canceled when switching these modes of different types.
337
5.20.1
Opening the [Performance Analysis] Window
Choose [View -> Performance -> Performance Analysis] or click the [PA] toolbar button (
[Select Performance Analysis Type] dialog box.
) to open the
Figure 5.105 [Select Performance Analysis Type] Window
Select [E6000 Performance Analysis] and then click the [OK] button to open the [Performance Analysis]
window.
Figure 5.106 [Performance Analysis] Window
This window displays the rate of execution time in the area selected by the user during the last program run in
percentages, histogram, or numerical values.
It is possible to hide any column not necessary in the [Performance Analysis] window. Selecting a column you
want to hide from the popup menu displayed by clicking the right-hand mouse button on the header column
hides that column. To display the hidden column, select the column from the said popup menu again.
338
5.20.2
Setting Conditions for Measurement
Conditions for measurement can be displayed and changed in the [Performance Analysis] window. Select a point
where a condition is to be set, and then select [Set…] from the popup menu to display the [Performance Analysis
Properties] dialog box.
Select either from the following five modes as the condition by the [Measurement Method] option:
Table 5.9
Conditions for Measurement (Measurement Method)
[Measurement Method] Option
Time Of Specified Range Measurement
Start Point To End Point Measurement
Start Range To End Range Measurement
Access Count Of Specified Range Measurement
Called Count Of Specified Range Measurement
Set a condition for measurement according to the mode being selected. The parameters to be set depend on the
modes.
The [Performance Analysis] window has a support function to enter the address range of a function
automatically if the name of the function is entered to set an address range. Entering a function name in the
[Input Function Range] dialog box displayed by clicking the […] button on the [Performance Analysis
Properties] dialog box automatically enters the address range of the function.
Figure 5.107 [Input Function Range] Window
Notes: 1. Entering the name of an overload function or a class opens the [Select Function] dialog box. Select a
function in this dialog box. For details on the dialog box, refer to section 5.13.3, Supporting
Duplicate Labels.
2. The addresses figured out are just for reference. In some cases, the end address of a function may be
different. Check the last instruction of the function in the [Disassembly] window to correct the value
set in [End Address] so that it will be the address of the last instruction (in general, the last instruction
of a function is a RTS instruction). A label name or an expression can be entered instead of an
address value in boxes where an address should be entered.
339
(1) Time Of Specified Range Measurement
Figure 5.108 Time Of Specified Range Settings
[Range Name]:
The name of the range to be measured
[Range]:
The range for the Time Of Specified Range Measurement
[Start Address]:
Address to start measurement
[End Address]:
Address to end measurement
Measures the execution time and the execution count in the range between the start address and end address.
Starts measurement with a detected program prefetch in the range specified between the start and end addresses,
and then stops with a detected program prefetch out of the specified range. Measurement can be restarted with a
detected program prefetch in the specified range. The execution count is incremented every time the program is
prefetched at the end address of the specified range. The execution time measured does not include the time
spent while being called from the specified range.
340
(2) Start Point To End Point Measurement
Figure 5.109 Start Point To End Point Measurement Settings
[Range Name]:
The name of the range to be measured
[Point]:
The range for the Start Point To End Point Measurement
[Start Address]:
Address to start measurement
[End Address]:
Address to end measurement
[Time Out]:
The timeout value to finish measurement. When the minimum time for measurement
is 160 ns, 40 ns, or 20 ns, enter the value as follows.
Example: 1h 2min 3s 123ms 456us 789ns
If the CPU operating mode is target, enter a hexadecimal number in 10 digits.
Example: 123456789A
A break occurs every time a value measured in the specified range exceeds the
timeout value (not the total time). This is only available for channel 1.
[Count]:
The count-up value used in measurement of the execution count. A break occurs
every time the execution count exceeds the count-up value. This is only available for
channel 1.
Measures the execution time and the execution count in the range between start address and end address. Starts
measurement with a detected program prefetch at the start address, and then stops with a detected program
prefetch at the end address. The execution count is incremented every time the program is prefetched at the end
address of the specified range. The execution time measured includes the time spent while being called from the
specified range. When either from one to four points is selected, the maximum and minimum time in the
specified range can be measured.
341
Notes: 1. When [Time Out] is selected in the Start Point To End Point Measurement mode, the execution time
will not be measured correctly.
2. When [Time Out] and [Count] are selected, satisfaction of either of these options stops execution of
the user program (performance break).
3. Only channel 1 can be used for [Time Out] and [Count]. Use other channels if you do not want to
select [Time Out] or [Count] in the Start Point To End Point Measurement mode.
342
(3) Start Range To End Range Measurement
Figure 5.110 Start Range To End Range Measurement Settings
[Range Name]:
The name of the range to be measured
[Start Range]:
The start range for the Start Range To End Range Measurement
[Start Address]:
Start address
[End Address]:
End address
[End Range]:
The end range for the Start Range To End Range Measurement
[Start Address]:
Start address
[End Address]:
End address
Starts measurement with a detected prefetch cycle in the specified start address range, and then stops with a
detected prefetch cycle in the specified end address range. The execution count is incremented every time the
program passes the end address range.
343
(4) Access Count Of Specified Range Measurement
Figure 5.111 Access Count Of Specified Range Measurement Settings
[Range Name]:
The name of the range to be measured
[Range]:
The range for the Access Count Of Specified Range Measurement
[Start Address]:
Start address
[End Address]:
End address
[Access Area Range]:
The access range for the Access Count Of Specified Range Measurement
[Start Address]:
Start address
[End Address]:
End address
[Access Type]:
The bus cycle on the access range to be measured
Measures the number of times the range specified as the access range is accessed from the range specified by the
start and end addresses. The execution count in the range is measured with Time Of Specified Range
Measurement mode.
Note: Available bus cycle conditions vary according to the emulator in use. For details, refer to section 5.15.4,
Signals to Indicate Bus States and Areas.
344
(5) Called Count Of Specified Range Measurement
Figure 5.112 Called Count Of Specified Range Measurement Settings
[Range Name]:
The name of the range to be measured
[Range]:
The range for the Called Count Of Specified Range Measurement
[Start Address]:
Start address
[End Address]:
End address
[Call Range]:
The range for the Called Count Of Specified Range Measurement. As the call range,
specify the start and end addresses of the selected subroutine.
[Start Address]:
Start address
[End Address]:
End address
Measures the number of times the range specified as the call range is called from the range specified by the start
and end addresses. The execution time in the specified range can be measured with Time Of Specified Range
Measurement mode. As the call range, specify the start and end addresses of the selected subroutine.
345
5.20.3
Selecting the Address Detection Mode and Resolution
In measurement of hardware performance, there are two types of address detection modes: prefetch address
detection mode and PC address detection mode. Select the appropriate address detection mode according to the
measurement mode in use. The resolution can also be selected here.
To select an address detection mode and resolution, click the [Settings…] button on the [Performance Analysis
Properties] dialog box. The [Common Settings of Performance(PA1-8)] dialog box will be displayed.
Figure 5.113 [Common Settings of Performance(PA1-8)] Dialog Box
[Address Control Mode]:
Select the method to detect addresses for the rate of execution time.
PC: PC address detection mode
Prefetch: Prefetch address detection mode
[Time Measurement Unit]:
Select the timer resolution to be used for measurement from 160ns, 40ns,
20ns, or Target. The timer for execution time measurement has a 40-bit
counter. At 20 ns the maximum time that can be measured is about six hours,
and at 160 µs the maximum time is about two days. When the counter
overflows, “Timer Overflow” is displayed as the result of measurement.
When Target is selected, the counter is incremented by an input clock. The
result of measurement is displayed as 10 digits in hexadecimal.
Select the prefetch address detection mode in Access Count Of Specified Range Measurement, and PC address
detection mode in other measurement modes. Otherwise, the result of the measurement will be incorrect.
5.20.4
Starting Performance Data Acquisition
Executing the user program clears the result of previous measurement and automatically starts measuring the rate
of execution time according to the conditions that have been set. Stopping the user program displays the result of
measurement in the [Performance Analysis] window.
5.20.5
Deleting a Measurement Condition
Select [Reset] from the popup menu with a measurement condition selected to delete the condition.
5.20.6
Deleting All Measurement Conditions
Choose [Reset All] from the popup menu to delete all the conditions that have been set.
346
Section 6 Tutorial
6.1 Introduction
The following describes the main functions of the emulator by using a tutorial program.
The tutorial program is based on the C++ program that sorts ten random data items in ascending or descending
order. The tutorial program performs the following actions:
• The main function repeatedly calls the tutorial function to repeat sorting.
• The tutorial function generates random data to be sorted and calls the sort and tutorial functions
in order.
• The sort function enters the array where the random data generated by the tutorial function are stored,
and sorts them in ascending order.
• The change function then sorts the array, which was sorted in ascending order by the sort function, in
descending order.
The file tutorial.cpp contains source code for the tutorial program. The file Tutorial.abs is a
compiled load module in the Dwarf2 format.
Notes: 1. After recompilation, the addresses may differ from those given in this section.
2. This section describes general usage examples for the emulator. For the specifications of particular
products, refer to section 8, Software Specifications Specific to This Product, or the online help.
3. The operation address of Tutorial.abs attached to each product differs according to products.
Replace the address used in this section with the relevant address in each product after checking that
it is placed on the corresponding line of the source program.
4. In this tutorial, the H8S/2633 E6000 emulator is taken as an example. File paths or the appearance of
figures differs according to products.
347
6.2 Running the HEW
Open a workspace by following the procedure listed in section 4.2.3, Selecting an Existing Workspace.
Select the following directory:
HEW installation destination directory\Tools\Renesas\DebugComp\Platform\E6000\2633\Tutorial
Note: The file path differs depending on the product. Refer to section 8.2.1, Environment for Execution of the
Tutorial Program.
Then select the file indicated below.
Figure 6.1 [Open Workspace] Dialog Box
Opening this workspace automatically connects the emulator.
348
6.3 Downloading the Tutorial Program
6.3.1 Downloading the Tutorial Program
Download the object program to be debugged.
• Select [Download module] from the popupmenu opened by clicking the right-hand mouse button on
[Tutorial.abs] of [Download modules].
Figure 6.2 Downloading the Tutorial Program
349
6.3.2 Displaying the Source Program
The HEW allows the user to debug a user program at the source level.
• Double-click [Tutorial.cpp] under [C++ source file].
Figure 6.3 [Source] Window (Displaying the Source Program)
• Select a font and size that are legible if necessary. For details, refer to section 4, Using the Editor in the HEW
part.
Initially the [Source] window shows the start of the user program, but the user can use the scroll bar to scroll
through the user program and look at the other statements.
350
6.4 Setting a PC Breakpoint
A PC breakpoint is a simple debugging function.
The [Source] window provides a very simple way of setting a PC breakpoint at any point in a program. For
example, to set a PC breakpoint at the sort function call:
• Select by double-clicking the [Editor] column on the line containing the sort function call.
Figure 6.4 [Source] Window (Setting a PC Breakpoint)
The symbol • will appear on the line containing the sort function. This shows that a PC breakpoint has
been set.
351
6.5 Setting Registers
Set a value of the program counter before executing the program.
• Select [Registers] from the [CPU] submenu of the [View] menu. The [Register] window is displayed.
Figure 6.5 [Register] Window
• To change the value of the program counter (PC), double-click the value area in the [Register] window with
the mouse. The following dialog box is then displayed, and the value can be changed. Set the program
counter to H’00000400 in this tutorial program, and click the [OK] button.
Figure 6.6 [Register] Dialog Box (PC)
352
6.6 Executing the Program
Execute the program as described in the following:
• To execute the program, select [Go] from the [Debug] menu, or click the [Go] button on the toolbar.
Figure 6.7 [Go] Button
While the program is executing, the current address bus value and the operating state of the MCU are displayed
on the status bar.
The program will be executed up to the breakpoint that has been inserted, and an arrow will appear on the
[Editor] column in the [Source] window to show the position that the program has halted, with the message
[Break = PC Break] in the status bar.
Note: When the source file is displayed after a break, a path of the source file may be inquired. The location of
the source file is as follows:
HEW installation destination directory\Tools\Renesas\DebugComp\Platform
\E6000\2633\Tutorial\source
The file path differs according to products. If necessary, replace \2633 with another name.
Figure 6.8 [Source] Window (Break Status)
353
The user can see the cause of the break that occurred last time in the [Status] window.
• Select [Status] from the [CPU] submenu of the [View] menu. After the [Status] window is displayed, open
the [Platform] sheet, and check the Status of Cause of last break.
Figure 6.9 [Status] Window
Note: The items that can be displayed in this window differ depending on the product. For the items that can
be displayed, refer to section 8, Software Specifications Specific to This Product, or the online help.
354
6.7 Reviewing Breakpoints
The user can see all the breakpoints set in the program in the [Event] window.
• Select [Eventpoints] from the [Code] submenu of the [View] menu. The [Event] window is displayed. Select
the [Breakpoint] sheet.
Figure 6.10 [Event] Window
The popup menu, opened by clicking the [Event] window with the right-hand mouse button, allows the user
to set or change breakpoints, define new breakpoints, and delete, enable, or disable breakpoints.
355
6.8 Referring to Symbols
The [Label] window can be used to display the information on symbols in modules.
Select [Label] from the [Symbol] submenu of the [View] menu. The [Label] window is displayed so that the user
can refer to the addresses of symbols in modules.
Figure 6.11 [Label] Window
356
6.9 Viewing Memory
When the label name is specified, the user can view the memory contents that the label has been registered in the
[Memory] window. For example, to view the memory contents corresponding to _main in byte size:
• Select [Memory …] from the [CPU] submenu of the [View] menu to enter _main in the [Start address] edit
box and +ff in the [End address] edit box, respectively, and to select Byte in the [Format] combo box.
Figure 6.12 [Format] Dialog Box
• Click the [OK] button. The [Memory] window showing the selected area of memory is displayed.
Figure 6.13 [Memory] Window
357
6.10 Watching Variables
As the user steps through a program, it is possible to watch that the values of variables used in the user program
are changed. For example, set a watch on the long-type array a declared at the beginning of the program, by
using the following procedure:
• Click the left of displayed array a in the [Source] window to position the cursor.
• Select [Instant Watch...] with the right-hand mouse button.
The following dialog box will be displayed.
Figure 6.14 [Instant Watch] Dialog Box
• Click the [Add] button to add a variable to the [Watch] window.
Figure 6.15 [Watch] Window (Displaying the Array)
358
The user can also add a variable to the [Watch] window by specifying its name.
• Click the [Watch] window with the right-hand mouse button and select [Add Watch…] from the popup menu.
The following dialog box will be displayed.
Figure 6.16 [Add Watch] Dialog Box
• Input variable i to [Variable or expression] edit box and click the [OK] button.
The [Watch] window will now also show the int-type variable i.
Figure 6.17 [Watch] Window (Displaying the Variable)
359
The user can click mark ‘+’ at the left side of array a in the [Watch] window to watch all the elements.
Figure 6.18 [Watch] Window (Displaying Array Elements)
360
6.11 Displaying Local Variables
The user can display local variables in a function using the [Locals] window. For example, we will examine the
local variables in the tutorial function, which declares four local variables: a, j, i, and p_sam.
• Select [Locals] from the [Symbol] submenu of the [View] menu. The [Locals] window is displayed.
The [Locals] window shows the local variables in the function currently pointed to by the program counter,
along with their values. Note, however, that the [Locals] window is initially empty because local variables are
yet to be declared.
Figure 6.19 [Locals] Window
• Click mark ‘+’ at the left side of array a in the [Locals] window to display the elements.
• Refer to the elements of array a before and after the execution of the sort function, and confirm that
random data is sorted in descending order.
361
6.12 Stepping Through a Program
The HEW provides a range of step menu commands that allow efficient program debugging.
Table 6.1 Step Option
Menu
Command
Description
Step In
Executes each statement, including statements within functions.
Step Over
Executes a function call in a single step.
Step Out
Steps out of a function, and stops at the statement following the statement in the
program that called the function.
Step…
Steps the specified times repeatedly at a specified rate.
6.12.1 Executing the [Step In] Command
The [Step In] command steps into the called function and stops at the first statement of the called function.
• To step through the sort function, select [Step In] from the [Debug] menu, or click the [Step In] button in
the toolbar.
Figure 6.20 [Step In] Button
362
Figure 6.21 [Source] Window (Step In)
• The highlighted line moves to the first statement of the sort function in the [Source] window.
363
6.12.2 Executing the [Step Out] Command
The [Step Out] command steps out of the called function and stops at the next statement of the calling statement
in the main function.
• To step out of the sort function, select [Step Out] from the [Debug] menu, or click the [Step Out] button in
the toolbar.
Figure 6.22 [Step Out] Button
Figure 6.23 [HEW] Window (Step Out)
The data of variable a displayed in the [Watch] window is sorted in ascending order.
364
6.12.3 Executing the [Step Over] Command
The [Step Over] executes a function call as a single step and stops at the next statement of the main program.
• To step through all statements in the change function at a single step, select [Step Over] from the [Debug]
menu, or click the [Step Over] button in the toolbar.
Figure 6.24 [Step Over] Button
Figure 6.25 [HEW] Window (Step Over)
365
6.13 Forced Breaking of Program Executions
The HEW can force a break in the execution of a program.
• Cancel all the breaks.
• To execute the remaining sections of the tutorial function, select [Go] from the [Debug] menu or the
[Go] button on the toolbar.
Figure 6.26 [Go] Button
• The program goes into an endless loop. To force a break in execution, select [Halt] from the [Debug] menu
or the [Stop] button on the toolbar.
Figure 6.27 [Stop] Button
6.14 Resetting the MCU
Resetting the MCU initializes the internal I/O registers and makes the program counter jump to the address set in
the reset vector.
To reset the MCU, select [Reset CPU] from the [Debug] menu or the [Reset CPU] button on the toolbar.
Figure 6.28 [Reset CPU] Button
To execute the program from the reset vector, select [Reset Go] from the [Debug] menu or the [Reset Go] button
on the toolbar.
Figure 6.29 [Reset Go] Button
Note: This tutorial program is executable from the reset vector.
366
6.15 Break Function
The emulator’s break functions are of two types: PC breaks and breaks at event points. PC breakpoints and
event points are set in the HEW’s [Event] window.
An overview and setting of the break function are described below.
6.15.1 PC Break Function
The emulator can set up to 256 PC breakpoints.
• Select [Eventpoints] from the [Code] submenu of the [View] menu. The [Event] window is displayed.
• Select the [Breakpoint] sheet.
Figure 6.30 [Event] Window (Before Setting a PC Breakpoint)
• Click the [Event] window with the right-hand mouse button and select [Add…] from the popup menu.
• The [Breakpoint/Event Properties] dialog box is displayed.
367
Figure 6.31 [Breakpoint/Event Properties] Dialog Box
• Check the [PC Break] radio button in the [Type] group box.
• Use the [Source] window to refer to the address on the line that has ‘p_sam->s0=a[0];’ within the
tutorial function and enter this address in the [Address Lo] edit box of the [Address] group box. In this
example, enter H’00001082.
Note: This dialog box differs according to the product. For the items of each product, refer to section 8,
Software Specifications Specific to This Product, or the online help.
• Click the [OK] button.
The PC breakpoint that has been set is displayed in the [Event] window.
Figure 6.32 [Event] Window (PC Breakpoint Setting)
Note: The items that can be displayed in this window differ depending on the product. For the items that can
be displayed, refer to section 8, Software Specifications Specific to This Product, or the online help.
368
• Close the [Event] window.
• To stop the tutorial program at the breakpoint, select [Reset Go] from the [Debug] menu.
The program runs until it stops at the breakpoint that has been set.
Figure 6.33 [Source] Window at Execution Stop (PC Break)
The [Status] window displays the following contents:
Figure 6.34 Displayed Contents of the [Status] Window (PC Break)
Note: The items that can be displayed in this window differ depending on the product. For the items that can
be displayed, refer to section 8, Software Specifications Specific to This Product, or the online help.
369
6.15.2 Breaking Execution at Event Points
Setting up of an event point on event channel 1 (Ch1) such that a break is triggered when the event point’s
conditions have been satisfied five times is explained as an example of the use of event points.
• Select [Eventpoints] from the [Code] submenu of the [View] menu. The [Event] window is displayed.
• The breakpoint that has been previously set must be deleted. Click the [Breakpoints] window with the righthand mouse button and select [Delete All] from the popup menu to delete all the breakpoints that have been
set.
• Click the [Event] tab.
Up to 12 event points (eight event channels and four range channels) can be set up as independent conditions. In
this example, we are setting the condition for event channel 1.
Figure 6.35 [Event] Window (Event Channel 1 [Ch1])
• Select the line for Ch1 in the [Event] window. Double-click on this line that is highlighted.
• The [Breakpoint/Event Properties] dialog box is displayed.
• Make the following settings in the boxes on the [General] page:
Select the [Event] radio button in the [Type] group box.
Select the [Address] radio button in the [Address] group box. Then use the [Source] window to refer to the
address on the line that has ‘a[i]=j;’ within the tutorial function and enter this address in the [Address
Lo] edit box. In this example, enter H'0000105c.
• Enter D’5 as the number of times the event condition is to be satisfied in the [Required number of event
occurrences] edit box on the [Action] page.
370
Figure 6.36 [General] Page ([Breakpoint/Event Properties] Dialog Box)
• Click the [OK] button. The [Event] window is displayed, as shown below.
Figure 6.37 [Event] Window (Setting Completed)
Note: The items that can be displayed in this window differ depending on the product. For the items that can be
displayed, refer to section 8, Software Specifications Specific to This Product, or the online help.
Select [Reset Go] from the [Debug] menu to stop the tutorial program at breakpoints.
The program runs then stops at the condition specified under Ch1.
371
Figure 6.38 [Source] Window at Execution Stop
The [Status] window displays the following contents.
Figure 6.39 Displayed Contents of the [Status] Window
Refer to the [Watch] window for the value of variable i. The value is 4, indicating that the break occurred after
the condition had been satisfied five times.
Note: The items that can be displayed in this window differ depending on the product. For the items that can be
displayed, refer to section 8, Software Specifications Specific to This Product, or the online help.
Remove the event point. Clicking the right-hand mouse button on the [Event] window displays a popup menu.
Select [Remove All] from this menu to remove all event points.
372
6.16 Trace Functions
The trace functions of the emulator use the realtime trace buffer, which is able to store the information on up to
32,768 bus cycles. The content of this buffer, which is constantly updated during execution, is displayed in the
[Trace] window.
Select [Trace] from the [Code] submenu of the [View] menu to display the [Trace] window.
Figure 6.40 [Trace] Window
When trace information is displayed in the [Trace] window, clicking the right-hand mouse button on the [Trace]
window displays a popup menu. Select [Clear] from this menu to clear the trace information.
The following sections give an overview of the trace functions and methods for setting them.
373
6.16.1 Displaying a Trace (when Time Stamping is not Available)
The method used to specify an address as an event condition for the tracing of read/write cycles and display the
trace is described below.
(1) Clicking the right-hand mouse button on the [Trace] window displays a popup menu. Select [Acquisition…]
from this menu to display the [Trace Acquisition] dialog box.
Figure 6.41 [Trace Acquisition] Dialog Box
374
(2) Register an address as an event condition for trace acquisition. Click the [Add…] button in the [Trace
Events] group box on the [General] page to display the [Breakpoint/Event Properties] dialog box.
Figure 6.42 [Breakpoint/Event Properties] Dialog Box
(3) Use the [Source] window to refer to the address on the line that has ‘a[i]=j;’ within the tutorial function
and enter this address in the [Address Lo] edit box of the [Address] group box on the [General] page of the
[Breakpoint/Event Properties] dialog box. In this example, enter H'0000105c. This address has thus been
set. Click the [OK] button to close the [Breakpoint/Event Properties] dialog box.
Figure 6.43 [Breakpoint/Event Properties] Dialog Box (after Setting an Event)
375
(4) The event that has been set is now displayed in the [Event] combo box of the [Trace Events] group box on
the [General] page of the [Trace Acquisition] dialog box.
Figure 6.44 [Trace Acquisition] Dialog Box (Adding an Event)
376
(5) To enable the event condition that has been set, uncheck the [Free Trace] check box on the [General] page.
This will add pages [1] to [4] to the [Trace Acquisition] dialog box.
Figure 6.45 [Trace Acquisition] Dialog Box (Pages Added)
377
(6) Select page [1] and click the [Range] radio button in the [Conditions] group box. This will display the [Range
Event] combo box and the [Edit…] button.
Figure 6.46 [Trace Acquisition] Dialog Box (Displaying Page [1])
378
(7) Select the event you have registered from the [Range Event] combo box. The event is now enabled. Click the
[OK] button to complete the trace setting.
Figure 6.47 [Trace Acquisition] Dialog Box (Setting Completed)
(8) Make the setting such that the break occurs after the instruction at the address on the line that has ‘a[i]=j;’
within the tutorial function (H’0000105C in this example) has been executed five times (for details on
this, refer to section 6.15.2, Breaking Execution at Event Points).
(9) Select [Reset Go] from the [Debug] menu. Processing stops when the break condition is satisfied, and the
[Trace] window then displays the following content.
Figure 6.48 [Trace] Window (Displaying the Result)
If you have trouble viewing a column, drag the header (vertical) bars below the title bar to adjust the width
of the column.
(10) Remove the event points that have been set and clear the trace information. Click the right-hand mouse
button on the [Event] window to display a popup menu. Select [Delete All] from this menu to remove all of
the event points that have been set. Click the right-hand mouse button on the [Trace] window to display a
further popup menu. Select [Clear] from this menu to clear the trace information.
379
6.16.2 Displaying a Trace (when Time Stamping is Available)
The following procedure is for obtaining and displaying, with time stamps, trace information on cycles of
writing to memory locations in the specified address range.
(1) Clicking the right-hand mouse button on the [Trace] window displays a popup menu. Select [Acquisition…]
from this menu to display the [Trace Acquisition] dialog box (see figure 6.41, [Trace Acquisition] dialog
box).
(2) Register the address range for trace acquisition as an event condition. Click the [Add…] button in the [Trace
Events] group box on the [General] page to display the [Breakpoint/Event Properties] dialog box (see figure
6.42, [Breakpoint/Event Properties] dialog box).
(3) Click the [Range] radio button in the [Address] group box on the [General] page of the [Breakpoint/Event
Properties] dialog box. Use the [Locals] window to refer to the address on the line where variable a, which is
defined within the tutorial function, is allocated (H’00FFEF80 in this example) and enter this address
in the [Address Lo] edit box. Then enter an address, which is H’27 added to that entered in the [Address Lo]
edit box (H’00FFEFA7 in this example), in the [Address Hi] edit box. This procedure sets the memory
range for variable a of the tutorial function.
(4) Click the [Write] radio button in the [Direction] group box to set a write cycle for the specified range. This
completes the setting of a memory range. Click the [OK] button to close the [Breakpoint/Event Properties]
dialog box.
Figure 6.49 [Breakpoint/Event Properties] Dialog Box (after Setting an Event)
380
(5) The event that has been set in the [Event] combo box of the [Trace Events] group box on the [General] page
of the [Trace Acquisition] dialog box is displayed.
Figure 6.50 [Trace Acquisition] Dialog Box (Adding an Event)
(6) To enable time stamping, select 125ns from the [Clock] combo box of the [Time Stamp] group box.
Figure 6.51 [Trace Acquisition] Dialog Box (Time Stamping is Available)
381
(7) To enable the event condition that has been set, uncheck the [Free Trace] check box on the [General] page.
This will add pages [1] to [4] (see figure 6.45, [Trace Acquisition] dialog box).
(8) Select page [1] and click the [Range] radio button in the [Conditions] group box. This will display the [Range
Event] combo box and the [Edit…] button (see figure 6.46, [Trace Acquisition] dialog box).
(9) Click the [Range Event] combo box to select the event you have registered. The event is now enabled. Click
the [OK] button to complete the trace setting.
Figure 6.52 [Trace Acquisition] Dialog Box (Setting Completed)
(10) Make the setting such that the break occurs after the instruction at the address on the line that has ‘p_sam>s0=a[0];’ within the tutorial function (H’00001082 in this example) (for details on this, refer to
section 6.15.1, PC Break Function).
(11) Select [Reset Go] from the [Debug] menu. Processing stops when the break condition is satisfied, and the
[Trace] window then displays the following content.
Figure 6.53 [Trace] Window (Displaying the Result)
If you have trouble viewing a column, drag the header (vertical) bars below the title bar to adjust the width
of the column.
382
(12) Remove the event points that have been set and clear the trace information. Clicking the right-hand mouse
button on the [Breakpoints] window displays a popup menu. Select [Delete All] from this menu to remove
all the event points that have been set. Clicking the right-hand mouse button on the [Trace] window
displays a further popup menu. Select [Clear] from this menu to clear the trace information. To disable time
stamping, select Disabled in the [Clock] combo box of the [Time Stamp] group box on the [General] page
of the [Trace Acquisition] dialog box.
6.16.3
Statistics
The number of times the internal RAM has been written to can be included in the acquired trace information.
(1) Make the setting such that a break occurs at the address on the line that has ‘p_sam->s0=a[0];’ within the
tutorial function (H’00001082 in this example) (for details on this, refer to section 6.15.1, PC Break
Function).
(2) Select [Reset Go] from the [Debug] menu. Processing stops when the break condition is satisfied, and the
[Trace] window then displays trace information.
(3) Select [Statistic…] from the popup menu that is displayed when you click the right-hand mouse button on
the [Trace] window. A message box appears, indicating that the trace data is being loaded, and the
[Statistic] dialog box will be displayed.
Figure 6.54 [Statistic] Dialog Box
383
(4) Select R/W in the [Item] combo box and enter WR in the [Start] edit box. After that, click the [New] button.
“R/W=WR” is now displayed in the [Condition] column of the [Result] list box.
Figure 6.55 [Statistic] Dialog Box (New Condition)
384
(5) Then, select Area from the [Item] combo box and enter RAM in the [Start] edit box. After that, click the
[Add] button; the new condition is now added to the “R/W=WR” display in the [Condition] column of the
[Result] list box, so that it now shows “R/W=WR & Area=RAM”. This completes setting of the condition.
Figure 6.56 [Statistic] Dialog Box (Condition Added)
385
(6) To start statistical analysis of the specified condition, press the [Result] button. The number of write
operations that satisfy the condition and the PTR values will be displayed.
Figure 6.57 [Statistic] Dialog Box (Result of Analysis)
(7) Click the [Close] button to close the [Statistic] dialog box.
(8) Remove the event points that have been set and clear the trace information. Clicking the right-hand mouse
button on the [Event] window displays a popup menu. Select [Delete All] from this menu to remove all the
event points that have been set. Clicking the right-hand mouse button on the [Trace] window displays a
further popup menu. Select [Clear] from this menu to clear the trace information.
386
6.16.4
Function Calls
This mechanism is used to only collect trace information on the function calls.
(1) Make the setting such that a break occurs at the address on the line that has ‘p_sam->s0=a[0];’ within the
tutorial function (H’00001082 in this example) (for details on this, refer to section 6.15.1, PC Break
Function).
(2) Select [Reset Go] from the [Debug] menu. Processing stops when the break condition is satisfied, and the
[Trace] window then displays trace information.
(3) Select [Function Call…] from the popup menu displayed by clicking the right-hand mouse button on the
[Trace] window. The [Function Call Display] dialog box will be displayed.
Figure 6.58 [Function Call Display] Dialog Box
(4) Click the [Enable] radio button and then the [OK] button. Only the information on function calls is now
displayed in the [Trace] window (the [Label] column’s right-side boundary has been moved to the left in the
[Trace] window to show the function calls).
Figure 6.59 [Trace] Window (Function Calls)
(5) To return the display in the [Trace] window to its previous state, follow the procedure in (3) to display the
[Function Call Display] dialog box. Click the [Disable] button and then the [OK] button.
(6) Remove the event points that have been set and clear the trace information. Clicking the right-hand mouse
button on the [Breakpoints] window displays a popup menu. Select [Delete All] from this menu to remove
all the event points that have been set. Clicking the right-hand mouse button on the [Trace] window displays
a further popup menu. Select [Clear] from this menu to clear the trace information.
387
6.17 Stack Trace Function
The emulator uses the information on the stack to display the function call history.
Notes: 1. This function can be used only when the load module that has the Dwarf2-type debugging
information is loaded. Such load module is supported in H8S, H8/300 C/C++ compiler V4.0 or later.
2. For details on the stack trace function, refer to the online help.
• Double-click the [Editor] column in the sort function and set a PC breakpoint.
Figure 6.60 [Source] Window (PC Breakpoint Setting)
• Select [Reset Go] from the [Debug] menu.
• After the break in program execution, select [Stack Trace] from the [Code] submenu of the [View] menu to
open the [Stack Trace] window.
Figure 6.61 [Stack Trace] Window
Figure 6.61 shows that the position of the program counter is currently at the selected line of the sort()
function, and that the sort() function is called from the tutorial() function.
To remove the PC breakpoint, double-click the [Editor] column in the sort function again.
388
6.18 Performance Measurement Function
Performance measurement by the emulator is in the following modes:
•
•
•
•
•
Time Of Specified Range Measurement
Start Point To End Point Measurement
Start Range To End Range Measurement
Access Count Of Specified Range Measurement
Called Count Of Specified Range Measurement
In this tutorial, we describe the Time Of Specified Range Measurement.
6.18.1
Time Of Specified Range Measurement
(1) Select [Performance Analysis] from the [Performance] submenu of the [View] menu to display the [Select
Performance Analysis Type] dialog box.
Figure 6.62 [Select Performance Analysis Type] Dialog Box
(2) Select “E6000 Performance Analysis” from the [Performance Analysis] combo box in the [Select
Performance Analysis Type] dialog box and click the [OK] button. The [Performance Analysis] window will
be displayed.
Figure 6.63 [Performance Analysis] Window
389
(3) Select the line of the [Performance Analysis] window that has 1 in its [No] column and click the right-hand
mouse button to display a popup menu. Select [Set…] from this popup menu to display the [Performance
Analysis Properties] dialog box.
Figure 6.64 [Performance Analysis Properties] Dialog Box
(4) Select Time Of Specified Range Measurement from the [Measurement Method PA1] combo box.
(5) The parameter settings are as follows.
•
Enter “sort” in the [Range Name] edit box.
•
Click the […] button to the right of the [Start Address] edit box to display the [Input Function Range]
dialog box. Enter the function name “Sample::sort (long *)” in the [Function] edit box of this dialog box
and then click the [OK] button. The corresponding addresses for the function “Sample::sort (long *)”
will now be set in the [Start Address] and [End Address] edit boxes.
Figure 6.65 [Input Function Range] Dialog Box
Note: The addresses figured out in the [Input Function Range] dialog box are just for reference. In some cases,
the end address of a function may be different. Check the last instruction of the function in the
[Disassembly] window to correct the value set in [End Address] so that it will be the address of the last
instruction (in general, the last instruction of a function is a RTS instruction). A label name or an
expression can be entered instead of an address value in boxes where an address should be entered.
390
(6) Click the [Settings…] button in the [Common Settings of Performance(PA1-8)] group box to display the
[Common Settings of Performance(PA1-8)] dialog box. Select [PC] from the [Address Control Mode] combo
box and then click the [OK] button. PC is now displayed in the [Address Control Mode] text field of the
[Common Setting of Performance(PA1-8)] dialog box.
Figure 6.66 [Common Setting of Performance(PA1-8)] Dialog Box
(7) Click the [OK] button to display the content that has been set for line 1 of the [No] column in the
[Performance Analysis] window. This completes the settings for a Time Of Specified Range Measurement.
Figure 6.67 [Performance Analysis] Dialog Box (Setting Completed)
(8) Set an event point at the address on the line that has ‘p_sam->change(a);’ within the tutorial function
(H’0000107 in this example) so that a break occurs when the specified sort function has been executed
three times (refer to section 6.15.2, Breaking Execution at Event Points).
(9) Select [Reset Go] from the [Debug] menu. Processing stops when the break condition is satisfied, and the
[Performance Analysis] window then displays the information shown below. The value shown in the [Count]
column is 3, which indicates that the sort function has been executed three times and the execution time.
Figure 6.68 [Performance Analysis] Dialog Box (Displaying the Result)
(10) Delete the setting for performance analysis and remove the event point. Click the right-hand mouse button
on the [Performance Analysis] window to display a popup menu. Select [Reset All] from this popup menu to
delete all of the settings. Clicking the right-hand mouse button on the [Event] window also displays a popup
menu. Select [Delete All] from this popup menu to remove all the event points that have been set.
391
6.19 Monitor Function
The emulator allows monitoring of the content of specified addresses in memory during execution of the user
program. In this example, we monitor the content of the address range where variable a of the tutorial
function is stored.
(1) Select the [CPU] submenu from the [View] menu. Then selecting [Monitor Setting…] from the [Monitor]
submenu displays the [Monitor Setting] dialog box.
Figure 6.69 [Monitor Setting] Dialog Box
392
(2) Set the items in the [Monitor Setting] dialog box as follows:
•
Enter monitor1 in the [Name] edit box.
•
Set the parameters in the [Options] group box as follows:
(a) Use the [Locals] window to refer to the address on the line where variable a, which is defined within
the tutorial function, is allocated and enter this address in the [Address] edit box. In this example,
enter H’00FFEF80.
(b) Enter H’50 in the [Size] edit box.
(c) Select BYTE (HEX) from the [Access] combo box.
(d) Check the [Auto-refresh at rate] check box and enter D’00500.
(e) Check the [Reading the Initial Value] check box.
•
Set the parameters in the [Color] group box as follows:
(a) Select Change from the [Change Indicator] combo box.
(b) Select red and white in the [Foreground] and [Background] combo boxes, respectively.
(c) Check the [Mayfly] check box.
Note: Depending on the operating system in use, the foreground and background colors may not be selectable.
Figure 6.70 [Monitor Setting] Dialog Box (Setting Completed)
393
(3) Click the [OK] button to open the [Monitor] window.
Figure 6.71 [Monitor] Window
(4) Select [Reset Go] from the [Debug] menu. When the content of the address range changes with execution,
the updated values are red (i.e. the color that was selected in the [Foreground] and [Background] combo
boxes). Values will be displayed in black if they have not been updated or a certain period of time has
elapsed since the last update.
Figure 6.72 [Monitor] Window (during Execution)
(5) After you have finished checking the states in the [Monitor] window, select [Halt Program] from the [Debug]
menu to halt the program’s execution.
6.20 What Next?
This tutorial has described the major features of the emulator and the use of the HEW.
Sophisticated debugging can be carried out by using the emulation functions that the emulator offers. This
provides for effective investigation of hardware and software problems by accurately isolating and identifying
the conditions under which such problems arise.
394
Section 7 Hardware Specifications Specific to This Product
This section describes the hardware specifications on the H8S/2612 E6000 emulator.
7.1
H8S/2612 E6000 Emulator Specifications
The H8S/2612 E6000 emulator supports the system development using the following microcomputers:
• H8S/2612 group
7.1.1
Supported MCUs and User System Interface Cables
See the development support tool catalog for the MCU type names and packages supported by the E6000
emulator and for the combination of the E6000 user system interface cables and optional boards.
7.1.2
Operating Voltage and Frequency Specifications
Table 7.1 shows examples of the MCU operating voltage and frequency specifications supported by the E6000
emulator. If the emulator is used in an environment that exceeds the operating voltage range and operating
frequency range guaranteed for the MCU operation, normal emulator operation is not guaranteed.
Table 7.1
Operating Voltage and Frequency Specifications
MCU Types
Operating Voltage (V)
Operating Frequency
(φ) (MHz)
H8S/2612 group
4.5-5.5
4-20
NOTE
For details on the operating voltage and frequency specifications,
refer to the MCU’s hardware manual.
395
7.2 User System Interface
All user system interface signals are directly connected to the MCU in the emulator with no buffering except for
those listed below which are connected to the MCU through control circuits:
•
•
•
•
•
•
•
NMI
RESET
MD2, MD1, MD0
XTAL
EXTAL
STBY
WAIT
7.2.1
Signal Protection
All user system interface signals are protected from over- or under-voltage by use of diode arrays except for the
AVcc and Vref.
The Vcc pins (except for the AVcc pin) at the head of the user system interface cable are connected together.
The emulator monitors the voltage level of the Vcc pins and displays the power-supply status in the [Extended
Monitor] window.
7.2.2
User System Interface Circuits
The interface circuit between the MCU in the emulator and the user system has a signal delay of about 8 ns due
to the user system interface cable. And high-impedance signals will be pulled up to the high level by pull-up
resistors. When connecting the emulator to a user system, adjust the user system hardware to compensate for
propagation delays.
Default:
Vcc
47 k
47
MCU
User system
interface cable
Figure 7.1 Default User System Interface Circuit
396
Mode Pins (MD2, MD1 and MD0), NMI, WAIT, and STBY: The NMI signal is input to the MCU through
the emulator control circuit. The rising/falling time of the NMI signal must be 8 ns/V or less. The mode pins are
only monitored. The CPU mode depends on the configuration settings of the HEW.
Vcc
Emulator
control
circuit
47 k
47
User system
interface cable
Figure 7.2 User System Interface Circuit for MD2, MD1, MD0, NMI, WAIT, and STBY
RESET:
Vcc
Emulator
control
circuit
47 k
47
User system
interface cable
Figure 7.3 User System Interface Circuit for RESET
PB0:
Figure 7.4 User System Interface Circuit for PB0
PB1-PB7:
Figure 7.5 User System Interface Circuit for PB1-PB7
397
AN0-AN11, AVcc, AVss and Vref:
Figure 7.6 User System Interface Circuit for AN0-AN11, AVcc, AVss and Vref Signals
7.3
Differences between MCU and Emulator
When the emulator is turned on or initialized, or the system is reset, there are some differences in the initial
values in some of the general registers between the MCU and the emulator as shown in table 7.2.
Table 7.2
Initial Value Differences between MCU and Emulator
Status
Register
E6000 Emulator
MCU
Power-on/
initialized
PC
Reset vector value
Reset vector value
ER0 to ER6
Undefined
Undefined
ER7 (SP)
H'10
Undefined
CCR
The I mask is set to 1 and the
other bits are undefined
The I mask is set to 1 and the
other bits are undefined
Reset command
7.3.1
PC
Reset vector value
Reset vector value
ER0 to ER6
Undefined
Undefined
ER7 (SP)
H'10
Undefined
CCR
The I mask is set to 1 and the
other bits are undefined
The I mask is set to 1 and the
other bits are undefined
A/D Converter and D/A Converter
Due to the use of a user system interface cable, there is a slight degradation in the A/D and D/A conversion than
that quoted in the Hardware Manual for the MCU being emulated.
398
Section 8 Software Specifications Specific to This Product
This section describes the software specifications of the H8S/2612 E6000 emulator.
8.1
Software Specifications of the H8S/2612 E6000 Emulator
Information specific to this emulator is given below.
8.1.1
Target Hardware
This emulator software conforms to the H8S/2612 E6000 emulator (HS2612EPI61H).
8.1.2
Selectable Platform
The debugging platform selectable in this emulator is as follows. The MCUs that can be emulated vary
according to the debugging platform selected.
Table 8.1
Selectable Target Platform
Debugging Platform
Remark
H8S/2612 E6000 Emulator CPU 2600
For emulation of the MCUs that have the H8S/2600 CPU as the
core.
399
8.1.3
[Configuration Properties] Dialog Box ([General] Page)
Items that can be set in this dialog box are listed below.
Figure 8.1 [Configuration Properties] Dialog Box ([General] Page)
400
[General] page
[Device]
Selects the MCU to be emulated. To use an MCU not included in the list,
select [Custom] to specify the functions required for this MCU. See the
hardware manual for details.
[Mode]
Selects the MCU's operating mode.
[Clock]
Selects the speed of the MCU’s clock.
[Timer Resolution]
Selects the resolution of the timer for use in execution time measurement.
The value 20 ns, 125 ns, 250 ns, 500 ns, 1 us, 2 us, 4 us, 8 us, or 16 us
can be selected.
The timer for execution time measurement has a 40-bit counter.
At 20 ns the maximum time that can be measured is about six hours, and
at 16 µs the maximum time is about 200 days.
When the counter overflows, the maximum time possible for
measurement will be displayed with prompt “>” that indicates that the
counter has overflowed.
[Enable read and write on the
fly]
When this box is checked, it is possible to access the target system
memory while the user program is running. Do not check this box if you
require realtime emulation.
- When accessing the internal ROM, internal RAM, or emulation memory
HEW accesses the memory directly as the bus mastership is released to
the emulator without breaking the user program. The MCU waits for
approximately 80 us while operating at 20 MHz.
- When accessing the internal I/O, DTCRAM, or user memory
Memory is accessed with breaking the user program. This pause is
approximately 2 ms while operating at 20 MHz.
When the internal RAM is disabled, an access to this area is not available
during the user program execution.
Note:
When the content of the memory is modified during the user program
execution (e.g. modification in the [Memory] window or by the
MEMORY_EDIT command), HEW reads the content to update the value.
HEW also reads the memory content when the content has been updated
by operations such as selecting [Memory -> Refresh]. In this case, the
content of memory is read and then updated in each of the windows.
To prevent unnecessary reading of the memory content, close the
window displaying the memory content (such as the [Memory] or
[Disassembly] window) or make the settings so that the content will not
be updated.
The [Monitor] window, or the [Watch] window that satisfies the conditions
listed below displays the memory content. Note that, however, opening
these windows does not prevent realtime operation because the method
of updating the memory content in these windows is different.
Conditions:
1. Registered symbols are only allocated to general-purpose registers.
2. Registered symbols are only allocated to the monitor range set by the
[Monitor] function (the mark R is colored in blue).
3. Registered symbols are comprised of those with the conditions 1 and 2
listed above.
[Break on access error]
When this box is checked, a break (the user program stops) occurs if
your program accesses an access-prohibited area or writes to a writeprotected area.
401
[General] page (cont)
[Enable internal ROM area write]
When this box is checked, writing to the internal ROM area is enabled.
For the result of writing, see the [Extended Monitor] window.
[User VCC Threshold]
Sets the voltage level for the user system. [Down] will be displayed in
[User System Voltage] of the [Extended Monitor] window when the actual
user VCC (PVCC when the H8S/2612 E6000 Emulator CPU debugging
platform is selected) of the target system is lower than the specified
value.
[User Signals]
When this box is checked, the reset and NMI signals from the user
system are enabled. Note that the standby signal is always invalid
because the hardware standby function is not supported. However, the
status of the signal can be checked in the [Extended Monitor] window.
[Driver]
Displays the E6000 driver that is currently installed.
[Change driver in start up]
When this box is checked, selection of a driver will be available next time
the emulator is connected.
The MCUs selectable by the [Device] option and options that depend on the MCUs are listed below. To emulate
an MCU with a description in the Expansion Hardware column, connect the correct expansion hardware.
Table 8.2
Environment for the H8S/2612 E6000 Emulator CPU 2600 Debugging Platform
[Device] Option
[Mode] Option
Custom
The MCU previously selected
H8S/2616
H8S/2614
H8S/2612
H8S/2611
7 (advanced mode, single chip)
Target
Notes: 1.
2.
402
[Clock] Option
Expansion Hardware
Main: 10 MHz
Main: 20 MHz
Main: Target
Main: Target/2
None
Target in [Mode] is only available when the target system is connected.
Target and Target/2 in [Clock] are only available when the target system is connected.
8.1.4
[Configuration Properties] Dialog Box ([Custom] Page)
Items that can be set in this dialog box are listed below.
Figure 8.2 [Configuration Properties] Dialog Box ([Custom Device] Page)
403
[Custom Device] page
[ROM]
Specify the internal ROM area size.
None: 64kB: Sets the internal ROM area to be 64 kbytes (H’000000 to
H’00FFFF).
96kB: Sets the internal ROM area to be 96 kbytes (H’000000 to
H’017FFF).
128kB: Sets the internal ROM area to be 128 kbytes (H’000000 to
H’01FFFF).
192kB: Sets the internal ROM area to be 192 kbytes (H’000000 to
H’02FFFF).
256kB: Sets the internal ROM area to be 256 kbytes (H’000000 to
H’03FFFF).
384kB: Sets the internal ROM area to be 384 kbytes (H’000000 to
H’05FFFF).
512kB: Sets the internal ROM area to be 512 kbytes (H’000000 to
H’07FFFF).
[RAM]
Specify the internal RAM area size.
2kB: Sets the internal RAM area to be 2 kbytes (H’FFE800 to H’FFEFBF
and H’FFFFC0 to H’FFFFFF).
4kB: Sets the internal RAM area to be 4 kbytes (H’FFE000 to H’FFEFBF
and H’FFFFC0 to H’FFFFFF).
6kB: Sets the internal RAM area to be 6 kbytes (H’FFD800 to H’FFEFBF
and H’FFFFC0 to H’FFFFFF).
8kB: Sets the internal RAM area to be 8 kbytes (H’FFD000 to H’FFEFBF
and H’FFFFC0 to H’FFFFFF).
12kB: Sets the internal RAM area to be 12 kbytes (H’FFC000 to
H’FFEFBF and H’FFFFC0 to H’FFFFFF).
16kB: Sets the internal RAM area to be 16 kbytes (H’FFB000 to
H’FFEFBF and H’FFFFC0 to H’FFFFFF).
24kB: Sets the internal RAM area to be 24 kbytes (H’FF9000 to
H’FFEFBF and H’FFFFC0 to H’FFFFFF).
32kB: Sets the internal RAM area to be 32 kbytes (H’FF7000 to
H’FFEFBF and H’FFFFC0 to H’FFFFFF).
[Pin]
Specify the product package.
80/84Pin: Enables ports 1, 4, 7, PA0 to PA3, B to D, and PF3 to PF7.
100PinA: Enables ports 1, 4, P70 to P73, PA0 to PA3, and B to G.
120/128PinA: Enables ports 1 to 4, 7, PA0 to PA3, and B to G.
144PinA: Enables ports 1 to 8 and A to G.
100PinB: Enables ports 1, 4, 9, and A to F.
120/128PinB: Enables ports 1, 3, 4, 7, 9, PA0 to PA3, and B to G.
144PinB: Enables ports 1 to 5 and 7 to G.
404
[Custom Device] page (cont)
[Modules]
Check this box to validate on-chip peripherals.
Enable DTC: Uses a part of the internal RAM as DTCRAM.
Enable D/A Converter: Displays registers of the D/A converter in the [IO]
window. The D/A converter is always available.
Enable Refresh Controller: Enables the refresh controller.
Enable DMAC: Enables DMAC.
Enable TPU3-5: Enables TPU3 to TPU5. TPU0 to TPU2 are always
available.
Enable PWM14: Enables the 14-bit PWM.
Enable MultiProcessor Communication (SCI1-4):
Uses all SCI channels to support the multiprocessor
communication and the smart card interface. SCI2 is
always used for this support.
Enable IrDA: Enables IrDA.
Enable IIC0: Enables IIC0.
Enable IIC1: Enables IIC1.
Enable WDT1: Enables WDT1.
Enable TMR2-3: Enables TMR2 and TMR3. TMR0 and TMR1 are always
available.
A/D Converter: Selects the specifications of the A/D converter.
4reg: 10-bit resolution, four data registers, and conversion time in 134state cycles
8reg: 10-bit resolution, eight data registers, and conversion time in 20state cycles
SCI Select: Selects the number of SCI channels.
SCI0-1: Enables SCI0 and SCI1.
SCI0-2: Enables SCI0 to SCI2.
SCI0-3: Enables SCI0 to SCI3.
SCI0-4: Enables SCI0 to SCI4.
405
8.1.5
Memory Mapping Function
This emulator supports four blocks of user memory. These can be 256 kbyte or 1 Mbyte each, depending on the
SIMM fitted. Each block can be placed in the address space on a 256-kbyte or 1-Mbyte boundary.
The memory mapping has a granularity of H'40 (D'64) bytes. Each 64-byte block can be set to the emulation
memory or external memory and can be access-prohibited, write-protected or read-write.
Note: The minimum unit available for mapping is a block (64 bytes).
8.1.6
[Status] Window
Selecting [View -> CPU -> Status] or clicking the [Status Display] toolbar button displays the [Status] window.
The [Status] window has three sheets. This emulator displays the following items.
(1) [Memory] Sheet
Selecting the [Memory] tab on the [Status] window displays this sheet.
Table 8.3
[Memory] Sheet Items
[Item] Column
[Status] Column
Target Device Configuration
Displays memory mapping.
System Memory Resources
Displays the memory resource of the emulator hardware.
Program Name
Displays the program file name.
406
(2) [Platform] Sheet
Selecting the [Platform] tab on the [Status] window displays this sheet.
Table 8.4
[Platform] Sheet Items
[Item] Column
[Status] Column
Connected To:
Displays emulator name (driver used).
CPU
Displays the target MCU name.
Mode
Displays the selected mode.
Clock source
Displays the selected clock.
Run status
Displays the execution status.
Break: The user program breaks
Running: The user program is running
Cause of last break
Displays the cause of the emulator stopped at a break.
Ready: User program not executed (immediately after starting the HEW)
User Break: Break by the user
PC Break: Break by program breakpoint
On Chip Break A: Break by hardware PC Break
Complex Event System: Break by complex event system
Stepping Completed: Break by stepping completed
Stepping Aborted: Break by stepping aborted
ROM Write Access Break: Break by writing to ROM
Write-protect Access Break: Break by writing to a read-only memory
Unused Area Access Break: Break by accessing to a guarded memory
Performance Break: Break by Performance Analysis
Invalid breakpoint: Break by a break instruction without PC Break
Event Time Count
Displays the measured result of the timer between events.
Run Time Count
Displays the total execution time of the program.
(3) [Events] Sheet
Selecting the [Events] tab on the [Status] window displays this sheet.
Table 8.5
[Events] Sheet Item
[Item] Column
[Status] Column
Resources
Displays the resource information and the information on events such as
the breakpoint.
407
8.1.7
Extended Monitor Function
Selecting [View -> CPU -> Extended Monitor] or clicking the [Extended Monitor] toolbar button displays the
[Extended Monitor] window. This emulator displays the following items.
Table 8.6
[Extended Monitor] Window Items
[Item] Column
[Value] Column
User Standby
Displays the status of the standby pin.
User NMI
Displays the status of the NMI pin.
User Reset
Displays the status of the reset pin.
User System Voltage
Displays whether or not the user VCC (PVCC when the H8S/2612 E6000
Emulator CPU 2600 debugging platform is selected) is equal to or exceeds the
value set in [User VCC Threshold] on the [General] page of the [Configuration
Properties] dialog box.
User Cable
Displays whether or not the user cable is connected.
Running status
Displays the address bus value in the MCU and the status of the CPU while
the user program is running, and the cause of a break while the user program
is halted.
Break = <Cause of break>: Displays the cause of a break.
Address = <Address bus value>:
Displays the address bus value during the user program execution.
Status = <Status of the CPU>: Displays the status of the CPU.
PREFETCH: CPU instruction prefetch cycles
DATA: CPU data access cycles
DMAC: Operation of DMAC
DTC: Operation of DTC
SLEEP: Sleep mode
STANDBY: Standby mode
REFRESH: Refresh cycles
ROM Write
Displays whether or not the ROM has been written to during the user program
execution.
Once the ROM has been written to, the state is retained until the Configure
Platform is set again.
Target Mode
Displays the mode to be input from the user system.
Target Clock
Displays whether or not there is a clock signal to be input from the user
system.
Note: In this emulator, the update interval in the [Extended Monitor] window cannot be selected or changed.
408
8.1.8
Signals to Indicate Bus States and Areas
The following tables show examples of signals to indicate the bus states and areas that can be acquired by the
emulator.
Table 8.7
Bus State Signals Acquired by the Emulator
Bus State
Trace Display (Status)
Description
CPU Prefetch
PROG
CPU prefetch cycles
CPU Data
DATA
CPU data access cycles
Refresh
REFRESH
Refresh cycles
DMAC
DMAC
DMAC cycles
DTC
DTC
DTC cycles
Other
OTHER
Others
Table 8.8
Area Signals Acquired by the Emulator
Area
Trace Display (Area)
Description
On-chip ROM
ROM
ROM
On-chip RAM
RAM
RAM
On-chip I/O 16bit
I/O-16
16-bit I/O
On-chip I/O 8bit
I/O-8
8-bit I/O
External 16bit
EXT-16
16-bit EXT (external)
External 8bit
EXT-8
8-bit EXT (external)
DTC RAM
RAM/DTC
DTCRAM
Note: The signals to indicate bus states and areas are used to set the [Bus/Area] condition of the event point.
They can also be acquired as the trace information. The bus state signals are also used to set the
condition not to acquire the trace ([Suppress] option) and in the Access Count Of Specified Range
Measurement mode for measuring the hardware performance ([Access Type] option).
8.1.9
Monitoring Function
This emulator incorporates the bus monitoring circuit as the standard, which thus allows a use of the monitoring
function to update the content of memory without affecting the realtime operation.
8.1.10
Trigger Points
This emulator incorporates the bus monitoring circuit as the standard, which thus allows a use of trigger points
that can be set on the [Trigger] sheet in the [Event] window.
409
8.1.11
Trace Information
Selecting [View -> Code -> Trace] or clicking the [Trace] toolbar button displays the [Trace] window. Trace
information that can be acquired by the emulator and trace information items to be displayed are as listed below.
[PTR]
Cycle number in the trace buffer. When the most recent record is record 0,
earlier record numbers go backwards (-1, -2, ...). If a delay count has been
set, the cycle number where the trace stop condition has been satisfied is
record 0. For the cycle (during delay) executed until the trace has stopped,
earlier record numbers go forward (+1, +2, ...) the most recent record.
[Address]
Address (6-digit hexadecimal)
[Instruction]
Disassembled code of the executed instruction
[Data]
Data bus value, displayed as 2-digit or 4-digit hexadecimal
[R/W]
Whether access was read (RD) or write (WR)
[Area]
Memory area being accessed; ROM, RAM, 8- or 16-bit I/O, 8- or 16-bit EXT
(external), or DTC RAM (not available when a time stamp is acquired)
[Status]
Bus status during this cycle; DTC operation, PROG (prefetch), Data (CPU
data access cycle), Refresh (refresh cycle), or DMAC (DMAC cycle) (not
available when a time stamp is acquired)
[Clock]
Number of clock cycles in bus cycle as 1 to 8. To indicate more clock
cycles, “OVR” is displayed (not available when a time stamp is acquired).
[Probes]
A 4-bit binary number showing the four probe pins in the order of Probe 4,
Probe 3, Probe 2, and Probe 1 from the left (not available when a time
stamp is acquired).
[NMI]
Status of the NMI input (not available when a time stamp is acquired)
[IRQ5-0]
Status of six IRQ inputs (not available when a time stamp is acquired)
[Timestamp]
Time stamp of the record. Time stamps start from zero each time the user
program is executed. The timer resolution depends on the time stamp
clock rate selected in the trace acquisition (only available when a time
stamp is acquired).
[Source]
Source program
[Label]
Label information that corresponds to the address (if defined)
[TimestampDifference]
Difference from the timestamp value shown on the previous line (only
available when a time stamp is acquired)
410
8.1.12
Searching for a Trace Record
While using the emulator, the [Trace Find] dialog box has the following pages:
Table 8.9
[Trace Find] Dialog Box Pages
Page
Description
[General]
Sets the range for searching.
[Address]
Sets an address condition.
[Data]
Sets a data condition.
[R/W]
Selects the type of access cycles.
[Area]
Selects the area being accessed (not available when a time stamp is
acquired).
[Status]
Selects the status of a bus (not available when a time stamp is acquired).
[Probes]
Selects the status of four probe signals (not available when a time stamp
is acquired).
[IRQ5-0]
Selects the status of six IRQ input signals (not available when a time
stamp is acquired).
[Timestamp]
Specify the time stamp value for bus cycles (only available when a time
stamp is acquired).
The [IRQ5-0] page is specific to this emulator. The description is given below.
• [IRQ5-0] page
Select the status of IRQ signals. The selection is not available when a time stamp is acquired.
Figure 8.3 [Trace Find] Dialog Box ([IRQ5-0] Page)
411
[Don't care]:
Detects no IRQ input condition when this box is checked.
[Setting]:
Detects the specified IRQ input condition.
[IRQ5] to [IRQ0]:
8.1.13
Select IRQ input conditions (not available when [Don’t care] has been
checked).
Don't care: Detects no selected IRQ input condition.
High: The status of the IRQ input is high.
Low: The status of the IRQ input is low.
Trace Filtering Function
While using the emulator, the [Trace Filter] dialog box has the following pages:
Table 8.10 [Trace Filter] Dialog Box Pages
Page
Description
[General]
Selects the range for filtering.
[Address]
Sets address conditions.
[Data]
Sets data conditions.
[R/W]
Selects the type of access cycles.
[Area]
Selects the area being accessed (not available when a time stamp is not
acquired).
[Status]
Sets the status of a bus (not available when a time stamp is not
acquired).
[Probes]
Selects the states of four probe signals (not available when a time stamp
is not acquired).
[IRQ5-0]
Selects the states of six IRQ input signals (not available when a time
stamp is not acquired).
[Timestamp]
Specifies the time stamp value for bus cycles (only available when a time
stamp is acquired).
The [IRQ5-0] page is specific to this emulator. The description is given below.
412
• [IRQ5-0] page
Select the status of IRQ signals. The selection is not available when a time stamp is acquired.
Figure 8.4 [Trace Filter] Dialog Box ([IRQ5-0] Page)
[Don't care]:
Detects no IRQ input condition when this box is checked.
[Setting]:
Detects the specified IRQ input condition.
[IRQ5] to [IRQ0]:
Select IRQ input conditions (not available when [Don’t care] has been
checked).
Don't care: Detects no selected IRQ input condition.
High: The status of the IRQ input is high.
Low: The status of the IRQ input is low.
413
8.2
Notes on Usage of the H8S/2612 E6000 Emulator
There are the following notes on usage of the emulator.
8.2.1
Environment for Execution of the Tutorial Program
To execute the tutorial program, specify “Tutorial.hws” stored in the following directory:
HEW installation destination directory\Tools\Renesas\DebugComp\Platform\E6000\2612\Tutorial
8.2.2
I/O Register Differences between the Actual MCU and the Emulator
In the E6000 emulator, one evaluation chip emulates several types of MCU. Therefore, there are some
differences in I/O registers between an actual MCU and the emulator. Note these differences when accessing the
I/O registers.
I/O port is in the input state at default. The I/O register contents indicate the emulator port status. When the user
system interface cable is not connected, the read value is 1 due to pull-up resistors.
In the emulator, accesses to the following registers for controlling the flash memory are invalid.
• RAM emulation register (RAMER: H'FEDB)
• Flash memory control register 1 (FLMCR1: H'FFA8)
• Flash memory control register 2 (FLMCR2: H'FFA9)
• Block register 1 (EBR1: H'FFAA)
• Block register 2 (EBR2: H'FFAB)
When Motor Management Timer (MMT) is used in the emulator, the MMT output cannot be monitored by port
B.
Note: The addresses indicate the lower 16 bits.
8.2.3
Access to the Reserved Area
When accessing the reserved area, note the following:
If the reserved area is used, the operation in the actual MCU cannot be guaranteed. If the user program extends
to the reserved area during debugging, select the MCU having the largest ROM capacity (for example, debug the
H8S/2611 program in the H8S/2612 mode).
8.2.4
Using the Internal RAM Area as External Addresses
When the RAME bit in SYSCR is 0, the internal RAM area can be used external addresses. Note that, however,
the only memory that can be accessed is User (external), not Emulator (emulation memory). In this case, the OnChip Read-write (Internal RAM) setting is applied for memory mapping.
8.2.5
Support of Flash Memory
This emulator does not emulate the flash memory in the MCU.
8.2.6
Hardware Standby
This emulator does not support the hardware standby function. Therefore, checking [User Standby enable] in the
[Configuration Properties] dialog box is invalid.
414
Appendix A Troubleshooting
?
?
?
?
?
?
I have clicked the “Stop Build” button or selected [Build->Stop Build] to abort a build but the build
process has not stopped.
The HEW will stop the build after it has built the current file (or executed the current single phase). If the
builder does not respond after a longer period of time you can select [Build->Terminate Current Tool]
which will attempt to forcibly terminate the current process. Do NOT assume that any output from the tool
you terminated is valid. It is recommended that you delete any output files produced and ensure that the
phase is executed again.
I have a text file in the editor but it does not show any syntax coloring.
Ensure that you have named the file (i.e. saved it) and that the “Enable syntax coloring” check box is set on
the “Editor” tab of the “Tools Options” dialog, which is launched via [Tools->Options...]. HEW checks a
file group to which the file’s extension belongs and decides whether the file is colored. To view the current
defined extensions and their file groups, use the “File Extensions” dialog which is launched via [Project>File Extensions...]. To view coloring information, use the “Format” tab of the “Tools Options” dialog,
which is launched via [Tools->Options...]. (See the “Syntax Coloring” section in chapter 4, “Using the
Editor” for details.)
I want to change the settings of a tool but the [Tools->Administration…] menu option cannot be selected.
[Tools->Administration...] cannot be selected while a workspace is open. To enter the “Tool
Administration” dialog first close the current workspace.
I did not edit any of the project files. But some of files were built again when I selected [Build->Build].
A file is built again if any of the following conditions holds:
1. The options for the current file have been modified since the last build.
2. If any of the output files are missing.
3. Any of the source files have a newer date than the phase’s output files.
4. Any of the dependent files have a newer date than the phase’s output files.
5. In a user-defined custom build phase, the “Don’t check for input file(s) existence before executing”
check box is checked. To see the status of this check box, select [Options->Build Phases…], select the
phase in the “Build Phase Order” list in the “Build Order” tab, and click the “Modify…” button. Then
you will see the “Don’t check for input file(s) existence before executing” check box on the “Command”
tab.
6. A subcommand file is selected in Optimizing Linkage Editor.
I want to exclude a file in a project from build temporarily.
Push the right button of your mouse on the file in the “Projects” tab of the “Workspace” window, and select
[Exclude Build <file>], where <file> is the selected file. Then the file is excluded from build. To include the
file in build again, push the right button of your mouse on the file, and select [Include Build <file>].
I opened a workspace from my PC, and one of my colleagues opened the same workspace simultaneously
from another PC. I changed the settings of the workspace and saved it. He or she saved the workspace
after me. I opened the workspace again and found that the settings of the workspace differed from what I
had set before.
The settings saved last are enforced. Once HEW opens a workspace, it is updated inside the memory. HEW
does not save the settings into a file until a user saves the workspace intentionally.
415
?
I want HEW to automatically specify default options to a file, which is newly added to a project.
You can specify default options to a phase if the phase is a multiple build phase. Select a phase from the
[Options] menu. If the phase is a multiple build phase, a file list is displayed on the left-hand side of the
options dialog (figure A.1). In the file list, open a folder of a file group to which you want to specify your
default options. You will find a “Default Options” icon in the folder. Select the icon, specify options on the
right-hand side of the options dialog, and click “OK”. The options specified here will be given to any new
file of that file group when it is first added to the project.
Figure A.1: Options Dialog File List
?
I selected [Build->Build All], but the dependencies in the “Projects” tab of the “Workspace” window is
not updated while selecting [Build->Build] updates the dependencies.
[Build->Build All] does not update the dependencies in the “Projects” tab of the “Workspace” window. To
update the dependencies, select [Build->Update All Dependencies].
416
Appendix B Regular Expressions
The High-performance Embedded Workshop editor allows you to include special characters in search strings
when performing a find or replace operation. These characters are listed in table B.1 and are detailed in the
following pages.
Table B.1: Regular Expression Characters
Character
Meaning
+
Matches one or more occurrences of the preceding item, except in a bracket expression. For
example, a+ matches a, aa, aaa, and so on.
*
Matches zero or more occurrences of the preceding item, except in a bracket expression. For
example, a* matches the empty string, a, aa, and so on.
?
Matches zero or one occurrence(s) of the preceding item, except in a bracket expression. For
example, a? matches the empty string and a.
{ and }
Specify a cardinality range, formed as follows: {m,n}. This construct matches between m and n
occurrences of the preceding item. For example, a{2,3} matches aa and aaa.
This construct can also be formed using {m,} and {m}. The first matches m or more occurrences of
the preceding item. For example, a{2,} matches aa, aaa, aaaa, and so on. The second matches
exactly m occurrences of the preceding item. For example, a{2} matches aa.
[ and ]
Create a bracket expression. Bracket expressions create a set of items, any of which may be
matched. For example, [abc] matches a, or b, or c.
Within a bracket expression all regular expression special characters are treated as normal, nonspecial characters, except:
- specifies a range of character values, based on their bit pattern. For example, [A-Za-z] matches
all uppercase and lowercase English characters. To indicate - as a character in the bracket
expression, it must be the first or last character in the set; for example, [-a-z] or [A-Z-].
^ is special only when placed in the first character position within the bracket set. Using ^ in the
first position complements the set of items to be matched. For example, [^a-z] matches all
characters except for lowercase English letters.
Finally, in order to include a ] as a character in the bracket set, you must include it as the first
character in the set, as in []abc] or [^]abc].
( and )
Group regular expression items into subexpressions, which are treated as a single unit. For
example, whereas ab* matches a, ab, abb, and so on, (ab)* matches the empty string, ab, abab,
and so on. ( and ) are not treated as special characters inside a bracket expression.
\
Escapes a regular expression character, causing it to be treated as a regular character. For
example, whereas (ab) indicates a subexpression consisting of ab, \(ab\) denotes the sequence
of characters (, a, b, and ).
Note: To specify the \ character in C++ source code, you must specify \\, as the C++ compiler
treats the \ character as special, denoting the beginning of an escape sequence embedded in the
C++ source code. In data files, or text controls in dialog boxes, however, the double backslash is
not necessary.
^
Indicates that a regular expression or subexpression is anchored at the beginning of the input
string. For example, ^ab matches ab and abc, but not cab. Recall that ^ is treated differently in
bracket expressions.
417
Table B.1: Regular Expression Characters (cont)
Character
Meaning
$
Indicates that a regular expression or subexpression is anchored at the end of the input string. For
example, ab$ matches ab and cab, but not abc.
|
Denotes alternation, or the creation of a set of equally valid, alternate expressions or
subexpressions, each of which can be matched. For example, ab|cd matches ab or cd.
.
Matches any code unit, except for those which indicate the logical end of a line.
418
Appendix C Placeholders
This appendix describes how to use the placeholders, a feature provided by several of the HEW components.
C.1
What is a Placeholder?
A placeholder is a special string, inserted into text, which is replaced at some subsequent time for the actual
value. For example, one of the HEW placeholders is $(FULLFILE) which represents a file with a full path.
Suppose that you have an editor in c:\myedit\myeditor.exe, which can take the file to edit as a parameter. When
invoking the editor the following shortcut could be made, e.g.:
c:\myedit\myeditor.exe c:\files\file1.c
if you wanted to open FILE1.C from the directory c:\files. However, what happens if you want the HEW to open
any file through this editor? The problem is that the command above is specific to “c:\files\file1.c”. What we
want to be able to do is to tell the HEW to use the editor specified but to open the file that I have chosen at that
time. To do this, you can replace the specific name of the file for a general placeholder, i.e.:
c:\myedit\myeditor.exe $(FULLFILE)
Now whenever the HEW launches the editor with a file, it knows that it has to replace $(FULLFILE) with the
file you have selected.
C.2
Inserting a Placeholder
Placeholders can only be entered into three specific edit fields within the HEW (figures C.1, C.2 and C.3). There
are four ways a placeholder can be entered:
In the first example, place the insertion cursor at the point you would like to insert the placeholder and then
select the required placeholder from the popup menu to the right of the edit field.
Figure C.1 Placeholder Popup Menu
In the second example, select the required placeholder other than [Custom directory] from the combo box and
specify a sub-directory relative to the directory shown by the placeholder. If you select [Custom directory],
specify an absolute directory path in the [Sub-Directory] field.
Figure C.2 Placeholder Combo Box and Sub-Directory Field
Note: The [Sub-Directory] field may be written as the [File path] field.
In the third example, place the insertion cursor at the point you would like to insert the placeholder, select the
required placeholder from the combo box and then click the [Insert] button.
419
Figure C.3 Placeholder Combo Box
In the fourth example, type the placeholder into the field directly. Ensure that you type the placeholder name in
uppercase and that it is preceded by $( and followed by ), i.e.
This is correct:
$(FILEDIR)
These are incorrect:
$(Filedir)
$( FILEDIR )
$FILEDIR
420
C.3
Available Placeholders
Table C.1 lists the placeholders and their meanings.
Table C.1 Placeholders
Placeholder
Meaning
$(FULLFILE)
Filename (including full path)
$(FILEDIR)
File directory
$(FILENAME)
Filename (excluding path and including extension)
$(FILELEAF)
Filename (excluding path and extension)
$(EXTENSION)
File extension
$(WORKSPDIR)
Workspace directory
$(WORKSPNAME)
Workspace name
$(PROJDIR)
Project directory
$(PROJECTNAME)
Project name
$(CONFIGDIR)
Configuration directory
$(CONFIGNAME)
Configuration name
$(HEWDIR)
HEW installation directory
$(TCINSTALL)
Toolchain install directory (on option dialog)
$(TOOLDIR)
Tool installation directory (Tools Administration)
$(TEMPDIR)
Temp directory
$(WINDIR)
Windows® directory
$(WINSYSDIR)
Windows® system directory
$(EXEDIR)
Command directory
$(USERNAME)
User login (Version control)
$(PASSWORD)
User password (Version control)
$(VCDIR)
“Virtual” version control directory
$(COMMENT)
Comment (Version control)
$(LINE)
Line number of an error/warning
421
For example, the placeholders will be expanded as shown in table C.2.
Table C.2 Placeholder Expansions (Example)
Placeholder
Expanded placeholder (example)
$(FULLFILE)
c:\hew\workspace\project\file.src
$(FILEDIR)
c:\hew\workspace\project
$(FILENAME)
file.src
$(FILELEAF)
file
$(EXTENSION)
src
$(WORKSPDIR)
c:\hew\workspace
$(WORKSPNAME)
workspace
$(PROJDIR)
c:\hew\workspace\project
$(PROJECTNAME)
project
$(CONFIGDIR)
c:\hew\workspace\project\debug
$(CONFIGNAME)
debug
$(HEWDIR)
c:\hew
$(TCINSTALL)
c:\hew\toolchains\hitachi\sh\511
$(TOOLDIR)
c:\hew\toolchains\hitachi\sh\511
$(TEMPDIR)
c:\Temp
$(WINDIR)
c:\Windows
$(WINSYSDIR)
c:\Windows\System
$(EXEDIR)
v:\vc\win32
$(USERNAME)
JHARK
$(PASSWORD)
214436
$(VCDIR)
“c:\project” is mapped to “x:\vc\project”
$(COMMENT)
“Please Enter Comment” dialog is invoked
$(LINE)
12
In table C.2, we are assuming that
•
•
•
•
•
•
a file path is “c:\hew\workspace\project\file.src”.
a workspace named “workspace” is located at “c:\hew\workspace”.
a project named “project” is located at “c:\hew\workspace\project”.
a configuration named “debug” has a configuration directory located at “c:\hew\workspace\project\debug”.
HEW.EXE is installed in “c:\hew”.
a *.HRF file of a toolchain (i.e. compiler, assembler, linker) is located at “c:\hew\toolchain\hitachi\sh\511”.
This is referred to as $(TCINSTALL) on the option setting dialogs of the [Options] menu and as
$(TOOLDIR) on the “Tools Administration” dialog.
• the Windows® operating system is installed in “c:\Windows” and the Windows® system directory is
“c:\Windows\System”.
• a version control executable path is “v:\vc\win32\ss.exe”, a user name and its password to login the version
control system are “JHARK” and “214436” respectively, $(COMMENT) is specified in a command line to
the version control executable, and “c:\project” is mapped to “x:\vc\project” on the “Projects” tab of the
“Version Control Setup” dialog, which is invoked via [Tools->Version Control->Configure…].
• an error of compiler or assembler occurred at line 12.
422
Note: Not all of the placeholders are relevant in every field. For example, the $(LINE) placeholder has no
meaning when specifying a dependent files location. $(USERNAME), $(PASSWORD), $(VCDIR), and
$(COMMENT) placeholders are acceptable only in version control. If you enter a placeholder into an
edit field where it is not acceptable you might be informed.
C.4
Placeholder Tips
Placeholders are there to allow you to create flexible paths to the various files used by the system.
• If there is a placeholder popup menu ( ) next to an edit field into which you are about to enter a path or file,
you should consider how you can use a placeholder to make that path or file definition flexible.
• If you use several configurations, then the $(CONFIGDIR) placeholder is very useful to ensure that files can
be written to and from the current configuration’s directory.
• Wherever possible, use a placeholder. They can always be removed or added later so don’t be afraid to
experiment.
423
424
Appendix D I/O File Format
HEW formats the [IO] window based on information it finds in an I/O Register definition file. When you select a
debugging platform, HEW will look for a “<device>.IO” file corresponding to the selected device and load it if
it exists. This file is a formatted text file that describes the I/O modules and the address and size of their registers.
You can edit this file, with a text editor, to add support for memory mapped registers or peripherals you may
have specific to your application (e.g. registers in an ASIC device mapped into the microcomputer's address
space).
The following describes two formats of the “<device>.IO” file that supports or not the bit field.
D.1
File format (Bit Field Not Supported)
Each module name must be defined in the [Modules] definition section and the numbering of each module must
be sequential. Each module corresponds to a register definition section and within the section each entry defines
an I/O register.
The [BaseAddress] definition is for devices where the location of I/O registers moves in the address space
depending on the CPU mode. In this case, the [BaseAddress] value is the base address of the I/O registers in one
specific mode and the addresses used in the register definitions are the address locations of the registers in the
same mode. When the I/O register file is actually used, the [BaseAddress] value is subtracted from the defined
register address and the resultant offset added to the relevant base address for the selected mode.
The [Register] definition entry is entered in the format <name> = <address> [<size> [<absolute>]].
1. <name> register name to be displayed.
2. <address> address of the register.
3. <size> which may be B, W or L for byte, word, or longword (default is byte).
4. <absolute> which can be set to A if the register is at an absolute address. This is only relevant
if the I/O area address range moves about on the CPU in different modes. In this case, if a
register is defined as absolute the base address offset calculation is not performed and the
specified address is used directly.
Comment lines are allowed and must start with a “;” character.
An example is shown below.
425
Comment
Module
definition
Example:
; H8S/2655 Series I/O Register Definitions File
[Modules]
BaseAddress=0
Module1=Power_Down_Mode_Registers
Module2=DMA_Channel_Common
Module3=DMA_Channel_0
...
Module42=Bus_Controller
Module43=System_Control
Module44=Interrupt_Controller
...
Register
definition
[DMA_Channel_Common]
DMAWER=0xffff00 B A
DMATCR=0xffff01 B A
DMACR0A=0xffff02 B A
DMACR0B=0xffff03 B A
DMACR1A=0xffff04 B A
DMACR1B=0xffff05 B A
DMABCRH=0xffff06 B A
DMABCRL=0Xffff07 B A
...
Register name
Address
Size
Absolute address flag
426
[DMA_Channel_0]
MAR0AH=0xfffee0 W A
MAR0AL=0xfffee2 W A
IOAR0A=0xfffee4 W A
ETCR0A=0xfffee6 W A
MAR0BH=0xfffee8 W A
MAR0BL=0xfffeea W A
IOAR0B=0xfffeec W A
ETCR0B=0xfffeee W A
D.2
File format (Bit Field Supported)
Each module name must be defined in the [Modules] definition section and the numbering of each module must
be sequential. Each module corresponds to a register definition section and within the section each entry defines
an I/O register.
The user must define “FileVersion=2” at the start of the section. It means that this I/O register file is described
with the version that supports the bit field.
The [BaseAddress] definition is for devices where the location of I/O registers moves in the address space
depending on the CPU mode. In this case, the [BaseAddress] value is the base address of the I/O registers in one
specific mode and the addresses used in the register definitions are the address locations of the registers in the
same mode. When the I/O register file is actually used, the [BaseAddress] value is subtracted from the defined
register address and the resultant offset added to the relevant base address for the selected mode.
Each module has a section that defines the registers forming it along with an optional dependency. The
dependency is checked to see if the module is enabled or not. Each register name must be defined in the section
and the numbering of each register must be sequential. The dependency is entered in the section as dep=<reg>
<bit> <value>.
1.
<reg> is the register id of the dependency.
2.
<bit> is the bit position within the register.
3.
<value> is the value that the bit must be for the module to be enabled.
The [Register] definition entry is entered in the format id=<name> <address> [<size>
[<absolute>[<format>[<bitfields>]]]].
1.
<name> register name to be displayed.
2.
<address> address of the register.
3.
<size> which may be B, W or L for byte, word, or longword (default is byte).
4.
<absolute> which can be set to A if the register is at an absolute address. This is only relevant
if the I/O area address range moves about on the CPU in different modes. In this case, if a
register is defined as absolute the base address offset calculation is not performed and the
specified address is used directly.
5.
<format> format for register output. Valid values are H for Hexadecimal, D for decimal, and
B for binary.
6.
<bitfields> section defining the bits within the register.
Bitfield sections define the bits within a register each entry is of the type bit<no>=<name>.
1.
<no> is the bit number.
2.
<name> is a symbolic name of the bit.
Comment lines are allowed and must start with a “;” character.
An example is shown below.
427
Comment
Module
Example:
; H8S/2655 Series I/O Register Definitions File
[Modules]
FileVersion=2
BaseAddress=0
Module1=Power_Down_Mode_Registers
Module2=DMA_Channel_Common
Module3=DMA_Channel_0
...
Module42=Bus_Controller
Module43=System_Control
Module44=Interrupt_Controller
...
Module
definition
[DMA_Channel_Common]
reg0=regDMAWER
reg1=regDMATCR
reg2=regDMACR0A
reg3=regDMACR0B
reg4=regDMACR1A
reg5=regDMACR1B
reg6=regDMABCRH
reg7=regDMABCRL
dep= regMSTPCRH 7 0
Register name
Bit
Value
...
Register
definition
[regDMAWER]
id=DMAWER 0xffff00 B A H dmawer_bitfields
Register name
Address
Size
Absolute address flag
Format
Bit field
...
Bit-field
definition
428
[dmawer_bitfields]
bit3=WE1B
bit2=WE1A
bit1=WE0B
bit0=WE0A
Appendix E Symbol File Format
To decode the symbol file correctly, the file must be formatted as a Pentica-B file:
1. The file must be a plain ASCII text file.
2. The file must start with the word “BEGIN”.
3. Each symbol must be on a separate line with the value first, in hexadecimal terminated by an
“H”, followed by a space then the symbol text.
4. The file must end with the word “END”.
Example:
BEGIN
11FAH
11FCH
11FEH
1200H
END
Symbol_name_1
Symbol_name_2
Symbol_name_3
Symbol_name_4
429
430
Appendix F HMAKE User Guide
F.1
Command line
The following section describes the command line that should be used to execute the hmake program on a file
using none or more of the available options.
F.1.1
Basic structure
The command line must be of the following syntax:
hmake <make file you wish to execute> <parameter list>
If a file is specified without an extension then “.mak” will be appended to it. The parameter list may include
none or more of the parameters listed in the following section. The parameters list may appear before the make
file name if you wish. Each parameter must be separated by at least one white space character. Parameters are
not case sensitive. If no parameters are given and no file is given then help information will be displayed.
F.1.2
Exit codes
If there are any syntax errors in the make file being executed or if any process executed whilst running the make
file returns an invalid error code then hmake will exit with code 1. Otherwise hmake will exit with code 0 (See
below for file syntax and how to specify exit code conditions).
F.1.3
Parameters
The following table shows the available parameters and their function:
Table F.1: hmake’s parameters and functions
Parameter
Function
/A
Execute all commands regardless of input/output file status. Equivalent to a Build All.
/N
Use status of input/output files to calculate what commands need to be executed (as
normal) and then display the commands but do not execute them.
/?
Display help info.
431
F.2
File syntax
There are four basic types of statement used in a hmake file, the variable declaration the description block, the
comment and the message command. These can be combined in any order to produce a hmake file but a variable
must be declared in a variable declaration before it is used in a description block or other variable declaration.
The first “all” statement used in nmake files is not required in a hmake file. Commands are executed in order, as
they appear in the make file.
Note: the “→” character is used to show were a tab character must be used in order to keep the make file
syntactically correct.
F.2.1
Variable declarations
A variable declaration declares a variable which can then be used in any statement throughout the rest of the
hmake file. A declaration has the following syntax:
<variable name> = <value>
Any number of white space characters are allowed between the variable name and the ‘=’ sign and the value and
the ‘=’ sign. The value may be split over several lines using a ‘\’ character. If the value contains ‘\’ characters
within the main text then these are taken literally. Only ‘\’ characters followed by a new line are considered to
indicate a value wrapping over more than one line.
There follows some examples of valid variable declarations:
EXECUTABLE = c:\dir\prog.exe
OUTPUT = c:\dir2\file1.out
INPUT = c:\dir2\file1.c
DEPEND = c:\dir2\file2.h \
c:\dir2\file3.h \
c:\dir2\file4.h
In order to use a variable later in the hmake file write the variable name with “$(” added to the front and “)”
added to the back. The variable name (along with the “$()” characters) will be substituted with the variables
value. For examples of this see later under description blocks. Only alphanumeric characters and underscore
characters are allowed in variable names. It is possible to use a variable inside the declaration of a different
variable but all variables must be declared before they are used.
432
F.3
Description blocks
F.3.1
Basic outline
A description block specifies one or more targets, zero or more dependants and a list of commands which should
be executed if the newest dependent is newer than the newest target. If none of the targets exist and/or none of
the dependants exist then the commands will always be executed. It is not necessary to specify any dependants if
you wish the commands to always be executed. A description block has the following syntax:
<target1> <target2> … : <dependant1> <dependant2> …
→
<command1>
→
<command2>
→
…
→
<commandn>
Any number of white space characters are allowed between the last target and the ‘:’ character and the first
dependant and the ‘:’ character. No white space is allowed before the first target. Each target and each dependant
must be separated by at least one white space character. A tab character must be present at the start of a line
containing a command. Variables may be used in a description block using the syntax specified above under
variable declarations.
There follows some examples of valid description blocks (one of which uses the variable specified above under
variable declarations):
c:\dir1\file1.obj : c:\dir1\file1.c c:\dir1\file1.h
→
gcc c:\dir1\file1.c
$(OUTPUT) : $(INPUT) $(DEPEND)
→
F.3.2
$(EXECUTABLE) $(INPUT)
Special commands
There are two special commands which can be used in a description block. The "cd" command changes the
current directory and the "set" command sets an environment variable which will then be in use for the duration
of the make file execution. Both are used in the same way as the DOS equivalents.
There follows some examples of valid description blocks which use these commands:
CHANGEDIR :
→
cd c:\dir1\dir2
SETENV:
→
set VAR1=value1
→
set VAR2=value2
→
set VAR3=value3
It does not matter that CHANGEDIR and SETENV are not file names. They will be treated as files that do not
exist and so the commands will always be executed.
433
F.3.3
Sub command files
If you wish hmake to generate a sub command file for you then the command part of the description block
should be specified as follows (this replaces <commandn> above):
→
<command start> <<
→
<sub command1>,
→
<sub command2>,
→
…
→
<sub commandn>
<<<command end>
This will generate a sub command file, in the windows temporary directory, which will contain the lines <sub
command1>, <sub command2> etc. This command file will be deleted once the make process has completed.
The name of the command file will be substituted for all the text between the two “<<”’s. You do not have to
worry about the name of the sub command file. This is generated by hmake.
For example:
c:\dir1\file1.obj : c:\dir1\file1.c c:\dir1\file1.h
→
gcc @”<<
→
-c -o c:\dir1\file1.obj c:\dir1\file1.c
<<”
If the sub command file generated has the name “c:\temp\hmk111.cmd” then the following would be executed
by hmake (assuming c:\dir1\file1.obj is out of date):
gcc @”c:\temp\hmk111.cmd”
The command file (c:\temp\hmk111.cmd) would contain:
-c -o c:\dir1\file1.obj c:\dir1\file1.c
It is possible to include more than one command in the description block and to use combinations of the standard,
and sub command file commands.
434
F.4
Comments
A ‘#’ character signifies a comment. When this character appears as the first character on a line the rest of the
line (up until the next new line character) is ignored. There follows examples of valid comments:
# My hmake file
# Variable declaration
OUTPUT= c:\dir1\file1.obj
# Descriptor
$(OUTPUT) : c:\dir1\file1.c c:\dir1\file1.h
→
set VAR1=value1
→
gcc c:\dir1\file1.c
A comment must occupy its own line in the hmake file. It is not possible to put comments on the end of other
statements.
F.5
Message commands
The message command is used to output a line of text to standard out whilst a make file is executing. These text
lines will be output in the order they appear in the make file, in amongst output from any executables being
executed as appropriate. No buffering of output text will take place. A message command has the following
syntax:
!MESSAGE <text to output>
A new line character is assumed to come after the last character in <text to output>. Any white space
between !MESSAGE and <text to output> will be ignored. There follows an example of a valid message
command:
!MESSAGE Executing C Compiler
435
436
Appendix G Menus
Table G.1 shows GUI menus.
Table G.1 GUI Menus
Toolbar
Button
Menu
Option
Shortcut
View
Disassembly
Ctrl + D
Opens the [Disassembly]
window.
Command Line
Ctrl + L
Opens the [Command Line]
window.
TCL toolkit
Shift +
Ctrl + L
Opens the [Console] window.
Workspace
Alt + K
Opens the [Workspace]
window.
Output
Alt + U
Opens the [Output] window.
Difference
CPU
Opens the [Difference]
window.
Registers
Ctrl + R
Opens the [Registers] window.
Memory…
Ctrl + M
Opens the [Memory] window.
IO
Ctrl + I
Opens the [IO] window.
Status
Ctrl + U
Opens the [Status] window.
Extended Monitor
Monitor
Monitor
Setting…
Opens the [Extended Monitor]
window.
Shift +
Ctrl + E
Windows
Select…
Symbol
Code
Remarks
Opens the [Monitor] window.
Opens the [Windows Select]
dialog box to list, add, or edit
the [Monitor] window.
Labels
Shift +
Ctrl + A
Opens the [Labels] window.
Watch
Ctrl + W
Opens the [Watch] window.
Locals
Shift +
Ctrl + W
Opens the [Locals] window.
Eventpoints
Ctrl + E
Opens the [Eventpoints]
window.
Trace
Ctrl + T
Opens the [Trace] window.
Stack Trace
Ctrl + K
Opens the [Stack Trace]
window.
437
Table G.1 GUI Menus (cont)
Menu
Option
View
(cont)
Graphic
Performance
Options
Toolbar
Button
Remarks
Image…
Shift +
Ctrl + G
Opens the [Image] window.
Waveform…
Shift +
Ctrl + V
Opens the [Waveform]
window.
Performance
Analysis
Shift +
Ctrl + P
Opens the [Performance
Analysis] window.
Debug Sessions…
Opens the [Debug Sessions]
dialog box to list, add, or
remove the debug session.
Debug Settings…
Opens the [Debug Settings]
dialog box to set the
debugging conditions or
download modules.
Radix
Hexadecimal
Uses a hexadecimal for
displaying a radix in which the
numerical values will be
displayed and entered by
default.
Decimal
Uses a decimal for displaying
a radix in which the numerical
values will be displayed and
entered by default.
Octal
Uses an octal for displaying a
radix in which the numerical
values will be displayed and
entered by default.
Binary
Uses a binary for displaying a
radix in which the numerical
values will be displayed and
entered by default.
System…
Opens the [Configuration]
dialog box allowing the user to
modify the debugging platform
settings.
Memory
Resource…
Opens the [Memory Mapping]
dialog box allowing the user to
view and edit the debugging
platform's current memory
map.
Emulator
438
Shortcut
Table G.1 GUI Menus (cont)
Menu
Option
Shortcut
Debug
Reset CPU
Toolbar
Button
Remarks
Resets the target hardware and
sets the PC to the reset vector
address.
Go
F5
Starts executing the user
program at the current PC.
Reset Go
Shift + F5
Resets the target hardware and
executes the user program from
the reset vector address.
Go To Cursor
Starts executing the user
program at the current PC until
the PC reaches the address
indicated by the current text
cursor position.
Set PC To Cursor
Sets the PC to the address at
the row of the text cursor.
Run…
Launches the [Run Program]
dialog box allowing the user to
enter the PC or PC breakpoint
during executing the user
program.
Display PC
Shift +
Ctrl + Y
Opens the Editor or
Disassembly window at the
address of the PC.
Step In
F11
Executes a block of user
program before breaking.
Step Over
F10
Executes a block of user
program before breaking. If a
subroutine call is reached, then
the subroutine will not be
entered.
Step Out
Shift +
F11
Executes the user program to
reach the end of the current
function.
Step…
Step
Mode
Launches the [Step Program]
dialog box allowing the user to
modify the settings for stepping.
Auto
Steps only one source line when
the [Source] window is active.
When the [Disassembly] window
is active, stepping is executed in
a unit of assembly instructions.
Assembly
Executes stepping in a unit of
assembly instructions.
Source
Steps only one source line.
439
Table G.1 GUI Menus (cont)
Menu
Option
Shortcut
Debug
(cont)
Halt Program
Esc
Memory
440
Toolbar
Button
Remarks
Stops the execution of the user
program.
Connect
Connects the debugging
platform.
Initialize
Disconnects the debugging
platform and connects it again.
Disconnect
Disconnects the debugging
platform.
Download Modules
Downloads the object program.
Unload Modules
Unloads the object program.
Search…
Searches for the specified value
from the specified memory area.
Copy…
Copies the specified memory
area to the specified address.
Compare…
Compares the specified two
memory areas.
Fill…
Fills the specified value in the
specified memory area.
Test…
Tests the specified memory
area.
Refresh
Forces a manual update of the
contents of all the [Memory]
windows open.
Configure Overlay…
Selects the target section group
when the overlay function is
used.
Appendix H Command Lines
Table H.1 lists the HEW commands.
Table H.1
HEW Commands
No. Command Name
Abbreviation Function
1
!
-
Comment
2
ADD_FILE
AF
Adds a file to the current project
3
ANALYSIS
AN
Enables or disables performance analysis
4
ANALYSIS_RANGE
AR
Sets or displays a performance analysis range
5
ANALYSIS_RANGE_
DELETE
AD
Deletes a performance analysis range
6
AUTO_COMPLETE
AC
Enables or disables command complement function
7
ASSEMBLE
AS
Assembles instructions into memory
8
ASSERT
-
Checks if an expression is true or false
9
BREAKPOINT
BP
Sets a breakpoint at an instruction address
10
BREAKPOINT_CLEAR BC
Deletes breakpoints
11
BREAKPOINT_
DISPLAY
Displays a list of breakpoints
BD
12
BREAKPOINT_ENABLE BE
Enables or disables a breakpoint
13
BREAKPOINT_
SEQUENCE
BS
Sets sequential breakpoints
14
BUILD
BU
Starts a build operation on the current project
15
BUILD_ALL
BL
Starts a build all operation on the current project
16
CHANGE_
CONFIGURATION
CC
Sets the current configuration
17
CHANGE_PROJECT
CP
Sets the current project
18
CHANGE_SESSION
CS
Changes the session of the current project
19
CLOCK
CK
Set the CPU clock rate in the emulator
20
CONFIGURE_
PLATFORM
CPF
Sets the debugging environment for the emulator
21
DEFAULT_OBJECT_
FORMAT
DO
Sets the default object (program) format
22
DEVICE_TYPE
DE
Selects a device type to emulate
23
DISASSEMBLE
DA
Disassembles memory contents
24
ERASE
ER
Clears the [Command Line] window
25
EVALUATE
EV
26
EXMONITOR_DISPLAY EXMD
Displays the content of the expansion monitor
27
EXMONITOR_SET
EXMS
Selects whether or not to display the items in the
expansion monitor
28
EXMONITOR_
SETRATE
EXMSR
Sets the time to update the expansion monitor during
emulation or a break
29
FILE_LOAD
FL
Loads an object (program) file
30
FILE_SAVE
FS
Saves memory to a file
31
FILE_UNLOAD
FU
Unloads a file
32
FILE_VERIFY
FV
Verifies file contents against memory
Evaluates an expression
441
Table H.1
HEW Commands (cont)
No. Command Name
Abbreviation Function
33
GENERATE_MAKE_
FILE
GM
Creates a makefile to be built outside the HEW
34
GO
GO
Executes user program
35
GO_RESET
GR
Executes user program from reset vector
36
GO_TILL
GT
Executes user program until temporary breakpoint
37
HALT
HA
Halts the user program
38
HELP
HE
Displays the syntax of a command
39
INITIALIZE
IN
Initializes the debugging platform
40
LOG
LO
Controls command output logging
41
MAP_DISPLAY
MA
Displays memory mapping
42
MAP_SET
MS
Sets memory mapping
43
MEMORY_COMPARE
MC
Compares memory contents
44
MEMORY_DISPLAY
MD
Displays memory contents
45
MEMORY_EDIT
ME
Modifies memory contents
46
MEMORY_FILL
MF
Modifies the content of a memory area by specifying
data
47
MEMORY_FIND
MI
Searches for data within the memory range
48
MEMORY_MOVE
MV
Moves a block of memory
49
MEMORY_TEST
MT
Tests a block of memory
50
MODE
MO
Sets or displays the CPU mode
51
MODULES
MU
Sets up or displays the on-chip peripheral functions
52
MONITOR_CLEAR
MOC
Deletes a monitor point
53
MONITOR_DISPLAY
MOD
Displays the content of the monitor
54
MONITOR_REFRESH
MOR
Controls an automatic update of the content of the
monitor
55
MONITOR_SET
MOS
Sets or displays a monitor point
56
OPEN_WORKSPACE
OW
Opens a workspace
57
QUIT
QU
Exits HEW
58
RADIX
RA
Sets default input radix
59
REFRESH
RF
Updates windows related to memory
60
REGISTER_DISPLAY
RD
Displays CPU register values
61
REGISTER_SET
RS
Sets CPU register contents
62
RESET
RE
Resets CPU
63
REMOVE_FILE
REM
Deletes the specified file from the current project
64
SLEEP
-
Delays command execution
65
SAVE_SESSION
SE
Saves the session of the current project
66
STEP
ST
Steps program (by instructions or source lines)
67
STEP_MODE
SM
Sets the step mode
68
STEP_OUT
SP
Steps out of the current function
69
STEP_OVER
SO
Steps program, not stepping into functions
70
STEP_RATE
SR
Sets or displays rate of stepping
442
Table H.1
HEW Commands (cont)
No. Command Name
Abbreviation Function
71
SUBMIT
SU
72
SYMBOL_ADD
SA
Executes a command file
Defines a symbol
73
SYMBOL_CLEAR
SC
Deletes a symbol
74
SYMBOL_LOAD
SL
Loads a symbol information file
75
SYMBOL_SAVE
SS
Saves a symbol information file
76
SYMBOL_VIEW
SV
Displays symbols
77
TCL
-
Enables or disables the TCL
78
TIMER
TI
Sets or displays the timer resolution
79
TOOL_INFORMATION TO
The information on the tool registered is outputted by
the file
80
TRACE
Displays trace information
81
TRACE_ACQUISITION TA
Sets or displays trace acquisition parameters
82
TRACE_BINARY_
COMPARE
Compares a trace binary file with the current trace
information
83
TRACE_BINARY_SAVE TBV
84
TRACE_FILTER
TF
Filter the trace information
85
TRACE_STATISTIC
TST
Analyzes statistic information
86
TRIGGER_CLEAR
TGC
Deletes the trigger output condition for EXT.2
87
TRIGGER_DISPLAY
TGD
Displays the trigger output condition for EXT.2
88
TRIGGER_SET
TGS
Sets the trigger output condition for EXT.2
89
UPDATE_ALL_
DEPENDENCIES
UD
Updates the dependencies for the current project
90
USER_SIGNALS
US
Enables or disables the user signal information
TR
TBC
Outputs trace information into a binary file
For the syntax of each command, refer to the online help.
443
444
Appendix I Diagnostic Test Procedure
This section describes the diagnostic test procedure using the E6000 test program.
I.1
System Set-Up for Test Program Execution
To execute the test program, use the following hardware; do not connect the user system interface cable and user
system.
• E6000 emulator (HS2612EPI61H)
• Host computer
• The E6000 PC interface board (Select one interface board or card from the following depending on the PC
interface specifications.):
PCI bus interface board (HS6000EIC01H or HS6000EIC02H)
PCMCIA interface card (HS6000EIP01H)
1. Install the E6000 PC interface board in the host computer and connect the supplied PC interface cable to the
board.
2. Connect the PC interface cable to the emulator.
3. Connect the supplied AC adapter to the emulator.
4. Initiate the host computer to make it enter DOS prompt command input wait state.
5. Turn on the emulator power switch.
445
I.2
Diagnostic Test Procedure Using Test Program
Insert the CD-R (HS2612EPI61SR supplied with the emulator) into the CD-ROM drive of the host computer,
move the current directory to <Drive>:\Diag with a command prompt, and enter one of the following commands
according to the PC interface board used to initiate the test program:
1. PCI bus interface board (HS6000EIC01H or HS6000EIC02H)
> TM2612 –PCI (RET)
2. PCMCIA interface card (HS6000EIP01H)
> TM2612 –PCCD (RET)
The HEW must be installed before the test program is executed.
Be sure to initiate the test program from <Drive>:\Diag. Do not initiate it from a directory other than
<Drive>:\Diag, such as > <Drive>:\Diag\TM2612 –PCI (RET). If the test program is initiated when the current
directory is not <Drive>:\Diag, the test program will not operate correctly.
When –S is added to the command line such as >TM2612 –PCI –S (RET), steps 1 to 18 will be repeatedly
executed. To stop the execution, enter Q.
Notes: 1. <Drive> is a drive name for the CD-ROM drive.
2. Do not remove the CD-R from the CD-ROM drive during test program execution.
446
The following messages are displayed during test. This test consists of steps 1 to 18.
Message
Description
E6000 H8S/2612 Emulator Tests Vx.x
Test program start
message. x.x shows the
version number.
Option memory board fitted? (1.None 2.1MB 3.4MB):1
Enter 1 and press the
Enter key because the
SIMM memory module is not
installed in this
example.
Loading driver .................................OK (Use PCI)
Shows that driver
software has been
correctly loaded.
Initializing driver ............................OK
Shows that driver
software has been
correctly initialized.
Searching for interface card ...................OK
Shows that the PC
interface board is
correctly installed in
the host computer.
Checking emulator is connected .................OK
Shows that the E6000 is
correctly connected to
the host computer.
Emulator board information:
Main board ID:
H'5
Emulation board ID:
H'0d
Shows the ID number of
the lower board of the
E6000 (always 5) and the
middle board of the E6000
(always d).
SUB board ID:
H'6
Option memory board:
None
Shows the ID number of
the upper board of the
E6000 (always 6) and
whether the SIMM memory
board is installed.
01) Testing Register :
A)
B)
C)
D)
E)
F)
G)
IDR0 Register ...............................OK
PAGE Register ...............................OK
TRACE G/A Register ..........................OK
PERFM G/A Register ..........................OK
CES GA register .............................OK
IDR1 Register ...............................OK
IDR2 Register ...............................OK
02) Testing DPRAM :
A) Decode Test .................................OK
B) Marching Test ...............................OK
Shows the check results
for the registers in the
E6000 (normal
completion).
Shows the results of
decoding test and
marching test for the
dual-port RAM in the
E6000 (normal
completion).
447
03) Testing Firmware RAM :
A) Decode Test
page[H'700 - H'71f] .............OK
Shows the results of
decoding test for the
firmware RAM in the E6000
(normal completion).
B) Marching test page[H'700 - H'71f] ............OK
Shows the results of
marching test for the
firmware RAM in the E6000
(normal completion).
04) Testing Trace memory :
Shows the results of
decoding test for the
trace RAM (first half) in
the E6000 (normal
completion).
A) Decode Test
B) Marching test
C) Decode Test
D) Marching test
page[H'000-H'04f](Lower 32K) ....OK
page[H'000-H'04f](Lower 32K) ..OK
page[H'000-H'04f](Upper 32K) ....OK
Shows the results of
decoding test for the
trace RAM (last half) in
the E6000 (normal
completion).
page[H'000-H'04f](Upper 32K) ..OK
Shows the results of
marching test for the
trace RAM (last half) in
the E6000 (normal
completion).
05) Testing Map control memory :
A) Decode Test
page[H'200 - H'27f] ...........OK
B) Marching test
page[H'200 - H'27f] ...........OK
06) Testing Internal ROM and RAM :
A)
B)
C)
D)
Decode Test
Marching test
Decode Test
Marching Test
(Internal
(Internal
(Internal
(Internal
ROM)
ROM)
RAM)
RAM)
.................OK
.................OK
.................OK
.................OK
07) Testing Option RAM :
No option memory board fitted - test skipped
08) Testing Emulation RAM STEP Operation :
A) Step Operation ...............................OK
448
Shows the results of
marching test for the
trace RAM (first half) in
the E6000 (normal
completion).
Shows the results of
decoding test for the
mapping RAM in the E6000
(normal completion).
Shows the results of
marching test for the
mapping RAM in the E6000
(normal completion).
Shows the results of
decoding test and
marching test for
internal ROM and RAM in
the E6000 (normal
completion).
Shows the check results
for the optional SIMM
memory module in the
E6000 (not installed).
Shows the check results
for the step execution
controlling circuits in
the E6000 (normal
completion).
09) Testing Keybreak :
A) Key Break ...................................OK
10) Testing Emulation RAM Hardware Break :
A) GRD Break ...................................OK
B) WPT Break ...................................OK
C) WPT(ROM) Break ..............................OK
11) Testing Internal ROM Write-Protect :
A) Write-Protect ...............................OK
12) Testing Hardware Break :
A)
B)
C)
D)
E)
F)
Break Point Initialized .....................OK
Event Detectors CES channel 1-12 ............OK
Test Sequencing 1 ...........................OK
Check Range Break ...........................OK
Range Break Test for Data ...................OK
Check Compare Either ........................OK
13) Testing Emulation RAM Trace :
A)
B)
C)
D)
E)
F)
G)
Free Trace ..................................OK
Range Trace .................................OK
Point to Point Trace ........................OK
Start and Stop Event Trace ..................OK
Trace memory Overflow .......................OK
Time STAMP Trace (20MHz) ....................OK
Time STAMP Trace (10MHz) ....................OK
14) Testing Runtime Counter :
A) Runtime Counter (20MHz) .....................OK
B) Runtime Counter (10MHz) .....................OK
15) Testing Emulation Monitor :
A)
B)
C)
D)
E)
F)
EMA23-EMA0 ..................................OK
ACST2-ACST0 .................................OK
ASEST3-ASEST0 ...............................OK
ASEBRKACK (MONIT0E)..........................OK
CNN .........................................OK
NOCLK .......................................OK
16) Testing PERFM G/A :
A)
B)
C)
D)
E)
Time Measurement
Time Measurement
Subroutine Count
Timeout Function
Timeout Function
(Unit 20ns) ................OK
(Unit Target) ..............OK
Measurement ................OK
(TIMOT Bit) ................OK
(TIMOP Bit) ................OK
17) Testing Bus Monitor :
A)
B)
C)
D)
Register ....................................OK
Parallel RAM ................................OK
SPRSEL2 .....................................OK
RAM Monitor .................................OK
Shows the check results
for the forced break
controlling circuits in
the E6000 (normal
completion).
Shows the check results
for the illegal access
break controlling
circuits in the E6000
(normal completion).
Shows the check results
for the internal ROM
write-protection
controlling circuits in
the E6000 (normal
completion).
Shows the check results
for the hardware break
control circuits in the
E6000 (normal
completion).
Shows the check results
for the trace controlling
circuits in the E6000
(normal completion).
Shows the check results
for the run-time counter
in the E6000 (normal
completion).
Shows the check results
for the emulation monitor
controlling circuits in
the E6000 (normal
completion).
Shows the check results
for analysis controlling
circuits in the E6000
(normal completion).
Shows the check results
for the bus monitor
controlling circuits in
the E6000 (normal
completion).
449
18) Testing Parallel Access :
A)
B)
C)
D)
E)
F)
G)
H)
I)
J)
K)
L)
Internal ROM Parallel Read Access(WORD) ........OK
Internal ROM Parallel Write Access(WORD) .......OK
Internal ROM Parallel Write Access(High Byte) ..OK
Internal ROM Parallel Write Access(Low Byte) ...OK
Internal RAM Parallel Read Access(WORD) ........OK
Internal RAM Parallel Write Access(WORD) .......OK
Internal RAM Parallel Write Access(High Byte) ..OK
Internal RAM Parallel Write Access(Low Byte) ...OK
Option RAM Parallel Read Access(WORD) ..........SKIP
Option RAM Parallel Write Access(WORD) .........SKIP
Option RAM Parallel Write Access(High Byte) ....SKIP
Option RAM Parallel Write Access(Low Byte) .....SKIP
Shows the check results
for the parallel access
controlling circuits in
the E6000 (normal
completion).
Tests run for xH:xM:xS
Shows the check time.
Tests passed, emulator functioning correctly
Shows that the E6000 is
correctly operating.
450
Renesas Microcomputer Development Environment System
User's Manual
H8S/2612 E6000 Emulator
Publication Date: Rev.2.00, May 24, 2005
Published by:
Sales Strategic Planning Div.
Renesas Technology Corp.
Edited by:
Technical Documentation & Information Department
Renesas Kodaira Semiconductor Co., Ltd.
2005. Renesas Technology Corp., All rights reserved. Printed in Japan.
Sales Strategic Planning Div.
Nippon Bldg., 2-6-2, Ohte-machi, Chiyoda-ku, Tokyo 100-0004, Japan
RENESAS SALES OFFICES
http://www.renesas.com
Refer to "http://www.renesas.com/en/network" for the latest and detailed information.
Renesas Technology America, Inc.
450 Holger Way, San Jose, CA 95134-1368, U.S.A
Tel: <1> (408) 382-7500, Fax: <1> (408) 382-7501
Renesas Technology Europe Limited
Dukes Meadow, Millboard Road, Bourne End, Buckinghamshire, SL8 5FH, U.K.
Tel: <44> (1628) 585-100, Fax: <44> (1628) 585-900
Renesas Technology Hong Kong Ltd.
7th Floor, North Tower, World Finance Centre, Harbour City, 1 Canton Road, Tsimshatsui, Kowloon, Hong Kong
Tel: <852> 2265-6688, Fax: <852> 2730-6071
Renesas Technology Taiwan Co., Ltd.
10th Floor, No.99, Fushing North Road, Taipei, Taiwan
Tel: <886> (2) 2715-2888, Fax: <886> (2) 2713-2999
Renesas Technology (Shanghai) Co., Ltd.
Unit2607 Ruijing Building, No.205 Maoming Road (S), Shanghai 200020, China
Tel: <86> (21) 6472-1001, Fax: <86> (21) 6415-2952
Renesas Technology Singapore Pte. Ltd.
1 Harbour Front Avenue, #06-10, Keppel Bay Tower, Singapore 098632
Tel: <65> 6213-0200, Fax: <65> 6278-8001
Colophon 2.0
H8S/2612 E6000 Emulator
User's Manual