1
Production Application Programming Interface
(PAPI)
Reference Manual
200212-04
REV A
This page intentionally left blank.
WAVECREST Corporation continually engages in research related to
product improvement. New material, production methods, and design
refinements are introduced into existing products without notice as a
routine expression of that philosophy. For this reason, any current
WAVECREST product may differ in some respect from its published
description but will always equal or exceed the original design
specifications unless otherwise stated.
Copyright 2005
WAVECREST Corporation
7626 Golden Triangle Drive
Eden Prairie, Minnesota 55344
(952) 831-0030
(800) 733-7128
www.wavecrest.com
All Rights Reserved
U.S. Patent Nos. 4,908,784 and 6,185,509, 6,194,925, 6,298,315 B1, 6,356,850
6,393,088, 6,449,570 and R.O.C. Invention Patent No. 146548; other United States
and foreign patents pending.
WAVECREST,
Corporation.
SIA-3000, GigaView, Remote GigaView and TailFit are trademarks of WAVECREST
PCI Express is a registered trademark of PCI-SIG in the United States and/or other countries. Visual
Basic is a registered trademark of Microsoft Corporation.
ATTENTION: USE OF THE SOFTWARE IS SUBJECT TO THE WAVECREST SOFTWARE LICENSE TERMS
SET FORTH BELOW. USING THE SOFTWARE INDICATES YOUR ACCEPTANCE OF THESE LICENSE
TERMS. IF YOU DO NOT ACCEPT THESE LICENSE TERMS, YOU MUST RETURN THE SOFTWARE FOR A
FULL REFUND.
WAVECREST SOFTWARE LICENSE TERMS
The following License Terms govern your use of the accompanying Software unless you have a separate written
agreement with Wavecrest.
License Grant. Wavecrest grants you a license to use one copy of the Software. USE means storing, loading, installing,
executing or displaying the Software. You may not modify the Software or disable any licensing or control features of
the Software.
Ownership. The Software is owned and copyrighted by Wavecrest or its third party suppliers. The Software is the
subject of certain patents pending. Your license confers no title or ownership in the Software and is not a sale of any
rights in the Software.
Copies. You may only make copies of the Software for archival purposes or when copying is an essential step in the
authorized Use of the Software. You must reproduce all copyright notices in the original Software on all copies. You
may not copy the Software onto any bulletin board or similar system. You may not make any changes or modifications
to the Software or reverse engineer, decompile, or disassemble the Software.
Transfer. Your license will automatically terminate upon any transfer of the Software. Upon transfer, you must deliver
the Software, including any copies and related documentation, to the transferee. The transferee must accept
these License Terms as a condition to the transfer.
Termination. Wavecrest may terminate your license upon notice for failure to comply with any of these License
Terms. Upon termination, you must immediately destroy the Software, together with all copies, adaptations and
merged portions in any form.
Limited Warranty and Limitation of Liability. Wavecrest SPECIFICALLY DISCLAIMS ALL OTHER
REPRESENTATIONS, CONDITIONS, OR WARRANTIES, EITHER EXPRESS OR IMPLIED, INCLUDING BUT
NOT LIMITED TO ANY IMPLIED WARRANTY OR CONDITION OF MERCHANTABILITY OR FITNESS
FOR A PARTICULAR PURPOSE. ALL OTHER IMPLIED TERMS ARE EXCLUDED. IN NO EVENT WILL
WAVECREST BE LIABLE FOR DIRECT, INDIRECT, SPECIAL, INCIDENTAL, OR CONSEQUENTIAL
DAMAGES ARISING OUT OF THE USE OF OR INABILITY TO USE THE SOFTWARE, WHETHER OR NOT
WAVECREST MAY BE AWARE OF THE POSSIBILITY OF SUCH DAMAGES. IN PARTICULAR,
WAVECREST IS NOT RESPONSIBLE FOR ANY COSTS INCLUDING, BUT NOT LIMITED TO, THOSE
INCURRED AS THE RESULT OF LOST PROFITS OR REVENUE, LOSS OF THE USE OF THE SOFTWARE,
LOSS OF DATA, THE COSTS OF RECOVERING SUCH SOFTWARE OR DATA, OR FOR OTHER SIMILAR
COSTS. IN NO CASE SHALL WAVECREST'S LIABILITY EXCEED THE AMOUNT OF THE LICENSE FEE
PAID BY YOU FOR THE USE OF THE SOFTWARE.
Export Requirements. You may not export or re-export the Software or any copy or adaptation in violation of
any applicable laws or regulations.
U.S. Government Restricted Rights. The Software and documentation have been developed entirely at private
expense and are provided as Commercial Computer Software or restricted computer software.
They are delivered and licensed as commercial computer software as defined in DFARS 252.227-7013 Oct 1988,
DFARS 252.211-7015 May 1991 or DFARS 252.227.7014 Jun 1995, as a commercial item as defined in FAR 2.101 (a),
or as restricted computer software as defined in FAR 52.227-19 Jun 1987 or any equivalent agency regulations or
contract clause, whichever is applicable.
You have only those rights provided for such Software and Documentation by the applicable FAR or DFARS clause or
the Wavecrest standard software agreement for the product.
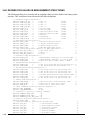
Table of Contents
SECTION 1 - INTRODUCTION
1-1
1-2
1-3
1-4
1-5
1-6
1-7
1-8
Elements of an Application Using the WAVECREST Production API ......... 1
Function Call Structures ................................................................. 2
Files Included in the WAVECREST Production API ................................ 3
WAVECREST Production API Installation ............................................ 4
Building the Sample Application ......................................................... 4
Executing the Sample Application ....................................................... 4
Reviewing the Sample Application........................................................ 5
Where to Go From Here.................................................................... 8
SECTION 2 - TOOL SPECIFIC COMMANDS AND STRUCTURES
2-1
2-2
2-3
2-4
2-5
2-6
2-7
2-8
2-9
2-10
2-11
2-12
Introduction ................................................................................... 9
Measurement Commands................................................................... 10
Plot Data Structure ...................................................................... 12
Acquisition Parameter Structure...................................................... 13
TailFit Result Structure ................................................................. 16
Single Side of TailFit Structure ....................................................... 16
Specification Limit Structure ........................................................... 17
DDJ+DCD data Structure ............................................................... 18
Pattern Structure......................................................................... 19
FFT window and analysis Structure.................................................... 19
QTYS structure ............................................................................. 20
MEAS Structure ........................................................................... 21
2-13
2-14
2-15
2-16
2-17
2-18
2-19
2-20
2-21
2-22
2-23
2-24
2-25
2-26
2-27
2-28
2-29
2-30
2-31
2-32
OHIS structure ............................................................................. 21
MASK Structure ........................................................................... 22
KPWM Structure ........................................................................... 23
Adjacent Cycle Jitter TOOL ............................................................. 30
Clock Analysis Tool ....................................................................... 35
Clock Statistics Tool ..................................................................... 38
Databus Tool ................................................................................ 40
Datacom Bit Clock and Marker Tool .................................................. 43
Datacom Known Pattern with Marker Tool .......................................... 46
Datacom Random Data with Bit Clock Tool .......................................... 57
Datacom Random Data with No Marker Tool......................................... 64
Fibre Channel Compliance Tool ........................................................ 68
Folded Eye Tool ............................................................................ 70
High Frequency Modulation Analysis Tool .......................................... 73
Histogram Tool ............................................................................. 77
InfiniBand Tool .............................................................................. 81
Locktime Analysis Tool ................................................................... 83
Low Frequency Modulation Analysis Tool ........................................... 87
Oscilloscope Tool......................................................................... 90
PCI express 1.1 with Hardware Clock Recovery Tool........................... 92
©WAVECREST Corporation 2005
v
Table of Contents
(cont’d)
2-33
2-34
2-35
2-36
2-37
2-38
2-39
2-40
2-41
2-42
2-43
2-44
2-45
2-46
2-47
2-48
PCI express 1.1 with Software Clock Recovery Tool....................... 95
PCI express 1.1 Clock Analysis Tool ............................................ 98
PCI express 1.0a Tool.............................................................. 101
Phase Noise Tool..................................................................... 104
PLL Analysis Tool ................................................................... 106
Rambus DRCG Tool................................................................... 109
Scope Tool ............................................................................ 113
Serial ATA Gen2i & Gen2m Tool.................................................. 117
Serial ATA Gen 1x & Gen2x Tool ................................................ 119
Serial ATA Tool....................................................................... 121
Spread Spectrum Tool ............................................................. 123
Statistics Tool ........................................................................ 127
Stripchart Tool ...................................................................... 130
Retrieving Spikelists ................................................................ 134
Example Of How To Draw Using A Plot Structure .......................... 135
Defines For Values In Measurement Structures ............................ 136
SECTION 3 - GENERAL COMMAND REFERENCE ............................................ 139
3-1
3-2
3-3
3-4
3-5
3-6
3-7
GPIB Communication and I/O Layer Functions.................................. 140
COMM Layer Functions.............................................................. 140
I/O Layer Functions .................................................................. 149
Measurement Utility Functions General Data Acquisition Functions.... 149
Pattern and PM50 Functions ..................................................... 150
Calibration Utility Functions ...................................................... 152
Signal Path Functions (DSM16, Path Mapping and Path Deskew)........ 155
Miscellaneous result and Status Functions.................................. 159
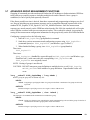
Advanced Group Measurement Functions ...................................... 161
SECTION 4 - CODE SAMPLES
4-1
4-2
4-3
4-4
4-5
Modifying Window Structure Parameters...................................... 167
Performing Tail-fit ................................................................... 167
Drawing from a Plot Structure ................................................. 168
Performing a dataCOM Measurement............................................ 169
Using a PM50 Pattern Marker in a dataCOM Measurement................ 170
SECTION 5 - BUILD CONSIDERATIONS
5-1
5-2
5-3
5-4
5-5
5-6
5-7
5-8
vi
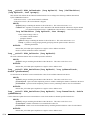
Supported Compilers ............................................................... 173
Build Requirements.................................................................. 173
Developing with C++............................................................... 173
Win32 (95, 98, 2000 and NT 4.0) ............................................. 173
All UNIX Platforms.................................................................. 174
HP-UX 9.05 and HP-UX 10.20 .................................................... 174
Sun 4.1.x (Solaris 1) ............................................................... 174
Sun 2.5.1 or above (Solaris 2) ................................................. 174
©WAVECREST Corporation 2005
Table of Contents
(cont’d)
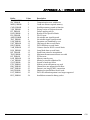
APPENDIX A - Error Codes.............................................................. 175
APPENDIX B - VBASIC Example ........................................................ 177
APPENDIX C - PAPI Revision Changes ............................................. 183
©WAVECREST Corporation 2005
vii
Table of Contents
This page intentionally left blank.
viii
©WAVECREST Corporation 2005
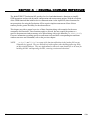
Purpose and Organization of this Manual
WAVECREST SIA-3000 and GigaView™ software have the ability to run automated tests or control the
SIA-3000 remotely through a workstation or PC. This manual covers the Production Application Programming
The
Interface (PAPI) method.
Section 1 introduces the user to the elements of an application utilizing the WAVECREST PAPI software. This
section will aid in getting PAPI set up and ready to compile into applications. There is also a simple example
demonstrating the basic PAPI commands and concepts that can be applied to any measurements with any SIA3000 tool.
Section 2 provides information, in greater detail, pertaining to the basic measurement functions that comprise
PAPI. This section should help the developer gain a basic understanding of the measurement commands in PAPI
and serve as a reference for the variety of data structures used to pass information to and from the SIA-3000.
Section 3 is a function reference for any remaining functions not addressed in Section 2. Functions for setting up
patterns, calibration and making low-level GPIB calls are among the calls listed in this section. Most functions
addressed in Section 3 are for advanced PAPI usage or for making low-level GPIB calls. Some mandatory
functions for getting started and basic PAPI usage are COMM_InitDev() and COMM_CloseDev() in Section 3-1
as well as FCNL_PulsFind() in Section 3-2. Section 3-7 addresses the definition of groups for defining
advanced measurement sequences. It is not necessary to utilize the group functionality for basic PAPI
applications.
The best approach for the beginning PAPI developer is to review Section 1, followed by Sections 2-1 and 2-2.
Once this is complete, go through the following process when referring to the PAPI manual:
•
Choose an SIA-3000 tool and the desired parameters/results
•
Refer to the appropriate sub-section of Section 2 for the selected tool (i.e. Histogram – Section 2-25).
•
Review the input and output parameters for the structure, the functions that apply to that tool and the
simple example. Refer to Sections 2-3 through 2-14 for information on interpreting any sub-structures
within the data structure for the tool.
•
Refer to the application in Section 1-7, replacing any tool specific calls and structures with your own
•
Refer to Section 3 and the Appendices as needed for explanations of other functions
Appendix A lists error codes.
Appendix B shows what the sample program in Chapter 1 might look like if written as a Visual Basic subroutine.
Appendix C lists changes to the measurement window structures and sub-structures for all supported revisions
of PAPI.
©WAVECREST Corporation 2005
vii
This page intentionally left blank.
viii
©WAVECREST Corporation 2005
SECTION 1- INTRODUCTION
WAVECREST has implemented the Production Applications Programming Interface (PAPI) to provide
direct access to the algorithms available in the SIA-3000™. This Production API allows programmers
to quickly integrate the functionality available in the SIA-3000 with their own applications. Many
tedious tasks such as GPIB interfacing and memory management are eliminated. A layered approach is
utilized which provides access to all the statistics and plot data available. This API is cross platform.
Versions for Microsoft® Windows as well as many UNIX platforms are available. The PAPI also
provides routines to utilize configurations established with the SIA-3000 software to streamline the
transition from laboratory characterization to production floor. The PAPI is compatible with SIA-3000
GigaView™ software.
1-1
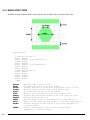
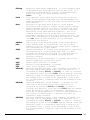
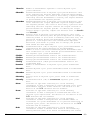
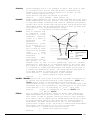
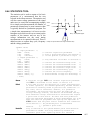
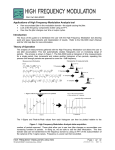
ELEMENTS of an APPLICATION Using the WAVECREST PRODUCTION API
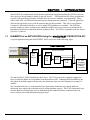
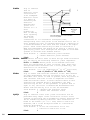
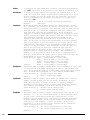
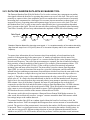
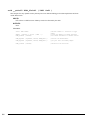
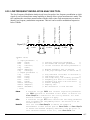
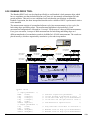
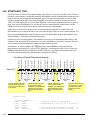
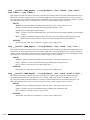
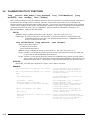
A typical application using the WAVECREST PAPI can be seen in the following figure.
Host Computer
WAVECREST
SIA-3000
HPIB
GPIB
I/O
Driver
SIA-3000 PAPI
HPIB
GPIB
I/O
LIB
COM
LIB
FCNL
LIB
IC Test
Program
using PAPI
Calling
Functions
The WAVECREST PAPI is divided into three layers. The I/O layer provides a hardware abstraction
layer to isolate the higher-level algorithms from the hardware itself. Although GPIB and HPIB are the
only physical medium supported at this time, this abstraction layer provides templates for custom I/O
routines.
The communication layer is an intermediate layer between the functional layer and the hardware
abstraction layer and provides functions such as polling and data requests. The FCNL (functional) layer
provides high-level functionality such as implementing the standard windows contained in the SIA3000 system, pulse-find and interpreting plot arrays.
©WAVECREST Corporation 2005
SECTION 1 – Introduction 1
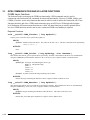
1-2
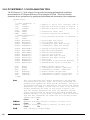
FUNCTION CALL STRUCTURES
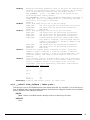
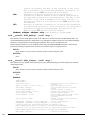
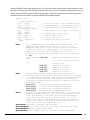
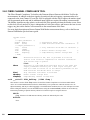
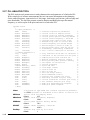
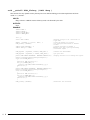
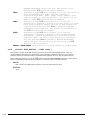
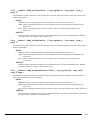
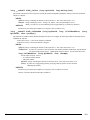
As function calls are listed throughout the manual, they will appear in the following format:
Function Name
long __stdcall FCNL_PtnName ( char sPtnName[], char *name )
This function is used to assist an application load the pattern file into the required measurement
structure. This function is included to assist when programming in Microsoft Visual Basic. When
programming in C, the data array can be accessed directly.
Function Description
Input variables used
INPUTS
sPtnName - Location where pattern name will be updated. Memory needs to be allocated by the caller.
*name - Name of pattern to load into measurement structure.
OUTPUTS
Returns SIA_SUCCESS if operation is successful or a negative value to indicate error.
FCNL_PtnName (sPtnName[], *k28.5_pttn)
Sample code
Output variables used
//this function will change the pattern loaded //to the
pattern pointed to by the pointer //k28.5_pttn. k28.5_pttn
is user definable.
Sample code comments
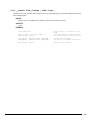
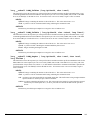
A few helpful notes:
NOTE: __stdcall and DllCall are part of the function definitions in the header file but can
essentially be ignored. They are utilized to provide options when building and using DLLs on
Microsoft® Windows. They are implemented to allow the same header file to be used for
building the DLL and importing the DLL, ensuring consistent declarations.
NOTE: Many of the measurement window structures contain padding fields. These fields are
usually called lPad1, lPad2, … or lPadLoc1, lPadLoc2, … and are used to insure
that variables are placed in the same absolute locations within the structure regardless of
compiler padding which varies from system to system. These fields are only used to take up
space, and can be safely ignored.
2
SECTION 1 – Introduction
©WAVECREST Corporation 2005
1-3
FILES INCLUDED IN THE WAVECREST PRODUCTION API
The WAVECREST PAPI consists of ten header files and associated libraries. The header files are platform
independent while the libraries are platform dependent. Libraries for Microsoft® Windows applications are
provided in the form of run-time Dynamic Link Libraries while Libraries for UNIX applications are provided
in both static and shared forms.
In addition to the header and library files, sample application source code and makefiles are also provided.
There is also a directory containing various dataCOM patterns. Files are located on the CDROM in the
following directory locations:
1-4
WAVECREST
PRODUCTION API INSTALLATION
To install the WAVECREST PAPI, first create a target directory on the host system. Copy the files
from the WAVECREST PAPI CDROM contained in the base directory as well as those from the
particular platform directory to the newly created target directory.
1-5
BUILDING THE SAMPLE APPLICATION
Before attempting to build the sample application, the supported compiler should be installed and
properly configured. This may include modifying the PATH environment variable so that the
compiler’s executable can be launched from a command line. It may also involve setting INCLUDE
and LIB environment variables so that the standard include files and libraries may be located by the
compiler. Consult the compiler documentation for further information.
To build the sample application on UNIX, execute the following from a command prompt:
make
To build the sample application on Microsoft® Windows, execute the following from a command
prompt:
nmake
©WAVECREST Corporation 2005
SECTION 1 – Introduction 3
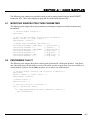
1-6
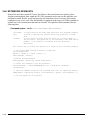
EXECUTING THE SAMPLE APPLICATION
Before attempting to execute the sample application, the supported GPIB interface card must be
installed and properly configured on the host workstation. (Consult the interface card manufacturer’s
documentation for further information.) The WAVECREST SIA-3000 should be powered on,
attached via GPIB cable to the host workstation, with CAL OUT connected to IN1 and CAL OUT
connected to IN2.
NOTE: Support is included for both National Instruments and SICL interface libraries on the Linux
platform. The only required change is that your application must be linked against the PAPI
library libWChpb.so instead of libWCgpb.so when using the SICL libraries. The makefile
included with the Linux sample application includes a detailed explanation of the
compilation changes required in order to utilize the SICL interface.
To execute the sample application, issue the following from a command prompt:
./sample
NOTE: Preceding the application name with “./” ensures that the executable is launched even if the
current directory is not included in the search path on UNIX.
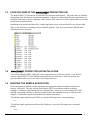
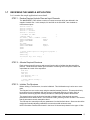
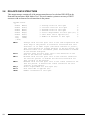
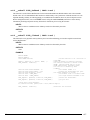
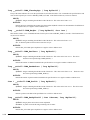
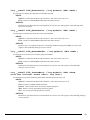
If the sample application is successfully executed, the program should produce an output similar to
the following:
Single Histogram Mean: 50.392295ns
Single Histogram Sdev: 2.185318ps
Strike ENTER to continue
Congratulations! You have just built and ran your first application using the WAVECREST Production API.
4
SECTION 1 – Introduction
©WAVECREST Corporation 2005
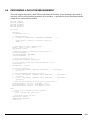
1-7
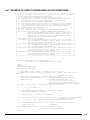
REVIEWING THE SAMPLE APPLICATION
Let’s examine the sample application in more detail.
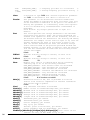
STEP 1 - Declare Required Include Files and Input Channels
The WAVECREST PAPI utilizes a number of custom structures which are declared in the
supplied “include” files. In this example, IN1 and IN2 on the SIA-3000™ are declared as
measurement inputs.
#include
#include
#include
#include
#include
<stdio.h>
<stdlib.h>
<string.h>
"../wccomm.h"
"../wcfcnl.h"
/* Uncomment for SUNOS
/*#define SUNOS 1
#if (WIN32 | SUNOS | SOLARIS2 | LINUX)
#define APIDEVTYPE
GPIB_IO
#define DEVICENAME
"dev5"
#else
#if (HPUX)
#define APIDEVTYPE
HPIB_IO
#define DEVICENAME
"hpib,5"
#endif
#endif
*/
*/
/* Define channel inputs for illustration purposes */
#define IN_1
1
#define IN_2
2
int main(int argc, char *argv[])
{
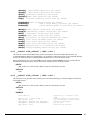
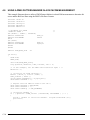
STEP 2 - Allocate Required Structures
Each tool has a specific structure and several function calls to facilitate the data acquisition
process. These structures contain input information concerning how to acquire the data, and
output data as a result of the acquisition.
DCOM
HIST
JITT
long
char
dcom;
hist;
jitt;
ApiDevId, retn = 0;
cmnd[256];
/* Avoid compiler warnings */
argc; argv;
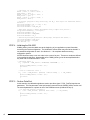
STEP 3 - Initialize The Structures
Before utilizing a Tool Structure, it must be initialized. This initialization may involve two or more
parts.
The first part is to zero out the array using the standard memset() function. This step should only
be performed once immediately after the structure is allocated and prior to it being used, as
information concerning dynamic memory allocation is subsequently added to the structure.
The second part is to call the function intended to initialize each of the particular structure
parameters to their default values. In this case the FCNL_Defxxxx() function is called. This insures
that all parameters contain reasonable values.
The final step is to manually modify any parameters from their default values. Great care should be
used when manually adjusting parameters to ensure that valid values are used.
NOTE: lChanNum contains start channel in the lower 16 bits and stop channel in the upper 16 bits.
©WAVECREST Corporation 2005
SECTION 1 – Introduction 5
/* Initialize our structures */
memset ( &hist, 0, sizeof ( HIST ) );
FCNL_DefHist ( &hist );
memset ( &jitt, 0, sizeof ( JITT ) );
FCNL_DefJitt ( &jitt );
memset ( &dcom, 0, sizeof ( DCOM ) );
FCNL_DefDcom ( &dcom );
/* To measure propagation delay between IN_1 and IN_2, these inputs are identified within a
bitfield */
hist.tParm.lChanNum = IN_1 + (IN_2 << 16);
hist.tParm.lStopCnt = 1;
hist.tParm.lFuncNum = FUNC_TPD_PP;
/* Make Known Pattern w/ Marker measurements using a simple clock pattern */
strcpy(&dcom.sPtnName[0], "clock.ptn");
dcom.tParm.lChanNum = IN_1;
dcom.tParm.lAutoArm = ARM_EXTRN;
dcom.tParm.lExtnArm = IN_2;
/* Measure High Frequency Modulation (Rising Edge, Triangular FFT window) */
jitt.tParm.lFuncNum = FUNC_TT_P;
jitt.tFfts.lWinType = FFT_TRI;
jitt.lAutoFix = 1;
STEP 4 - Initializing the SIA-3000
COMM_InitDev() must be called once at the beginning of your application to pass information
concerning the remote configuration. The initialization values shown may need to be altered if a
non-standard configuration is used. See Section 3.1.1 for complete details concerning
configuration options.
All PAPI functions return a non-zero value in the event of an error. These error codes are defined
in the supplied include files. A successful call to COMM_InitDev() must be accomplished before
any other calls to the WAVECREST PAPI.
/* Initialize device */
if ( ( ApiDevId = COMM_InitDev ( APIDEVTYPE, DEVICENAME ) ) < 1 )
{
printf("\nCOMM_InitDev() failed...\n");
goto Error;
}
/* Turn on calibration source */
if ( ( retn = COMM_TalkDev ( ApiDevId, ":CAL:SIG 10MSQ" ) ) != SIA_SUCCESS)
{
printf("\nCOMM_TalkDev() failed...\n");
goto Error;
}
STEP 5 - Perform PulseFind
In this exercise, the calibration signals are used to provide a signal. FCNL_PulsFnd requires two
parameters. The first parameter is the ApId number returned from the COMM_InitDev function call.
The second parameter is a pointer to one of the PARM structures (initialized in step 3).
/* Go ahead and perform a pulsefind */
if ( ( retn = FCNL_PulsFnd ( ApiDevId, &hist.tParm ) ) != SIA_SUCCESS)
{
printf("\nFCNL_PulsFnd() failed...\n");
goto Error;
}
6
SECTION 1 – Introduction
©WAVECREST Corporation 2005
STEP 6 - Perform Measurement and Return Statistics
A single call is made to perform the acquisition. Information concerning how to acquire the data is
drawn from the HIST structure, and output data as a result of the acquisition is also returned in the
HIST structure. If an error occurs during the acquisition a non-zero value is returned. See Appendix
A for definition of error codes.
Note that the WAVECREST PAPI performs its own dynamic memory allocation as required. The
calling application does not need to concern itself with memory management. However, since
dynamic memory allocation information is contained within the structure, the supplied cleanup
functions detailed below must be utilized in order to avoid memory leaks.
Acquisition functions may be called repeatedly with the same Tool Structure. When doing so the
output results contained within the structure are simply overwritten. Any dynamic memory previously
allocated is re-utilized. Using the same Tool Structure over and over again has the desirable
attribute of reducing the memory fragmentation that would occur if memory was allocated, freed, and
reallocated repeatedly.
/* Perform a measurement and return the statistics */
if ( ( retn = FCNL_RqstPkt ( ApiDevId, &hist, WIND_HIST ) ) != SIA_SUCCESS)
{
printf("\nFCNL_RqstPkt() failed...\n");
goto Error;
}
/* Now retrieve the plot structures for the previous measurement */
/* This call is not necessary unless you want the plot data */
if ( ( retn = FCNL_RqstAll ( ApiDevId, &hist, WIND_HIST ) ) != SIA_SUCCESS)
{
printf("\nFCNL_RqstAll() failed...\n");
goto Error;
}
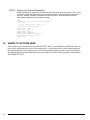
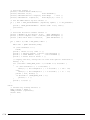
STEP 7 - Print Results
Results to be printed are drawn directly from the HIST structure. Note that all results are
returned in the units of Hertz, Volts, and seconds. Therefore a conversion factor may be
required in order to display the results in more appropriate units. For complete details on the
HIST structure, see Section 2-25.
/* Print the results */
printf("Single Histogram Mean: %lfns\n", hist.dNormAvg * 1e9);
printf("Single Histogram Sdev: %lfps\n", hist.dNormSig * 1e12);
STEP 8 - Perform a dataCOM Acquisition
This is an example of a dataCOM acquisition. FCNL_RqstPkt retrieves the data and
FCNL_RqstAll returns all of the plot data. For complete details on the dataCOM Tool and
Structure, see Section 2-20.
if ( ( retn = FCNL_RqstPkt
{
printf("\nFCNL_RqstPkt()
goto Error;
}
if ( ( retn = FCNL_RqstAll
{
printf("\nFCNL_RqstAll()
goto Error;
}
©WAVECREST Corporation 2005
( ApiDevId, &dcom, WIND_DCOM ) )
!= SIA_SUCCESS)
failed...\n");
( ApiDevId, &dcom, WIND_DCOM ) )
!= SIA_SUCCESS)
failed...\n");
SECTION 1 – Introduction 7
STEP 9 - Cleanup and Terminate Application
Before terminating the application, the supplied cleanup functions should be called. FCNL_ClrHist
and FCNL_ClrJitt frees any dynamic memory which may have been allocated and clears out the
structure. COMM_CloseDev() closes the remote device driver. After this cleanup has been
performed the application may terminate normally.
Error:
/* Return an error message if we had a problem */
if ( retn )
printf ( "Return Code: %i\n", retn );
/* Perform any cleanup and exit */
FCNL_ClrHist ( &hist );
FCNL_ClrJitt ( &jitt );
FCNL_ClrDcom ( &dcom );
COMM_CloseDev (ApiDevId);
Printf(“Strike ENTER to continue…”);
Fgets(cmnd, sizeof(cmnd), stdin);
return (retn);
}
1-8
WHERE TO GO FROM HERE
This completes your introduction to the WAVECREST PAPI. You should have installed the software,
built a basic application and reviewed its composition. You should now have a basic understanding of
the underlying framework, and be ready to leverage that understanding to further explore the interface.
Subsequent chapters present additional detail concerning the structures and functions provided with the
WAVECREST PAPI.
8
SECTION 1 – Introduction
©WAVECREST Corporation 2005
SECTION 2 – TOOL-SPECIFIC COMMANDS AND STRUCTURES
2-1
INTRODUCTION
There are 29 tools currently supported in the Production API. These tools, or measurement windows,
perform all measurement functions of the SIA-3000 as well as all calculations based on the
measurements. All of these tools are represented in software to enable easy measurement programming
over GPIB. For any particular measurement, simply select the appropriate tool, program the necessary
settings and then execute the measurement command.
All measurements are handled by sending a measurement window structure containing all input
parameters to a calling function, which initiates the measurement. Each of the measurement window
structures is specific to one of the standard acquisition tools contained in the GigaView software.
Additional sub-structures are also defined that are used within these standard measurement window
structures. Beginning with Section 2-3, the additional structures are defined. The measurement window
structures and commands are detailed for the standard acquisition tools starting with Section 2-15.
Please note that many of the measurement window structures contain padding fields. These fields
are usually called lPad1, lPad2,… or lPadLoc1, lPadLoc2,… and are used to insure that
variables are placed in the same absolute locations within the structure regardless of compiler
padding which varies from system to system. These fields are only used to take up space, and can be
safely ignored.
Section 2-2 outlines the calling functions that are used to initiate a measurement and to retrieve the data
from the instrument. The commands in Section 2-2 are completely independent of the measurement
window structure to be used and are used with all of the structures. Once the measurement has been
successfully completed, the results are returned in the output section of the same measurement window
structure.
The basic process for conducting a measurement is as follows:
1. Initialize a window structure. This means that memory must be allocated, variables declared
and the structure set to defaults.
2. Modify any structure elements as needed for the given measurement. Typical modifications
include channel number, pattern file name (if data), number of measurements and triggering
information.
3. Call a measurement command. Use one of the measurement commands from Section 3.2 and
pass it the window structure defined in 1 and 2.
4. Parse the window structure for the results. Once the measurement is completed, the
command will return any error messages or a SIA_SUCCESS if measurement was completed
successfully.
If the program is to be done in a production environment, some attention needs to be paid to the
memory handling. In step 1, we allocated memory for the structure. If this is done repeatedly without
clearing the memory, this will result in a memory overflow error during run time. This can be avoided
by either moving the memory declarations to a section of the program that is executed only once. Be
sure to execute an appropriate FCNL_Clrxxxx() command when the structure is no longer needed.
This only needs to be done once at the end of the program. Alternatively, memory can be allocated
and cleared on a per-run basis although this will have a huge impact on test time.
©WAVECREST Corporation 2005
SECTION 2 – Measurement Commands and Structures 9
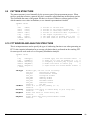
2-2
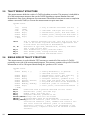
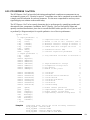
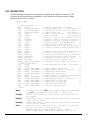
MEASUREMENT COMMANDS
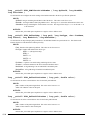
There are three basic commands used to execute a measurement: FCNL_RqstPkt, FCNL_RqstAll
and FCNL_MultPkt. The FCNL_RqstPkt command is used to perform a measurement where only
the statistical result is desired. The FCNL_RqstAll command is used to perform a measurement where
the plot data is desired. The FCNL_MultPkt command is used when the same measurement is to be
executed on multiple channels. Again, the process is to define the measurement window structure then
pass it to one of these three commands for measurement execution. Each of these three commands
requires the device ID and the window structure as an input.
long __stdcall FCNL_RqstPkt ( long ApiDevId, void *pData, long nType )
Use this function to perform data acquisitions with a particular tool (Histogram, dataCOM, etc.). Information on
how to acquire the data is drawn from the tool structure, and statistical output data resulting from the acquisition is
returned in the tool structure. Acquisition functions may be called repeatedly with the same tool structure. When
doing so, the output results contained within the structure are overwritten and any previously allocated dynamic
memory is re-utilized. Each measurement window structure is defined in Section 3.3. As shown in the example, a
measurement window structure is allocated in memory, then modified for the given measurement and passed to the
command for measurement execution. The results are stored in the measurement window structure that was used by
the FCNL_RqstPkt command. To retrieve the structure's plot data, use FCNL_RqstAll().
INPUTS
ApiDevid - Contains the API Device ID of the device. This value can be from 1 to 31.
pData - Pointer to a particular tool structure like HIST, DCOM, etc. to hold the input and output values.
nType - Flag specifying the type of the request such as WIND_HIST, WIND_JITT etc. as described in section
3.1 in the column “Tool Type”.
OUTPUTS
Returns SIA_SUCCESS upon successful completion or a specific error code (negative value) indicating what type
of error occurred.
EXAMPLE
memset ( &hist, 0, sizeof ( HIST ) );
FCNL_DefHist ( &hist );
hist.tParm.lFuncNum = FUNC_PER;
hist.tParm.lChanNum = 1;
hist.tParm.lStrtCnt = 1;
hist.tParm.lStopCnt = 2;
FCNL_RqstPkt ( ApiDevId, &hist, WIND_HIST );
10
Section 2 – Measurement Commands and Structures
//Allocate memory for measurement structure
//set structure to defaults
//Select period meas function of histogram tool
//Select channel number 1
//start on first edge after arm
//stop measurement on second rising edge
//execute the measurement.
©WAVECREST Corporation 2005
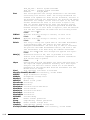
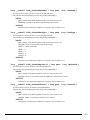
long __stdcall FCNL_RqstAll ( long ApiDevId, void *pData, long nType )
This function is for getting the plot data of a particular type of measurement- like histogram that was done immediately
prior to this request. This command is kept separate from the measurement command to minimize test time when the
plot data is not desired. Once this command is executed, the plot data can be extracted from the measurement window
histogram. See Section 2-3 for information on the PLTD structure and Section 2-40 for an example on extracting plot
data from a measurement window structure.
INPUTS
ApiDevid - Integer containing the API Device ID of the device. This value can be from 1 to 31.
pData - Pointer to a particular tool structure like HIST, DCOM, etc. that contains the input/output and plot values.
nType - Flag specifying the type of the request, such as WIND_HIST, WIND_JITT, etc.
OUTPUTS
Returns SIA_SUCCESS upon successful completion or a specific error code (negative value) indicating what
type of error occurred.
EXAMPLE
FCNL_RqstPkt ( ApiDevId, &hist, WIND_HIST );
FCNL_RqstAll ( ApiDevId, &hist, WIND_HIST );
//execute the measurement.
//get plot data
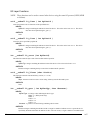
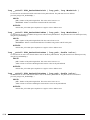
long __stdcall FCNL_MultPkt ( long ApiDevId, void *pData, long nType,
long nRefChn, long nChns )
Use this function to perform pseudo-parallel data acquisitions with a particular tool (Histogram, dataCOM, etc.) on
multiple channels. Measurement setup is contained in the first element of the array of structures pointed to by *pData.
Results of the measurement are contained in the array structures. Only the structure needs to be defined. All other
structures will be copied from the first array structure. In the example below, two structures are created (hist[0] to
hist[1]) and defined as type HIST. Then, only the first element, hist[0], is modified with the desired measurement setup
parameters. The calling function will copy the info in hist[0] to hist[1].
INPUTS
ApiDevid - Contains the API Device ID of the device. This value can be from 1 to 31.
pData - Pointer to an array of particular tool structures such as HIST, DCOM, etc. to hold the input and output
values
nType - Flag specifying the type of tool structure: WIND_HIST, WIND_JITT etc.
nRefChn - Specifies the reference channel for channel-to-channel measurements. For single-channel
measurements, set to 0.
nChns - Bit field specifying the channels to measure. Set Bit0 to measure channel 1, Bit1 to measure channel 2, etc.
OUTPUTS
Returns SIA_SUCCESS upon successful completion or a specific error code (negative value) indicating what type
of error occurred.
EXAMPLE
static HIST hist[2];
memset ( &hist[0], 0, sizeof ( HIST ) );
FCNL_DefHist ( &hist[0] );
hist[0].tParm.lFuncNum = FUNC_PER;
hist[0].tParm.lStrtCnt = 1;
hist[0].tParm.lStopCnt = 2;
FCNL_MultPkt(ApiDevId, &hist[0], WIND_HIST, 0, 3)
©WAVECREST Corporation 2005
//declare 2 window structures of type HIST
//clear the memory for first structure
//Set first structure to defaults.
//declare measurement to be made
//declare the start count of the measurement
//declare the stop count of the measurement
//execute the measurement on channel 1
//and channel 2. Note that the nRefChn field
//is set to 0 since no Ref Channel used.
SECTION 2 – Measurement Commands and Structures 11
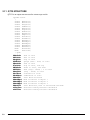
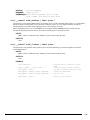
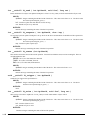
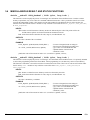
2-3
PLOT DATA STRUCTURE
This is an output structure used to hold the necessary information to construct a view of the
measurement that was performed. For example, the histogram tool can return a histogram plot.
In order to optimize performance the plot data itself is returned in the measurement window structure
only when FCNL_RqstAll() is called. The plot statistics are valid, but the pointer dData will be invalid
until FCNL_RqstAll() transfers the plot data, stores it locally, and assigns the dData pointer to this local
copy. The PLTD structure can then be used by a plotting utility to display the plot information. The plot
data may be manipulated directly from the PLTD structure, or FCNL_GetXval() and FCNL_GetYval()
may be called for simplicity.
See section 2-2 for more information about the FCNL_RqstAll() command and section 2-1 for higher
level Plot utility functions.
The data is organized by linear indexing of the x-axis and assignment of one element of X for each
element in the y-axis data array. The y-coordinate is extracted from the dData array, while the xcoordinate may be calculated using the number of points in the array and the x-axis extents.
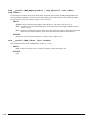
This formula is used to calculate an X value for a given index (0 <= index < plot.lNumb):
X = (plot.dXmax – plot.dXmin) * (double) index / (double) (plot.lNumb - 1) + plot.dXmin;
typedef struct
{
double *dData;
long
lNumb;
long
lRsvd;
long
lPad1;
double dXmin, dXmax;
double dYmin, dYmax;
double dYavg, dYstd;
/* Pointer to y-axis data array
/* Number of valid data points
/* Used to track memory allocation
*/
*/
*/
/* X-axis values for ends of data array
/* Min/Max values in y-axis data array
/* Average/1-Sigma values for data array
*/
*/
*/
long
long
lXminIndx;
lXmaxIndx;
/* Used by histograms to indicate
/* location of first and last valid bins
*/
*/
long
long
lYminIndx;
lYmaxIndx;
/* Indicates the location where the
/* min/max values occur in data array
*/
*/
double dAltXmin, dAltXmax; /* Alternate X-axis values, if applicable */
} PLTD;
dData
Pointer to y-axis data array.
LNumb
Number of valid data points.
LRsvd
Used to track memory allocation.
dXmin,dXmax X-axis values for ends of data array.
dYmin,dYmax Min & Max values in Y-axis data array.
dYavg,dYstd Average & 1-Sigma values for data array.
lXminIndx,lXmaxIndx Used by histograms to indicate location of first and
last valid bins.
lYminIndx,lYmaxIndx Indicates the location where the Min & Max values
occur in data array.
dAltXmin,dAltXmax Alternate X-axis values, if applicable. For graphs where
it makes sense an alternate X-axis unit may be calculated.
Examples include time or index on a Clock High Frequency
Modulation Analysis 1-sigma plot, or unit interval or time on
a Datacom Known Pattern With marker bathtub plot. If no
applicable alternate unit is defined these variables will both
be set to zero.
12
Section 2 – Measurement Commands and Structures
©WAVECREST Corporation 2005
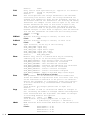
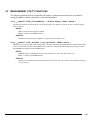
2-4
ACQUISITION PARAMETER STRUCTURE
An acquisition parameter structure is contained in every measurement window structure. It is an
input structure that holds common information for a variety of tool measurements such as channel
number, voltage, and sample size. For some simple tools, information such as start and stop counts
will also be drawn from this structure. For more algorithm-based tools these values may be
computed as needed.
typedef struct
{
long
lFuncNum;
long
lChanNum;
long
lStrtCnt;
long
lStopCnt;
long
lSampCnt;
long
lPadLoc1;
double dStrtVlt;
double dStopVlt;
long
lExtnArm;
long
lPadLoc2;
/*
/*
/*
/*
/*
Function to measure
Channel to measure
Channel start count
Channel stop count
Sample size
*/
*/
*/
*/
*/
/* Start voltage
/* Stop voltage
/* Arm when external is selected
*/
*/
*/
long
long
lOscTrig;
lOscEdge;
/* O-scope trigger
/* O-scope rise/fall trig
*/
*/
long
long
double
double
lFiltEnb;
lPadLoc3;
dFiltMin;
dFiltMax;
/* Filter enable
*/
/* Filter minimum
/* Filter maximum
*/
*/
long
long
long
long
double
double
long
long
lAutoArm;
lArmEdge;
lGatEdge;
lPadLoc4;
dArmVolt;
dGatVolt;
lGateEnb;
lCmdFlag;
/* Auto arm enable/mode
/* Arm rise/fall edge
/* Gate rise/fall edge
*/
*/
*/
/*
/*
/*
/*
*/
*/
*/
*/
long
long
long
long
long
lFndMode;
lFndPcnt;
lPadLoc5;
lPadLoc6;
lPadLoc7[2][6];
/* Pulse find mode
/* Pulse find percent
*/
*/
/* Timeout in sec's, if negative it's ms
/* Arming delay in steps [can be +/-]
*/
*/
long
lTimeOut;
long
lArmMove;
long
lNotUsed[2];
} PARM;
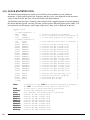
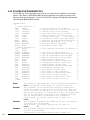
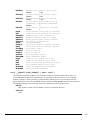
lFuncNum
Arm user voltage
Gate voltage
Enable gating
Command flag for timestamping, etc..
Function to measure, use any of the following:
2-Channel:
FUNC_TPD_PP
TPD +/+
FUNC_TPD_MM
TPD -/FUNC_TPD_PM
TPD +/FUNC_TPD_MP
TPD -/+
1-Channel:
FUNC_TT_P
Rising edge time
FUNC_TT_M
Falling edge time
FUNC_PW_P
Positive pulse width
FUNC_PW_M
Negative pulse width
FUNC_PER
Period
FUNC_FREQ
Frequency
FUNC_PER_M
Period Minus
Default:
FUNC_PER
©WAVECREST Corporation 2005
SECTION 2 – Measurement Commands and Structures 13
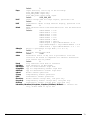
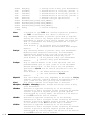
lChanNum
lStrtCnt
lStopCnt
lSampCnt
dStrtVlt
dStopVlt
lExtnArm
lOscTrig
lOscEdge
lFiltEnb
dFiltMin
dFiltMax
lAutoArm
lArmEdge
lGateEdge
dArmVolt
dGatVolt
lGateEnb
14
Channel to measure, the minimum value is 1, the maximum is based on
the system configuration. For two channel TPD measurements, the lower
16 bits define the start channel and the upper 16 bits defines the
stop channel. In the Oscilloscope tool, channels are designated by a
bitfield, implying that multiple channels can be measured at the same
time. (example: If 1ChanNum=3, channels 1 and 2 will be measured)
Default:
1
Channel start count; the valid range is from 1 to 10,000,000.
Default:
1
Channel stop count; the valid range is from 1 to 10,000,000.
Default:
2
Sample size; the valid range is from 1 to 950,000.
Default:
300
Start voltage sets the reference voltage used to initiate the
time measurement. The valid range is +/-2.0 volts.
Default:
0.0
Stop voltage sets the reference voltage used to terminate the
time measurement. The valid range is +/-2.0 volts.
Default:
0.0
Channel to use for external arming. Only used if lAutoArm is
set to ARM_EXTRN. The minimum is 1, the maximum is based on
the system configuration.
Default:
1
Channel to use for oscilloscope trigger.
Default:
1
Edge to use to trigger oscilloscope, use any of the following:
EDGE_FALL, EDGE_RISE.
Default:
EDGE_RISE
Filter enable, any non-zero value enables filters.
Default:
0
Filter minimum in seconds, only used if lFiltEnb is non-zero;
valid range is +/-2.49 seconds.
Default:
-2.49
Filter maximum in seconds, only used if lFiltEnb is non-zero;
valid range is +/-2.49 seconds.
Default:
+2.49
Auto arm enable and mode, use any of the following:
ARM_EXTRN
Arm using one of the external arms
ARM_START
Auto-arm on next start event
ARM_STOP
Auto-arm on next stop event
Default:
ARM_STOP
Arming edge to use, only used if lAutoArm is set to ARM_EXTRN
and may be either EDGE_FALL or EDGE_RISE.
Default:
EDGE_RISE
Edge to use when external arming gate is enabled; only used if lAutoArm
is set to ARM_EXTRN and may be either EDGE_FALL or EDGE_RISE.
Default:
EDGE_RISE
Arm1 voltage, the valid range is +/-2.0 volts and is only used
if lAutoArm is set to ARM_EXTRN.
Default:
0.0
Arm2 voltage, the valid range is +/-2.0 volts and is only used
if lAutoArm is set to ARM_EXTRN.
Default:
0.0
Enable external arm gating on the currently selected external
arming channel; any non-zero value enables gating.
When gating is enabled, the arming edge and reference voltages of
the current external arm channel are associated with gating.
Default:
0
Section 2 – Measurement Commands and Structures
©WAVECREST Corporation 2005
Bitfield containing modifiers. Most of the bits are reserved for
internal use and should be left to zero. However, the following
bits are provided for enabling user selectable options.
CMD_PATNMARK
(1<<4)
Use PM50 card as arm source on the
selected external arming channel.
CMD_BWENHANCED (1<<10) Apply Bandwidth Enhancement algorithm to
scope data. This is only appropriate if a stationary waveform
relative to the trigger is available.
Default:
0
lFndMode
Pulse find mode, may be one of the following:
PFND_FLAT
Use flat algorithm for pulse-find calculation.
PFND_PEAK
Use peak value for pulse-find calculation.
Default:
PFND_PEAK
lFndPcnt
Pulse find percentage, may be one of the following:
PCNT_5050
Use 50/50 level for pulse-find calculation.
PCNT_1090
Use 10/90 level for pulse-find calculation.
PCNT_9010
Use 90/10 level for pulse-find calculation.
PCNT_USER
Do NOT perform pulse-find, manual mode. When
this mode is selected, valid voltages must be
loaded in the dStrtVlt, dStopVlt, dArmVolt and
dGatVolt parameters.
PCNT_2080
Use 20/80 level for pulse-find calculation.
PCNT_8020
Use 80/20 level for pulse-find calculation.
Default:
PCNT_5050
lTimeOut
Seconds for timeout before returning an error. A positive
number is used to indicate a value in seconds, a negative
number is used to indicate a value in milliseconds (Ex: -100
indicates 100ms.) The range of valid times is 10ms to 50s.
Default:
2
lArmMove
This variable controls an arming delay that can be applied to
either an external arm source, or the channel itself if autoarming is enabled. Values in the range of –40 to 40 are
acceptable (each step represents a 25ps delay from nominal).
Arm Delay (ns) Index Value
19.0
-40
...
...
19.75
-10
...
...
20.0
0
...
...
21.0
40
Default:
-10
lNotUsed[n] Formerly DSM channel select, no longer used.
lCmdFlag
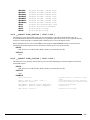
void __stdcall FCNL_DefParm ( PARM *parm )
This function is used to fill a PARM structure with default values that are reasonable. It is not necessary to
clear a PARM structure using the standard memset() function prior to calling this function since no dynamic
memory allocation exists within this structure.
INPUTS
parm - Pointer to a PARM structure. Memory needs to be allocated by the caller.
OUTPUTS
None.
©WAVECREST Corporation 2005
SECTION 2 – Measurement Commands and Structures 15
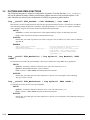
2-5
TAILFIT RESULT STRUCTURE
This output structure holds the results of a TailFit algorithm execution. This structure is imbedded in
all of the measurement structures that use the TailFit algorithm to separate Random Jitter and
Deterministic Jitter from a histogram of measurements. Should the measurement come to completion
without a successful TailFit, re-execute the measurement to acquire more data.
typedef struct
{
long
lGood;
long
lPad1;
SIDE
tL, tR;
double dDjit;
double dRjit;
double dTjit;
} TFIT;
lGood
tL, tR
dDjit
dRjit
dTjit
2-6
/* Flag to indicate successful tail-fit
*/
/*
/*
/*
/*
*/
*/
*/
*/
Individual left/right tail-fit data
Deterministic jitter, from both sides
Random jitter, average from both sides
Total jitter, calculated from bathtub
Flag to indicate successful tail-fit. This flag will be set to
a one if the TailFit algorithm successfully separated RJ and
DJ from within the histogram of measurements.
Structures of type SIDE, defined below, containg individual
left & right tail-fit data.
Total Deterministic jitter, from both sides.
Total Random jitter, average from both sides.
Total jitter, calculated from bathtub curve.
SINGLE SIDE OF TAILFIT STRUCTURE
This output structure is used within the TFIT structure to contain all of the results of a Tail-Fit
pertaining to one side of the measurement histogram. This structure contains side specific RJ and DJ
information as well as Chi-squared data defining the “goodness of fit” criteria.
typedef struct
{
double dCoef[ 3 ];
double
double
double
double
double
double
double
} SIDE;
dDjit;
dRjit;
dChsq;
dLoValu, dHiValu;
dMuValu;
dEftvDj, dEftvRj;
dTjit;
/*
/*
/*
/*
/*
/*
/*
/*
/*
Used by WavGetTfit() to generate
idealized tail-fit curves
Deterministic jitter, this side only
Random jitter, this side only
ChiSquare indicator, goodness of fit
Xval range over which tail was fitted
Projected Xval where mu was determined
Effective jitter if calculated
Total jitter, calculated from bathtub
*/
*/
*/
*/
*/
*/
*/
*/
*/
dCoef
Coefficient used to generate idealized tail-fit curves.
dDjit
Deterministic jitter, this side only.
dRjit
Random jitter, this side only.
dChsq
ChiSquare indicator, goodness of fit.
dLoValu,dHiValu range over which tail was fitted.
dMuValu
Projected dXval where mu was determined.
dEftvDj,dEftvRj Holds the effective jitter values if calculated. To
calculate the effective jitter, lFndEftv must contain a nonzero value. Since the effective jitter is calculated by
optimizing a curve-fit, a result is not guaranteed. If the
curve-fit fails, a negative value will be returned in these
variables.
16
Section 2 – Measurement Commands and Structures
©WAVECREST Corporation 2005
2-7
SPECIFICATION LIMIT STRUCTURE
This input structure is used by the Datacom Known Pattern With Marker Tool to contain the
parameters for tRateInf, tDdjtInf and tRjpjInf. This tool uses these specifications when setting up
the measurement for capturing bit rate, DDJ and RJ/PJ spectra respectively.
typedef struct
{
long
lSampCnt;
long
lPad1;
double dMaxSerr;
long
lPtnReps;
long
lPad2;
} SPEC;
lSampCnt
dMaxSerr
lPtnReps
lPad1,lPad2
/* Sample size to use
*/
/* LIM_ERROR if this std. error exceeded
/* Patterns to sample across
*/
*/
Sample size to use when acquiring data
Valid Entries: 1 to 10,000,000
Default:
100
Value of standard error which is tolerated, used to identify
wrong pattern or other setup error.
Valid Entries: any integer greater than or equal to 0
Default:
0.5
Patterns to sample across. The larger this number is the more
accurate the measurement will be with regards to absolute time
measurements. This is due to the effect of aver
Valid Entries: 1 Default:
rRateInf - 10
dDdjtInf - 1
dRjpjInf - 1
Internal parameters, do not modify.
©WAVECREST Corporation 2005
SECTION 2 – Measurement Commands and Structures 17
2-8
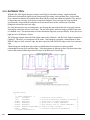
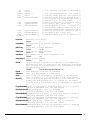
DDJ+DCD DATA STRUCTURE
This output structure contains all of the measurement data used to calculate DDJ+DCD in the
Datacom Known Pattern With Marker Tool. This tool contains a pointer to an array of DDJT
structures with an element for each transition in the pattern.
typedef struct
{
double dMean;
double dVars;
double dMini;
double dMaxi;
double dDdjt;
double dFilt;
long
lNumb;
long
lPad1;
} DDJT;
dMean
dVars
dMini
dMaxi
dDdjt
dFilt
lNumb
18
/*
/*
/*
/*
/*
/*
/*
Average value for this span
*/
Variance value for this span
*/
Minimum value for this span
*/
Maximum value for this span
*/
Static displacement for this span (UI) */
DDJT after LPF is applied (UI)
*/
Number of measures in this span
*/
Average value for this span. This is the time elapsed from the
first edge in the pattern to transition associated with this
structure. In an ideal signal (one which contains no jitter),
this value would be an integer multiple of the bit period. Any
deviation there of is considered jitter and becomes an element
of the DDJ+DCD histogram.
Variance value for this span. This is net deviation of the
mean to the ideal bit transition.
Minimum value for this span. This is the earliest transition
for this bit period. It defines the earliest transition for
this location in the pattern.
Maximum value for this span. This is the latest transition for
this bit period. It defines the latest transition for this
location in the pattern.
Static displacement for this span (UI).
DDJT after HPF is applied (UI).
Number of measures in this span.
Section 2 – Measurement Commands and Structures
©WAVECREST Corporation 2005
2-9
PATTERN STRUCTURE
The pattern structure is used internally by the system as part of the measurement process. When
tools are used that reference a pattern, they have a member called sPtnName in their binary packet.
This field holds the name of the pattern file that is to be used. Whenever a binary packet is sent
which contains a new value in sPtnName, a new internal representation is loaded.
typedef struct
{
char
*bHex;
short
*iPos;
short
*iCnt;
double *dCal;
long
lLpat;
long
lEpat;
double dCalUI;
} PATN;
/*
/*
/*
/*
/*
/*
/*
Pointer to raw hex data
Pointer to run length encoded data
Pointer to start/stop counts to use
Pointer to calibration data if present
The length of pattern in UI
The edge count of pattern pos or neg
Cal data taken at this unit interval
*/
*/
*/
*/
*/
*/
*/
2-10 FFT WINDOW AND ANALYSIS STRUCTURE
This is an input structure used to specify the type of windowing function to use when generating an
FFT. It also contains information for an average calculation that is performed on the resulting FFT
for some specific tools such as Low Frequency Modulation Analysis.
typedef struct
{
long
lWinType;
long
lPadMult;
double dCtrFreq;
double dRngWdth;
double dAlphFct;
} FFTS;
lWinType
lPadMult
dCtrFreq
dRngWdth
dAlphFct
/*
/*
/*
/*
/*
Window type, use FFT constants above
Power of 2 to use for padding (0 - 5)
Frequency to assess yavg in plot array
Width over which to assess yavg
Alpha factor for Kaiser-Bessel window
*/
*/
*/
*/
*/
Window type, use one of the following:
FFT_RCT
Rectangular window
FFT_KAI
Kaiser-Bessel window
FFT_TRI
Triangular window
FFT_HAM
Hamming window
FFT_HAN
Hanning window
FFT_BLK
Blackman window
FFT_GAU
Gaussian window
Default:
FFT_KAI
Power of 2 to use for padding (0 - 5)
Default:
4
Frequency over which to assess dYavg in plot array (Hz)
Default:
100.0
Width over which to assess dYavg (Hz)
Default:
10.0
Alpha factor when using Kaiser-Bessel window
Default:
8.0
©WAVECREST Corporation 2005
SECTION 2 – Measurement Commands and Structures 19
2-11 QTYS STRUCTURE
QTYS is an output structure used to return scope results.
typedef struct
{
double dMaxVolts;
double dMinVolts;
double dAvgVolts;
double dPkPkVolt;
double dRmsVolts;
double dTopVolts;
double dBtmVolts;
double dMidVolts;
double dAmplVolt;
double dOvrShoot;
double dUndShoot;
double dMaskFail;
double dMaskRgn1;
double dMaskRgn2;
double dMaskRgn3;
double dMaskTotl;
MEAS
mRiseTime;
MEAS
mFallTime;
} QTYS;
dMaxVolts
dMinVolts
dAvgVolts
dPkPkVolt
dRmsVolts
dTopVolts
dBtmVolts
dMidVolts
dAmplVolt
dOvrShoot
dUndShoot
dMaskFail
dMaskRgn1
dMaskRgn2
dMaskRgn3
dMaskTotl
mRiseTime
mFallTime
20
Vmax in Volts
Vmin in Volts
Vavg in Volts
Vpk-pk (Vmax – Vmin) in Volts
Vrms in Volts
Vtop in Volts, flat top
Vbase in Volts, flat base
Vmid (Vtop + Vbase) / 2 in Volts
(Vtop – Vbase) in Volts
Vovershoot in Volts
Vundershoot in Volts
Total Mask violations
Mask Violations in Region 1
Mask Violations in Region 2
Mask Violations in Region 3
Total Mask hits, both In and Outside the Mask
Structure holding Risetime information
Structure holding Falltime information
Section 2 – Measurement Commands and Structures
©WAVECREST Corporation 2005
2-12 MEAS STRUCTURE
MEAS is an output structure used to return scope rise/fall time results.
typedef struct
{
long
lGood;
long
lPad1;
double dValu;
double dXpnt[2];
double dYpnt[2];
} MEAS;
lGood
DValu
dXpnt[2]
dYpnt[2]
Flag indicates valid output data in structure.
Field holds rise or fall time result
The starting and ending threshold location in secs.
The starting and ending threshold location in Volts.
2-13 OHIS STRUCTURE
OHIS is an output structure used to return oscilloscope histogram results.
typedef struct
{
PLTD
tPlot;
long
lCoun;
long
lPad1;
double dAver;
double dMini;
double dMaxi;
double dSdev;
double dEpsl;
double dVars;
} OHIS;
tPlot
lCoun
dAver
dMini
dMaxi
dSdev
dEpsl,dVars
Plot structure that holds the histogram representation
Count of the total number of hits in the histogram
Average of all the data contained in the histogram
Minimum of all the data contained in the histogram
Maximum of all the data contained in the histogram
Standard deviation of all the data contained in the histogram
Used internally, DO NOT ALTER!
©WAVECREST Corporation 2005
SECTION 2 – Measurement Commands and Structures 21
2-14 MASK STRUCTURE
MASK is an input structure that is used to specify an Eye Mask to be used in the Scope Tool.
typedef struct
{
/* Absolute voltages */
double dVmask;
double dVoffs; /* No longer used */
double dV1pas;
double dTmask;
double dToffs; /* No longer used */
double dTflat;
double dV0pas;
/* Relative voltages */
double dXwdUI;
double dXflUI;
double dYiPct;
double dV1Rel;
double dV0Rel;
} MASK;
dVmask
dVoffs
dV1pas
dTmask
dToffs
dTflat
dV0pas
dXwdUI
dXflUI
dYiPct
dV1Rel
dV0Rel
22
Absolute width of mask in secs.
No longer used, this field can be ignored
Distance from the top of the mask to the upper region in Volts.
Absolute position of the center of the mask in secs.
No longer used, this field can be ignored
Width of the top and bottom flats of the mask in secs.
Distance from the bottom of mask to the lower region in Volts.
Relative width of mask in UI
Relative width of the top and bottom flats of the mask in UI
Height of inner region of mask relative to the data, expressed as %
Distance from top of inner region to top region expressed as a
% of data height
Distance from bottom of inner region to bottom region
expressed as a % of data height
Section 2 – Measurement Commands and Structures
©WAVECREST Corporation 2005
2-15 KPWM STRUCTURE
KPWM is a measurement structure used by some of the PCI Express and Serial ATA tools.
typedef struct
{
/* Input parameters */
PARM
tParm;
FFTS
tFfts;
char
sPtnName[ 128 ];
long
lAcqEdge;
long
long
long
long
lOneEdge;
lQckMode;
lIntMode;
lErrProb;
long
double
lHeadOff;
dCornFrq;
/*
/*
/*
/*
/*
/*
/*
/*
/*
/*
/*
/*
SPEC
SPEC
SPEC
tRateInf;
tDdjtInf;
tRjpjInf;
/* Parameters to acquire Bit Rate
/* Parameters to acquire DCD+DDJ
/* Parameters to acquire RJ+PJ
*/
*/
*/
double
double
double
double
long
long
dLpfFreq;
dHpfFreq;
dLpfDamp;
dHpfDamp;
lLpfMode;
lHpfMode;
/*
/*
/*
/*
/*
/*
*/
*/
*/
*/
*/
*/
long
long
long
lFndEftv;
lMinEftv;
lMaxEftv;
/* Flag to attempt effective jitter calc */
/* Min probability for effective fit: -4 */
/* Max probability for effective fit: -12 */
long
long
long
long
lFiltEnb;
lQckTjit;
lPllComp;
lPad0;
/* Enable IDLE character insertion filter */
/* Fast total jitter calc - no bathtubs! */
/* Enable PLL Curve Spike Compensation
*/
/* Output parameters */
long
lGood;
PATN
tPatn;
double
long
long
long
long
dWndFact;
lMaxStop;
lPtnRoll;
lAdjustPW;
lPad1;
double dBitRate;
DDJT
*tDdjtData;
long
lDdjtRsvd;
double *dRjpjData;
long
lRjpjRsvd;
long
*lPeakData;
long
lPeakNumb;
long
lPeakRsvd;
©WAVECREST Corporation 2005
Contains acquisition parameters
FFT window and analysis parameters
Name of pattern file to be used
Reference Edge and RJ+PJ measure edge
Could be: EDGE_FALL or EDGE_RISE
If true, DCD+ISI is rise or fall only
Enable quick mode, external arm only
Interpolation mode, non-zero is linear
Error probability for Total Jitter
Valid range is ( -1 to -16 )
Header offset, external arming only
Corner Frequency for RJ+PJ
Low pass filter corner frequency
High pass filter corner frequency
Low pass filter 2nd order damp_factor
High pass filter 2nd order damp_factor
LPF mode, see constants above
HPF mode, see constants above
*/
*/
*/
*/
*/
*/
*/
*/
*/
*/
*/
*/
/* Flag indicates valid data in structure */
/* Internal representation of pattern
*/
/******************************************/
/* These values are all used internally */
/*
DO NOT ALTER!
*/
/******************************************/
/*
/*
/*
/*
/*
/*
/*
/*
Bit Rate that was measured
Raw DCD+DDJ measurements
Used to track memory allocation
Raw variance data
Used to track memory allocation
Tracks detected spikes in RJ+PJ data
Count of detected spikes
Used to track memory allocation
*/
*/
*/
*/
*/
*/
*/
*/
SECTION 2 – Measurement Commands and Structures 23
long
double
double
double
double
double
double
double
double
double
lHits;
dDdjt;
dDjit;
dRjit;
dPjit;
dTjit;
dEftvLtDj;
dEftvLtRj;
dEftvRtDj;
dEftvRtRj;
/*
/*
/*
/*
/*
/*
/*
Total samples for DDJT+RJ+PJ combined
DCD+DDJ jitter
Deterministic jitter
Random jitter
Periodic jitter
Total jitter
Effective jitter when enabled
*/
*/
*/
*/
*/
*/
*/
PLOT
PLOT
PLOT
PLOT
PLOT
PLOT
PLOT
PLOT
PLOT
} KPWM;
tRiseHist;
tFallHist;
tNormDdjt;
tHipfDdjt;
tLopfDdjt;
tBathPlot;
tEftvPlot;
tSigmNorm;
tFreqNorm;
/*
/*
/*
/*
/*
/*
/*
/*
/*
DCD+DDJ histogram of rising edges
DCD+DDJ histogram of falling edges
DCD+DDJvsUI for external arming only
High Pass Filtered DCD+DDJvsUI
Low Pass filtered DCD+DDJvsUI
Bathtub plot
Effective Bathtub plots, if enabled
1-Sigma plots
Frequency plots
*/
*/
*/
*/
*/
*/
*/
*/
*/
tParm
tFfts
sPtnName
lAcqEdge
lOneEdge
lQckMode
lIntMode
24
A structure of type PARM that contains acquisition parameters.
The PARM structure is discussed in full detail in Section 2-4.
A structure of type FFTS that contains the setup parameters
for the FFT. See Section 2-10 for further details on FFTS
structures.
A character array containing the name of pattern file to be
used, the file must exist in the pattern directory (C:\VISI\)
on the SIA3000 or else an error will be returned. The first
time a measurement is performed the pattern is loaded in
structure tPatn.
Valid Entries: a valid file name (including extension)
Default:
“k285.ptn”
Reference Edge and RJ+PJ measure edge: EDGE_FALL or EDGE_RISE.
Default:
EDGE_RISE
This parameter is used to enable a special mode where only
rising or falling edges are used to access DCD+ISI, as is the
case for the special PCI Express Clock Tool. Setting this
parameter to 1 will enable this special mode.
Valid Entries: 0 – disable single edge mode
1 – enable single edge mode
Default:
0
Parameter used to enable Quick Mode. QuickMode uses a sparse
sample of data points for the PJ and RJ estimates. In this
mode, the accuracy of these estimates is greatly reduced
depending on the application. Setting this structure element
to 1 enables quick mode, valid with external arm only.
Valid Entries: 0 – disable quick capture mode
1 – enable quick capture mode
Default:
0
Parameter used to enable linear Interpolation mode for RJ & PJ
estimate. RJ & PJ are calculated based on the frequency data
of the noise. Since data points are captured only on the
single polarity transitions, interpolation must be performed
between sample points. There are two types of interpolation
available in the SIA3000: linear and cubic. Setting this
parameter to 1 will enable linear interpolation; otherwise,
cubic interpolation will be used.
Valid Entries: 0 – use cubic interpolation in FFT data
Section 2 – Measurement Commands and Structures
©WAVECREST Corporation 2005
lErrProb
lHeadOff
dCornFrq
tRateInf
tDdjtInf
tRjpjInf
dLpfFreq
dHpfFreq
dLpfDamp
dHpfDamp
lLpfMode
lHpfMode
1 – use linear interpolation in FFT data
Default:
0
Error probability level for Total Jitter. Total Jitter is
calculated based on the desired Error Probability level. This
value is used in conjunction with the bathtub curve after the
successful completion of a tail-fit in order to project the
value of Total Jitter.
Valid Entries: -1 to -16
Default:
-12
Header offset parameter, for use in packet-ized data which may
have a frame header before the test pattern. This offset value
can be used to skip past header information and into the
repeating data pattern stream. This can be useful when
analyzing data from disk drives when the pattern marker may be
synchronized with the start of frame data.
Valid Entries: 0 to 10,000,000-pattern length
I
Default:
0 (indicating no header present)
Corner Frequency for RJ & PJ estimate in Hertz. This value is
used in conjunction with the Bit Rate and pattern to determine
the maximum stop count to be used to acquire RJ & PJ data. A
lower value increase acquisition time.
Valid Entries: Bit-Rate /10,000,000 to Bit-Rate
I
Default:
637e3 (637kHz – Fibre Channel 1X)
A structure of type SPEC used by the Bit Rate measurement. The
structure holds measurement specific parameters such as sample
count, pattern repeats and maximum standard error. See Section
2-7 for a description of the SPEC structure and its elements.
A structure of type SPEC used by the Data Dependant Jitter
(DDJ) measurement. The structure holds measurement specific
parameters such as sample count, pattern repeats and maximum
standard error. See Section 2-7 for a description of the SPEC
structure and its elements.
A structure of type SPEC used by RJ & PJ estimate. The
structure holds measurement specific parameters such as sample
count, pattern repeats and maximum standard error. See Section
2-7 for a description of the SPEC structure and it’s elements.
Low pass filter frequency in Hertz. This is only valid when
lLpfMode is enabled.
High pass filter frequency in Hertz. This is only valid when
lHpfMode is enabled.
Low pass damping factor. This is only valid when lLpfMode is
enabled, and a 2nd order filter is selected.
High pass damping factor. This is only valid when lHpfMode is
enabled, and a 2nd order filter is selected.
Low pass filter mode. One of the following may be used:
Valid Entries: FILTERS_DISABLED
BRICKWALL_FILTER
ROLLOFF_1STORDER
ROLLOFF_2NDORDER
PCIX_CLOK_FILTER
Default:
FILTERS_DISABLED
High pass filter mode. One of the following may be used:
Valid Entries: FILTERS_DISABLED
BRICKWALL_FILTER
ROLLOFF_1STORDER
ROLLOFF_2NDORDER
PCIX_CLOK_FILTER
Default:
FILTERS_DISABLED
©WAVECREST Corporation 2005
SECTION 2 – Measurement Commands and Structures 25
lFndEftv
Flag to indicate
l
that an
effective jitter
calculation is
to be attempted.
Effective Jitter
is a means of
estimating the
effective
l
deterministic
jitter as it
relates to a .5
Sampled
d
error
Extrapolated
h bC
probability.
Actual
h b
This is done by
first capturing
Extrapolated Bathtub curve versus real bathtub
the bathtub
curve as seen by BERT
curve using
conventional RJ & DJ estimation techniques; then,
extrapolating from a few points in the bathtub curve to the .5
error probability level to estimate effective DJ. Effective RJ
is extracted based on the curve that was fitted to the sample
points. These values should only be used to correlate to a
BERT Scan measurement and should not be used as a vehicle for
quantifying jitter. This technique was developed to allow BERT
systems to correlate with SIA3000 results.
Valid Entries: 0 – disable effective jitter estimate
1 – enable effective jitter estimate
Default:
0
lMinEftv, lMaxEftv Defines the error rates at which the eye width calculation
will be used in the estimating effective jitter components.
lMinEftv and lMaxEftv define points on the bathtub curve from
which the extrapolated RJ curve is traced. Then, where this
extrapolated curve intersects the .5 error probability, the
effective DJ is calculated.
Valid Entries: -1 to –16 (indicating 10-1 to 10-16 error rate)
Default:
-4 and –12 (lMaxEftv: 10-4 BER, lMinEftv: 10-12 BER)
lFiltEnb
Flag to enable IDLE character insertion filter. When enabled
any edge measurements that are not within ± 0.5 UI will be
discarded. This filter is used in systems, which may insert an
idle character from time to time to compensate for buffer
under-run/overrun issues. In those instances where an idle
character was inserted during a measurement, the edge
selection may be off. If this parameter is greater than or
equal to one, the filter is enabled and measurements that
differ from the mean by ± 0.5 UI will be discarded.
Valid Entries: 0 – disable idle character filter
1 – enable idle character filter
Default:
0
lQckTjit
Flag to indicate a fast total jitter calculation will be
performed using simple linear calculation of Total Jitter
instead of convolving the DJ Probability Density Functions and
the RJ Probability Density Functions. This calculation is
based on the formula [TJ = DJ + n*RJ] where DJ and RJ are
measured, and n is the multiplier based on a theoretical
Gaussian distribution
Valid Entries: 0 do not use convolution for TJ est.
1 Convolve DJ and RJ for TJ est.
Default:
0
26
Section 2 – Measurement Commands and Structures
©WAVECREST Corporation 2005
lPllComp
lGood
tPatn
dBitRate
lHits
dDdjt
dDjit
dRjit
dPjit
dTjit
dEftvLtDj
dEftvLtRj
dEftvRtDj
Enable PLL Curve Spike Compensation. If a low frequency spike
is detected in the Power Spectral Density (FFT) plot, it is
automatically removed and it’s energy is dispersed evenly
across the rest of the Power Spectral Density.
Default:
0
Flag indicates valid output data in structure. A positive
value in this parameter indicates that the measurement was
completed successfully, and, valid data can be extracted from
this structure.
Structure of type PATN which holds all of the pattern
information with regards to pattern length, pattern content,
marker placement relative to location in pattern and other
pattern specific metrics. (See Section 2-9 for a detailed
description of the PATN structure elements.) This is an
internal structure that the system uses to store pattern
information and does not need to be altered by the user. The
first time a measurement is performed the pattern is loaded
into tPatn which is used internally for all subsequent
acquisition and analysis.
The bit rate is measured and placed in this field (Hertz).
Total samples taken to calculate DDJ, RJ, and PJ values
combined. Gives an indication of the actual data to support
the calculated total jitter number.
DCD+DDJ measurement in seconds. This measurement is taken from
the mean deviation of each pattern edge from it’s ideal
location. All deviations are placed in a histogram and the
peak-peak value from this histogram is placed in this
structure location.
Deterministic jitter measurement, in seconds. This is the
DCD+DDJ summed with the Periodic Jitter.
Random jitter estimate, in seconds.
Periodic jitter measurement, in seconds.
Total jitter estimate, in seconds.
Effective Deterministic(eDJ) jitter estimate, in seconds, for
the left side of the bathtub curve. Total effective DJ is
calculated by adding dEftvLtDj to dEftvRtDj. In order to calculate
the effective jitter the flag lFndEftv must be enabled. Since the
effective jitter is calculated by optimizing a curve-fit to
the bathtub curve, a result is not guaranteed. If the curvefit is unsuccessful, a negative value will be returned in this
variable.
Effective Random(eRJ) jitter estimate, in seconds, for the
left side of the bathtub curve. Total effective RJ is
calculated by averaging dEftvLtRj and dEftvRtRj. In order to
calculate the effective jitter the flag lFndEftv must be enabled.
Since the effective jitter is calculated by optimizing a
curve-fit to the bathtub curve, a result is not guaranteed. If
the curve-fit is unsuccessful, a negative value will be
returned in these variables.
Effective Deterministic(eDJ) jitter estimate, in seconds, for
the right side of the bathtub curve. Total effective DJ is
calculated by adding dEftvLtDj to dEftvRtDj. In order to calculate
the effective jitter the flag lFndEftv must be enabled. Since the
effective jitter is calculated by optimizing a curve-fit to
the bathtub curve, a result is not guaranteed. If the curvefit is unsuccessful, a negative value will be returned in this
variable.
©WAVECREST Corporation 2005
SECTION 2 – Measurement Commands and Structures 27
dEftvRtRj
tRiseHist
tFallHist
tNormDdjt
tHipfDdjt
tLopfDdjt
tBathPlot
tEftvPlot
tSigmNorm
tFreqNorm
Effective Random(eRJ) jitter estimate, in seconds, for the
right side of the bathtub curve. Total effective RJ is
calculated by averaging dEftvLtRj and dEftvRtRj. In order to
calculate the effective jitter the flag lFndEftv must be enabled.
Since the effective jitter is calculated by optimizing a
curve-fit to the bathtub curve, a result is not guaranteed. If
the curve-fit is unsuccessful, a negative value will be
returned in this variable.
Structure of type PLOT which contains all of the plot
information for generating a DCD+DDJ histogram of rising
edges. See Section 2-3 for details concerning the PLOT
structure and its elements.
Structure of type PLOT which contains all of the plot
information for generating a DCD+DDJ histogram of falling
edges. See Section 2-3 for details concerning the PLOT
structure and its elements.
Structure of type PLOT which contains all of the plot
information for generating a DCD+DDJ versus UI plot. This plot
is only valid in Pattern Marker mode. See Section 2-3 for
details concerning the PLOT structure and its elements.
Structure of type PLOT which contains all of the plot
information for generating an DCD+DDJ versus UI plot with the
DCD+DDJ High Pass Filter enabled. This plot is only valid in
Pattern Marker Mode and dDdjtHpf is a non-negative number. (For
a discussion on the High Pass Filter Function for DCD+DDJ
data, see dDdjtHpf above.) When dDdjtHpf is enabled, the dDdjt
value is calculated based on applying the dDdjtHpf filter. See
Section 2-3 for details concerning the PLOT structure and its
elements.
Structure of type PLOT \which contains all of the plot
information for generating an DCD+DDJ versus UI plot with the
DCD+DDJ Low Pass Filter enabled. This plot is only valid in
Pattern Marker Mode and dDdjtLpf is a non-negative number. (For
a discussion on the Low Pass Filter Function for DCD+DDJ data,
see dDdjtLpf above.) See Section 2-3 for details concerning the
PLOT structure and its elements.
Structure of type PLOT which contains all of the plot
information for generating a Bathtub curve. See Section 2-3
for details concerning the PLOT structure and its elements.
Structure of type PLOT which contains all of the plot
information for generating an Bathtub curve based on Effective
Jitter if lFndEftv is set and a valid fit is obtained. (For a
detailed description of Effective Jitter, see lFndEftv above.)
See Section 2-3 for details concerning the PLOT structure and
its elements.
Structure of type PLOT which contains all of the plot
information for generating an 1-Sigma versus UI plot. (x-axis
can be converted to time from UI based on dBitRate value.) This
plot describes the standard deviation for each accumulated
time sample. See Section 2-3 for details concerning the PLOT
structure and its elements.
Structure of type PLOT which contains all of the plot
information for generating a Jitter versus Frequency plot. See
Section 2-3 for details concerning the PLOT structure and its
elements.
The following parameters are for internal use only. They are presented for reference only. Do not try
to read the values or parse the structures nor try to write the various locations.
28
Section 2 – Measurement Commands and Structures
©WAVECREST Corporation 2005
dWndFact, lMaxStop, lPtnRoll, lAdjustPW These values are for internal use only,
DO NOT ALTER or try to use.
tDdjtData
Structure which contains the raw DCD+DDJ measurements. This
value is for internal use only, DO NOT ALTER or try to use.
lDdjtRsvd
Used to track memory allocation for tDdjtData structures. This
value is for internal use only, DO NOT ALTER or try to use.
dRjpjData
Raw variance data used for the calculation of RJ and PJ. This
structure is for internal use only, DO NOT ALTER or try to
use.
lRjpjRsvd
Used to track memory allocation for dRjpjData values. This value
is for internal use only, DO NOT ALTER or try to use.
lPeakData
Tracks detected spikes in RJ+PJ data. This value is for
internal use only, DO NOT ALTER or try to use.
lPeakNumb Count of detected spikes, indicates the number of values in
the lPeakData array.
lPeakRsvd
Used to track memory allocation for lPeakData values. This value
is for internal use only, DO NOT ALTER or try to use.
©WAVECREST Corporation 2005
SECTION 2 – Measurement Commands and Structures 29
2-16 ADJACENT CYCLE JITTER TOOL
The Adjacent Cycle Jitter tool is used to capture period deviation information for two adjacent cycles.
This measurement is called out in a few standards as a means to estimate short-term jitter. Although this
metric has limited value in the physical world, it is a required measurement in many PLL test standards.
tPER1
tPER2
tPER1
∆tPER1 = tPER2 - tPER1
tPER2
∆tPER2 = tPER2 - tPER1
tPER1
tPER2
∆tPERn = tPER2 - tPER1
typedef struct
{
/* Input parameters
PARM
tParm;
double dUnitInt;
long
lPassCnt;
long
lErrProb;
*/
long
lTailFit;
long
lForcFit;
long
lMinHits;
long
lFndEftv;
long
lMinEftv;
long
lMaxEftv;
long
lAutoFix;
long
lDutCycl;
/* Output parameters */
long
lGood;
30
dMaxi
dMean
dMini
Histogram of n number
of ∆tPER measurements
/*
/*
/*
/*
/*
/*
/*
/*
/*
/*
/*
/*
/*
Contains acquisition parameters
*/
Unit Interval to assess Total Jitter
*/
Acquisitions so far, set to 0 to reset */
Error probability for Total Jitter
*/
Valid range is ( -1 to -16 )
*/
If non-zero a tail-fit will be tried
*/
If non-zero use the force-fit method
*/
Minimum hits before trying tail-fit
*/
Flag to attempt effective jitter calc */
Min probability for effective fit: -4 */
Max probability for effective fit: -12 */
If true perform a pulsefind as req'd
*/
If non-zero make duty cycle measurement*/
/* Flag indicates valid data in structure */
long
double
double
double
double
lMeasCnt;
dMeasMin;
dMeasMax;
dMeasAvg;
dMeasSig;
/*
/*
/*
/*
/*
Number of hits in measured normal data
Minimum value in measured normal data
Maximum value in measured normal data
Average value of measured normal data
1-Sigma value of measured normal data
long
long
double
double
double
double
lNormCnt;
lPad1;
dNormMin;
dNormMax;
dNormAvg;
dNormSig;
/* Hits in adjacent cycle normal data
*/
/*
/*
/*
/*
*/
*/
*/
*/
Min. in adjacent cycle normal data
Max. in adjacent cycle normal data
Avg. of adjacent cycle normal data
1-Sig of adjacent cycle normal data
Section 2 – Measurement Commands and Structures
*/
*/
*/
*/
*/
©WAVECREST Corporation 2005
long
long
double
double
double
double
lTotlCnt;
lPad2;
dTotlMin;
dTotlMax;
dTotlAvg;
dTotlSig;
/* # of hits in measured accumulated data */
long
long
double
double
double
double
lAcumCnt;
lPad3;
dAcumMin;
dAcumMax;
dAcumAvg;
dAcumSig;
/* Hits in adjacent cycle accumulated data*/
double
double
double
dDutyMax;
dDutyMin;
dDutyAvg;
/* Maximum value of duty cycle measurement*/
/* Minimum value of duty cycle measurement*/
/* Average value of duty cycle measurement*/
long
long
double
double
double
lBinNumb;
/******************************************/
lPad4;
/* These values are all used internally */
dLtSigma[PREVSIGMA];/*
as part of the measurement process
*/
dRtSigma[PREVSIGMA];/*
DO NOT ALTER!
*/
dFreq;
/******************************************/
PLTD
PLTD
PLTD
PLTD
PLTD
TFIT
} ACYC;
tNorm;
tAcum;
tMaxi;
tBath;
tEftv;
tTfit;
tParm
dUnitInt
lPassCnt
lErrProb
/*
/*
/*
/*
/*
/*
/*
/*
/*
/*
/*
/*
/*
/*
Min. in measured accumulated data
Max. in measured accumulated data
Avg. of measured accumulated data
1-Sig of measured accumulated data
Min. in adj. cycle accumulated data
Max. in adj. cycle accumulated data
Avg. of adj. cycle accumulated data
1-Sig of adj. cycle accumulated data
*/
*/
*/
*/
*/
*/
*/
*/
Histogram of prev. adj. cycles
*/
Histogram of all adj. cycles combined */
Histogram of max across all adj. cycles*/
Bathtub curves determined from PDF
*/
Effective Bathtub curves if enabled
*/
Structure containing tail-fit info
*/
A structure of type PARM that contains acquisition parameter.
The PARM is discussed in full detail in Section 2-4.
Unit Interval (UI) in seconds to assess Total Jitter as a
percent of UI. Set this parameter as the metric against which
TJ will be evaluated as a percentage. It is displayed as the
span of the x-axis in a bathtub curve. This parameter is only
used if tail-fit is enabled.
Valid Entries: any number greater than 0 which represents the
time (in secs) of a bit period or unit
interval.
Default:
1e-9
(1ns)
This parameter is a bi-directional structure element that
tracks the number of acquisitions since last reset. This flag
can be read after an execution or set prior to an exectution.
Setting this parameter to 0 essentially resets this register.
A measurement can be performed repeatedly with the same HIST
structure. In this case, data is then accumulated in the tAcum
and tMaxi plot structures. When lPassCnt is set to 0 the tAcum and
tMaxi plot structures are flushed. It will be automatically
incremented by the next measurement.
Valid Entries: any integer greater than or equal to 0
Default:
0
Error probability level for Total Jitter. Total Jitter is
calculated based on the desired Error Probability level. This
value is used in conjunction with the bathtub curve after the
successful completion of a tail-fit in order to project the
value of Total Jitter.
©WAVECREST Corporation 2005
SECTION 2 – Measurement Commands and Structures 31
Valid Entries: -1 to -16
Default:
-12
lTailFit
Flag to indicate whether to perform a TailFit on data in tAcum
data array. If non-zero, a tail-fit will be attempted on the tAcum
data array. The lGood element of the tTfit structure will indicate
if the TailFit was successful. Any positive interger for this
parameter will initiate the TailFit algorithm.
Valid Entries: 0 – disable TailFit
1 – enable TailFit
Default:
0
lForcFit
If non-zero uses the force-fit method. If set to zero, the
measurement will continue to loop until a reasonably accurate
TailFit can be achieved.
Valid Entries: 0 – do not use force fit.
1 – force a fit using lMinHits number of hits.
Default:
0
lMinHits
Minimum hits before attempting a tail-fit in 1000's; the default
is 50. The larger the number the more likely a valid tailfit will
be found.
Valid Entries: any integer ≥ 50
Default:
50
lFndEftv
Flag to indicate that an effective jitter calculation is to be
attempted. This is necessary for those instances in which correlation
to a BERT scan is necessary. In all other practical applications,
this parameter and it’s resultant measurement should be ignored.
Valid Entries: 0 – do not estimate effective jitter values
1 – calculate effective jitter values
Default:
0
lMinEftv, lMaxEftv Defines the range of the bathtub curve that is to be used
to calculate an effective jitter value.
Valid Entries: -1 to –16 with lMinEftv < lMaxEftv
Default:
-4 for MaxEftv and –12 for MinEftv
lAutoFix
Flag indicating whether to perform a pulse-find as required. Setting
this value to any integer greater than zero tells the measurement to
perform a pulse find if needed. The system will know if a
measurement was recently performed and if a pulse find is necessary.
Valid Entries: 0 – No pulsefind prior to measurement
1 – Pulsefind if the measurement mode changed.
Default:
0
lDutCycl
Flag to indicate whether to perform a duty cycle measurement. This
measurement is done using three time measurement markers. It
measures the time elapsed from a rising edge to falling edge to
rising edge. This measurement is performed tParm.SampCnt number of
times.
Valid Entries: 0 – do not perform a Duty Cycle measurement
1 – perform a Duty Cycle measurement.
Default:
0
lGood
Flag indicates valid output data in structure.
lMeasCnt
Number of hits in measured normal data.
dMeasMin
Minimum period measurement as captured from the latest
execution of adjacent cycle jitter measurement.
dMeasMax
Maximum period measurement as captured from the latest
execution of adjacent cycle jitter measurement.
dMeasAvg
Average period measurement as captured from the latest
execution of adjacent cycle jitter measurement.
dMeasSig
Standard deviation (1σ) of period measurements as captured
from the latest execution of the measurement.
32
Section 2 – Measurement Commands and Structures
©WAVECREST Corporation 2005
lNormCnt
dNormMin
dNormMax
dNormAvg
dNormSig
lTotlCnt
dTotlMin
dTotlMax
dTotlAvg
dTotlSig
lAcumCnt
dAcumMin
dAcumMax
dAcumAvg
dAcumSig
tNorm
tAcum
tMaxi
tBath
Number of measurements captured in latest adjacent cycle
jitter execution.
Minimum measured value of adjacent cycle period deviation. This
value indicates the smallest amplitude of period change between
two adjacent periods. This value is most likely a negative number
indicating that the measurement is actually the largest decrease
in period between two adjacent periods.
Maximum measured value of adjacent cycle period deviation. This
value indicates the largest amplitude of period change between
two adjacent periods. This value is most likely a positive value
indicating that this register contains the largest increase in
periods between two adjacent periods. To identify the overall
largest change in periods, compare the absolute value of dNormMin
and dNormMax.
Average value of adjacent cycle period deviation. This value
should be zero indicating that the period amplitude on average is
remaining fixed. If this value is something other than zero, the
period was shifting during the measurement. In most cases, the
period of a clock signal will have instantaneous amplitude
deviations (also known as jitter) but on average, the periods
tend toward the same amplitude.
Standard deviation (1σ) of adjacent cycle jitter measurements as
captured from the latest execution of the measurement.
Number of hits in measured accumulated period measurement data.
This accumulation is of the absolute period measurements and not
the adjacent cycle jitter measurements.
Minimum period measurement found in the accumulated data.
Maximum period measurement found in the accumulated data.
Average period measurement found in the accumulated data.
Standard deviation (1σ)of period measurements found in the
accumulated data.
Number of measurements in adjacent cycle jitter accumulated
data.
Minimum adjacent cycle jitter measurement found in accumulated
data.
Maximum adjacent cycle jitter measurement found in accumulated
data.
Average value of adjacent cycle jitter found in accumulated
data.
Standard deviation (1σ) of accumulated adjacent cycle jitter
data.
Structure of type PLTD containing all of the necessary
information to draw a Histogram of latest adjacent cycle jitter
measurements from most recent execution. See Section 2-3 for
details of the PLTD structure and its elements.
Structure of type PLTD containing all of the necessary
information to draw a Histogram of accumulated data from all
adjacent cycle acquisitions. See Section 2-3 for details of the
PLTD structure and its elements.
Structure of type PLTD containing all of the necessary
information to draw a Histogram with the maximum number of
occurrences of a given measurement in all previous executions of
adjacent cycle jitter. See Section 2-3 for details of the PLTD
structure and its elements.
Structure of type PLTD containing all of the necessary
information to draw a Bathtub curve based on the Probability
Density Function (PDF) of DJ and RJ as measured by the TailFit
©WAVECREST Corporation 2005
SECTION 2 – Measurement Commands and Structures 33
routine (if enabled.) The data in this structure is only valid
when a successful tail-fit has been performed. See Section 2-3
for details of the PLTD structure and its elements.
tEftv
Structure of type PLTD containing all of the necessary
information to draw an Effective Jitter Bathtub curve based on
the amplitude of effective DJ and effective RJ. The data in this
structure is only valid if lFndEftv is set and a valid fit is
obtained. See Section 2-3 for details of the PLTD structure and
its elements.
tTfit
Structure of type TFIT containing all of the TailFit information
(including plot and limits.) This structure is only valid when a
successful tail-fit has been performed. See Section 2-3 for
details of the TFIT structure and its elements.
lBinNumb, dLtSigma, dRtSigma, dFreq Used internally, DO NOT ALTER!
void __stdcall FCNL_DefAcyc ( ACYC *acyc )
This function is used to fill the acyc structure for the Adjacent Cycle Jitter tool with reasonable default values. It is
recommended that this function be called initially even if parameters within the structure are to be adjusted manually,
and may be called repeatedly to reestablish initial conditions; however, this will impact test time.
Before calling this function, zero out the ACYC structure using the standard memset() function to ensure that any
information pertaining to dynamic memory allocation is cleaned out prior to using the structure.
INPUTS
acyc - Pointer to a ACYC structure. Memory needs to be allocated by the caller.
OUTPUTS
None.
void __stdcall FCNL_ClrAcyc ( ACYC *acyc )
This function frees any dynamic memory that may have been allocated during previous data acquisitions and clears
out the acyc structure.
INPUTS
acyc - Pointer to a ACYC structure. Memory needs to be allocated by the caller.
OUTPUTS
None.
EXAMPLE
#define TRUE 1
#define FALSE 0
static ACYC cyc2cyc;
memset ( &cyc2cyc, 0, sizeof ( ACYC ) );
FCNL_DefAcyc (&cyc2cyc);
cyc2cyc.tparm.lChanNum = 1;
cyc2cyc.tparm.lSampCnt = 10,000;
cyc2cyc.lTailFit = TRUE;
cyc2cyc.lMinHits = 50,000;
cyc2cyc.lDutCycl = TRUE;
//declare cyc2cyc to be a structure of
//type ACYC
//clear the memory for cyc2cyc
//set histogram structures to default
//values
//capture waveform on channel 1
//measure 10,000 samples per burst
//indicate TailFit desired
//don’t attempt a TailFit until at least
//50,000 measurements have been
//accuired.
//Measure true duty cycle my measuring
//successive edges.
FCNL_RqstPkt ( ApiDevId, &cyc2cyc, WIND_ACYC ); //execute the measurement.
FCNL_RqstAll ( ApiDevId, & cyc2cyc, WIND_ACYC ); //get plot data
//print the worst case period decrease between two adjacent cycles.
printf(“Maximum Period Decrease in sample is %d\n”,ABS(cyc2cyc.dNormMin));
//print the worst case period increase between two adjacent cycles within the sample.
printf(“Maximum Period Increase in sample is %d\n”,ABS(cyc2cyc.dNormMax));
FCNL_ClrAcyc (&cyc2cyc);
//deallocate the structure
34
Section 2 – Measurement Commands and Structures
©WAVECREST Corporation 2005
2-17 CLOCK ANALYSIS TOOL
This tool combines a few different measurement tools in the SIA-3000. By doing this, a large number of
useful results can be displayed quickly. The lMeas parameter allows you to toggle on or off certain
measurements. The measurement settings provide the best configuration to a variety of users.
This ease of use means that there is less control over individual settings. There may be instances where
there is the need to have more control over a specific measurement. An example would be changing the
trigger delay on the oscilloscope, or measuring a histogram over two periods rather than single period
jitter. Another example would be to find very low frequency jitter below the (clock/1667) low cutoff
frequency of this tool. If you need access to more configuration settings, use one of the individual tools
instead.
typedef struct
{
PARM
tParm;
/*
long
lPass;
/*
long
lPcnt;
/*
long
lHiRFmV;
/*
long
lLoRFmV;
/*
long
lMeas;
/*
long
lInps;
/*
double dAttn[POSS_CHNS];
/*
long
lGood;
/*
long
lPad0;
long
lHistCnt[POSS_CHNS];/*
double dHistMin[POSS_CHNS];/*
double dHistMax[POSS_CHNS];/*
double dHistAvg[POSS_CHNS];/*
double dHistSig[POSS_CHNS];/*
double dPwPl[POSS_CHNS];
/*
double dPwMn[POSS_CHNS];
/*
double dFreq[POSS_CHNS];
/*
double dDuty[POSS_CHNS];
/*
double dPjit[POSS_CHNS];
/*
double dCorn[POSS_CHNS];
/*
Contains acquisition parameters
Acquisitions so far, set to 0 to reset
Amount +/- 50% to calc. rise/fall time
Absolute rise/fall voltage if lPcnt<0
Absolute rise/fall voltage if lPcnt<0
Measure flag, see defines above
Input selection, see defines above
Attenuation factor (dB) - per channel
Flag indicates valid data in structure
*/
*/
*/
*/
*/
*/
*/
*/
*/
Number of hits in accumulated edge data*/
Minimum value in accumulated edge data */
Maximum value in accumulated edge data */
Average value of accumulated edge data */
1-Sigma value of accumulated edge data */
Pulsewidth plus
*/
Pulsewidth minus
*/
Carrier frequency
*/
Duty Cycle
*/
Periodic jitter on N-clk basis
*/
Corner Frequency used for measurement */
long
double
double
double
lBinNumb[POSS_CHNS];/******************************************/
dWndFact[POSS_CHNS];/* These values are all used internally */
dLtSigma[POSS_CHNS][PREVSIGMA];/* DO NOT ALTER!
*/
dRtSigma[POSS_CHNS][PREVSIGMA];/*******************************/
QTYS
QTYS
QTYS
QTYS
TFIT
qNorm[POSS_CHNS];
qComp[POSS_CHNS];
qDiff[POSS_CHNS];
qComm[POSS_CHNS];
tTfit[POSS_CHNS];
long
long
long
PLTD
PLTD
PLTD
PLTD
PLTD
PLTD
PLTD
PLTD
/*
/*
/*
/*
/*
Normal channel quantities
Complimentary channel quantities
Differential quantities
Common (A+B) quantities
Structure containing tailfit info
lPeakNumb[POSS_CHNS];/* Count of detected spikes
lPeakRsvd[POSS_CHNS];/* Used to track memory allocation
*lPeakData[POSS_CHNS];/* Tracks detected spikes in RJ+PJ data
tNorm[POSS_CHNS];
tComp[POSS_CHNS];
tDiff[POSS_CHNS];
tComm[POSS_CHNS];
tHist[POSS_CHNS];
tShrt[POSS_CHNS];
tLong[POSS_CHNS];
tBoth[POSS_CHNS];
©WAVECREST Corporation 2005
/*
/*
/*
/*
/*
/*
/*
/*
Normal channel voltage data
Complimentary channel voltage data
Differential voltage data
Common (A+B) voltage data
Histogram of all acquires combined
Total Jitter for SHORT Cycles
Total Jitter for LONG Cycles
Total Jitter for LONG & SHORT Cycles
*/
*/
*/
*/
*/
*/
*/
*/
*/
*/
*/
*/
*/
*/
*/
*/
SECTION 2 – Measurement Commands and Structures 35
PLTD
tFftN[POSS_CHNS];
PLTD
tSave[POSS_CHNS];
} CANL;
/* Frequency plot data on 1-clock basis
/* Average Frequency plot before scaling
*/
*/
tParm
A structure of type PARM that contains acquisition parameter.
The PARM is discussed in full detail in Section 2-4.
lPassCnt
This parameter is a bi-directional structure element that
tracks the number of acquisitions since last reset. This flag
can be read after an execution or set prior to an execution.
Setting this parameter to 0 essentially resets this register.
It will be automatically incremented when a measurement is
performed.
Valid Entries: any integer greater than or equal to 0
Default:
0
lPcnt
This field specifies the voltage thresholds to be used when
calculating rise and fall times. The voltage thresholds are
assumed to be symmetrical about the 50% threshold, and this is
the distance from the 50% threshold to the starting and ending
thresholds. For example if this field is equal to 30, then 20%
and 80% thresholds are used. If this field is equal to 40,
then 10% and 90% thresholds are used. The absolute voltage
levels used are based on the previous pulsefind minimum and
maximum voltages. If this field is negative, then the absolute
rise and fall thresholds are taken from the following fields
lHiRFmV and lLoRFmv.
Default:
30
lHiRFmV
Absolute rise/fall voltage if lPcnt<0, in units of mV
Default:
+250
lLoRFmV
Absolute rise/fall voltage if lPcnt<0, in units of mV
Default:
-250
lMeas
Measure flag, this is a bitfield which may be created by
combining any or all of the following constants:
CANL_MEAS_RISEFALL – Rise and Fall times are calculated
CANL_MEAS_VTYPICAL – Vtop and Vbase are calculated
CANL_MEAS_VEXTREME – Vmin and Vmax are calculated
CANL_MEAS_OVERUNDR – Overshoot and Undershoot are calculated
CANL_MEAS_WAVEMATH – Vavg and Vrms are calculated
CANL_MEAS_TAILFITS – Enables Histogram tailfits
CANL_MEAS_PERIODIC – Yields Hi-Freq Mod. results
Default:
All of the above are included
dAttn[n]
Attenuation factor in dB, this is provided to allow the
results to be scaled to compensate for external attenuation
from sources such as probes.
Default:
0
lGood
Flag indicates valid data in structure
lHistCnt[n]
Number of hits in accumulated edge data, per channel
dHistMin[n] Minimum value in accumulated edge data, per channel
dHistMax[n] Maximum value in accumulated edge data, per channel
dHistAvg[n] Average value of accumulated edge data, per channel
dHistSig[n] 1-Sigma value of accumulated edge data, per channel
dPwPl[n]
Pulsewidth plus, per channel
dPwMn[n]
Pulsewidth minus, per channel
dFreq[n]
Carrier frequency, per channel
dDuty[n]
Duty Cycle, per channel
dPjit[n]
Periodic jitter on N-clk basis, per channel
dCorn[n]
Corner Frequency used for measurement, per channel
lBinNumb[n],dWndFact[n],dLtSigma[n][m],dRtSigma[n][m] These values are for
internal use only, DO NOT ALTER or try to use.
36
Section 2 – Measurement Commands and Structures
©WAVECREST Corporation 2005
qNorm[n] + Input channel quantities, per channel
qComp[n] - Input channel quantities, per channel
qDiff[n] Differential quantities, per channel
qComm[n]Common (A+B) quantities, per channel
tTfit[n]
Structure containing tailfit info, per channel
lPeakNumb[n] Count of detected spikes, per channel
lPeakRsvd[n]
Used to track memory allocation, per channel
lPeakData[n]
Tracks detected spikes in RJ+PJ data, per channel
tNorm[n] Normal channel voltage data, per channel
tComp[n] Complimentary channel voltage data, per channel
tDiff[n]
Differential voltage data, per channel
tComm[n] Common (A+B) voltage data, per channel
tHist[n] Histogram of all acquires combined, per channel
tShrt[n] Total Jitter for SHORT Cycles, per channel
tLong[n] Total Jitter forCycles, per channel
tBoth[n] Total Jitter for& SHORT Cycles, per channel
tFftN[n] Frequency data on 1-clock basis, per channel
tSave[n] Average Frequency before scaling, per channel
void __stdcall FCNL_DefCanl ( CANL *canl )
This function is used to fill the canl structure for the Clock Analysis tool with reasonable default values. It is
recommended that this function be called initially even if parameters within the structure are to be adjusted manually,
and may be called repeatedly to reestablish initial conditions; however, this will impact test time.
Before calling this function, zero out the CANL structure using the standard memset() function to ensure that any
information pertaining to dynamic memory allocation is cleaned out prior to using the structure.
INPUTS
canl - Pointer to a CANL structure. Memory needs to be allocated by the caller.
OUTPUTS
None.
void __stdcall FCNL_ClrCanl ( CANL *canl )
This function frees any dynamic memory that may have been allocated during previous data acquisitions and clears
out the canl structure.
INPUTS
canl - Pointer to a CANL structure. Memory needs to be allocated by the caller.
OUTPUTS
None.
EXAMPLE
static CANL clk;
memset ( &clk, 0, sizeof ( CANL ) );
FCNL_DefCanl ( &clk);
//declare clk to a structure of type
//CANL
//clear the memory for clk structure
//set clk structures to default values
FCNL_RqstPkt ( ApiDevId, &clk, WIND_CANL );
FCNL_RqstAll ( ApiDevId, &clk, WIND_CANL );
//execute the measurement.
//get plot data
FCNL_ClrCanl ( &clk);
//deallocate the structure
©WAVECREST Corporation 2005
SECTION 2 – Measurement Commands and Structures 37
2-18 CLOCK STATISTICS TOOL
The Statistics panel displays the results of several basic clock parameters: mean, minimum,
maximum, 1-sigma, peak-to-peak, hits, frequency and duty cycle. Also displayed are the measured
Vstart, Vstop as well as the Vp-p, Vmax and Vmin of the input channels.
The Statistics panel provides a summary of the statistics from a single histogram of measurements of
the chosen function (period, rise-time, fall-time, positive pulse width and negative pulse width). The
tool reports the clock frequency with 9 digits of precision. Duty cycle is displayed in this tool.
typedef struct
{
/* Input parameters */
PARM
tParm;
long
lPfnd;
long
lQckMeas;
/* Output parameters */
long
lGood;
long
lPad1;
double dPwPavg;
double dPwPdev;
double dPwPmin;
double dPwPmax;
double dPwMavg;
double dPwMdev;
double dPwMmin;
double dPwMmax;
double dPerPavg;
double dPerPdev;
double dPerPmin;
double dPerPmax;
double dPerMavg;
double dPerMdev;
double dPerMmin;
double dPerMmax;
double
double
double
double
} CLOK;
tParm
lPfnd
lQckMeas
lGood
dPwPavg
dPwPdev
dPwPmin
dPwPmax
dPwMavg
dPwMdev
dPwMmin
dPwMmax
dPerPavg
38
dDuty;
dFreq;
dVmin;
dVmax;
/* Contains acquisition parameters
*/
/* Force a pulse-find before each measure */
/* If true skip frequency and voltages
*/
/* Flag indicates valid data in structure */
/*
/*
/*
/*
/*
/*
/*
/*
/*
/*
/*
/*
/*
/*
/*
/*
Contains
Contains
Contains
Contains
Contains
Contains
Contains
Contains
Contains
Contains
Contains
Contains
Contains
Contains
Contains
Contains
the
the
the
the
the
the
the
the
the
the
the
the
the
the
the
the
PW+ average value
PW+ 1-Sigma value
PW+ minimum value
PW+ maximum value
PW- average value
PW- 1-Sigma value
PW- minimum value
PW- maximum value
PER+ average value
PER+ 1-Sigma value
PER+ minimum value
PER+ maximum value
PER- average value
PER- 1-Sigma value
PER- minimum value
PER- maximum value
/*
/*
/*
/*
Contains the returned duty cycle
Contains the carrier frequency
Pulse-find Min voltage
Pulse-find Max voltage
*/
*/
*/
*/
*/
*/
*/
*/
*/
*/
*/
*/
*/
*/
*/
*/
*/
*/
*/
*/
A structure of type PARM that contains acquisition parameter.
The PARM is discussed in full detail in Section 2-4.
If true force a pulse-find before each measure
If true skip frequency and voltages
Flag indicates valid output data in structure.
Contains the PW+ average value
Contains the PW+ 1-Sigma value
Contains the PW+ minimum value
Contains the PW+ maximum value
Contains the PW- average value
Contains the PW- 1-Sigma value
Contains the PW- minimum value
Contains the PW- maximum value
Contains the PER+ average value
Section 2 – Measurement Commands and Structures
©WAVECREST Corporation 2005
dPerPdev
dPerPmin
dPerPmax
dPerMavg
dPerMdev
dPerMmin
dPerMmax
dDuty
dFreq
dVmin
dVmax
Contains the PER+ 1-Sigma value
Contains the PER+ minimum value
Contains the PER+ maximum value
Contains the PER- average value
Contains the PER- 1-Sigma value
Contains the PER- minimum value
Contains the PER- maximum value
Contains the returned duty cycle
Contains the carrier frequency
Pulse-find Min voltage
Pulse-find Max voltage
void __stdcall FCNL_DefClok ( CLOK *clok )
This function is used to fill the clok structure for the Clock Statistics tool with reasonable default values. It is
recommended that this function be called initially even if parameters within the structure are to be adjusted manually,
and may be called repeatedly to reestablish initial conditions; however, this will impact test time.
Before calling this function, zero out the CLOK structure using the standard memset() function to ensure that any
information pertaining to dynamic memory allocation is cleaned out prior to using the structure.
INPUTS
clok - Pointer to a CLOK structure. Memory needs to be allocated by the caller.
OUTPUTS
None.
void __stdcall FCNL_ClrClok ( CLOK *clok )
This function frees any dynamic memory that may have been allocated during previous data acquisitions and clears
out the clok structure.
INPUTS
clok - Pointer to a CLOK structure. Memory needs to be allocated by the caller.
OUTPUTS
None.
EXAMPLE
static CLOK clkstat;
memset ( &clkstat, 0, sizeof ( CLOK ) );
FCNL_DefClok ( &clkstat);
//declare clkstat to a structure of type
//CLOK
//clear the memory for clkstat structure
//set clkstat structures to default values
FCNL_RqstPkt ( ApiDevId, &clkstat, WIND_CLOK );
FCNL_RqstAll ( ApiDevId, &clkstat, WIND_CLOK );
//execute the measurement.
//get plot data
FCNL_ClrClok ( &clkstat);
//deallocate the structure
©WAVECREST Corporation 2005
SECTION 2 – Measurement Commands and Structures 39
2-19 DATABUS TOOL
With the SIA-3000 Signal Integrity Analyzer and GigaView Databus software, single-ended and
differential clock and data signals can be characterized for timing, clock and data jitter, clock-to-data
skew, channel-to-channel skew and Bit Error Rate (BER) on up to ten channels in parallel. The analysis
is done using one reference clock and up to nine data channels. Users can input the setup and hold
specifications. Setup and Hold violations can be measured based on the actual mean of the data
histogram referenced to the clock edge.
For each data lane there are two histograms: one showing the transitions before the clock edge and one
showing the transitions after the clock edge. The tool also applies statistical long term BER in the form
of a bathtub curve. This measurement is used to determine long-term system reliability. If the jitter is too
high, the tool will indicate a failure.
The following example shows the Data signal connected to Channel 1 and Bit Clock Signal connected to
Channel 2. Therefore, two histograms can be made. One histogram represents a measurement of Data
RISING edges to clock reference edge, the other represents Data FALLING edges to the clock reference
edge.
These histograms would show many modes or distributions because there are many possible
relationships between clock and data edges. These histograms are filtered to show only those times that
relate to the measured Data edges closest in time to the Reference Clock Edge.
typedef struct
{
/* Input parameters */
long
lClokChn;
/*
long
lChanNum;
/*
double dSetTime;
/*
double dHldTime;
/*
double dEyeSpec;
/*
double dUserVlt[POSS_CHNS];/*
EYEH
tDbus;
/*
/* Output parameters */
40
Reference Clock channel
*/
Bitfield indicating channels to measure*/
Setup time to assess PASS/FAIL
*/
Hold time to assess PASS/FAIL
*/
Eye opening size to assess PASS/FAIL
*/
Array of user voltages
*/
Contains acquisition parameters
*/
Section 2 – Measurement Commands and Structures
©WAVECREST Corporation 2005
long
long
double
HIST
EYEH
lGood;
lPad1;
dDutCycl;
tHist;
tEyeh[POSS_CHNS];
long
long
long
lTypclSetHldPF;
lEyeOpenSpecPF;
lWorstSetHldPF;
long
lTypclSetHldAll;
long
lEyeOpenSpecAll;
long
lWorstSetHldAll;
} DBUS;
/* Flag indicates valid data in structure */
/*
/*
/*
/*
/*
/*
/*
/*
/*
/*
/*
/*
/*
Duty cycle measurement of clock signal */
Contains output data for clock channel */
Contains output data for enabled chans */
The following are bitfields indicating */
PASS/FAIL [0/1] for each channel
*/
Means of histograms to setup/hold time */
Eye opening spec (jitter only)
*/
Histogram means w/jitter to setup/hold */
The following indicate PASS only if all*/
selected channels PASS [Pass=1;Fail=0] */
Means of histograms to setup/hold time */
Eye opening spec (jitter only)
*/
Histogram means w/jitter to setup/hold */
lClokChn
Reference Clock channel
Default:
2
lChanNum
Bitfield indicating channels to measure
Default:
1
dSetTime
Setup time to assess PASS/FAIL
Default:
5e-10
dHldTime
Hold time to assess PASS/FAIL
Default:
5e-10
dEyeSpec
Eye opening size to assess PASS/FAIL, in UI
Default:
0.6
dUserVlt[n] Array of user voltages
Default:
0.0
tDbus
This is the same structure as is defined in the Random Data
With Bitclock tool. It contains all the acquisition parameters
that are used for the measurement, with the exception of those
defined directly above.
Default:
See Random Data With Bitclock Tool
lGood
Flag indicates valid data in structure
dDutCycl
Duty cycle measurement of clock signal
tHist
This is the same structure as is defined for the Histogram
Tool. It contains all the output data for the clock channel.
tEyeh[n]
This is an array of the same structures as are defined in the
Random Data With Bitclock tool. It contains all the output
data for each of the channels which a measurement is performed
on.
lTypclSetHldPF Means of histograms to setup/hold time, this is a bitfield
indicating PASS/FAIL [0/1] for each channel
lEyeOpenSpecPF Eye opening spec, this is a bitfield
indicating PASS/FAIL [0/1] for each channel
lWorstSetHldPF Histogram means w/jitter to setup/hold, this is a bitfield
indicating PASS/FAIL [0/1] for each channel
lTypclSetHldAll Means of histograms to setup/hold time, this is a bitfield
indicating PASS/FAIL [0/1] for each channel
lEyeOpenSpecAll Eye opening spec (jitter only) , this is a bitfield
indicating PASS/FAIL [0/1] for each channel
lWorstSetHldAll Histogram means w/jitter to setup/hold, this is a bitfield
indicating PASS/FAIL [0/1] for each channel
©WAVECREST Corporation 2005
SECTION 2 – Measurement Commands and Structures 41
void __stdcall FCNL_DefDbus ( DBUS *dbus )
This function is used to fill the dbus structure for the DataBus tool with reasonable default values. It is
recommended that this function be called initially even if parameters within the structure are to be adjusted
manually, and may be called repeatedly to reestablish initial conditions; however, this will impact test time.
Before calling this function, zero out the DBUS structure using the standard memset() function to ensure that any
information pertaining to dynamic memory allocation is cleaned out prior to using the structure.
INPUTS
dbus - Pointer to a DBUS structure. Memory needs to be allocated by the caller.
OUTPUTS
None.
void __stdcall FCNL_ClrDbus ( DBUS *dbus )
This function frees any dynamic memory that may have been allocated during previous data acquisitions and clears
out the dbus structure.
INPUTS
dbus - Pointer to a DBUS structure. Memory needs to be allocated by the caller.
OUTPUTS
None.
EXAMPLE
static DBUS databus;
42
memset ( &databus, 0, sizeof ( DBUS ) );
FCNL_DefDbus ( &databus);
//declare clkstat to a structure of type
//DBUS
//clear the memory for databus structure
//set databus structures to default values
FCNL_RqstPkt ( ApiDevId, &databus, WIND_DBUS );
FCNL_RqstAll ( ApiDevId, &databus, WIND_DBUS );
//execute the measurement.
//get plot data in tEyeh[n]
FCNL_ClrDbus ( &databus);
//deallocate the structure
Section 2 – Measurement Commands and Structures
©WAVECREST Corporation 2005
2-20 DATACOM BIT CLOCK AND MARKER TOOL
This tool can operate either with the Clock Recovery option installed or with an external bit clock applied
to another input. A pattern marker is necessary and is possibly derived from the data pattern generator.
But, in many cases, this signal is not externally available and it is useful to have the SIA-3000 Pattern
Marker (PM50) option. The pattern requirements are such that it needs to be a repeating pattern.
typedef struct
{
PARM
tParm;
char
sPtnName[ 128 ];
long
lPassCnt;
long
lHeadOff;
long
lFftMode;
long
lMinHits;
long
lTailFit;
long
lErrProb;
/*
/*
/*
/*
/*
/*
/*
/*
/*
/*
/*
/*
/*
Contains acquisition parameters
Name of pattern file to be used
Acquisitions so far, set to 0 to reset
Header offset, external arming only
0=NoFFT, 1=Fc/1667, 2=Use dCornFrq
Minimum hits before trying tail-fit
If non-zero a tail-fit will be tried
Error probability for Total Jitter
Valid range is ( -1 to -16 )
Bit Rate, may be specified or measured
Corner Frequency for RJ+PJ
LIM_ERROR if this std. error exceeded
Flag indicates valid data in structure
*/
*/
*/
*/
*/
*/
*/
*/
*/
*/
*/
*/
*/
double
double
double
long
dBitRate;
dCornFrq;
dMaxSerr;
lGood;
long
long
long
long
long
long
long
double
double
double
double
lBinNumb;
/******************************************/
lMaxStop;
/*
*/
lPtnRoll;
/*
*/
lFallAdj;
/* These values are all used internally */
lClokAdj;
/*
as part of the measurement process
*/
lLeftCnt;
/*
DO NOT ALTER!
*/
lRghtCnt;
/*
*/
dWndFact;
/*
*/
dDdjMove;
/*
*/
dLtSigma[PREVSIGMA];/*
*/
dRtSigma[PREVSIGMA];/******************************************/
double
double
double
long
long
TFIT
dHistMed;
dLeftMed;
dRghtMed;
lAcumHit;
lPassHit;
tTfit;
/*
/*
/*
/*
/*
/*
Total Jitter Histogram median location
Left Edge Histogram median location
Right Edge Histogram median location
Accumulated Histogram hits
Histogram hits for this pass only
Structure containing tail-fit info
*/
*/
*/
*/
*/
*/
tPatn;
lPeakNumb;
lPeakRsvd;
*lPeakData;
lDdjtRsvd;
*tDdjtData;
lPad1;
/*
/*
/*
/*
/*
/*
Internal representation of pattern
Count of detected spikes
Used to track memory allocation
Tracks detected spikes in RJ+PJ data
Used to track memory allocation
Raw DCD+DDJ measurements
*/
*/
*/
*/
*/
*/
/*
/*
/*
/*
/*
/*
/*
/*
/*
DCD+DDJ histogram of rising edges
DCD+DDJ histogram of falling edges
DCD+DDJvsUI for external arming only
Histogram of all acquires combined
Leftmost Histogram
Rightmost Histogram
Bathtub curves determined from PDF
1-Sigma vs. span plot
Jitter vs. frequency plot
*/
*/
*/
*/
*/
*/
*/
*/
*/
PATN
long
long
long
long
DDJT
long
PLTD
PLTD
PLTD
PLTD
PLTD
PLTD
PLTD
PLTD
PLTD
} RCPM;
tRiseHist;
tFallHist;
tNormDdjt;
tTotlHist;
tLeftHist;
tRghtHist;
tBathPlot;
tSigmPlot;
tFreqPlot;
©WAVECREST Corporation 2005
SECTION 2 – Measurement Commands and Structures 43
tParm
A structure of type PARM that contains acquisition parameters.
The PARM structure is discussed in full detail in Section 2-4.
sPtnName
A character array containing the name of pattern file to be
used, the file must exist in the pattern directory (C:\VISI\)
on the SIA3000 or else an error will be returned. The first
time a measurement is performed the pattern is loaded into
structure tPatn.
Valid Entries: a valid file name (including extension)
Default:
“k285.ptn”
lPassCnt
This parameter is a bi-directional structure element that tracks
the number of acquisitions since last reset. This flag can be
read after an execution or set prior to an execution. Setting
this parameter to 0 essentially resets this register. It will be
automatically incremented when a measurement is performed.
Valid Entries: any integer greater than or equal to 0
Default:
0
lHeadOff
Header offset parameter, for use in packet-ized data which may
have a frame header before the test pattern. This offset value
can be used to skip past header information and into the
repeating data pattern stream. This can be useful when
analyzing data from disk drives when the pattern marker may be
synchronized with the start of frame data.
Valid Entries: 0 to 10,000,000-pattern length
I
Default:
0 (indicating no header present)
lFftMode
0=NoFFT, 1=Fc/1667, 2=Use dCornFrq
Default:
0
lMinHits
Minimum hits before trying tail-fit
Default:
0
lTailFit
If non-zero a tail-fit will be tried
Default:
1
lErrProb
Error probability level for Total Jitter. Total Jitter is
calculated based on the desired Error Probability level. This
value is used in conjunction with the bathtub curve after the
successful completion of a tail-fit in order to project the
value of Total Jitter.
Valid Entries: -1 to -16
Default:
-12
dBitRate
Bit Rate, may be specified or measured
Default:
2.5e9
dCornFrq
Corner Frequency for RJ & PJ estimate in Hertz. This value is
used in conjunction with the Bit Rate and pattern to determine
the maximum stop count to be used to acquire RJ & PJ data. A
lower value increase acquisition time.
Valid Entries: Bit-Rate /10,000,000 to Bit-Rate
I
Default:
637e3 (637kHz – Fibre Channel 1X)
dMaxSerr
An error is returned if this std. error is exceeded
Default:
0.5
lGood
Flag indicates valid data in structure
lBinNumb,lMaxStop,lPtnRoll,lFallAdj,lClokAdj,lLeftCnt,lRghtCnt
dWndFact,dDdjMove,dLtSigma[n],dRtSigma[n] These values are for internal use
only, DO NOT ALTER or try to use.
dHistMed
Total Jitter Histogram median location
dLeftMed
Left Edge Histogram median location
dRghtMed
Right Edge Histogram median location
lAcumHit
Accumulated Histogram hits
lPassHit
Histogram hits for this pass only
44
Section 2 – Measurement Commands and Structures
©WAVECREST Corporation 2005
tTfit
tPatn
lPeakNumb
lPeakRsvd
lPeakData
lDdjtRsvd
tDdjtData
tRiseHist
tFallHist
tNormDdjt
tTotlHist
tLeftHist
tRghtHist
tBathPlot
tSigmPlot
tFreqPlot
Structure containing tail-fit info
Internal representation of pattern
Count of detected spikes
Used to track memory allocation
Tracks detected spikes in RJ+PJ data
Used to track memory allocation
Raw DCD+DDJ measurements
DCD+DDJ histogram of rising edges
DCD+DDJ histogram of falling edges
DCD+DDJvsUI for external arming only
Histogram of all acquires combined
Leftmost Histogram
Rightmost Histogram
Bathtub curves determined from PDF
1-Sigma vs. span plot
Jitter vs. frequency plot
void __stdcall FCNL_DefRcpm ( RCPM *rcpm )
This function is used to fill the rcpm structure for the Datacom Bit Clock and Marker tool with reasonable default
values. It is recommended that this function be called initially even if parameters within the structure are to be
adjusted manually, and may be called repeatedly to reestablish initial conditions; however, this will impact test time.
Before calling this function, zero out the RCPM structure using the standard memset() function to ensure that any
information pertaining to dynamic memory allocation is cleaned out prior to using the structure.
INPUTS
rcpm - Pointer to a RCPM structure. Memory needs to be allocated by the caller.
OUTPUTS
None.
void __stdcall FCNL_ClrRcpm ( RCPM *rcpm )
This function frees any dynamic memory that may have been allocated during previous data acquisitions and clears
out the rcpm structure.
INPUTS
rcpm - Pointer to a RCPM structure. Memory needs to be allocated by the caller.
OUTPUTS
None.
EXAMPLE
static RCPM bcam;
memset ( &bcam, 0, sizeof ( RCPM ) );
FCNL_DefRcpm ( &bcam);
//declare bcam to a structure of type
//RCPM
//clear the memory for bcam structure
//set bcam structures to default values
FCNL_RqstPkt ( ApiDevId, &bcam, WIND_RCPM );
FCNL_RqstAll ( ApiDevId, &bcam, WIND_RCPM );
//execute the measurement.
//get plot data
FCNL_ClrRcpm ( &bcam);
//deallocate the structure
©WAVECREST Corporation 2005
SECTION 2 – Measurement Commands and Structures 45
2-21 DATACOM KNOWN PATTERN WITH MARKER TOOL
The Datacom Known Pattern With Marker Tool is used to measure jitter on serial communication
signals. This tool is not protocol specific and works with all communication standards that rely on
jitter separation to define jitter limits for compliance. Such standards include: Fibre Channel,
Gigabit Ethernet, the XAUI layer of 10G Ethernet, SFI 4, SFI 5, XFP, RapidIO, PCI Express and
Serial ATA. This tool requires that a pattern trigger be available either externally from the test
environment or internally from the PM50. Measurements are made based on this diagram. Each
measurement is from the first edge after the pattern trigger to each subsequent edge in the pattern.
DDJ is based on edges 1 through n, where n is the last edge in the pattern. PJ and RJ estimates are
based on edges 1 through m where m is last edge measured based on the prescribed cutoff frequency.
Pattern Trigger
Data Signal
Edge 1
Edge 2
Edge 3
Edge n
Edge m
typedef struct
{
/* Input parameters */
PARM
tParm;
char
sPtnName[ 128 ];
long
lAcqMode;
46
long
long
long
long
lRndMode;
lQckMode;
lIntMode;
lGetRate;
long
lTailFit;
long
lErrProb;
long
long
long
lPassCnt;
lFftAvgs;
lFitPcnt;
/*
/*
/*
/*
/*
/*
/*
/*
/*
/*
/*
/*
/*
/*
/*
/*
Contains acquisition parameters
Name of pattern file to be used
Mask defining modes for RJ+PJ acquire
Bit3:PW- Bit2:PW+ Bit1:Per- Bit0:Per+
Enable random mode, auto-arming only
Enable quick mode, external arm only
Interpolation mode, non-zero is linear
If non-zero Bit Rate will be measured
Not valid for random mode
Count of tailfits, see constants above
Not valid when auto-arming
Error probability for Total Jitter
Valid range is ( -1 to -16 )
Acquisitions so far, set to 0 to reset
2^fft_avgs averages used to smooth FFT
Automode suceed %, see constants above
SPEC
SPEC
SPEC
tRateInf;
tDdjtInf;
tRjpjInf;
/* Parameters to acquire Bit Rate
/* Parameters to acquire DCD+DDJ
/* Parameters to acquire RJ+PJ
*/
*/
*/
double
double
double
double
dDdjtLpf;
dDdjtHpf;
dRjpjFmn;
dRjpjFmx;
/*
/*
/*
/*
/*
*/
*/
*/
*/
*/
double
double
long
dBitRate;
dCornFrq;
lHeadOff;
/* Bit Rate, may be specified or measured */
/* Corner Frequency for RJ+PJ
*/
/* Header offset, external arming only
*/
long
long
long
lFndEftv;
lMinEftv;
lMaxEftv;
/* Flag to attempt effective jitter calc */
/* Min probability for effective fit: -4 */
/* Max probability for effective fit: -12 */
Negative values disable these filters
Low pass DCD+DDJ filter frequency
High pass DCD+DDJ filter frequency
Minimum integration limit for RJ+PJ
Maximum integration limit for RJ+PJ
Section 2 – Measurement Commands and Structures
*/
*/
*/
*/
*/
*/
*/
*/
*/
*/
*/
*/
*/
*/
*/
*/
©WAVECREST Corporation 2005
long
lFiltEnb;
long
lQckTjit;
long
lTfitCnt;
/* Output parameters */
long
lGood;
PATN
tPatn;
/* Enable IDLE character insertion filter */
/* Fast total jitter calc - no bathtubs! */
/* Sample count per pass when tailfitting */
double
long
long
long
long
long
/******************************************/
/* These values are all used internally */
/*
*/
/*
DO NOT ALTER!
*/
/*
*/
/******************************************/
DDJT
long
double
long
double
long
double
long
long
long
long
double
long
double
long
dWndFact;
lMaxStop;
lCmpMode;
lPosRoll;
lNegRoll;
lAdjustPW[ 2 ];
*tDdjtData;
lDdjtRsvd;
*dMeasData[
lMeasRsvd[
*dRjpjData[
lRjpjRsvd[
*dTfitData[
lTfitRsvd[
*lPeakData[
lPeakNumb[
lPeakRsvd[
*dFreqData[
lFreqRsvd[
*dTailData[
lTailRsvd[
2
2
4
4
4
4
4
4
4
4
4
4
4
long
long
double
double
double
double
double
double
double
double
double
lHits;
lPad2;
dDdjt;
dRang;
dRjit[ 4 ];
dPjit[ 4 ];
dTjit[ 4 ];
dEftvLtDj[ 4
dEftvLtRj[ 4
dEftvRtDj[ 4
dEftvRtRj[ 4
PLTD
PLTD
PLTD
PLTD
PLTD
PLTD
PLTD
PLTD
PLTD
PLTD
PLTD
PLTD
PLTD
} DCOM;
tRiseHist;
tFallHist;
tRiseMeas;
tFallMeas;
tNormDdjt;
tHipfDdjt;
tLopfDdjt;
tBathPlot[
tEftvPlot[
tSigmNorm[
tSigmTail[
tFreqNorm[
tFreqTail[
©WAVECREST Corporation 2005
4
4
4
4
4
4
];
];
];
];
];
];
];
];
];
];
];
];
];
/* Flag indicates valid data in structure */
/* Internal representation of pattern
*/
/*
/*
/*
/*
/*
/*
/*
/*
/*
/*
/*
/*
/*
/*
/*
Raw DCD+DDJ measurements
Used to track memory allocation
Raw allmeas histogram when auto-arming
Used to track memory allocation
Raw variance data
Used to track memory allocation
Raw tail-fit data if used
Used to track memory allocation
Tracks detected spikes in RJ+PJ data
Count of detected spikes
Used to track memory allocation
Raw FFT output when averaging
Used to track memory allocation
Raw tailfit FFT output when averaging
Used to track memory allocation
/* Total samples for DDJT+RJ+PJ combined
];
];
];
];
];
];
];
];
];
];
*/
*/
*/
*/
*/
*/
*/
*/
*/
*/
*/
*/
*/
*/
*/
*/
/*
/*
/*
/*
/*
/*
DCD+DDJ jitter
*/
Pk-Pk of allmeas histogram for auto-arm*/
Random jitter, for enabled modes
*/
Periodic jitter, for enabled modes
*/
Total jitter, for enabled modes
*/
Effective jitter when enabled
*/
/*
/*
/*
/*
/*
/*
/*
/*
/*
/*
/*
/*
/*
DCD+DDJ histogram of rising edges
DCD+DDJ histogram of falling edges
Rising allmeas histo. auto-arm only
Falling allmeas histo. auto-arm only
DCD+DDJvsUI for external arming only
High Pass Filtered DCD+DDJvsUI
Low Pass filtered DCD+DDJvsUI
Bathtub plots, for enabled modes
Effective Bathtub plots, if enabled
1-Sigma plots, for enabled modes
1-Sigma tail-fits, for enabled modes
Frequency plots, for enabled modes
Tail-fit FFT plots, for enabled modes
*/
*/
*/
*/
*/
*/
*/
*/
*/
*/
*/
*/
*/
SECTION 2 – Measurement Commands and Structures 47
tParm
sPtnName
lAcqMode
lRndMode
lQckMode
lIntMode
48
A structure of type PARM that contains acquisition parameters.
The PARM structure is discussed in full detail in Section 2-4.
A character array containing the name of pattern file to be
used, the file must exist in the pattern directory (C:\VISI\)
on the SIA3000 or else an error will be returned. The first
time a measurement is performed the pattern is loaded into
structure tPatn.
Valid Entries: a valid file name (including extension)
Default:
“k285.ptn”
Measurement mode for Random Jitter (RJ) and Periodic Jitter
(PJ) estimate. To calculate RJ and PJ, variance data for each
transition must be captured. This variance data is then passed
through an FFT to create the frequency response. Since rise
time and fall time may be asymmetrical, bogus frequency
components could be inserted into the RJ & PJ records if both
rising and falling edges were used in the data records. Since
the frequency response will be calculated based on the
records, the slew rate effect must be eliminated from the
data. To do this, we force the measurement to either capture
only rising edges or falling edges for this data record. For
completeness, the start of the measurement could be either a
rising or a falling edge. This parameter allows the user to
select the polarity of both the reference edge and the
measured edge in the data signal. The user can select all
permutations of rising and falling edges. This parameter is
parsed as a 4-bit binary value with each bit representing a
possible permutation. A value of b1111 would indicate that the
measurement is to be run using all permutations.
Valid Entries: b0001 – rising edge to rising edge
b0010 – falling edge to falling edge
b0100 – rising edge to falling edge
b1000 – falling edge to rising edge
Default:
b0001 – rising edge to rising edge
Parameter used to enable Random Mode. This parameter is only used
in conjunction with RAND structures as used in the Random Data
Tool. This parameter enables random mode, valid when auto-arming
only. Setting this parameter to 1 will enable Random Mode.
Valid Entries: 0 – disable random data mode
1 – enable random data mode
Default:
0
Parameter used to enable Quick Mode. QuickMode uses a sparse
sample of data points for the PJ and RJ estimates. In this
mode, the accuracy of these estimates is greatly reduced
depending on the application. Setting this structure element
to 1 enables quick mode, valid with external arm only.
Valid Entries: 0 – disable quick capture mode
1 – enable quick capture mode
Default:
0
Parameter used to enable linear Interpolation mode for RJ & PJ
estimate. RJ & PJ are calculated based on the frequency data
of the noise. Since data points are captured only on the
single polarity transitions, interpolation must be performed
between sample points. There are two types of interpolation
available in the SIA3000: linear and cubic. Setting this
parameter to 1 will enable linear interpolation; otherwise,
cubic interpolation will be used.
Valid Entries: 0 – use cubic interpolation in FFT data
1 – use linear interpolation in FFT data
Default:
0
Section 2 – Measurement Commands and Structures
©WAVECREST Corporation 2005
lGetRate
lTailFit
lErrProb
lPassCnt
lFftAvgs
tRateInf
Parameter used to enable Bit Rate measurement. Knowledge of
the pattern enables the instrument to measure from one
transition in the pattern to the same edge several pattern
repeats later. If this function is disabled, an appropriate
value must be supplied in dBitRate variable. This function is
NOT available when using random mode.
Valid Entries: 0 – use user specified bit rate
1 – measure bit rate from data
Default:
0
Parameter used to enable TailFit algorithm for RJ estimate. The
TailFit algorithm yields the highest level of accuracy when
calculating an RJ estimate. However, millions of samples must be
taken in order to perform an accurate TailFit. Valid with
external arm only. The number of TailFits to be performed is
based on the value assigned to this parameter. In practice, only
a small sampling of edges need to be analyzed for RJ content. The
smallest sample is three. The edges selected are the first edge
in the pattern, the middle edge and the last edge. This allows a
reasonable span of frequency content. It is assumed that the
noise components can be approximated by a continuous function (as
is generally the case.) If the RJ changes over frequency, there
will be a delta between the different samples. A change in value
of less than 5% between adjacent points is considered acceptable.
If the delta is larger, more TailFit points should be taken.
Valid Entries: DCOM_NONE
Do not perform a TailFit
DCOM_AUTO
Perform TailFits until the delta
Between successive fits < 5%.
DCOM_FIT3
Perform 3 TailFits
DCOM_FIT5
Perform 5 TailFits
DCOM_FIT9
Perform 9 TailFits
DCOM_FIT17
Perform 17 TailFits
DCOM_ALL
Perform TailFit on every edge
Default:
DCOM_NONE
Error probability level for Total Jitter. Total Jitter is calculated
based on the desired Error Probability level. This value is used in
conjunction with the bathtub curve after the successful completion
of a tail-fit in order to project the value of Total Jitter.
Valid Entries: -1 to -16
Default:
-12
This parameter is a bi-directional structure element that tracks
the number of acquisitions since last reset. This flag can be
read after an execution or set prior to an execution. Setting
this parameter to 0 essentially resets this register. It will be
automatically incremented when a measurement is performed.
Valid Entries: any integer greater than or equal to 0
Default:
0
This variable is used to calculate the number of averages to
use in the FFT. Increasing the number of averages reduces the
background noise associated with the FFT algorithm. The number
of averages is calculated based on the equation:
AVERAGES = 2n
where
n = lFftAvgs
Valid Entries: any integer greater than or equal to 0
Default:
0 (indicating 20 averages = 1 execution.)
A structure of type SPEC used by the Bit Rate measurement. The
structure holds measurement specific parameters such as sample
count, pattern repeats and maximum standard error. See Section
2-7 for a description of the SPEC structure and its elements.
©WAVECREST Corporation 2005
SECTION 2 – Measurement Commands and Structures 49
tDdjtInf
tRjpjInf
dDdjtLpf
dDdjtHpf
dRjpjFmn
dRjpjFmx
dBitRate
50
A structure of type SPEC used by the Data Dependant Jitter
(DDJ) measurement. The structure holds measurement specific
parameters such as sample count, pattern repeats and maximum
standard error. See Section 2-7 for a description of the SPEC
structure and its elements.
A structure of type SPEC used by RJ & PJ estimate. The
structure holds measurement specific parameters such as sample
count, pattern repeats and maximum standard error. See Section
2-7 for a description of the SPEC structure and it’s elements.
Low pass DCD+DDJ filter frequency in Hertz, negative value
disables filter. This filter allows the user to apply a low pass
filter function to the DCD+DDJ data to approximate the low pass
filtering effects that would be present on the receiver or in
the transmission line. The low pass filter is basically the
bandwidth of the transmission line and the input bandwidth of
the receiver. This is only valid when external arming is
enabled.
Valid Entries: 0 to the Carrier Frequency (Fc) or –1 to
disable.
Default:
-1 (indicating the filter is off.)
High pass DCD+DDJ filter frequency in Hertz, a negative value
disables filter. This filter allows the user to apply a high
pass filter function to the DCD+DDJ data to approximate the
high pass filtering effects that would be present on the
receiver or in the transmission line. The High Pass filter is
basically the PLL’s response to the DCD+DDJ. Since the data
will be clocked into the de-serializer by the PLL, the
response of the PLL to the DCD+DDJ will become apparent as a
function of the PLL to the de-serializer. This is only valid
when external arming is enabled.
Valid Entries: 0 to the Carrier Frequency (Fc) or –1 to
disable.
Default:
-1 (indicating the filter is off.)
Minimum integration limit for RJ+PJ in Hertz, a negative value
disables filter. This filter is used post-measurement as a
means of focusing the RJ & PJ estimates on specific frequency
bands with in the FFT. This filter is not normally used in a
production program and should be left disabled.
Valid Entries: 0 to the Carrier Frequency (Fc) or –1 to
disable.
Default:
-1 (indicating the filter is off.)
Maximum integration limit for RJ+PJ in Hertz, a negative value
disables filter. This filter is used post-measurement as a
means of focusing the RJ & PJ estimates on specific frequency
bands with in the FFT. This filter is not normally used in a
production program and should be left disabled.
Valid Entries: 0 to the Carrier Frequency (Fc) or –1 to
disable.
Default:
-1 (indicating the filter is off.)
A bi-directional variable that allows the user to specify the
bit rate or read back what the SIA3000 measured as the bit
rate. If lGetRate is non-zero the bit rate is measured and
placed in this field. If lGetRate is set to zero an the bit rate
is read by the software from this field. This value must be
supplied when Random mode is being used.
Valid Entries: 0 to the maximum bit rate of channel card
Default:
0 (indicating bit rate will be measured.)
Section 2 – Measurement Commands and Structures
©WAVECREST Corporation 2005
dCornFrq
Corner Frequency for RJ & PJ estimate in Hertz. This value is used
in conjunction with the Bit Rate and pattern to determine the
maximum stop count to be used to acquire RJ & PJ data. A lower
value increase acquisition time.
Valid Entries: Bit-Rate /10,000,000 to Bit-Rate
I
Default:
637e3 (637kHz – Fibre Channel 1X)
lHeadOff
Header offset parameter, for use in packet-ized data which may have a
frame header before the test pattern. This offset value can be used
to skip past header information and into the repeating data pattern
stream. This can be useful when analyzing data from disk drives when
the pattern marker may be synchronized with the start of frame data.
Valid Entries: 0 to 10,000,000-pattern length
I
Default:
0 (indicating no header present)
lFndEftv
Flag to indicate that
l
an effective jitter
calculation is to be
attempted.
Effective
Jitter is a means of
estimating
the
effective
deterministic
jitter
as it relates to a .5
l
error
probability.
This is done by first
capturing the bathtub
Sampled data point
curve
using
Extrapolated Bathtub
Curve
conventional RJ & DJ
Actual Bathtub
estimation
Curve
techniques;
then,
Extrapolated Bathtub curve versus real bathtub
extrapolating from a
curve as seen by BERT
few
points
in
the
bathtub curve to the .5 error probability level to estimate
effective DJ. Effective RJ is extracted based on the curve that
was fitted to the sample points. These values should only be used
to correlate to a BERT Scan measurement and should not be used as
a vehicle for quantifying jitter. This technique was developed to
allow BERT systems to correlate with SIA3000 results.
Valid Entries: 0 – disable effective jitter estimate
1 – enable effective jitter estimate
Default:
0
lMinEftv, lMaxEftv Defines the error rates at which the eye width calculation will
be used in the estimating effective jitter components. lMinEftv and
lMaxEftv define points on the bathtub curve from which the
extrapolated RJ curve is traced. Then, where this extrapolated curve
intersects the .5 error probability, the effective DJ is calculated.
Valid Entries: -1 to –16 (indicating 10-1 to 10-16 error rate)
Default:
-4 and –12 (indicating 10-4 BER for lMaxEftv and
10-12 BER for lMinEftv)
lFiltEnb
Flag to enable IDLE character insertion filter. When enabled any
edge measurements that are not within ± 0.5 UI will be discarded.
This filter is used in systems, which may insert an idle character
from time to time to compensate for buffer under-run/overrun issues.
In those instances where an idle character was inserted during a
measurement, the edge selection may be off. If this parameter is
greater than or equal to one, the filter is enabled and measurements
that differ from the mean by ± 0.5 UI will be discarded.
Valid Entries: 0 – disable idle character filter
1 – enable idle character filter
Default:
0
©WAVECREST Corporation 2005
SECTION 2 – Measurement Commands and Structures 51
lQckTjit
Flag to indicate a fast total jitter calculation will be
performed using simple linear calculation of Total Jitter
instead of convolving the DJ Probability Density Functions and
the RJ Probability Density Functions. This calculation is
based on the formula [TJ = DJ + n*RJ] where DJ and RJ are
measured, and n is the multiplier based on a theoretical
Gaussian distribution
Valid Entries: 0 do not use convolution for TJ est.
2 Convolve DJ and RJ for TJ est.
Default:
0
lGood
Flag indicates valid output data in structure. A positive
value in this parameter indicates that the measurement was
completed successfully, and, valid data can be extracted from
this structure.
tPatn
Structure of type PATN which holds all of the pattern
information with regards to pattern length, pattern content,
marker placement relative to location in pattern and other
pattern specific metrics. (See Section 2-9 for a detailed
description of the PATN structure elements.) This is an
internal structure that the system uses to store pattern
information and does not need to be altered by the user. The
first time a measurement is performed the pattern is loaded
into tPatn which is used internally for all subsequent
acquisition and analysis.
dHits
Total samples taken to calculate DDJ, RJ, and PJ values
combined. Gives an indication of the actual data to support
the calculated total jitter number.
dDdjt
DCD+DDJ measurement in seconds. This measurement is taken from
the mean deviation of each pattern edge from it’s ideal
location. All deviations are placed in a histogram and the
peak-peak value from this histogram is placed in this
structure location.
dRang
Peak-to-peak of “All-Measurements” histogram. This histogram is
part of the random data analysis package and should not be used
as a metric of jitter measurement. Numbers captured in this tool
are for comparison purposes only and only coincidentally share
some terminology with jitter measurements.
dRjit[n]
Random jitter estimate, in seconds, for each of the enabled
acquire modes. Each mode’s RJ estimate is kept separate since
the data came from frequency information derived from
different FFTs.
dPjit[n]
Periodic jitter measurement, in seconds, for each of the
enabled acquire modes. Each enabled acquire mode’s PJ
measurement is kept separate since the data came from
frequency information derived from different FFTs.
dTjit[n]
Total jitter estimate, in seconds, for each of the enabled
acquire modes. Each mode’s TJ estimate is kept separate since
the data came from frequency information derived from
different FFTs.
dEftvLtDj[n] Effective Deterministic(eDJ) jitter estimate, in seconds, for
the left side of the bathtub curve. Total eDJ is calculated by
adding dEftvLtDj to dEftvRtDj. Each of the enabled acquire modes is
stored in the appropriate array location as specified in the
table below. In order to calculate the effective jitter the
flag lFndEftv must be enabled. Since the effective jitter is
calculated by optimizing a curve-fit to the bathtub curve, a
result is not guaranteed. If the curve-fit is unsuccessful, a
negative value will be returned in this variable.
52
Section 2 – Measurement Commands and Structures
©WAVECREST Corporation 2005
dEftvLtRj[n] Effective Random(eRJ) jitter estimate, in seconds, for the
left side of the bathtub curve. Total eRJ is calculated by
averaging dEftvLtRj and dEftvRtRj. Each of the enabled acquire modes
is stored in the appropriate array location as specified in
the table below. In order to calculate the effective jitter
the flag lFndEftv must be enabled. Since the effective jitter is
calculated by optimizing a curve-fit to the bathtub curve, a
result is not guaranteed. If the curve-fit is unsuccessful, a
negative value will be returned in these variables.
dEftvRtDj[n] Effective Deterministic(eDJ) jitter estimate, in seconds, for
the right side of the bathtub curve. Total eDJ is calculated
by adding dEftvLtDj to dEftvRtDj. Each of the enabled acquire modes
is stored in the appropriate array location as specified in
the table below. In order to calculate the effective jitter
the flag lFndEftv must be enabled. Since the effective jitter is
calculated by optimizing a curve-fit to the bathtub curve, a
result is not guaranteed. If the curve-fit is unsuccessful, a
negative value will be returned in this variable.
dEftvRtRj[n] Effective Random(eRJ) jitter estimate, in seconds, for the
right side of the bathtub curve. Total eRJ is calculated by
averaging dEftvLtRj and dEftvRtRj. Each of the enabled acquire modes
is stored in the appropriate array location as specified in
the table below. In order to calculate the effective jitter
the flag lFndEftv must be enabled. Since the effective jitter is
calculated by optimizing a curve-fit to the bathtub curve, a
result is not guaranteed. If the curve-fit is unsuccessful, a
negative value will be returned in this variable.
tRiseHist
Structure of type PLTD which contains all of the plot information
for generating a DCD+DDJ histogram of rising edges. See Section
2-3 for details concerning the PLTD structure and its elements.
tFallHist
Structure of type PLTD which contains all of the plot information
for generating a DCD+DDJ histogram of falling edges. See Section
2-3 for details concerning the PLTD structure and its elements.
tRiseMeas
Structure of type PLTD (See Section 2-3) which contains all of
the plot information for generating an all-measurements histogram
of rising edges. This plot is only valid when using random mode.
This histogram is for informational use and qualitative
assessment. Numbers originating from this measurement methodology
are not to be confused with jitter measurements.
tFallMeas
Structure of type PLTD which contains all of the plot information
for generating an all-measurements histogram of falling edges.
This plot is only valid when using random mode. This histogram is
for informational use and qualitative assessment. Numbers
originating from this measurement methodology are not to be
confused with jitter measurements. See Section 2-3 for details
concerning the PLTD structure and its elements.
tNormDdjt
Structure of type PLTD which contains all of the plot
information for generating a DCD+DDJ versus UI plot. This plot
is only valid in Pattern Marker mode. See Section 2-3 for
details concerning the PLTD structure and its elements.
tHipfDdjt
Structure of type PLTD which contains all of the plot information
for generating an DCD+DDJ versus UI plot with the DCD+DDJ High
Pass Filter enabled. This plot is only valid in Pattern Marker
Mode and dDdjtHpf is a non-negative number. (For a discussion on
the High Pass Filter Function for DCD+DDJ data, see dDdjtHpf
above.) When dDdjtHpf is enabled, the dDdjt value is calculated
based on applying the dDdjtHpf filter. See Section 2-3 for details
concerning the PLTD structure and its elements.
©WAVECREST Corporation 2005
SECTION 2 – Measurement Commands and Structures 53
tLopfDdjt
Structure of type PLTD \which contains all of the plot
information for generating an DCD+DDJ versus UI plot with the
DCD+DDJ Low Pass Filter enabled. This plot is only valid in
Pattern Marker Mode and dDdjtLpf is a non-negative number. (For
a discussion on the Low Pass Filter Function for DCD+DDJ data,
see dDdjtLpf above.) See Section 2-3 for details concerning the
PLTD structure and its elements.
tBathPlot[n] Structure of type PLTD which contains all of the plot
information for generating a Bathtub curve. There is one
structure and associated plot for each of the acquisition
modes specified in lAcqMode. See Section 2-3 for details
concerning the PLTD structure and its elements.
tEftvPlot[n] Structure of type PLTD which contains all of the plot
information for generating an Bathtub curve based on Effective
Jitter if lFndEftv is set and a valid fit is obtained. (For a
detailed description of Effective Jitter, see lFndEftv above.)
There is one structure and associated plot for each of the
acquisition modes specified in lAcqMode. See Section 2-3 for
details concerning the PLTD structure and its elements.
tSigmNorm[n] Structure of type PLTD which contains all of the plot information
for generating an 1-Sigma versus UI plot. (x-axis can be
converted to time from UI based on dBitRate value.) This plot
describes the standard deviation for each accumulated time
sample. There is one structure and associated plot for each of
the acquisition modes specified in lAcqMode. See Section 2-3 for
details concerning the PLTD structure and its elements.
tSigmTail[n] Structure of type PLTD which contains all of the plot
information for generating a 1σ TailFit results versus UI
plot. (x-axis can be converted to time from UI based on dBitRate
value.) Each successful TailFit will be displayed as a data
point and connected to adjacent TailFit samples. The plot
value represents the overall RJ for the given amount of
accumulated UI. This plot is only valid if tail-fit is
enabled. . There is one structure and associated plot for each
of the acquisition modes specified in lAcqMode. See Section 2-3
for details concerning the PLTD structure and its elements.
tFreqNorm[n] Structure of type PLTD which contains all of the plot
information for generating a Jitter versus Frequency plot.
There is one structure and associated plot for each of the
acquisition modes specified in lAcqMode. See Section 2-3 for
details concerning the PLTD structure and its elements.
tFreqTail[n] Structure of type PLTD which contains all of the plot
information for generating a 1σ TailFit results versus
frequency plot. This plot is only valid if tail-fit is
enabled. There is one structure and associated plot for each
of the acquisition modes specified in lAcqMode. See Section 2-3
for details concerning the PLTD structure and its elements.
54
Section 2 – Measurement Commands and Structures
©WAVECREST Corporation 2005
The following parameters are for internal use only. They are presented for reference only. Do not try
to read the values or parse the structures nor try to write the various locations.
dWndFact, lMaxStop, lCmpMode, lPosRoll, lNegRoll, lAdjustPW These values are for
internal use only, DO NOT ALTER or try to use.
tDdjtData
Structure which contains the raw DCD+DDJ measurements. This
value is for internal use only, DO NOT ALTER or try to use.
lDdjtRsvd
Used to track memory allocation for tDdjtData structures. This
value is for internal use only, DO NOT ALTER or try to use.
dMeasData
Raw all-measurements histogram data, only valid when autoarming is used. This structure is for internal use only, DO
NOT ALTER or try to use.
lMeasRsvd
Used to track memory allocation for dMeasData values. This
value is for internal use only, DO NOT ALTER or try to use.
dRjpjData
Raw variance data used for the calculation of RJ and PJ. This
structure is for internal use only, DO NOT ALTER or try to
use.
lRjpjRsvd
Used to track memory allocation for dRjpjData values. This value
is for internal use only, DO NOT ALTER or try to use.
dTfitData
Raw tail-fit data if tail-fit data is enabled and successful,
as indicated by the lGood variable in the tTfit structure being
non-zero. This structure is for internal use only, DO NOT
ALTER or try to use.
lTfitRsvd
Used to track memory allocation for dTfitData values. This value
is for internal use only, DO NOT ALTER or try to use.
lPeakData
Tracks detected spikes in RJ+PJ data. This value is for
internal use only, DO NOT ALTER or try to use.
lPeakNumb Count of detected spikes, indicates the number of values in
the lPeakData array.
lPeakRsvd
Used to track memory allocation for lPeakData values. This value
is for internal use only, DO NOT ALTER or try to use.
dFreqData
Raw FFT output when averaging is enabled. This structure is
not normally directly access by an application program. This
value is for internal use only, DO NOT ALTER or try to use.
lFreqRsvd
Used to track memory allocation for dFreqData values. This value
is for internal use only, DO NOT ALTER or try to use.
dTailData
Raw tail-fit FFT output when tail-fit and averaging are both
enabled. This structure is not normally directly access by an
application program. This value is for internal use only, DO
NOT ALTER or try to use.
lTailRsvd
Used to track memory allocation for dTailData values. This value
is for internal use only, DO NOT ALTER or try to use.
©WAVECREST Corporation 2005
SECTION 2 – Measurement Commands and Structures 55
void __stdcall FCNL_DefDcom ( DCOM *dcom )
This function is used to fill the dcom structure for the Datacom Known Pattern with Marker tool with reasonable
default values. It is recommended that this function be called initially even if parameters within the structure are to
be adjusted manually, and may be called repeatedly to reestablish initial conditions; however, this will impact test
time.
Before calling this function, zero out the DCOM structure using the standard memset() function to ensure that any
information pertaining to dynamic memory allocation is cleaned out prior to using the structure.
INPUTS
dcom - Pointer to a DCOM structure. Memory needs to be allocated by the caller.
OUTPUTS
None.
void __stdcall FCNL_ClrDcom ( DCOM *dcom )
This function frees any dynamic memory that may have been allocated during previous data acquisitions and clears
out the dcom structure.
INPUTS
dcom - Pointer to a DCOM structure. Memory needs to be allocated by the caller.
OUTPUTS
None.
EXAMPLE
#define TRUE 1
static DCOM dataJit;
memset ( &dataJit, 0, sizeof ( DCOM ) );
FCNL_DefDcom ( &dataJit);
dataJit.tParm.lChanNum = 1;
dataJit.tparm.lExtnArm = 2;
dataJit.tParm.lSamCnt = 500;
dataJit.tParm.lAutoArm = ARM_EXTRN;
strcpy(&dataJit.sPtnName[0], "cjtpat.ptn");
dataJit.lTailFit = DCOM_AUTO;
dataJit.tRateInf.SampCnt = 10000;
dataJit.tRateInf.PtnReps = 100;
dataJit.dCornFrq = 637000;
dataJit.lQckTjit = TRUE;
FCNL_RqstPkt ( ApiDevId, & dataJit, WIND_DCOM );
FCNL_RqstAll ( ApiDevId, & dataJit, WIND_DCOM );
//declare dataJit to be a structure of
//type DCOM
//clear the memory for dataJit structure
//set dataJit structure to default values
//NOTE: dataJit.tparm, dataJit.tRateInf,
//dataJit.DdjtInf, dataJit.tRjpjInf,
//dataJit.tPatn and dataJit.tDdjtData
//are also set to defaults by this
//command.
//Set channel number to 1
//Set Pattern Marker to Channel 2
//Capture 500 measurements per pass.
//Set to External Arming mode
//Use k28.5 pattern
//Perform TailFit for RJ estimate. Let
//SIA3000 decide how many TailFit
//samples to take.
//Set sample count for BitRate meas. To
//10,000 and Pattern Repeats to 100 for
//improved DDJ measurement accuracy.
//Set Corner Frequency to 637kHz
//Use simple calc for TJ for faster result.
//execute the measurement.
//get plot data
//Print Total Jitter Estimate.
If (dataJit.lGood>0) printf(“\nTJ = %d\n”,dataJit.dTjit[0]);
FCNL_ClrDcom ( &dataJit);
56
Section 2 – Measurement Commands and Structures
//deallocate the structure
©WAVECREST Corporation 2005
2-22 DATACOM RANDOM DATA WITH BIT CLOCK TOOL
The Datacom Random Data With Bit Clock Tool is used to measure jitter from a reference clock to a
data signal. This measurement setup is the same as the setup used by an oscilloscope when generating an
Eye Diagram or for Eye Mask testing. The measurement starts out with a quick frequency measurement
for the reference clock. Based on this information, the algorithm finds the next clock transition and
establishes data filters that limit the data to only those transitions that are within a ± 0.5 UI window of
the expected clock. This means that the software will throw out any measurements that are not valid and
belong to a different location in the pattern. Then, the instrument measures from the bit clock to the data
channel and generates two histograms of measurements, one for each polarity of the data signal. Then,
the histograms are overlaid and the right most and left most edges are used to perform a TailFit for
RJ/DJ separation.
Eye Histogram Tool is used primarily for long data patterns (greater than 2k in length) or for fully
random data streams in which no repeating pattern is available. The bit clock for this measurement could
be placed on any one of the other input channels or may come from the optional Clock Recovery
Module (CRM) available on most SIA3000 systems.
Ref Channel =
Bit Clock
Data Channel
Start of
Measurement
End of
Measurement
Histogram of
Measurements
for rising edges
Histogram of
Measurements
for falling edges
TailFit performed on
outermost histogram in both
directions
Measurement methodology for Eye Histogram Measurements.
©WAVECREST Corporation 2005
SECTION 2 – Measurement Commands and Structures 57
typedef struct
{
/* Input parameters
PARM
tParm;
long
lPassCnt;
long
lRefEdge;
long
lErrProb;
*/
long
lClokSmp;
long
lFiltSmp;
long
lTailFit;
long
lForcFit;
long
lMinHits;
long
lFndEftv;
long
lMinEftv;
long
lMaxEftv;
long
lDdrClok;
double dMinSpan;
long
lFiltOff;
long
lKeepOut;
double dKpOutLt;
double dKpOutRt;
/* Output parameters */
long
lGood;
long
lRiseCnt;
long
lFallCnt;
long
lPad2;
double dDataMin;
double dDataMax;
double dDataSig;
double dAvgSkew;
double dUnitInt;
58
/*
/*
/*
/*
/*
/*
/*
/*
/*
/*
/*
/*
/*
/*
/*
/*
/*
/*
/*
Contains acquisition parameters
Acquisitions so far, set to 0 to reset
Referenced to: EDGE_FALL or EDGE_RISE
Error probability used Total Jitter
Valid range is ( -1 to -16 )
Sample size while acquiring clock rate
Sample size when finding filter limits
If non-zero a tail-fit will be tried
If non-zero use the force-fit method
Minimum hits before trying tail-fit
Flag to attempt effective jitter calc
Min probability for effective fit: -4
Max probability for effective fit: -12
Non-zero for double data rate clocks
Minimum span between edges in seconds
Filter offset in %UI (100 to -100)
If non-zero use tailfit keep out below
Keep out value for left side
Keep out value for right side
*/
*/
*/
*/
*/
*/
*/
*/
*/
*/
*/
*/
*/
*/
*/
*/
*/
*/
*/
/* Flag indicates valid data in structure */
/* Number of hits in rising edge data
*/
/* Number of hits in falling edge data
*/
/*
/*
/*
/*
/*
Minimum value relative to clock edge
*/
Maximum value relative to clock edge
*/
1-Sigma of all values relative to clock*/
Average of all values relative to clock*/
Measured Unit Interval
*/
long
long
double
double
double
double
long
long
double
double
double
lUnitOff;
/******************************************/
lSpanCnt;
/*
*/
dRiseMin;
/* These values are all used internally */
dRiseMax;
/*
as part of the measurement process
*/
dFallMin;
/*
*/
dFallMax;
/*
*/
lRiseBin;
/*
DO NOT ALTER!
*/
lFallBin;
/*
*/
dLtSigma[PREVSIGMA];/*
*/
dRtSigma[PREVSIGMA];/*
*/
dAltMean;
/******************************************/
PLTD
PLTD
PLTD
PLTD
PLTD
PLTD
PLTD
PLTD
TFIT
} EYEH;
tRise;
tFall;
tBoth;
tRiseProb;
tFallProb;
tBothProb;
tBath;
tEftv;
tTfit;
/*
/*
/*
/*
/*
/*
/*
/*
/*
Histogram of rising edge data
*/
Histogram of falling edge data
*/
Histogram of combined edge data
*/
Probability Histogram of rising edges */
Probability Histogram of falling edges */
Probability Histogram of combined edges*/
Bathtub curves determined from PDF
*/
Effective Bathtub curves if enabled
*/
Structure containing tail-fit info
*/
Section 2 – Measurement Commands and Structures
©WAVECREST Corporation 2005
tParm
lChanNum
dStrtVlt
dStopVlt
lPassCnt
lRefEdge
A structure of type PARM that contains acquisition parameter.
The PARM is discussed in full detail in Section 2-4. Be sure to
either set the following parameters in tParm for a successful
EyeHistogram Tool execution or review the default settings:
This is a 32 bit word that represents the channel for this
measurement. The upper 16 bits define which channel will be used as
the reference edge (or bit clock) the lower 16 bits are used for
identifying the channel to be measured. It is best to manipulate
the channel selection field using HEX format or by using binary
shift functions. See sample code at the end of this section for an
example of using binary shift function in the channel declaration.
in HEX format, simply enter the reference channel number in the
first two bytes and the measured channel in the last two bytes such
that 0x000m000n would indicate a reference channel of m and a
measured channel of n (in hexadecimal format) where m and n are
elements of the set {1,2,3,4,5,6,7,8,9,a}. For example, 0x00050003
would indicate that channel 5 was the channel with the bit clock
signal and channel 3 was the channel with the data signal. The
default for tParm.lChanNum within a EYEH structure is 0x00010002
indicating that the reference channel is defaulted to channel 1 and
the measured channel is set to 2.
Since measurements are made from the data signal to the next
clock signal, the start of measurement is the data signal and
thus dStrtVlt controls the threshold level for the data
channel. It is typically best to leave this variable at the
default and allow Pulse Find to establish the 50% level at
which to test the device. However, there are two cases in
which this may not be desirable. First, in a production
environment, it may be too time-consuming to perform a Pulse
Find each time the test is to be executed. All of the parts
should have roughly the same voltage characteristics (if they
are passing parts) and will most likely have the same
threshold settings. Second, in some cases, it might be
desirable to account for any slew rate issues by adjusting the
threshold voltage to the cross point. A simple script can be
written to identify the cross point prior to testing.
Since measurements are made from the data signal to the next
clock signal, the stop of measurement is the reference clock
signal and thus dStopVlt controls the threshold level for the
clock channel. It is typically best to leave this variable at the
default and allow Pulse Find to establish the 50% level at which
to test the device. In a production environment, this value can
be forced by turning pulse find off and setting this parameter.
This parameter is a bi-directional structure element that tracks
the number of acquisitions since last reset. This flag can be
read after an execution or set prior to an execution. Setting
this parameter to 0 essentially resets this register. It will be
automatically incremented when a measurement is performed.
Valid Entries: any integer greater than or equal to 0
Default:
0
Parameter to define the polarity of the clock edge which will
be used as the reference.
Valid Entries:EDGE_FALL reference clock to data measurements
tothe falling edge of the clock signal.
EDGE_RISEreference clock to data measurements to
the rising edge of the clock signal.
Default:
EDGE_RISE
©WAVECREST Corporation 2005
SECTION 2 – Measurement Commands and Structures 59
lErrProb
lClokSmp
lFltSmp
lTailFit
lForcFit
lMinHits
lFndEftv
60
Exponent of Bit Error Probability (BER) to which Total Jitter
will be calculated if TailFit is enabled. TJ is calculated based
on the convolution of DJ and RJ out to 10n BER where n = lErrProb.,
Valid Entries: Any integer from –1 to –16
Default:
-12
Sample size while acquiring clock rate.
Valid Entries: Any integer less than or equal to 1,000,000
Default:
10000.
Sample size when finding filter limits
Valid Entries: Any integer less than or equal to 1,000,000
Default:
1000.
Flag to indicate whether to perform a TailFit on data in the
rising and falling data histograms. If non-zero, a tail-fit will
be attempted. The lGood element of the tTfit structure will indicate
if the TailFit was successful. Setting this structure element to
1 will initiate the TailFit algorithm.
Valid Entries: 0 – disable TailFit algorithm
1 – enable TailFit algorithm
Default:
0
Flag to indicate whether to force a TailFit on a fixed sample
size or to continue acquiring data until a sufficient amount of
data has been collected resulting in a high level of confidence
in the accuracy of the TailFit on the given sample. If selected,
the TailFit algorithm will make a single attempt at fitting
Gaussian tails to the tail regions of the histograms after
acquiring the minimum number of samples as defined by lMinHits.
Valid Entries: 0 continue acquiring data until chi squared
(Χ2)
estimate indicates a good TailFit was
accomplished.
1 perform tail fit on only lMinHits amount of
data.
Default:
0
Minimum number of samples (in thousands) to acquire prior to
attempting a TailFit.
Valid Entries: any positive integer less than or equal to 100,000
Default:
50
Flag to indicate
l
that an effective
jitter calculation
is
to
be
attempted.
Effective
Jitter
is
a
means
of
estimating
the
effective
l
deterministic
jitter
as
it
relates to a .5
Sampled
error probability.
d
Extrapolated
This is done by
h bC
Actual
first
capturing
h b
the bathtub curve
Extrapolated Bathtub curve versus real bathtub
using conventional
curve as seen by BERT
RJ & DJ estimation
techniques; then, extrapolating from a few points in the
bathtub curve to the .5 error probability level to estimate
effective DJ. Effective RJ is extracted based on the curve
that was fitted to the sample points. These values should only
Section 2 – Measurement Commands and Structures
©WAVECREST Corporation 2005
be used to correlate to a BERT Scan measurement and should not
be used as a vehicle for quantifying jitter. This technique
was developed to allow BERT systems to correlate with SIA3000
results.
Valid Entries: 0 – disable effective jitter estimate
1 – enable effective jitter estimate
Default:
0
lMinEftv, lMaxEftv Defines the error rates at which the eye width calculation
will be used in the estimating effective jitter components. lMinEftv
and lMaxEftv define points on the bathtub curve from which the
extrapolated RJ curve is traced. Then, where this extrapolated
curve intersects the .5 error probability, the effective DJ is
calculated.
Valid Entries: -1 to –16
(indicating 10-1 to 10-16 error
rate)
Default:
-4 and –12
(indicating 10-4 BER for lMaxEftv
and
10-12 BER for lMinEftv)
dMinSpan
Minimum delay between reference clock and measured edges. This
parameter will skip a sufficient number of edges to measure the
data transitions that are at least dMinSpan (in seconds) away from
the reference clock. This parameter is used to correlate with
oscilloscopes, which have a trigger delay of at least 20ns
(typ.). It is not typically used in a production environment.
Valid Entries: 0 to 1.0
Default:
0
lFiltOff
This allows an offset to be made to the filter that is used to
isolate histogram data to within 1 UI of the bit clock. The
filter is established on the first pass by the instrument, and
can normally be left alone. However, in the presence of large
amounts of jitter it may be necessary to tweak this value
slightly. The offset is entered as a percentage of UI, and a
value in the range of +/-100 is valid.
Valid Entries: -100 to +100
Default:
0
lGood
Flag indicates valid output data in structure.
lRiseCnt
Number of hits in rising edge data.
lFallCnt
Number of hits in falling edge data.
dDataMin
Minimum value relative to clock edge.
dDataMax
Maximum value relative to clock edge.
dDataSig
1-Sigma of all values relative to clock.
dAvgSkew
Average of all values relative to clock.
dUnitInt
Measured Unit Interval, this is based on the clock.
tRise
Structure of type PLTD which contains all of the plot
information to generate a Histogram of rising-edge data to
next reference clock measurements. See Section 2-3 for details
of the PLTD structure and its elements.
tFall
Structure of type PLTD which contains all of the plot
information to generate a Histogram of falling-edge data to
next reference clock measurements. See Section 2-3 for details
of the PLTD structure and its elements.
tRiseProb
Structure of type PLTD which contains all of the plot
information to generate a probability histogram of rising-edge
data to next reference clock measurements. The amplitude of
each point in the probability histogram is normalized to the
probability of a given measurement occurring as opposed to the
total number of measurements made with the given result. See
Section 2-3 for details of the PLTD structure and its elements.
©WAVECREST Corporation 2005
SECTION 2 – Measurement Commands and Structures 61
tFallProb
Structure of type PLTD which contains all of the plot information
to generate a probability histogram of falling-edge data to next
reference clock measurements. The amplitude of each point in the
probability histogram is normalized to the probability of a given
measurement occurring as opposed to the total number of
measurements made with the given result. See Section 2-3 for
details of the PLTD structure and its elements.
tBath
Structure of type PLTD which contains all of the plot
information to generate a bathtub curve based on Probability
Density Function derived from histogram data and RJ estimate
from TailFit algorithm. . See Section 2-3 for details of the
PLTD structure and its elements.
tEftv
Structure of type PLTD which contains all of the plot information
to generate a bathtub curve based on the estimate of effective
Deterministic Jitter (eDJ) and effective Random Jitter (eRJ)
derived from the true data bathtub curve. This plot is only
available when lFndEftv is set and a valid fit is obtained. See
Section 2-3 for details of the PLTD structure and its elements.
tTfit
A structure of type TFIT containing tail-fit info. See Section
2-5 for details of the TFIT structure and its elements.
lUnitOff, dRiseMin, dRiseMax, dFallMin, dFallMax,
lRiseBin, lFallBin, dLtSigma, dRtSigma, lSpanCnt
These values are all used internally, DO NOT ALTER!
void __stdcall FCNL_DefEyeh ( EYEH *eyeh )
This function is used to fill the eyeh structure for the Datacom with Bit Clock tool with reasonable default values. It
is recommended that this function be called initially even if parameters within the structure are to be adjusted
manually, and may be called repeatedly to reestablish initial conditions; however, this will impact test time.
Before calling this function, zero out the EYEH structure using the standard memset() function to ensure that any
information pertaining to dynamic memory allocation is cleaned out prior to using the structure.
INPUTS
eyeh - Pointer to a EYEH structure. Memory needs to be allocated by the caller.
OUTPUTS
None.
62
Section 2 – Measurement Commands and Structures
©WAVECREST Corporation 2005
void __stdcall FCNL_ClrEyeh ( EYEH *eyeh )
This function frees any dynamic memory that may have been allocated during previous data acquisitions and clears
out the eyeh structure.
INPUTS
eyeh - Pointer to a EYEH structure. Memory needs to be allocated by the caller.
OUTPUTS
None.
EXAMPLE
#define TRUE 1
#define FALSE 0
static EYEH eyehist;
memset ( &eyehist, 0, sizeof ( EYEH ) );
FCNL_DefEyeh ( &eyehist);
eyehist.tParm.lChanNum = 1 | (2<<16);
eyehist.tParm.lSampCnt = 50,000;
eyehist.lTailFit = TRUE;
eyehist.ForcFit = TRUE;
eyehist.MinHits = 50,000;
FCNL_RqstPkt ( ApiDevId, & eyehist, WIND_EYEH );
//declare eyehist to be a structure of
//type EYEH
//clear the memory for eyehist structure
//set eyehist structure to default values
//NOTE: eyehist.tparm, are also set to
//defaults by this command.
//Set ch 1 for data and ch 2 for ref clk
//Set sample size to 50k
//Enable TailFit for RJ estimate
//Force the fit with first 50k samples
//set minimum samples to 50k
//execute the measurement.
//Print Total Jitter Estimate.
If (eyehist.lGood>0) printf(“\nTJ = %d\n”,eyehist.tTfit.dTjit);
FCNL_ClrEyeh ( &eyehist);
©WAVECREST Corporation 2005
//deallocate the structure
SECTION 2 – Measurement Commands and Structures 63
2-23 DATACOM RANDOM DATA WITH NO MARKER TOOL
The Datacom Random Data With No Marker Tool is used to estimate jitter components on random
data signals without the benefit of a repeating data pattern or access to a bit clock. This tool is used
primarily to capture relative jitter amplitudes and is not considered an accepted means of accurately
measuring jitter components on a data signal. For accurate jitter measurements on data signals, it is
imperative to have a repeating pattern and a pattern trigger or have access to a bit clock. This tool,
the Random Data Tool, is prone to inaccuracies when periodic jitter is present and data dependent
jitter is present on the signal. This tool does not take into account any PJ amplitude when estimating
Total Jitter. Secondly, this tool may underestimate the amplitude of DDJ due to data binning errors.
Data Signal
Edge Count = 1
2UI bin
4UI bin
5UI bin
2UI bin
5UI bin
Example of Random Data utility when edge count equals 1. In a complete execution of the random data utility,
edge count will range from 1 to FC/(4*FM) where FC is the carrier frequency and FM is the modulation cutoff
frequency.
To capture jitter information, this tool measures time from randomly selected transitions in the
pattern to a subsequent edge in the pattern some “n” number of transitions after the start of the
measurement. “n” is swept from a count of 1 to a count as defined by the carrier frequency and the
desired cutoff frequency. Once all of the measurements are captured, the data is binned according to
their proximity to integer multiples of the bit period. (For example, all measurements within ± .5UI
of 5xbit-period are placed in the 5UI bin.) Then, each bin is parsed for statistical information
including jitter and mean offset from ideal. The mean offset is used to estimate Data Dependent
Jitter (DDJ). As such, the location of the mean for a given bin’s histogram could be artificially
inflated based on combining measurements from transitions which are not from the same point in the
data pattern. The above example shows a given burst of measurements where the edge count was
equal to 1. During the course of the complete measurement, the edge count will be varied from an
initial value of 1 to a final value determined based on the bit rate and the intended cutoff frequency.
Each is bin is also sorted based on edge count and polarity in an attempt to maximize accuracy of
DDJ estimate. Once all of the data is captured, the mean of each histogram for each sub-bin is
compared to an ideal bit clock and the deviation is taken as Data Dependant Jitter. All DDJ estimates
are combined to determine the peak to peak spread of DDJ. Then, the algorith selects appropriate
edge counts to create a histogram from which to capture TailFit information in an attempt to estimate
RJ. Based on the users selection of the structure element tDcom.lTailFit.
The structure used in this tool incorporates a Datacom Known Pattern With Marker structure. In
other words, this tool basically creates a “wrapper” structure around the dataCOM structure which
has settings unique to the random data tool.
To estimate Random Jitter (RJ) on a random signal without the benefit of a reference clock, the
random data tool uses TailFit on sampled data histograms from various amounts of accumulated bit
periods. The precision of the measurement is increased as the number of different accumulations used
is increased. There is a significant increase in test time for increasing the number of tailfit points. As
such, the user can specify 4 different setting selections or have the instrument dynamically decide
which to use (AUTO). In AUTO mode, the tool first performs 3 tailfits (maximum count, minimum
64
Section 2 – Measurement Commands and Structures
©WAVECREST Corporation 2005
count and middle count) and checked to see if the deviation between adjacent RJ measurements is less
than the percentage specified in lPcnt. If the deviation is greater, the instrument will perform two more
TailFit measurements between the three already taken. Again, the instrument will check adjacent RJ
estimates and decide whether to capture additional interstitial samples.
typedef struct
{
/* Input parameters */
long
lCoun;
long
lPcnt;
DCOM
tDcom;
/* Output parameters */
long
lGood;
long
lPad1;
double dDjit;
double dRjit;
double dTjit;
PLTD
tSigmTail;
} RAND;
/* Count of tailfits, see constants above */
/* Automode suceed %, see constants above */
/* DCOM structure holds most information */
/* Flag indicates valid data in structure */
/*
/*
/*
/*
Deterministic jitter value
Random jitter value
Total jitter value
1-Sigma plot using tail-fits
*/
*/
*/
*/
lCoun
This parameter selects the number TailFit iterations to be
captured. This number can be any of 3, 5, 9 or 17. In
RAND_AUTO mode, the user can choose to have the instrument
dynamically decide the number based on the deviation of
adjacent RJ estimates. The instrument will start with 3
TailFits and increase the count based on the value specified
in lPcnt.
Valid Entries: RAND_AUTO Continue to perform tailfits
until
RJ is within some percentage of
the
previous pass.
RAND_FIT3 Perform 3 tailfits
RAND_FIT5 Perform 5 tailfits
RAND_FIT9 Perform 9 tailfits
RAND_FIT17 Perform 17 tailfits
lPcnt
Target maximum amount of deviation between adjacent RJ
estimates. Each RJ estimate is calculated based on a histogram
of accumulated bit periods. Then, each RJ is compared with the
RJ estimate of the adjacent accumulations. The percentage
difference is compared with this entry to determine if the RJ
estimate is valid.
RAND_PCNT5
RJ within 5% of adjacent estimates
RAND_PCNT10
RJ within 10% of adjacent estimates
RAND_PCNT25
RJ within 25% of adjacent estimates
RAND_PCNT50
RJ within 50% of adjacent estimates
tDcom
Structure of type DCOM which specifies most of the input and
output parameters necessary for a data signal analysis. See D3 for more details on the DCOM structure and the elements
described below. The user will need to review all of the
default parameters of the DCOM structure and decide which to
change. The following entities from the DCOM structure are
valid for use with the random data tool:
tDcom.tParm Acquisition parameter sub structure.
tDcom.AcqMode Acquire Mode (rise-rise, rise-fall, fall-rise, fall-fall)
tDcom.lRndMode Enable/Disable Random Mode
tDcom.lErrProb Error Probably level to which TJ is to be calculated.
©WAVECREST Corporation 2005
SECTION 2 – Measurement Commands and Structures 65
tDcom.lPassCnt Number of passes using same RAND structure since
tDcom.lFftAvgs Number of FFTs to capture and average
tDcom.tDdjtInf SPEC structure used to set up DDJ measurement.
tDcom.dBitRate Bit Rate of data signal under test.
tDcom.dCornFrq Corner Frequency as specified by given standard
tDcom.lFndEftv Enable/Disable Effective Jitter measurements
tDcom.lMinEftv Minimum BER point in Bathtub curve used for Effective Jitter.
tDcom.lMaxEftv Maximum BER point in Bathtub curve used for Effective Jitter.
tDcom.lQckTjit Enable Quick TJ estimate rather than convolving RJ+DDJ for TJ.
tDcom.lGood Flag to indicate valid data results exist in structure.
tDcom.dHits total number of measurements made
tDcom.dDdJt peak-peak amplitude of DDJ
tDcom.dRang peak-peal of all measurements histogram.
tDcom.dRjit[n] RJ estimate for each possible mode.
tDcom.dPjit[n] PJ estimate for each possible mode.
tDcom.dTjit[n] TJ estimate for each possible mode.
tDcom.dEftvLtDj[n] Effective DJ estimate for left or short cycle side.
tDcom.dEftvLtRj[n] Effective RJ estimate for left or short cycle side.
tDcom.dEftvRtDj[n] Effective DJ estimate for right or long cycle side.
tDcom.dEftvRtRJ[n] Effective RJ estimate for right or long cycle side.
tDcom.tRiseHist PLTD structure of DDJ histogram for rising edges
tDcom.tFallHist PLTD structure of DDJ histogram for falling edges
tDcom.tRiseMeas PLTD structure of “All Measurements” of rising edges.
tDcom.tFallMeas PLTD structure of “All Measurements” of falling edges.
tDcom.tBathPlot[n] PLTD structure of bathtub curves for each measurement mode.
tDcom.tEftvPlot[n] PLTD structure of Effective Jitter for each measurement mode.
tDcom.tSigmNorm[n] PLTD structure of standard Deviation (1σ) versus time.
tDcom.tSigmTail[n] PLTD structure of 1σ versus time using TailFit for RJ.
tDcom.tFreqNorm[n] PLTD structure of 1σ versus frequency.
tDcom.tFreqTail[n] PLTD structure of 1σ versus frequency using TailFit for RJ.
lGood
Flag indicates valid output data in structure.
dDjit
Deterministic Jitter estimate. This value is based strictly on
the Data Dependant Jitter calculation and does not account for
any Periodic Jitter since it is impossible to accurately
separate Periodic Jitter in the FFT results when DDJ is
present.
dRjit
Random Jitter estimate. This value comes from the series of
TailFits that were performed on the accumulated jitter data.
dTjit
Total Jitter estimate. This value is the convolution of the
DDJ probability density function captured in dDjit and the RJ
estimate captured in dRjit.
tSigmTail
Structure of type PLTD containing information necessary to
create a plot of RJ (based on the TailFit results) and 1-σ
(standard deviation) as a function of accumulated bit periods.
See Section 2-3 for details of the PLTD structure and its
elements.
66
Section 2 – Measurement Commands and Structures
©WAVECREST Corporation 2005
void __stdcall FCNL_DefRand ( RAND *rand )
This function is used to fill the rand structure for the Datacom Random Data With No Marker tool with reasonable
default values. It is recommended that this function be called initially even if parameters within the structure are to be
adjusted manually, and may be called repeatedly to reestablish initial conditions; however, this will impact test time.
Before calling this function, zero out the RAND structure using the standard memset() function to ensure that any
information pertaining to dynamic memory allocation is cleaned out prior to using the structure.
INPUTS
rand - Pointer to a RAND structure. Memory needs to be allocated by the caller.
OUTPUTS
None.
void __stdcall FCNL_ClrRand ( RAND *rand )
This function frees any dynamic memory that may have been allocated during previous data acquisitions and clears
out the rand structure.
INPUTS
rand - Pointer to a RAND structure. Memory needs to be allocated by the caller.
OUTPUTS
None.
EXAMPLE
#define TRUE 1
#define FALSE 0
static RAND rdataJit;
memset ( &rdataJit, 0, sizeof ( RAND ) );
FCNL_DefRand ( &rdataJit);
rdataJit.tDcom.tParm.lChanNum = 1;
rdataJit.tDcom.tParm.lSamCnt = 500;
rdataJit.tDcom.dCornFrq = 637000;
rdataJit.lCoun = RAND_AUTO;
rdataJit.lPcnt = RAND_PCNT10;
//Declare rdataJit to be a structure of
//type RAND
//Clear the memory for rdataJit structure
//Set rdataJit structure to default values
//NOTE: rdataJit.tdcom and all of the
//DCOM substructures (including tparm)
//are also set to defaults by this
//command.
//Set channel number to 1
//Capture 500 measurements per pass.
//Set Corner Frequency to 637kHz
//Set TailFit count to aotomatic mode.
//Set target deviation maximum to 10%
FCNL_RqstPkt ( ApiDevId, & rdataJit, WIND_RAND );
FCNL_RqstAll ( ApiDevId, & rdataJit, WIND_RAND );
//execute the measurement.
//get plot data
//Print Total Jitter Estimate.
If (rdataJit.lGood>0) printf(“\nTJ = %d\n”,rdataJit.dTjit);
FCNL_ClrRand ( &rdataJit);
©WAVECREST Corporation 2005
//deallocate the structure
SECTION 2 – Measurement Commands and Structures 67
2-24 FIBRE CHANNEL COMPLIANCE TOOL
The Fibre Channel Compliance Tool utilizes the Datacom Known Pattern with Marker Tool for the
measurements. In addition to the data signal to be analyzed, this tool requires a pattern marker to be
connected to the Arm Channel. If your SIA-3000 is equipped with the PM-50 option, the marker signal
will be generated on the card and no additional input signals are required for making a measurement.
The Marker signal has an edge relative to the same bit of the pattern each time the marker occurs. Since
no bit-clock is used, analysis of jitter is independent of clock-jitter effects, and because the Arm is not a
trigger, any jitter on the marker will not transfer to the measurement of the Data.
For an in depth description on Known Pattern With Marker measurement theory, refer to the Known
Pattern With Marker quick reference guide.
typedef struct
{
/* Input parameters */
double dAttn;
DCOM
tDcom;
/* Output parameters */
long
lGood;
long
lPad0;
PLTD
tNrmScop;
PLTD
tCmpScop;
} FCMP;
dAttn
tDcom
lGood
tNrmScop
tCmpScop
/* Attenuation factor (dB)
/* DCOM structure holds most information
*/
*/
/* Flag indicates valid data in structure */
/* Normal channel voltage data
/* Complimentary channel voltage data
*/
*/
Attenuation factor in dB, this is provided to allow the
results to be scaled to compensate for external attenuation
from sources such as probes.
Default:
0
Structure of type DCOM which specifies most of the input and
output parameters necessary for a data signal analysis. The
user will need to review all of the default parameters of the
DCOM structure and decide which to change.
Flag indicates valid data in structure
Normal channel voltage data
Complimentary channel voltage data
void __stdcall FCNL_DefFcmp ( FCMP *fcmp )
This function is used to fill the fcmp structure for the Fibre Channel Compliance tool with reasonable default
values. It is recommended that this function be called initially even if parameters within the structure are to be
adjusted manually, and may be called repeatedly to reestablish initial conditions; however, this will impact test time.
Before calling this function, zero out the FCMP structure using the standard memset() function to ensure that any
information pertaining to dynamic memory allocation is cleaned out prior to using the structure.
INPUTS
fcmp - Pointer to a FCMP structure. Memory needs to be allocated by the caller.
OUTPUTS
None.
68
Section 2 – Measurement Commands and Structures
©WAVECREST Corporation 2005
void __stdcall FCNL_ClrFcmp ( FCMP *fcmp )
This function frees any dynamic memory that may have been allocated during previous data acquisitions and clears
out the fcmp structure.
INPUTS
fcmp - Pointer to a FCMP structure. Memory needs to be allocated by the caller.
OUTPUTS
None.
EXAMPLE
static FCMP fibre;
memset ( &fibre, 0, sizeof ( FCMP ) );
FCNL_DefFcmp ( &fibre);
//declare fibre to a structure of type
//FCMP
//clear the memory for fibre structure
//set fibre structures to default values
FCNL_RqstPkt ( ApiDevId, &fibre, WIND_FCMP );
FCNL_RqstAll ( ApiDevId, &fibre, WIND_FCMP );
//execute the measurement.
//get plot data (including tDcom plots)
FCNL_ClrFcmp ( &fibre);
//deallocate the structure
©WAVECREST Corporation 2005
SECTION 2 – Measurement Commands and Structures 69
2-25 FOLDED EYE DIAGRAM TOOL
The Folded Eye Tool is designed to provide an eye mask test to be applied to a repeating
pattern. This allows a DSP Bandwidth Extension algorithm to be applied to improve the
apparent front end performance. See the SIA-3000 User Manual for additional information
concerning the Bandwidth Extension.
typedef struct
{
/* Input parameters */
PARM
tParm;
long
lPassCnt;
long
lPatnLen;
long
lScopRes;
long
lInps;
long
lVoff;
long
lVdif;
MASK
tMask;
double dMargin;
double dBitRate;
double dAttn;
/* Output parameters */
long
lGood;
long
lPad2;
double d1stEdge;
double dNrmPkpk;
double dCmpPkpk;
double dDifPkpk;
QTYS
qNorm;
QTYS
qComp;
QTYS
qDiff;
PLOT
tNrmScop;
PLOT
tCmpScop;
PLOT
tDifScop;
char
*bNrmData;
long
lNrmRsvd;
char
*bCmpData;
long
lCmpRsvd;
char
*bDifData;
long
lDifRsvd;
} FEYE;
tParm
lPassCnt
lPatnLen
lScopRes
70
/*
/*
/*
/*
/*
/*
/*
/*
/*
/*
/*
Contains acquisition parameters
Acquisitions so far, set to 0 to reset
Pattern length in bit periods
Scope resolution in ps increments
Input selection, see defines above
Voltage offset (mV)
- per channel
Differential offset (mV)- per channel
Structure which holds mask definition
Margin in percentage [-1.0 to 1.0]
Bit Rate, must be specified
Attenuation factor (dB)
*/
*/
*/
*/
*/
*/
*/
*/
*/
*/
*/
/* Flag indicates valid data in structure */
/*
/*
/*
/*
/*
/*
/*
/*
/*
/*
/*
/*
/*
/*
/*
/*
This value is used internally
Vpp for Normal Channel Eye Diagrams
Vpp for Complimentary Eye Diagrams
Vpp for Differential Eye Diagrams
Normal channel quantities
Complimentary channel quantities
Differential channel quantities
Normal channel voltage data
Complimentary channel voltage data
Differential voltage data
Eye diagram of normal data
This value is used internally
Eye diagram of complimentary data
This value is used internally
Eye diagram of differential data
This value is used internally
*/
*/
*/
*/
*/
*/
*/
*/
*/
*/
*/
*/
*/
*/
*/
*/
A structure of type PARM that contains acquisition parameter.
tParm is discussed in full detail in a previous section.
This parameter is a bi-directional structure element that
tracks the number of acquisitions in the data set. This flag
can be read after an execution or set prior to an execution.
Setting this parameter to 0 essentially resets the accumulated
data on the instrument. The value in the returned structure
will be automatically incremented by the instrument.
Valid Entries: any integer greater than or equal to 0
Default:
0
This parameter configures the number of UI that are measured
and folded into the Eye Mask.
Valid Entries: any integer greater than or equal to 1
Default:
40
This parameter configures the sample interval and is entered
in units of picoseconds.
Valid Entries: any integer greater than or equal to 1
Section 2 – Measurement Commands and Structures
©WAVECREST Corporation 2005
Default:
2
Input selection, can be any of the following:
SCOP_INPS_NORM +Input Only
SCOP_INPS_COMP –Input Only
SCOP_INPS_DIFF +Input minus -Input
Default:
SCOP_INPS_DIFF
lVoff
Offset voltage used for scope acquire, specified in mV
Default:
0
lVdif
Differential offset voltage used for display, specified in mV
Default:
0
tMask
MASK Structure which holds mask definition. See the definition
above.
Defaults:
tMask.dXwdUI = 0.40
tMask.dXflUI = 0.20
tMask.dYiPct = 0.60
tMask.dV1Rel = 0.20
tMask.dV0Rel = 0.20
tMask.dVmask = 64e-3
tMask.dTmask = 700e-12
tMask.dV1pas = feye->tMask.dVmask * 0.75
feye->tMask.dV0pas = feye->tMask.dVmask * 0.75
tMask.dTflat = feye->tMask.dTmask * 3.0 / 7.0
dMargin
Margin in percentage for Eye Mask [-1.0 to 1.0]
Default:
0
dBitRate
Bit Rate, must be specified
Default:
2.5e9
dAttn
Attenuation factor in dB, this is provided to allow the
results to be scaled to compensate for external attenuation
from sources such as probes.
Default:
0
lGood
Flag indicates valid data in structure
d1stEdge
Used internally, DO NOT ALTER!
dNrmPkpk
Vpp for normal Channel scope data
dCmpPkpk
Vpp for complimentary Channel scope data
dDifPkpk
Vpp for differential Channel scope data
qNorm
Normal channel quantities
qComp
Complimentary channel quantities
qDiff
Differential channel quantities
tNrmScop
Normal channel voltage data, last pass only
tCmpScop
Complimentary channel voltage data, last pass only
tDifScop
Differential channel voltage data, last pass only
bNrmData, lNrmRsvd, bCmpData, lCmpRsvd, bDifData, lDifRsvd for internal use
only, DO NOT ALTER or try to use.
lInps
©WAVECREST Corporation 2005
SECTION 2 – Measurement Commands and Structures 71
void __stdcall FCNL_DefFeye ( FEYE *feye )
This function is used to fill the feye structure for the Folded Eye tool with reasonable default values. It is
recommended that this function be called initially even if parameters within the structure are to be adjusted
manually, and may be called repeatedly to reestablish initial conditions; however, this will impact test time.
Before calling this function, zero out the FEYE structure using the standard memset() function to ensure that any
information pertaining to dynamic memory allocation is cleaned out prior to using the structure.
INPUTS
feye - Pointer to a FEYE structure. Memory needs to be allocated by the caller.
OUTPUTS
None.
void __stdcall FCNL_ClrFeye ( FEYE *feye )
This function frees any dynamic memory that may have been allocated during previous data acquisitions and clears
out the feye structure.
INPUTS
feye - Pointer to a FEYE structure. Memory needs to be allocated by the caller.
OUTPUTS
None.
EXAMPLE
static FEYE feye;
72
memset ( &feye, 0, sizeof ( FEYE ) );
FCNL_DefFeye ( &feye);
//declare feye to a structure of type
//FEYE
//clear the memory for FEYE structure
//set FEYE structures to default values
FCNL_RqstPkt ( ApiDevId, &feye, WIND_FEYE );
FCNL_RqstAll ( ApiDevId, &feye, WIND_FEYE );
//execute the measurement.
//get plot data
FCNL_ClrFeye ( &feye);
//deallocate the structure
Section 2 – Measurement Commands and Structures
©WAVECREST Corporation 2005
2-26 HIGH FREQUENCY MODULATION ANALYSIS TOOL
The High Frequency Modulation Analysis Tool is used typically for frequency analysis of noise on
clock and clock-like signals (101010…). The controls for the tool deal primarily with measurement
setup, corner frequency selection and normalization technique.
1
Signal
2
3
4
n
n+1
Accum 1
Accum 2
Accum n
This tool will take several randomly selected time measurements using Accumulated Time Analysis
(ATA). The data can be displayed in the time domain (accumulated jitter versus time) or in the
frequency domain (jitter versus frequency). This latter plot is used to identify spectral peaks in the
noise which may indicate modulation and can typically be attributed to crosstalk or EMI effects.
The Jitter Analysis Tool can be set up to calculate RJ and DJ of a clock signal over a specified
frequency band (typically the corner frequency to ½ the clock rate) and separate the DJ by frequency
content. The DJ measured in this tool is strictly Periodic Jitter.
typedef struct
{
/* Input parameters */
PARM
tParm;
FFTS
tFfts;
long
lIncStop;
long
lMaxStop;
long
lAutoFix;
long
lPad1;
double dCornFrq;
double dRjpjFmn;
double dRjpjFmx;
long
lFftAvgs;
/* Output parameters */
long
lGood;
double
double
dWndFact1Clk;
dWndFactNClk;
PLTD
tSigm;
PLTD
tPeak;
PLTD
tFft1;
double dPjit1Clk;
double dRjit1Clk;
long
*lPeakData1Clk;
long
lPeakNumb1Clk;
long
lPeakRsvd1Clk;
long
lPad2;
PLTD
tFftN;
double dPjitNClk;
double dRjitNClk;
long
*lPeakDataNClk;
long
lPeakNumbNClk;
long
lPeakRsvdNClk;
long
lPad3;
double dFreq;
} JITT;
©WAVECREST Corporation 2005
/*
/*
/*
/*
/*
Contains acquisition parameters
FFT window and analysis parameters
Increase stop count by this value
Maximum stop count to collect data
If true calculate the above parameters
*/
*/
*/
*/
*/
/*
/*
/*
/*
Corner Frequency for RJ+PJ
Minimum integration limit for RJ+PJ
Maximum integration limit for RJ+PJ
2^fft_avgs averages used to smooth FFT
*/
*/
*/
*/
/* Flag indicates valid data in structure */
/******************************************/
/* These values are used internally
*/
/*
DO NOT ALTER!
*/
/******************************************/
/* Contains the 1-Sigma plot array
*/
/* Contains the ( max - min ) plot array */
/* Frequency plot data on 1-clock basis
*/
/* Periodic jitter on 1-clk basis
*/
/* Random jitter on 1-clk basis
*/
/* Tracks detected spikes in RJ+PJ data
*/
/* Count of detected spikes
*/
/* Used to track memory allocation
*/
/*
/*
/*
/*
/*
/*
Frequency plot data on N-clock basis
Periodic jitter on N-clk basis
Random jitter on N-clk basis
Tracks detected spikes in RJ+PJ data
Count of detected spikes
Used to track memory allocation
/* Carrier frequency
*/
*/
*/
*/
*/
*/
*/
SECTION 2 – Measurement Commands and Structures 73
tParm
tFfts
lIncStop
lMaxStop
lAutoFix
dCornFrq
dRjpjFmn
dRjpjFmx
lFftAvgs
74
A structure of type PARM that contains acquisition parameter.
tParm is discussed in full detail in Section 2-4.
A structure of type FFTS that contains the setup parameters
for the FFT. See Section 2-10 for further details on FFTS
structures.
Timing resolution of Accumulated Time Analysis. This value
will define the highest frequency component that will be
observed (low-pass filter function approximated by a brick
wall)
Valid Entries: tParm.lStopCnt to lMaxStop.
Default:
1
Maximum number of accumulated periods to acquire. This value
defines the low frequency cut off for this measurement. The
larger this number is, the more lower-frequency modulation
content can be observed. Furthermore, the larger this number
is, the more data that is taken and the longer the test time.
Valid Entries: tParm.StopCnt to 10,000,000
Default:
256
Flag to indicate whether to use dCornFrq or lMaxStop to indicate
the low-frequency cutoff. If the value is of this parameter is
greater than zero, dCornFrq will be used to calculate the stop
count. If this parameter is equal to zero, lMaxStop will be
used.
Valid Entries: 0 – no pulsefind prior to measurement
1 –pulsefind if the measurement mode changed.
Default:
0
Corner Frequency for RJ & PJ estimate in Hertz. This value is
used in conjunction with the measured clock frequency (FCM) to
determine the maximum number of accumulated periods used to
acquire. A lower value increases acquisition time while
capturing more low frequency data.
Valid Entries: FCM /10,000,000 to FCM
I
Default:
637e3
(637kHz – Fibre Channel 1X)
High-pass digital filter function in Hertz for calculating RJ
and DJ. A negative value disables filter. The accuracy of low
frequency modulation measurements can be improved by setting
the measurement corner frequency lower than the desired corner
frequency and then using this filter for the RJ and PJ
estimate.
Valid Entries: -1 to dCornFreq or Clock Frequency ÷ lMaxStop
Default:
-1
Low-pass Digital filter function in Hertz for calculating RJ
and DJ. A negative value disables filter. This filter is used
as a post-processing filter applied to the measured data to
limit high frequency information present in the data when
calculating RJ-DJ estimate.
Valid Entries: -1 to Clock Frequency ÷ lIncStop
Default:
-1
This variable is used to calculate the number of averages to
use in the FFT. Increasing the number of averages reduces the
background noise associated with the FFT algorithm. The number
of averages is calculated based on the equation:
AVERAGES = 2n
where
n = lFftAvgs
Valid Entries: any integer greater than or equal to 0
Default:
0 (indicating 20 averages = 1 execution.)
Section 2 – Measurement Commands and Structures
©WAVECREST Corporation 2005
lGood
Flag indicates valid output data in structure. A positive
value in this parameter indicates that the measurement was
completed successfully, and, valid data can be extracted from
this structure.
dWndFact1Clk, dWndFactNClk These values are for internal use only, DO NOT
ALTER or try to use.
tSigm
A structure of type PLTD containing the 1-Sigma plot array.
This plot is used to observe the standard deviation (1σ) of
accumulated jitter versus time. See Section 2-3 for details of
the PLTD structure elements.
tPeak
A structure of type PLTD containing the peak-to-peak
Accumulated jitter versus time plot array. See Section 2-3 for
details of the PLTD structure elements.
tFft1
A structure of type PLTD containing the Accumulated jitter
versus frequency with amplitudes normalized to their effect on
1-clock. This is sometimes referred to as accumulated period
jitter. See Section 2-3 for details of the PLTD structure
elements.
dPjit1Clk
Amplitude of the largest spectral component in the normalized
accumulated jitter versus frequency (1-clock PJ estimate).
dRjit1Clk
Random jitter calculated based on filter functions (if
enabled) and Normalized Accumulated Jitter versus frequency
plot (RJ as a function of 1-clock FFT).
lPeakData1Clk For internal use only, DO NOT ALTER or attempt to interpret.
lPeakNumb1Clk Count of detected spikes observed in the normalized
Accumulated Jitter versus frequency plot. (spectral peaks in
1-clock FFT)
lPeakRsvd1Clk for internal use only, DO NOT ALTER or try to use.
tFftN
A structure of type PLTD containing the Accumulated Jitter
versus Frequency plot data. The amplitudes show the total
amplitude of the modulation and is referred to as “N-clock”
mode in reference to edge deviation due to a given modulation
tone relative to an ideal clock. This is sometimes referred to
as accumulated edge jitter. See Section 2-3 for details of the
PLTD structure elements.
dPjitNClk
Amplitude of the largest spectral component in the accumulated
jitter versus frequency plot. (N-clock PJ estimate).
dRjitNClk
Random jitter calculated based on filter functions (if
enabled) and Accumulated Jitter versus frequency plot (RJ as a
function of n-clock FFT).
lPeakDataNClk For internal use only, DO NOT ALTER or attempt to interpret.
lPeakNumbNClk Count of detected spikes observed in the accumulated jitter
versus frequency plot. (spectral peaks in n-clock FFT)
lPeakRsvdNClk for internal use only, DO NOT ALTER or try to use.
dFreq
Measured clock frequency.
©WAVECREST Corporation 2005
SECTION 2 – Measurement Commands and Structures 75
void __stdcall FCNL_DefJitt ( JITT *jitt )
This function is used to fill the jitt structure for the High Frequency Modulation tool with reasonable default values.
It is recommended that this function be called initially even if parameters within the structure are to be adjusted
manually, and may be called repeatedly to reestablish initial conditions; however, this will impact test time.
Before calling this function, zero out the JITT structure using the standard memset() function to ensure that any
information pertaining to dynamic memory allocation is cleaned out prior to using the structure.
INPUTS
jitt - Pointer to a JITT structure. Memory needs to be allocated by the caller.
OUTPUTS
None.
void __stdcall FCNL_ClrJitt ( JITT *jitt )
This function frees any dynamic memory that may have been allocated during previous data acquisitions and clears
out the jitt structure.
INPUTS
jitt - Pointer to a JITT structure. Memory needs to be allocated by the caller.
OUTPUTS
None.
EXAMPLE
#define TRUE 1
static JITT hfm;
memset ( &hfm, 0, sizeof ( JITT ) );
FCNL_DefJitt ( &hfm);
hfm.tparm.lChanNum = 1;
hfm.tparm.lSampCnt = 500;
hfm.lAutoFix
hfm.dCornFrq
FCNL_RqstPkt
FCNL_RqstAll
=
=
(
(
TRUE;
2e6;
ApiDevId, &hfm, WIND_JITT );
ApiDevId, &hfm, WIND_JITT );
FCNL_ClrJitt ( &hfm);
76
Section 2 – Measurement Commands and Structures
//declare hfm to be a structure of
//type JITT
//clear the memory for hfm structure
//set hfm structure to default values
//NOTE: hfm.tparm & hfm.tFfts
//are also set to defaults by this
//command.
//perform measurement on CH1
//measure 500 different samples per
//accumulated edge
//use dCornFrq instead of lMaxStop
//set corner frequency to 2MHz
//execute the measurement.
//get plot data
//deallocate the structure
©WAVECREST Corporation 2005
2-27 HISTOGRAM TOOL
The histogram tool is used for displaying the statistical distribution of a given measurement.
Measurements made with this tool are limited to repetitive signal measurements such as clock period,
duty cycle, pulse width, rise time, fall time, propagation delay and frequency. This tool is typically used
for displaying the statistical distribution of thousands of measurements. Important distribution
parameters can be calculated based on the data including: RMS, peak to peak, Random Jitter (RJ),
Deterministic Jitter (DJ) and Total Jitter (TJ).
typedef struct
{
/* Input parameters
PARM
tParm;
double dUnitInt;
long
lPassCnt;
long
lErrProb;
*/
long
long
long
long
long
long
long
long
double
double
long
long
lTailFit;
lForcFit;
lMinHits;
lFndEftv;
lMinEftv;
lMaxEftv;
lAutoFix;
lKeepOut;
dKpOutLt;
dKpOutRt;
lPad0;
lGood;
/*
/*
/*
/*
/*
/*
/*
/*
/*
/*
/*
/*
/*
/*
/*
/*
/*
long
long
double
double
double
double
lPad1;
lNormCnt;
dNormMin;
dNormMax;
dNormAvg;
dNormSig;
/*
/*
/*
/*
/*
Number of hits in normal edge data
Minimum value in normal edge data
Maximum value in normal edge data
Average value of normal edge data
1-Sigma value of normal edge data
long
long
double
double
double
double
lPad2;
lAcumCnt;
dAcumMin;
dAcumMax;
dAcumAvg;
dAcumSig;
/*
/*
/*
/*
/*
Number of hits in accumulated edge data*/
Minimum value in accumulated edge data */
Maximum value in accumulated edge data */
Average value of accumulated edge data */
1-Sigma value of accumulated edge data */
long
long
double
double
double
lBinNumb;
/******************************************/
lPad3;
/* These values are all used internally */
dLtSigma[PREVSIGMA];/*
as part of the measurement process
*/
dRtSigma[PREVSIGMA];/*
DO NOT ALTER!
*/
dFreq;
/******************************************/
PLTD
PLTD
PLTD
PLTD
PLTD
PLTD
PLTD
PLTD
TFIT
} HIST;
tNorm;
tAcum;
tMaxi;
tBath;
tEftv;
tShrt;
tLong;
tBoth;
tTfit;
©WAVECREST Corporation 2005
/*
/*
/*
/*
/*
/*
/*
/*
/*
Contains acquisition parameters
Unit Interval to assess Total Jitter
Acquisitions so far, set to 0 to reset
Error probability for Total Jitter
Valid range is ( -1 to -16 )
If non-zero a tail-fit will be tried
If non-zero use the force-fit method
Minimum hits before trying tail-fit
Flag to attempt effective jitter calc
Min probability for effective fit: -4
Max probability for effective fit: -12
If true perform a pulsefind as req'd
If non-zero use tailfit keep out below
Keep out value for left side
Keep out value for right side
Output parameters
Flag indicates valid data in structure
*/
*/
*/
*/
*/
*/
*/
*/
*/
*/
*/
*/
*/
*/
*/
*/
*/
*/
*/
*/
*/
*/
Histogram of previous acquisition
Histogram of all acquires combined
Histogram of max across all acquires
Bathtub curves determined from PDF
Effective Bathtub curves if enabled
Total Jitter for SHORT Cycles
Total Jitter for LONG Cycles
Total Jitter for LONG & SHORT Cycles
Structure containing tail-fit info
*/
*/
*/
*/
*/
*/
*/
*/
*/
SECTION 2 – Measurement Commands and Structures 77
tParm
A structure of type PARM that contains acquisition parameters.
tParm is discussed in full detail in Section 2-4.
dUnitInt
Unit Interval (UI) in seconds to assess Total Jitter as a
percent of UI. Set this parameter as the metric against which
TJ will be evaluated as a percentage. It is displayed as the
span of the x-axis in a bathtub curve. This parameter is only
used if tail-fit is enabled.
Valid Entries: any number greater than 0 which represents the
time (in seconds) of a bit period or unit interval.
Default:
1e-9
(1ns)
lPassCnt
This parameter is a bi-directional structure element that
tracks the number of acquisitions in the data set. This flag
can be read after an execution or set prior to an execution.
Setting this parameter to 0 essentially resets the accumulated
data on the instrument. The value in the returned structure
will be automatically incremented by the instrument.
Valid Entries: any integer greater than or equal to 0
Default:
0
lErrProb
Error probability level for Total Jitter. Total Jitter is
calculated based on the desired Error Probability level. This
value is used in conjunction with the bathtub curve after the
successful completion of a tail-fit in order to project the
value of Total Jitter.
Valid Entries: -1 to -16
Default:
-12
lTailFit
Flag to indicate whether to perform a TailFit on data in tAcum
data array. If non-zero, a tail-fit will be attempted on the
tAcum data array. The lGood element of the tTfit structure will
indicate if the TailFit was successful. Any positive interger
for this parameter will initiate the TailFit algorithm.
Valid Entries: 0 – disable TailFit
1 – enable TailFit
Default:
0
lForcFit
If non-zero uses the force-fit method. If set to zero, the
measurement will continue to loop until a reasonably accurate
TailFit can be achieved.
Valid Entries: 0 – do not use force fit.
1 – force a fit using lMinHits number of hits.
Default:
0
lMinHits
Minimum hits before attempting a tail-fit in 1000's; the
default is 50. The larger the number the more likely a valid
tailfit will be found.
Valid Entries: any integer ≥ 50
Default:
50
lFndEftv
Flag to indicate that an effective jitter calculation is to be
attempted. This is necessary for those instances in which
correlation to a BERT scan is necessary. In all other
practical applications, this parameter and it’s resultant
measurement should be ignored.
Valid Entries: 0 – do not estimate effective jitter values
1 – calculate effective jitter values
Default:
0
lMinEftv, lMaxEftv Defines the range of the bathtub curve that is to be used
to calculate an effective jitter value.
Valid Entries: -1 to –16 with lMinEftv < lMaxEftv
Default:
-4 for MaxEftv and –12 for MinEftv
78
Section 2 – Measurement Commands and Structures
©WAVECREST Corporation 2005
lAutoFix
Flag indicating whether to perform a pulse-find as required.
Setting this value to any integer greater than zero tells the
measurement to perform a pulse find if needed. The system will
know if a measurement was recently performed and if a pulse
find is necessary.
Valid Entries: 0 – no pulsefind prior to measurement
1 –pulsefind if the measurement mode changed.
Default:
0
lGood
Flag indicates valid output data in structure. This parameter
does not indicate success of TailFit measurement only whether
a valid time measurement was performed and valid measurement
data was placed in tNorm, tAcum and tMaxi.
lNormCnt
Number of measurements in tNorm plot array.
dNormMin, dNormMax
Minimum and maximum values in tNorm plot array.
dNormAvg
Average value of distribution in tNorm plot array.
dNormSig
Standard Deviation (1-Sigma (1σ)) value of distribution in
tNorm plot array.
lAcumCnt
Number of hits of distribution in tAcum plot array.
dAcumMin, dAcumMax
Minimum and maximum values of distribution in
tAcum plot array.
dAcumAvg
Average value of distribution in tAcum plot array.
dAcumSig
1-Sigma value of distribution in tAcum plot array.
lBinNumb, dLtSigma, dRtSigma These values are for internal use only, DO
NOT ALTER or try to use.
tNorm
A structure of type PLTD containing a Histogram of data from
latest acquisition only. See Section 2-3 for further details
on PLTD structures.
tAcum
A structure of type PLTD containing Histogram of data from all
acquisitions combined. See Section 2-3 for further details on
PLTD structures.
tMaxi
A structure of type PLTD containing Histogram with the maximum
value obtained for every particular bin across all of the
acquisitions performed so far. See Section 2-3 for further
details on PLTD structures.
tBath
A structure of type PLTD containing Bathtub curves determined
from PDF, only valid when a successful tail-fit has been
performed. See Section 2-3 for further details on PLTD
structures.
tEftv
A structure of type PLTD containing Effective Bathtub curves
if lFndEftv is set and a valid fit is obtained. Effective Bathtub
curves are used for correlation to BERT scan only. See Section
2-3 for further details on PLTD structures.
tTfit
A structure of type TFIT containing tail-fit info; only valid
when a successful tail-fit has been performed. See end of
chapter for additional details. See Section 2-3 for further
details on TFIT structures.
©WAVECREST Corporation 2005
SECTION 2 – Measurement Commands and Structures 79
void __stdcall FCNL_DefHist ( HIST *hist )
This function is used to fill the hist structure for the Histogram tool with reasonable default values. It is
recommended that this function be called initially even if parameters within the structure are to be adjusted
manually, and may be called repeatedly to reestablish initial conditions; however, this will impact test time.
Before calling this function, zero out the HIST structure using the standard memset() function to ensure that any
information pertaining to dynamic memory allocation is cleaned out prior to using the structure.
INPUTS
hist - Pointer to a HIST structure. Memory needs to be allocated by the caller.
OUTPUTS
None.
void __stdcall FCNL_ClrHist ( HIST *hist )
This function frees any dynamic memory that may have been allocated during previous data acquisitions and clears
out the hist structure.
INPUTS
hist - Pointer to a HIST structure. Memory needs to be allocated by the caller.
OUTPUTS
None.
EXAMPLE
#define TRUE 1
static HIST histogram;
//declare histogram to be a structure of
//type HIST
memset ( &histogram, 0, sizeof ( HIST ) );
//clear the memory for histogram str.
FCNL_DefHist ( &histogram);
//set histogram structures to default
//values
histogram.tparm.lChanNum = 1;
//capture waveform on channel 1
histogram.tparm.lFuncNum = FUNC_PER;
//set measurement to be period
histogram.tparm.lStrtCnt = 1;
//measure from first edge to second
histogram.tparm.lStpCnt = 2;
//edge
histogram.tparm.lSampCnt = 10,000;
//measure 10,000 samples per burst
histogram.lPassCnt = 0;
//reset pass count to zero
histogram.lTailFit = TRUE;
//indicate TailFit desired
histogram.lMinHits = 50,000;
//don’t attempt a TailFit until at least
//50,000 measurements are
//accumulated
histogram.lAutoFix = TRUE;
//perform pulse find initially if needed.
FCNL_RqstPkt ( ApiDevId, &histogram, WIND_HIST );//execute the measurement.
FCNL_RqstAll ( ApiDevId, &histogram, WIND_HIST );//get plot data
FCNL_ClrHist ( &histogram);
80
Section 2 – Measurement Commands and Structures
//deallocate the structure
©WAVECREST Corporation 2005
2-28 INFINIBAND TOOL
This tool is similar to the Random Data With Bitclock Tool, but also provides voltage information.
typedef struct
{
/* Input parameters */
long
lVoff;
long
lPad1;
double dAttn;
EYEH
tEyeh;
/* Output parameters */
long
lGood;
long
lPad2;
PLTD
tNrmScop;
PLTD
tCmpScop;
PLTD
tDifScop;
PLTD
tComScop;
} INFI;
lVoff
dAttn
tEyeh
lGood
tNrmScop
tCmpScop
tDifScop
tComScop
/* Offset voltage used for scope acquire
*/
/* Attenuation factor (dB)
/* EYEH structure holds most information
*/
*/
/* Flag indicates valid data in structure */
/*
/*
/*
/*
Normal channel voltage data
Complimentary channel voltage data
Differential voltage data
Common (A+B) voltage data
*/
*/
*/
*/
Offset voltage used for scope acquire, specified in mV
Attenuation factor in dB, this is provided to allow the
results to be scaled to compensate for external attenuation
from sources such as probes.
Default:
0
This is the same structure as is defined in the Random Data
With Bitclock tool. It contains all the acquisition parameters
and all the output results associated with this measurement,
with the exception of those defined directly above.
Default:
See Random Data With Bitclock Tool
Flag indicates valid data in structure
Normal channel voltage data
Complimentary channel voltage data
Differential voltage data
Common (A+B) voltage data
void __stdcall FCNL_DefInfi ( INFI *infi )
This function is used to fill the infi structure for the Infiniband Compliance tool with reasonable default values. It is
recommended that this function be called initially even if parameters within the structure are to be adjusted
manually, and may be called repeatedly to reestablish initial conditions; however, this will impact test time.
Before calling this function, zero out the INFI structure using the standard memset() function to ensure that any
information pertaining to dynamic memory allocation is cleaned out prior to using the structure.
INPUTS
infi - Pointer to a INFI structure. Memory needs to be allocated by the caller.
OUTPUTS
None.
©WAVECREST Corporation 2005
SECTION 2 – Measurement Commands and Structures 81
void __stdcall FCNL_ClrInfi ( INFI *infi )
This function frees any dynamic memory that may have been allocated during previous data acquisitions and clears
out the infi structure.
INPUTS
infi - Pointer to a INFI structure. Memory needs to be allocated by the caller.
OUTPUTS
None.
EXAMPLE
static INFI iband;
82
memset ( &iband, 0, sizeof ( INFI ) );
FCNL_DefInfi ( &iband);
//declare iband to a structure of type
//INFI
//clear the memory for iband structure
//set iband structures to default values
FCNL_RqstPkt ( ApiDevId, &iband, WIND_INFI );
FCNL_RqstAll ( ApiDevId, &iband, WIND_INFI );
//execute the measurement.
//get plot data (including tEyeh)
FCNL_ClrInfi ( &iband);
//deallocate the structure
Section 2 – Measurement Commands and Structures
©WAVECREST Corporation 2005
2-29 LOCKTIME ANALYSIS TOOL
typedef struct
{
/* Input parameters
PARM
tParm;
FFTS
tFfts;
long
lIncStrt;
long
lMaxStrt;
long
lAnlMode;
*/
long
lAutoFix;
long
lSpanCnt;
long
lDataPts;
/* Output parameters */
long
lGood;
long
lPad1;
PLTD
tTime;
PLTD
tDerv;
PLTD
tFftT;
PLTD
tFftD;
PLTD
tSigm;
PLTD
tPeak;
PLTD
tMini;
PLTD
tMaxi;
double dSigmAvg;
double dSigmMin;
double dSigmMax;
/*
/*
/*
/*
/*
/*
/*
/*
/*
/*
/*
Contains acquisition parameters
FFT window and analysis parameters
Increase start count by this value
Maximum start count to collect data
Relationship of start and stop counts
Use one of: ANL_FNC_FIRST
ANL_FNC_PLUS1
ANL_FNC_START
If true calculate the above parameters
The span across which to measure
The data points within span to measure
/*
/*
/*
/*
/*
/*
/*
/*
/*
/*
/*
Time domain plot data
*/
1st derivative of time domain plot data*/
Frequency domain plot data
*/
Frequency domain of 1st derivative
*/
Contains the 1-Sigma plot array
*/
Contains the ( max - min ) plot array */
Contains the Minimum plot array
*/
Contains the Maximum plot array
*/
Average 1-Sigma value
*/
Minimum 1-Sigma value
*/
Maximum 1-Sigma value
*/
dTimePos;
dTimeNeg;
lTimePosLoc;
lTimeNegLoc;
/*
/*
/*
/*
Maximum increase between time
Maximum decrease between time
Index to max increase between
Index to max decrease between
double
double
long
long
dDervPos;
dDervNeg;
lDervPosLoc;
lDervNegLoc;
/*
/*
/*
/*
Maximum increase between 1st deriv's
Maximum decrease between 1st deriv's
Index to max incr. between 1st deriv's
Index to max decr. between 1st deriv's
©WAVECREST Corporation 2005
*/
*/
*/
*/
*/
*/
*/
*/
*/
*/
*/
/* Flag indicates valid data in structure */
double
double
long
long
double dFreq;
} FUNC;
2+2*inc
1+2*inc
2+inc
1+inc
The Locktime Analysis tool is used to analyze timing Trigger
measurement variation as a function of location in pattern.
This is important when measuring periods, pulse widths, slew
1
2
rates and propagation delay right after an event such as a
Signal
reset, power-up, data bus read/write, chip enable, ref clock
enable etc. Common measurements include PLL lock time
Per 1
and cross talk sensitivity to specific functionalities occurring
Per 2
on the DUT. The Locktime Analysis Tool makes several
Per 3
measurements of the same event after a trigger and then can
increment to the next event. For example, a period measurement could be made on the first clock
pulse after a trigger occurs. This measurement could be made hundreds of times. Then, this tool
automatically will increment to the next clock period and measure that one hundred times. This is
repeated for as many sequential periods as desired. The increment and the number of measurements
is programmed by the user.
/* Carrier frequency
values
values
values
values
*/
*/
*/
*/
*/
*/
*/
*/
*/
SECTION 2 – Measurement Commands and Structures 83
tParm
tFfts
lIncStrt
lMaxStrt
lAnlMode
lAutoFix
lSpanCnt
lDataPts
lGood
tTime
tDerv
tFftT
84
A structure of type PARM that contains acquisition parameter.
The PARM structure is discussed in full detail in Section 2-4.
A structure of type FFTS that contains the setup parameters
for the FFT. See Section 2-10 for further details on FFTS
structures.
Resolution of successive time measurements. This parameter
defines the number edges to skip between successive
measurements. Increase start count by this value, the default
is 1. Data is collected for start counts ranging from
tParm.lStrtCnt to lMaxStrt.
Valid Entries: 1 to lMaxStrt
Default:
1
Maximum start count used. The start count will be incremented
from the value in tParm.lStrtCnt to lMaxStrt in step size of lIncStrt.
Valid Entries: tParm.StrtCnt to 10,000,000
Default:
250
Relationship of start and stop counts. In general, this
measurement is done either on a single channel measuring
successive cycles’ slew rate, period or pulse width. As such,
the stop count will always be either equal to the start count
or one more than the start count in the case of period
measurements.
Valid Entries: ANL_FNC_PLUS1
Stop Count = Start Count + 1
Use this for period measurements
ANL_FNC_START Stop Count = Start Count
Use this for skew, slew rate and
pulse width
Default:
ANL_FNC_PLUS1
If set to 1, calculate the number of measurements skipped and
the total number of measurements based on lSpanCnt and
lDataPts plus information measured on the live data signal.
Valid Entries: 0 use lMaxStrt, tParm.lStrtCnt & lIncStrt to
calculate the stop counts for each
measurement.
1 use lSpanCnt, DataPts and measured data from
signal to calculate the stop counts for each
measurement.
Default:
0
The total number of edges across which to measure. This is the
maximum delay count for a measurement and is synonymous with
lMaxStrt.
Valid Entries: 1 to 10,000,000-tParm.StrCnt
Default:
1000
The total data points within span to measure. If every data
point is to be measured such that the start and stop counters
are incremented by one, then lDataPts must equal lSpanCnt. The
Valid Entries: 1 to lSpanCnt
Default:
100
Flag indicates valid output data in structure.
A structure of type PLTD containing the time domain plot data.
See Section 2-3 for details on the PLTD structure elements.
A structure of type PLTD containing 1st derivative of time
domain plot data. See Section 2-3 for details on the PLTD
structure elements.
A structure of type PLTD containing Frequency domain plot
data. See Section 2-3 for details on the PLTD structure
elements.
Section 2 – Measurement Commands and Structures
©WAVECREST Corporation 2005
tFftD
A structure of type PLTD containing Frequency domain of 1st
derivative plot data. See Section 2-3 for details on the PLTD
structure elements.
tSigm
A structure of type PLTD containing 1-Sigma plot array. See
Section 2-3 for details on the PLTD structure elements.
tPeak
A structure of type PLTD containing the ( max - min ) plot
array. See Section 2-3 for details on the PLTD structure
elements.
tMini
A structure of type PLTD containing the Minimum plot array.
See Section 2-3 for details on the PLTD structure elements.
tMaxi
A structure of type PLTD containing the Maximum plot array.
See Section 2-3 for details on the PLTD structure elements.
dSigmAvg
Average 1-Sigma value.
dSigmMin
Minimum 1-Sigma value.
dSigmMax
Maximum 1-Sigma value.
dTimePos
Maximum increase between time values.
dTimeNeg
Maximum decrease between time values.
lTimePosLoc Index to maximum increase between values.
lTimeNegLoc Index to maximum decrease between values.
dDervPos
Maximum increase between 1st derivative values.
dDervNeg
Maximum decrease between 1st derivative values.
lDervPosLoc Index to maximum increase between 1st derivative values.
lDervNegLoc Index to maximum decrease between 1st derivative values.
dFreq
Carrier frequency.
void __stdcall FCNL_DefFunc ( FUNC *func )
This function is used to fill the func structure for the Locktime tool with reasonable default values. It is
recommended that this function be called initially even if parameters within the structure are to be adjusted
manually, and may be called repeatedly to reestablish initial conditions; however, this will impact test time.
Before calling this function, zero out the FUNC structure using the standard memset() function to ensure that any
information pertaining to dynamic memory allocation is cleaned out prior to using the structure.
INPUTS
func - Pointer to a FUNC structure. Memory needs to be allocated by the caller.
OUTPUTS
None.
©WAVECREST Corporation 2005
SECTION 2 – Measurement Commands and Structures 85
void __stdcall FCNL_ClrFunc ( FUNC *func )
This function frees any dynamic memory that may have been allocated during previous data acquisitions and clears
out the func structure.
INPUTS
func - Pointer to a FUNC structure. Memory needs to be allocated by the caller.
OUTPUTS
None.
EXAMPLE
#define TRUE 1
static FUNC funcAnal;
memset ( &funcAnal, 0, sizeof ( FUNC ) );
FCNL_DefFunc ( &funcAnal);
funcAnal.tparm.lChanNum = 1;
funcAnal.tparm.lSampCnt = 500;
funcAnal.lIncStrt = 1;
funcAnal.lMaxStrt = 1000;
//declare funcAnal to be a structure of
//type FUNC
//clear the memory for funcAnal structure
//set funcAnal structure to default values
//NOTE: funcAnal.tparm & funcAnal.tFfts
//are also set to defaults by this
//command.
//perform measurement on CH1
//measure 500 different samples per
//offset from trigger
//set increment between successive
//period measurements to 1
//Capture all period measurements
//after the trigger up to and including
//the period 1000 cycles after the
//trigger.
FCNL_RqstPkt ( ApiDevId, & funcAnal, WIND_FUNC );
FCNL_RqstAll ( ApiDevId, & funcAnal, WIND_FUNC );
FCNL_ClrFunc ( &funcAnal);
86
Section 2 – Measurement Commands and Structures
//execute the measurement.
//get plot data
//deallocate the structure
©WAVECREST Corporation 2005
2-30 LOW FREQUENCY MODULATION ANALYSIS TOOL
1 st M eas.
2 nd M eas.
n* Fc/lMaxFreq +TParm.lStopCnt
n* Fc/lMaxFreq +TParm.lStrtCnt
Fc/lMaxFreq +TParm.lStopCnt
Fc/lMaxFreq +TParm.lStrtCnt
TParm.lStrtCnt
S ign al (F c )
TParm.lStopCnt
The Low Frequency Modulation Analysis tool is used to analyze low frequency modulation on clock
signals. It uses its internal time stamp capability to identify when a given measurement is made. This
tool combines the actual time measurements with the relative time each measurement was made to
identify low frequency modulation components. This tool can be used for modulation frequencies
below 120kHz.
n th M eas.
F c /lM axFreq
typedef struct
{
/* Input parameters */
PARM
tParm;
FFTS
tFfts;
long
lAutoFix;
long
lPad1;
double dMaxFreq;
long
lFftAvgs;
/* Output parameters */
long
lGood;
PLTD
tTime;
PLTD
tStmp;
PLTD
tFft1;
PLTD
tFftN;
double dCarFreq;
double dSmpRate;
double dFftNdBc;
} TDIG;
tParm
tFfts
lAutoFix
/* Contains acquisition parameters
*/
/* FFT window and analysis parameters
*/
/* If true calculate the above parameters */
/* Maximum Frequency that is desired
*/
/* 2^fft_avgs averages used to smooth FFT */
/*
/*
/*
/*
/*
/*
/*
/*
Flag indicates valid data in structure
Time domain plot data
Time stamp array, not normally plotted
Frequency plot data on 1-clock basis
Frequency plot data on N-clock basis
Carrier frequency
Sampling rate
dBc assessed on 1-clock FFT data
*/
*/
*/
*/
*/
*/
*/
*/
A structure of type PARM that contains acquisition parameters.
The PARM structure is discussed in full detail in Section 2-4.
tParm.lStampTm is enabled for this tool by default. All other
defaults listed in Section 2-4 apply.
A structure of type FFTS that contains the FFT setup parameters
such as window type and padding factor. See Section 2-10 for
further details.
This tool uses tParm.lSampCnt to define the number of
measurements to make and the span of tParm.lStrCnt to tParm.lStopCnt
to define the maximum frequency observed in the FFT plots. If
this structure element is set to 1, then tParm.StrCnt and
©WAVECREST Corporation 2005
SECTION 2 – Measurement Commands and Structures 87
dMaxFreq
lFftAvgs
lGood
tTime
tStmp
tFft1
tFftN
dCarFreq
dSmpRate
dFftNdBc
tParm.lStopCnt will be calculated based on dMaxFreq plus
information measured on the live data signal.
Valid Entries: 0 – use tParm data
1 – calculate tParm data using dMaxFreq
Default:
0
Maximum Frequency information that is desired.
This variable is used to calculate the number of averages to
use in the FFT. Increasing the number of averages reduces the
background noise associated with the FFT algorithm. The number
of averages is calculated based on the equation:
AVERAGES = 2n
where
n = lFftAvgs
Valid Entries: any integer greater than or equal to 0
Default:
0 (indicating 20 averages = 1 execution.)
Flag to indicate valid output data is in structure.
A structure of type PLTD containing the time domain plot data.
See Section 2-3 for details on the PLTD structure elements.
A structure of type PLTD containing time stamp data plot data.
This is not normally plotted. See Section 2-3 for details on
the PLTD structure elements.
A structure of type PLTD containing the Frequency plot data
with frequency amplitude roll off of 20dB/decade from the
sampling Nyquist Frequency. This plot is typically used for
debug purposes only. See Section 2-3 for details on the PLTD
structure elements.
A structure of type PLTD containing the Frequency plot data
with amplitudes representing the cumulative effect of the
frequency component. See Section 2-3 for details on the PLTD
structure elements.
Carrier frequency.
Sampling rate.
dBc assessed on 1-clock FFT data.
void __stdcall FCNL_DefTdig ( TDIG *tdig )
This function is used to fill the tdig structure for the Low Frequency Modulation tool with reasonable default values. It
is recommended that this function be called initially even if parameters within the structure are to be adjusted manually,
and may be called repeatedly to reestablish initial conditions; however, this will impact test time.
Before calling this function, zero out the TDIG structure using the standard memset() function to ensure that any
information pertaining to dynamic memory allocation is cleaned out prior to using the structure.
INPUTS
tdig - Pointer to a TDIG structure. Memory needs to be allocated by the caller.
OUTPUTS
None.
88
Section 2 – Measurement Commands and Structures
©WAVECREST Corporation 2005
void __stdcall FCNL_ClrTdig ( TDIG *tdig )
This function frees any dynamic memory that may have been allocated during previous data acquisitions and clears
out the tdig structure.
INPUTS
tdig - Pointer to a TDIG structure. Memory needs to be allocated by the caller.
OUTPUTS
None.
EXAMPLE
#define TRUE 1
static TDIG TimDig;
memset ( &TimDig, 0, sizeof ( TDIG ) );
FCNL_DefTdig ( &TimDig);
TimDig.tParm.lChanNum
TimDig.tparm.lStrtCnt
TimDig.tParm.lStopCnt
TimDig.tParm.lSampCnt
=
=
=
=
1;
1;
10000;
100000;
TimDig.lFftAvgs = 3;
FCNL_RqstPkt ( ApiDevId, & TimDig, WIND_TDIG );
FCNL_RqstAll ( ApiDevId, & TimDig, WIND_TDIG );
FCNL_ClrTdig ( &TimDig);
©WAVECREST Corporation 2005
//declare timDig to be a structure of
//type TDIG
//clear the memory for timDig structure
//set timDig structure to default values
//NOTE: timDig.tparm & timDig.tFfts
//are also set to defaults by this
//command.
//Set channel number to 1
//Measure from 1st rising edge
//to 10,000th rising edge for each meas.
//capture 100,000 measurements per
//pass
//Perform 23 passes or 8 total passes
//with which to average data in FFT.
//execute the measurement.
//get plot data
//deallocate the structure
SECTION 2 – Measurement Commands and Structures 89
2-31 OSCILLOSCOPE TOOL
The Oscilloscope Tool is typically used to view the waveform of a signal relative to a trigger. In a
diagnostic environment, this tool is essential when debugging any signal measurement challenge. In
a production environment, this capability is used to make voltage measurements on signals such as
amplitude, glitch energy, overshoot and undershoot. This section describes the structure used to
initiate a waveform capture. This is the original measurement window structure for conducting an
oscilloscope measurement, and was later replaced by the Scope Tool, but is still supported for legacy
operations.
typedef struct
{
/* Input parameters */
PARM
tParm;
FFTS
tFfts;
long
lStrt;
long
lStop;
long
lIncr;
/* Output parameters */
long
lGood;
PLTD
tTime[ POSS_CHNS
PLTD
tFreq[ POSS_CHNS
PLTD
tNorm[ POSS_CHNS
PLTD
tComp[ POSS_CHNS
} OSCI;
tParm
tFfts
lStrt
lStop
lIncr
lGood
tTime[n]
tFreq[n]
tNorm[n]
90
];
];
];
];
/*
/*
/*
/*
/*
Contains acquisition parameters
FFT window and analysis parameters
Start time (ps), 20,000 to 100,000,000
Stop time (ps), 20,000 to 100,000,000
Time increment (ps), minimum is 10
*/
*/
*/
*/
*/
/*
/*
/*
/*
/*
Flag indicates valid data in structure */
Time domain plot of voltage data
*/
Frequency domain plot of voltage data */
Normal channel voltage data (3000 only)*/
Complimentary voltage data (3000 only)*/
A structure of type PARM that contains acquisition parameter.
See Section 2-4 for further details concerning this structure.
A structure of type FFTS that contains setup parameters for
the FFT window. These parameters needs to be set if the user
is interested in capturing the spectrum analysis on the
waveform. See Section 2-10 for further details concerning this
structure.
Start time in picoseconds.
Valid Entries: (24,000 to 100,000,000)
Default:
24,000
Stop time in picoseconds
Valid Entries: (24,000 to 100,000,000)
Default:
100,000
Resolution of time base in picoseconds. Maximum Resolution is
equal to the window width (lStop - lStrt), such that only 2
data points would be captured.
Valid Entries: (10 to window width)
Default:
500
Flag indicates waveform capture was successful and valid
output data is in the structure.
A structure of type PLTD which contains the differential time
domain plot of voltage data for channel n. See Section 2-3 for
further details on PLTD structures.
A structure of type PLTD which contains the differential
frequency domain plot of voltage data for channel n. See
Section 2-3 for further details on PLTD structures.
A structure of type PLTD which contains the single ended time
domain plot of the positive channel voltage information for
channel n. See Section 2-3 for further details on PLTD
structures.
Section 2 – Measurement Commands and Structures
©WAVECREST Corporation 2005
tComp[n]
A structure of type PLTD which contains the single ended time
domain plot of the negative channel voltage information for
channel n. See Section 2-3 for further details on PLTD
structures.
void __stdcall FCNL_DefOsci ( OSCI *osci )
This function is used to fill the osci structure for the Oscilloscope tool with reasonable default values. It is
recommended that this function be called initially even if parameters within the structure are to be adjusted
manually, and may be called repeatedly to reestablish initial conditions; however, this will impact test time.
Before calling this function, zero out the OSCI structure using the standard memset() function to ensure that any
information pertaining to dynamic memory allocation is cleaned out prior to using the structure.
INPUTS
osci - Pointer to a OSCI structure. Memory needs to be allocated by the caller.
OUTPUTS
None.
void __stdcall FCNL_ClrOsci ( OSCI *osci )
This function frees any dynamic memory that may have been allocated during previous data acquisitions and clears
out the osci structure.
INPUTS
osci - Pointer to a OSCI structure. Memory needs to be allocated by the caller.
OUTPUTS
None.
EXAMPLE
static OSCI oscope;
memset ( &oscope, 0, sizeof ( OSCI ) );
FCNL_DefOsci ( &oscope);
//declare oscope to a structure of type
//OSCI
//clear the memory for oscope structure
//set oscope structures to default values
oscope.tparm.lChanNum
oscope.tparm.lOscTrig
oscope.tparm.lOscEdge
oscope.tparm.lFndPcnt
//capture waveform on channel 1
//trigger on channel 2
//trigger on rising edge of channel 2
//set trigger level at 50% point
=
=
=
=
1;
2;
EDGE_RISE;
PCNT_5050;
oscope.lStrt = 200;
oscope.lStop = 10,000;
oscope.lIncr = 10;
//start waveform capture at 200ps
//stop waveform capture at 10ns
//set resolution to 10ps (this means
//that there will be 980 points in
//oscope.tTime[1].data array
FCNL_RqstPkt ( ApiDevId, &oscope, WIND_OSCI );
FCNL_RqstAll ( ApiDevId, &oscope, WIND_OSCI );
//execute the measurement.
//get plot data
FCNL_ClrOsci ( &oscope);
©WAVECREST Corporation 2005
//deallocate the structure
SECTION 2 – Measurement Commands and Structures 91
2-32 PCI EXPRESS 1.1 WITH HARDWARE CLOCK RECOVERY TOOL
The PCI Express 1.1 with Hardware Clock Recovery Tool provides both timing and amplitude
compliance measurements using the SIA3000 Multirate Clock Recovery Option. This tool
accurately determines device performance by quantifying both random and deterministic jitter
components.
typedef struct
{
/* Input parameters */
long
lCompPnt;
long
lPcnt;
long
lHiRFmV;
long
lLoRFmV;
long
lIdleOk;
long
lPad0;
double dAttn;
RCPM
tRcpm;
/* Output parameters */
long
lGood;
long
lPad1;
double dEyeOffs;
double dXmnDiff;
double dXmxDiff;
double dVdiffPP;
double dVdRatio;
double dOpnEyeT;
double dMedEyeT;
double dOpnEyeT1M;
double dTranVolts;
double dDeemVolts;
double
double
double
double
double
double
double
double
dVcommonAc;
dVcommonDc;
dVcmDcActv;
dVcmIdleDc;
dVcmDcLine;
dVcmDcDpls;
dVcmDcDmin;
dVIdleDiff;
QTYS
qNorm;
QTYS
qComp;
PLTD
tNrmScop;
PLTD
tCmpScop;
char
*bTranEye;
long
lTranRsv;
char
*bDeemEye;
long
lDeemRsv;
} PCIM;
lCompPnt
92
/*
/*
/*
/*
/*
Compliance Point 0-RX 1-TX
Amount +/- 50% to calc. rise/fall time
Absolute rise/fall voltage if lPcnt<0
Absolute rise/fall voltage if lPcnt<0
Common mode idle voltages are valid
/* Attenuation factor (dB)
/* Contains acquisition parameters
*/
*/
*/
*/
*/
*/
*/
/* Flag indicates valid data in structure */
/*
/*
/*
/*
/*
/*
/*
Pk-pk differential voltage
De-emphaisis voltage ratio
Eye opening
Median to max jitter
Eye opening @ 10^-6 BER
Vpp for Transition Eye
Vpp for De-Emphasis Eye
*/
*/
*/
*/
*/
*/
*/
/*
/*
/*
/*
/*
/*
/*
/*
V?x-cm-acp
V?x-cm-dc
V?x-cm-dc-active-idle-delta
V?x-cm-idle-dc
V?x-cm-dc-line-delta
V?x-cm-dc-d+
V?x-cm-dc-dV?x-idle-diffp
*/
*/
*/
*/
*/
*/
*/
*/
/*
/*
/*
/*
Normal channel quantities
Complimentary channel quantities
Normal channel voltage data
Complimentary channel voltage data
*/
*/
*/
*/
Compliance Point, may be one of the following constants:
PCIX_RX_MODE – Receive Mode
PCIX_TX_MODE – Transmit Mode
PCIX_RX_CARD – Receive Add-In Card Mode
PCIX_TX_CARD – Transmit Add-In Card Mode
PCIX_RX_SYST – Receive System Card Mode
PCIX_TX_SYST – Transmit System Card Mode
Default:
PCIX_RX_MODE
Section 2 – Measurement Commands and Structures
©WAVECREST Corporation 2005
lPcnt
This field specifies the voltage thresholds to be used when
calculating rise and fall times. The voltage thresholds are
assumed to be symmetrical about the 50% threshold, and this is
the distance from the 50% threshold to the starting and ending
thresholds. For example if this field is equal to 30, then 20%
and 80% thresholds are used. If this field is equal to 40,
then 10% and 90% thresholds are used. The absolute voltage
levels used are based on the previous pulsefind minimum and
maximum voltages. If this field is negative, then the absolute
rise and fall thresholds are taken from the following fields
lHiRFmV and lLoRFmv.
Default:
30
lHiRFmV
Absolute rise/fall voltage if lPcnt<0, in units of mV
Default:
+250
lLoRFmV
Absolute rise/fall voltage if lPcnt<0, in units of mV
Default:
-250
lIdleOk
This flag is set by the system when an Idle Mode measurement
is successfully made. The results are then applied in
subsequent measurements. Set this flag to zero to invalidate
the previous Idle Mode measurement results, and force a new
Idle measurement to be made using the command :PCIM:IDLE?
Before the common mode idle voltages are applied once again.
Default:
0
dAttn
Attenuation factor in dB, this is provided to allow the
results to be scaled to compensate for external attenuation
from sources such as probes.
Default:
0
tRcpm
Datacom With Bitclock and Marker Tool which specifies most of
the input and output parameters necessary for a data signal
analysis. The user will need to review all of the default
parameters of the Datacom With Bitclock and Marker Tool and
decide which to change.
lGood
Flag indicates valid data in structure
dEyeOffs, dXmnDiff, dXmxDiff Used internally, DO NOT ALTER!
dVdiffPP
Pk-pk differential voltage
dVdRatio
De-emphaisis voltage ratio
dOpnEyeT
Eye opening at Bit Error rate 10e-12
dMedEyeT
Median to max jitter based on 1 million samples
dOpnEyeT1M Eye opening at Bit Error rate 10e-6
dTranVolts
Vpp for Transition Eye
dDeemVolts Vpp for De-Emphasis Eye
dVcommonAc V?x-cm-acp
dVcommonDc V?x-cm-dc
dVcmDcActv V?x-cm-dc-active-idle-delta
dVcmIdleDc V?x-cm-idle-dc
dVcmDcLine V?x-cm-dc-line-delta
dVcmDcDpls V?x-cm-dc-d+
dVcmDcDmin V?x-cm-dc-ddVIdleDiff
V?x-idle-diffp
qNorm
Normal channel quantities
qComp
Complimentary channel quantities
tNrmScop
Normal channel voltage data
tCmpScop
Complimentary channel voltage data
bTranEye,lTranRsv, bDeemEye,lDeemRsv Used internally, DO NOT ALTER!
©WAVECREST Corporation 2005
SECTION 2 – Measurement Commands and Structures 93
void __stdcall FCNL_DefPcim ( PCIM *pcim )
This function is used to fill the pcim structure for the PCI Express Compliance tool with reasonable default values.
It is recommended that this function be called initially even if parameters within the structure are to be adjusted
manually, and may be called repeatedly to reestablish initial conditions; however, this will impact test time.
Before calling this function, zero out the PCIM structure using the standard memset() function to ensure that any
information pertaining to dynamic memory allocation is cleaned out prior to using the structure.
INPUTS
pcim - Pointer to a PCIM structure. Memory needs to be allocated by the caller.
OUTPUTS
None.
void __stdcall FCNL_ClrPcim ( PCIM *pcim )
This function frees any dynamic memory that may have been allocated during previous data acquisitions and clears
out the pcim structure.
INPUTS
pcim - Pointer to a PCIM structure. Memory needs to be allocated by the caller.
OUTPUTS
None.
EXAMPLE
static PCIM pcim;
memset ( &pcim, 0, sizeof ( PCIM ) );
FCNL_DefPcim ( &pcim);
//declare pcim to a structure of type
//PCIM
//clear the memory for pci structure
//set pci structures to default values
FCNL_RqstPkt ( ApiDevId, &pcim, WIND_PCIM );
FCNL_RqstAll ( ApiDevId, &pcim, WIND_PCIM );
//execute the measurement.
//get plot data (includes tRcpm)
FCNL_ClrPcim ( &pcim);
94
Section 2 – Measurement Commands and Structures
//deallocate the structure
©WAVECREST Corporation 2005
2-33 PCI EXPRESS 1.1 WITH SOFTWARE CLOCK RECOVERY TOOL
The PCI Express 1.1 with Software Clock Recovery Tool provides both timing and amplitude
compliance measurements using the SIA3000. This tool accurately determines device performance
by quantifying both random and deterministic jitter components.
typedef struct
{
/* Input parameters */
long
lCompPnt;
long
lPcnt;
long
lHiRFmV;
long
lLoRFmV;
long
lIdleOk;
long
lPass;
double dAttn;
KPWM
tKpwm;
/* Output parameters */
long
lGood;
long
lTtlHits;
double dEyeOffs;
double dHistMed;
double dXmnDiff;
double dXmxDiff;
double dVdiffPP;
double dVdRatio;
double dOpnEyeT;
double dMedEyeT;
double dOpnEyeT1M;
double dTranVolts;
double dDeemVolts;
double
double
double
double
double
double
double
double
dVcommonAc;
dVcommonDc;
dVcmDcActv;
dVcmIdleDc;
dVcmDcLine;
dVcmDcDpls;
dVcmDcDmin;
dVIdleDiff;
QTYS
qNorm;
QTYS
qComp;
PLTD
tNrmScop;
PLTD
tCmpScop;
PLTD
tTtlHist;
char
*bTranEye;
long
lTranRsv;
char
*bDeemEye;
long
lDeemRsv;
} EXPR;
lCompPnt
/*
/*
/*
/*
/*
/*
/*
/*
Compliance Point 0-RX 1-TX
Amount +/- 50% to calc. rise/fall time
Absolute rise/fall voltage if lPcnt<0
Absolute rise/fall voltage if lPcnt<0
Common mode idle voltages are valid
Acquisitions so far, set to 0 to reset
Attenuation factor (dB)
Contains acquisition parameters
*/
*/
*/
*/
*/
*/
*/
*/
/* Flag indicates valid data in structure */
/*
/*
/*
/*
/*
/*
/*
Pk-pk differential voltage
De-emphaisis voltage ratio
Eye opening
Median to max jitter
Eye opening @ 10^-6 BER
Vpp for Transition Eye
Vpp for De-Emphasis Eye
*/
*/
*/
*/
*/
*/
*/
/*
/*
/*
/*
/*
/*
/*
/*
V?x-cm-acp
V?x-cm-dc
V?x-cm-dc-active-idle-delta
V?x-cm-idle-dc
V?x-cm-dc-line-delta
V?x-cm-dc-d+
V?x-cm-dc-dV?x-idle-diffp
*/
*/
*/
*/
*/
*/
*/
*/
/*
/*
/*
/*
/*
Normal channel quantities
Complimentary channel quantities
Normal channel voltage data
Complimentary channel voltage data
Total Histogram of median-to-max data
*/
*/
*/
*/
*/
Compliance Point, may be one of the following constants:
PCIX_RX_MODE – Receive Mode
PCIX_TX_MODE – Transmit Mode
PCIX_RX_CARD – Receive Add-In Card Mode
PCIX_TX_CARD – Transmit Add-In Card Mode
PCIX_RX_SYST – Receive System Card Mode
PCIX_TX_SYST – Transmit System Card Mode
Default:
PCIX_RX_MODE
©WAVECREST Corporation 2005
SECTION 2 – Measurement Commands and Structures 95
lPcnt
This field specifies the voltage thresholds to be used when
calculating rise and fall times. The voltage thresholds are
assumed to be symmetrical about the 50% threshold, and this is
the distance from the 50% threshold to the starting and ending
thresholds. For example if this field is equal to 30, then 20%
and 80% thresholds are used. If this field is equal to 40,
then 10% and 90% thresholds are used. The absolute voltage
levels used are based on the previous pulsefind minimum and
maximum voltages. If this field is negative, then the absolute
rise and fall thresholds are taken from the following fields
lHiRFmV and lLoRFmv.
Default:
30
lHiRFmV
Absolute rise/fall voltage if lPcnt<0, in units of mV
Default:
+250
lLoRFmV
Absolute rise/fall voltage if lPcnt<0, in units of mV
Default:
-250
lIdleOk
This flag is set by the system when an Idle Mode measurement
is successfully made. The results are then applied in
subsequent measurements. Set this flag to zero to invalidate
the previous Idle Mode measurement results, and force a new
Idle measurement to be made using the command :EXPR:IDLE?
Before the common mode idle voltages are applied once again.
Default:
0
lPass
This parameter is a bi-directional structure element that
tracks the number of acquisitions since last reset. This flag
can be read after an execution or set prior to an execution.
Setting this parameter to 0 essentially resets this register.
It will be automatically incremented when a measurement is
performed.
Valid Entries: any integer greater than or equal to 0
Default:
0
dAttn
Attenuation factor in dB, this is provided to allow the
results to be scaled to compensate for external attenuation
from sources such as probes.
Default:
0
tKpwm
Known Pattern With Marker Tool which specifies most of the
input and output parameters necessary for a data signal
analysis. The user will need to review all of the default
parameters of the Known Pattern With Tool and decide which to
change.
lGood
Flag indicates valid data in structure
lTtlHits
Total hits collected in the Total Jitter Histogram
dHistMed
Median location for the Total Jitter Histogram
dEyeOffs, dXmnDiff, dXmxDiff Used internally, DO NOT ALTER!
dVdiffPP
Pk-pk differential voltage
dVdRatio
De-emphaisis voltage ratio
dOpnEyeT
Eye opening at Bit Error rate 10e-12
dMedEyeT
Median to max jitter based on 1 million samples
dOpnEyeT1M Eye opening at Bit Error rate 10e-6
dTranVolts
Vpp for Transition Eye
dDeemVolts Vpp for De-Emphasis Eye
dVcommonAc V?x-cm-acp
dVcommonDc V?x-cm-dc
dVcmDcActv V?x-cm-dc-active-idle-delta
dVcmIdleDc V?x-cm-idle-dc
dVcmDcLine V?x-cm-dc-line-delta
dVcmDcDpls V?x-cm-dc-d+
96
Section 2 – Measurement Commands and Structures
©WAVECREST Corporation 2005
dVcmDcDmin V?x-cm-dc-ddVIdleDiff
V?x-idle-diffp
qNorm
Normal channel quantities
qComp
Complimentary channel quantities
tNrmScop
Normal channel voltage data
tCmpScop
Complimentary channel voltage data
tTtlHist
Total Jitter Histogram data
bTranEye,lTranRsv, bDeemEye,lDeemRsv Used internally, DO NOT ALTER!
void __stdcall FCNL_DefExpr ( EXPR *expr )
This function is used to fill the expr structure for the PCI Express Compliance tool with reasonable default values. It
is recommended that this function be called initially even if parameters within the structure are to be adjusted
manually, and may be called repeatedly to reestablish initial conditions; however, this will impact test time.
Before calling this function, zero out the EXPR structure using the standard memset() function to ensure that any
information pertaining to dynamic memory allocation is cleaned out prior to using the structure.
INPUTS
expr - Pointer to a EXPR structure. Memory needs to be allocated by the caller.
OUTPUTS
None.
void __stdcall FCNL_ClrExpr ( EXPR *expr )
This function frees any dynamic memory that may have been allocated during previous data acquisitions and clears
out the expr structure.
INPUTS
expr - Pointer to a EXPR structure. Memory needs to be allocated by the caller.
OUTPUTS
None.
EXAMPLE
static EXPR expr;
memset ( &expr, 0, sizeof ( EXPR ) );
FCNL_DefExpr ( &expr);
//declare expr to a structure of type
//EXPR
//clear the memory for expr structure
//set expr structures to default values
FCNL_RqstPkt ( ApiDevId, &expr, WIND_EXPR );
FCNL_RqstAll ( ApiDevId, &expr, WIND_EXPR );
//execute the measurement.
//get plot data (includes tRcpm)
FCNL_ClrExpr ( &expr);
//deallocate the structure
©WAVECREST Corporation 2005
SECTION 2 – Measurement Commands and Structures 97
2-34 PCI EXPRESS 1.1 CLOCK ANALYSIS TOOL
The PCI Express 1.1 Clock Analysis Tool provides both timing and amplitude compliance
measurements for PCI Express Reference Clocks using the SIA3000. This tool accurately
determines device performance by quantifying both random and deterministic jitter components.
typedef struct
{
/* Input parameters */
long
lPcnt;
long
lHiRFmV;
long
lLoRFmV;
long
lPad0;
double dAttn;
KPWM
tKpwm;
/* Output parameters */
long
lGood;
long
lPad1;
double dRiseRate;
double dFallRate;
double dDifMaxVin;
double dDifMinVin;
/* Attenuation factor (dB)
/* Contains acquisition parameters
*/
*/
/* Flag indicates valid data in structure */
/*
/*
/*
/*
Rising edge rate (V/ns)
Falling edge rate (V/ns)
Differential Input High Voltage
Differential Input Low Voltage
*/
*/
*/
*/
double
double
double
double
double
double
double
double
double
dPeriodPpm;
dPeriodMin;
dPeriodMax;
dCycl2Cycl;
dVmaxSingl;
dVminSingl;
dDutyCycle;
dRFMatches;
dMaxJitt1M;
/*
/*
/*
/*
/*
/*
/*
/*
/*
Average Clock Period Accuracy
Absolute Period Minimum
Absolute Period Maximum
Cycle to Cycle Jitter
Absolute Max input voltage
Absolute Min input voltage
Duty Cycle
Rising Rate to Falling Rate Matching
Maximum Pk-Pk Jitter @ 10^-6 BER
*/
*/
*/
*/
*/
*/
*/
*/
*/
QTYS
QTYS
QTYS
PLTD
PLTD
PLTD
} PCLK;
qNorm;
qComp;
qDiff;
tNrmScop;
tCmpScop;
tDifScop;
/*
/*
/*
/*
/*
/*
Normal channel quantities
Complimentary channel quantities
Differential channel quantities
Normal channel voltage data
Complimentary channel voltage data
Differential channel voltage data
*/
*/
*/
*/
*/
*/
lPcnt
lHiRFmV
lLoRFmV
lPad0
98
/* Amount +/- 50% to calc. rise/fall time */
/* Absolute rise/fall voltage if lPcnt<0 */
/* Absolute rise/fall voltage if lPcnt<0 */
This field specifies the voltage thresholds to be used when
calculating rise and fall times. The voltage thresholds are
assumed to be symmetrical about the 50% threshold, and this is
the distance from the 50% threshold to the starting and ending
thresholds. For example if this field is equal to 30, then 20%
and 80% thresholds are used. If this field is equal to 40,
then 10% and 90% thresholds are used. The absolute voltage
levels used are based on the previous pulsefind minimum and
maximum voltages. If this field is negative, then the absolute
rise and fall thresholds are taken from the following fields
lHiRFmV and lLoRFmv.
Default:
30
Absolute rise/fall voltage if lPcnt<0, in units of mV
Default:
+250
Absolute rise/fall voltage if lPcnt<0, in units of mV
Default:
-250
Used internally, DO NOT ALTER!
Section 2 – Measurement Commands and Structures
©WAVECREST Corporation 2005
dAttn
tKpwm
lGood
lPad1
dRiseRate
dFallRate
dDifMaxVin
dDifMinVin
dPeriodPpm
dPeriodMin
dPeriodMax
dCycl2Cycl
dVmaxSingl
dVminSingl
dDutyCycle
dRFMatches
dMaxJitt1M
qNorm
qComp
qDiff
tNrmScop
tCmpScop
tDifScop
Attenuation factor in dB, this is provided to allow the
results to be scaled to compensate for external attenuation
from sources such as probes.
Default:
0
Known Pattern With Marker Tool which specifies most of the
input and output parameters necessary for a data signal
analysis. The user will need to review all of the default
parameters of the Known Pattern With Marker Tool and decide
which to change.
Flag indicates valid data in structure
Used internally, DO NOT ALTER!
Rising edge rate (V/ns)
Falling edge rate (V/ns)
Differential Input High Voltage
Differential Input Low Voltage
Average Clock Period Accuracy expressed in Parts Per Million
Absolute Period Minimum in seconds
Absolute Period Maximum in seconds
Cycle-To-Cycle Jitter in seconds
Absolute Max Single-Ended input voltage
Absolute Min Single-Ended input voltage
Duty Cycle expressed as a percentage
Rising Rate to Falling Rate Matching expressed as a Percentage
Maximum Pk-Pk Jitter @ 10^-6 BER
Normal channel quantities
Complimentary channel quantities
Differential (IN - /IN) channel quantities
Normal channel voltage data
Complimentary channel voltage data
Differential (IN - /IN) channel voltage data
void __stdcall FCNL_DefPclk ( PCLK *pclk )
This function is used to fill the pclk structure for the PCI Express Compliance tool with reasonable default values. It
is recommended that this function be called initially even if parameters within the structure are to be adjusted
manually, and may be called repeatedly to reestablish initial conditions; however, this will impact test time.
Before calling this function, zero out the PCLK structure using the standard memset() function to ensure that any
information pertaining to dynamic memory allocation is cleaned out prior to using the structure.
INPUTS
pclk - Pointer to a PCLK structure. Memory needs to be allocated by the caller.
OUTPUTS
None.
©WAVECREST Corporation 2005
SECTION 2 – Measurement Commands and Structures 99
void __stdcall FCNL_ClrPclk ( PCLK *pclk )
This function frees any dynamic memory that may have been allocated during previous data acquisitions and clears
out the pclk structure.
INPUTS
pclk - Pointer to a PCLK structure. Memory needs to be allocated by the caller.
OUTPUTS
None.
EXAMPLE
static PCLK pclk;
100
memset ( &pclk, 0, sizeof ( PCLK ) );
FCNL_DefPclk ( &pclk);
//declare pclk to a structure of type
//PCLK
//clear the memory for pclk structure
//set pclk structures to default values
FCNL_RqstPkt ( ApiDevId, &pclk, WIND_PCLK );
FCNL_RqstAll ( ApiDevId, &pclk, WIND_PCLK );
//execute the measurement.
//get plot data (includes tRcpm)
FCNL_ClrPclk ( &pclk);
//deallocate the structure
Section 2 – Measurement Commands and Structures
©WAVECREST Corporation 2005
2-35 PCI EXPRESS 1.0a TOOL
The PCI Express 1.0a Tool provides both timing and amplitude compliance measurements in any
environment, system or IC, electrical or optical. Compliance tests can be completed in seconds with
a simple pass/fail indication for each test parameter. It is the most comprehensive and easy to use
signal integrity test solution on the market today.
The PCI Express 1.0a Tool accurately determines device performance by quantifying random and
deterministic jitter components. In addition, the PCI Express 1.0a Tool can quickly isolate and
quantify unwanted deterministic jitter due to crosstalk and EMI with a spectral view of jitter as well
as perform Eye Diagram analysis for a quick qualitative view of device performance.
typedef struct
{
/* Input parameters */
long
lCompPnt;
long
lPcnt;
long
lHiRFmV;
long
lLoRFmV;
long
lIdleOk;
long
lPad0;
double dAttn;
RCPM
tRcpm;
/* Output parameters */
long
lGood;
long
lPad1;
double dEyeOffs;
double dXmnDiff;
double dXmxDiff;
double dVdiffPP;
double dVdRatio;
double dOpnEyeT;
double dMedEyeT;
double
double
double
double
double
double
double
double
dVcommonAc;
dVcommonDc;
dVcmDcActv;
dVcmIdleDc;
dVcmDcLine;
dVcmDcDpls;
dVcmDcDmin;
dVIdleDiff;
QTYS
qNorm;
QTYS
qComp;
PLTD
tNrmScop;
PLTD
tCmpScop;
char
*bTranEye;
long
lTranRsv;
char
*bDeemEye;
long
lDeemRsv;
} PCIX;
lCompPnt
/*
/*
/*
/*
/*
Compliance Point 0-RX 1-TX
Amount +/- 50% to calc. rise/fall time
Absolute rise/fall voltage if lPcnt<0
Absolute rise/fall voltage if lPcnt<0
Common mode idle voltages are valid
/* Attenuation factor (dB)
/* Contains acquisition parameters
*/
*/
*/
*/
*/
*/
*/
/* Flag indicates valid data in structure */
/*
/*
/*
/*
Pk-pk differential voltage
De-emphaisis voltage ratio
Eye opening
Median to max jitter
*/
*/
*/
*/
/*
/*
/*
/*
/*
/*
/*
/*
V?x-cm-acp
V?x-cm-dc
V?x-cm-dc-active-idle-delta
V?x-cm-idle-dc
V?x-cm-dc-line-delta
V?x-cm-dc-d+
V?x-cm-dc-dV?x-idle-diffp
*/
*/
*/
*/
*/
*/
*/
*/
/*
/*
/*
/*
Normal channel quantities
Complimentary channel quantities
Normal channel voltage data
Complimentary channel voltage data
*/
*/
*/
*/
Compliance Point, may be one of the following constants:
PCIX_RX_MODE – Receive Mode
PCIX_TX_MODE – Transmit Mode
PCIX_RX_CARD – Receive Add-In Card Mode
PCIX_TX_CARD – Transmit Add-In Card Mode
©WAVECREST Corporation 2005
SECTION 2 – Measurement Commands and Structures 101
PCIX_RX_SYST – Receive System Card Mode
PCIX_TX_SYST – Transmit System Card Mode
Default:
PCIX_RX_MODE
lPcnt
This field specifies the voltage thresholds to be used when
calculating rise and fall times. The voltage thresholds are
assumed to be symmetrical about the 50% threshold, and this is
the distance from the 50% threshold to the starting and ending
thresholds. For example if this field is equal to 30, then 20%
and 80% thresholds are used. If this field is equal to 40,
then 10% and 90% thresholds are used. The absolute voltage
levels used are based on the previous pulsefind minimum and
maximum voltages. If this field is negative, then the absolute
rise and fall thresholds are taken from the following fields
lHiRFmV and lLoRFmv.
Default:
30
lHiRFmV
Absolute rise/fall voltage if lPcnt<0, in units of mV
Default:
+250
lLoRFmV
Absolute rise/fall voltage if lPcnt<0, in units of mV
Default:
-250
lIdleOk
This flag is set by the system when an Idle Mode measurement
is successfully made. The results are then applied in
subsequent measurements. Set this flag to zero to invalidate
the previous Idle Mode measurement results, and force a new
Idle measurement to be made using the command :PCIX:IDLE?
Before the common mode idle voltages are applied once again.
Default:
0
dAttn[n]
Attenuation factor in dB, this is provided to allow the
results to be scaled to compensate for external attenuation
from sources such as probes.
Default:
0
tRcpm
Datacom With Bitclock and Marker Tool which specifies most of
the input and output parameters necessary for a data signal
analysis. The user will need to review all of the default
parameters of the Datacom With Bitclock and Marker Tool and
decide which to change.
lGood
Flag indicates valid data in structure
dEyeOffs, dXmnDiff, dXmxDiff Used internally, DO NOT ALTER!
dVdiffPP
Pk-pk differential voltage
dVdRatio
De-emphaisis voltage ratio
dOpnEyeT
Eye opening
dMedEyeT
Median to max jitter
dVcommonAc V?x-cm-acp
dVcommonDc V?x-cm-dc
dVcmDcActv V?x-cm-dc-active-idle-delta
dVcmIdleDc V?x-cm-idle-dc
dVcmDcLine V?x-cm-dc-line-delta
dVcmDcDpls V?x-cm-dc-d+
dVcmDcDmin V?x-cm-dc-ddVIdleDiff
V?x-idle-diffp
qNorm
Normal channel quantities
qComp
Complimentary channel quantities
tNrmScop
Normal channel voltage data
tCmpScop
Complimentary channel voltage data
bTranEye,lTranRsv, bDeemEye,lDeemRsv Used internally, DO NOT ALTER!
102
Section 2 – Measurement Commands and Structures
©WAVECREST Corporation 2005
void __stdcall FCNL_DefPcix ( PCIX *pcix )
This function is used to fill the pcix structure for the PCI Express Compliance tool with reasonable default values. It
is recommended that this function be called initially even if parameters within the structure are to be adjusted
manually, and may be called repeatedly to reestablish initial conditions; however, this will impact test time.
Before calling this function, zero out the PCIX structure using the standard memset() function to ensure that any
information pertaining to dynamic memory allocation is cleaned out prior to using the structure.
INPUTS
pcix - Pointer to a PCIX structure. Memory needs to be allocated by the caller.
OUTPUTS
None.
void __stdcall FCNL_ClrPcix ( PCIX *pcix )
This function frees any dynamic memory that may have been allocated during previous data acquisitions and clears
out the pcix structure.
INPUTS
pcix - Pointer to a PCIX structure. Memory needs to be allocated by the caller.
OUTPUTS
None.
EXAMPLE
static PCIX pci;
memset ( &pci, 0, sizeof ( PCIX ) );
FCNL_DefPcix ( &pci);
//declare pci to a structure of type
//PCIX
//clear the memory for pci structure
//set pci structures to default values
FCNL_RqstPkt ( ApiDevId, &pci, WIND_PCIX );
FCNL_RqstAll ( ApiDevId, &pci, WIND_PCIX );
//execute the measurement.
//get plot data (includes tRcpm)
FCNL_ClrPcix ( &pci);
//deallocate the structure
©WAVECREST Corporation 2005
SECTION 2 – Measurement Commands and Structures 103
2-36 PHASE NOISE TOOL
The Phase Noise tool allows users to measure phase noise in clock/oscillator sources. By simply choosing
the highest frequency to be displayed and the frequency resolution, the tool will measure and display the
phase noise spectrum. This tool reports the phase noise values at common offset frequencies.
The Phase Noise tool is used to show the amplitude and frequency of phase noise relative to the carrier
signal frequency. This tool measures the fluctuations in the phase of a signal caused by time domain
instabilities. Fast and easy phase noise measurements of oscillators and PLL devices can be easily
correlated to other noise effects on the signal.
The sensitivity of the tool is limited by hardware and is dependent on f0 and Maximum Freq. Alternate
methods of characterizing random noise in clock sources are available in the SIA-3000.
typedef struct
{
/* Input parameters */
PARM
tParm;
FFTS
tFfts;
long
lAutoFix;
long
lPad1;
double dMaxFreq;
double dFreqRes;
long
lFftAvgs;
/* Output parameters */
long
lGood;
PLTD
tTime;
PLTD
tStmp;
PLTD
tFft1;
PLTD
tPhas;
double dCarFreq;
double dSmpRate;
double dValByDec[DECADES];
} PHAS;
tParm
tFfts
lAutoFix
dMaxFreq
dFreqRes
lFftAvgs
lGood
tTime
tStmp
tFft1
tPhas
104
/* Contains acquisition parameters
*/
/* FFT window and analysis parameters
*/
/* If true calculate the above parameters */
/* Maximum Frequency that is desired
*/
/* Frequency resolution that is desired
*/
/* 2^fft_avgs averages used to smooth FFT */
/*
/*
/*
/*
/*
/*
/*
/*
/*
Flag indicates valid data in structure
Time domain plot data
Time stamp array, not normally plotted
Frequency plot data on 1-clock basis
Phase noise plot in dBc/Hz
Carrier frequency
Sampling rate
Phase Noise by Decade, first is 10Hz
last is fMax, zero means illegal value
*/
*/
*/
*/
*/
*/
*/
*/
*/
A structure of type PARM that contains acquisition parameter.
The PARM structure is discussed in full detail in Section 2-4.
A structure of type FFTS that contains the FFT setup parameters
such as window type and padding factor. See Section 2-10 for
further details.
If true calculate some of the above tParm parameters
Default:
0
Maximum Frequency that is desired
Default:
1000.0
Frequency resolution that is desired
Default:
1.0
2^fft_avgs averages used to smooth FFT
Default:
2
Flag indicates valid data in structure
Time domain plot data
Time stamp array, not normally plotted
Frequency plot data on 1-clock basis
Phase noise plot in dBc/Hz
Section 2 – Measurement Commands and Structures
©WAVECREST Corporation 2005
dCarFreq
Carrier frequency
dSmpRate
Sampling rate
dValByDec[n] Phase Noise by Decade, first is 10Hz
last is fMax, zero means illegal value
void __stdcall FCNL_DefPhas ( PHAS *phas )
This function is used to fill the phas structure for the Phase Noise tool with reasonable default values. It is recommended
that this function be called initially even if parameters within the structure are to be adjusted manually, and may be
called repeatedly to reestablish initial conditions; however, this will impact test time.
Before calling this function, zero out the PHAS structure using the standard memset() function to ensure that any
information pertaining to dynamic memory allocation is cleaned out prior to using the structure.
INPUTS
phas - Pointer to a PHAS structure. Memory needs to be allocated by the caller.
OUTPUTS
None.
void __stdcall FCNL_ClrPhas ( PHAS *phas )
This function frees any dynamic memory that may have been allocated during previous data acquisitions and clears
out the phas structure.
INPUTS
phas - Pointer to a PHAS structure. Memory needs to be allocated by the caller.
OUTPUTS
None.
EXAMPLE
static PHAS phase;
memset ( &phase, 0, sizeof ( PHAS ) );
FCNL_DefPhas ( &phase );
//declare phase to a structure of type
//PHAS
//clear the memory for phase structure
//set phase structures to default values
FCNL_RqstPkt ( ApiDevId, &phase, WIND_PHAS );
FCNL_RqstAll ( ApiDevId, &phase, WIND_PHAS );
//execute the measurement.
//get plot data
FCNL_ClrPhas ( &phase );
//deallocate the structure
©WAVECREST Corporation 2005
SECTION 2 – Measurement Commands and Structures 105
2-37 PLL ANALYSIS TOOL
The PLL Analysis tool permits users to study characteristics and parameters of a 2nd-order PLL.
With a simple set of variance measurements, the tool can extract information such as damping
factor, natural frequency, input noise level, lock range, lock-in time, pull-in time, pull-out range and
noise bandwidth. The tool also presents a transfer function and Bode plots up to the natural
frequency, as well as a plot of the poles and zero for a 2nd-order PLL.
typedef struct
{
/* Input parameters
PARM
tParm;
double dXiGuess;
double dWnGuess;
double dS0Guess;
double dInitOff;
long
lIncStop;
long
lMaxStop;
double dCornFrq;
double dRecTime;
long
lRecUnit;
*/
long
lIniCond;
/* Output parameters */
long
lGood;
long
lVfit;
double dDampFct;
double dNatFreq;
double dS0Noise;
double dChSquar;
double dFreq;
complex dPole[2], dZero;
double dLockRng;
double dLockInT;
double dPullInT;
double dPullOut;
double dNoiseBW;
PLTD
tSigm;
PLTD
tVfit;
PLTD
tInit;
PLTD
tXfer;
PLTD
tBodeMag;
PLTD
tBodePha;
} APLL;
tParm
dXiGuess
dWnGuess
dS0Guess
dInitOff
lIncStop
106
/*
/*
/*
/*
/*
/*
/*
/*
/*
/*
/*
/*
Contains acquisition parameters
Initial value for damping factor
Initial value for natural frequency
Initial power spectral density dBc/Hz
Initial offset frequency - delta W0
Increase stop count by this value
Maximum stop count to collect data
Corner Frequency for Record Length
Record Length in units of time (s)
Record length units, must be one of:
0=lMaxStop, 1=dCornFreq, 2=dRecTime
Calc. initial conditions if non-zero
*/
*/
*/
*/
*/
*/
*/
*/
*/
*/
*/
*/
/*
/*
/*
/*
/*
/*
/*
/*
/*
/*
/*
/*
/*
/*
/*
/*
/*
/*
/*
Flag indicates valid data in structure
Indicates if the variance fit was good
Damping factor from variance fit
Natural frequency from fit (rad/s)
Noise process power spectral density
Chi-square of variance fit
Carrier frequency
Poles and zero
Lock Range (rad/s)
Lock-in Time (s)
Pull-in Time (s)
Pull-out Range (rad/s)
Noise Bandwidth (rad/s)
Contains the 1-Sigma plot array
Resulting variance fit plot array
Initial Conditions variance plot array
PLL Transfer Function plot array
Bode plot magnitude/gain response
Bode plot phase response
*/
*/
*/
*/
*/
*/
*/
*/
*/
*/
*/
*/
*/
*/
*/
*/
*/
*/
*/
A structure of type PARM that contains acquisition parameter.
The PARM structure is discussed in full detail in Section 2-4.
Initial value for damping factor
Default:
0.25
Initial value for natural frequency
Default:
315e3
Initial power spectral density dBc/Hz
Default:
-90.0
Initial offset frequency - delta W0
Default:
1000.0
Increase stop count by this value
Default:
1
Section 2 – Measurement Commands and Structures
©WAVECREST Corporation 2005
lMaxStop
dCornFrq
dRecTime
lRecUnit
lIniCond
lGood
lVfit
dDampFct
dNatFreq
dS0Noise
dChSquar
dFreq
dPole[2]
dZero
dLockRng
dLockInT
dPullInT
dPullOut
dNoiseBW
tSigm
tVfit
tInit
tXfer
tBodeMag
tBodePha
Maximum stop count to collect data
Default:
1000
Corner Frequency for Record Length
Default:
50e3
Record Length in units of time (s)
Default:
10e-6
Record length units, must be one of:
0=lMaxStop, 1=dCornFreq, 2=dRecTime
Default:
2
Calc. initial conditions if non-zero
Default:
1
Flag indicates valid data in structure
Indicates if the variance fit was good
Damping factor from variance fit
Natural frequency from fit (rad/s)
Noise process power spectral density
Chi-square of variance fit
Carrier frequency
Location of Poles of transfer function
Location of zero of transfer function
Lock Range (rad/s)
Lock-in Time (s)
Pull-in Time (s)
Pull-out Range (rad/s)
Noise Bandwidth (rad/s)
Contains the 1-Sigma plot array
Resulting variance fit plot array
Initial Conditions variance plot array
PLL Transfer Function plot array
Bode plot magnitude/gain response
Bode plot phase response
void __stdcall FCNL_DefApll ( APLL *apll )
This function is used to fill the apll structure for the PLL Analysis tool with reasonable default values. It is
recommended that this function be called initially even if parameters within the structure are to be adjusted
manually, and may be called repeatedly to reestablish initial conditions; however, this will impact test time.
Before calling this function, zero out the APLL structure using the standard memset() function to ensure that any
information pertaining to dynamic memory allocation is cleaned out prior to using the structure.
INPUTS
apll - Pointer to a APLL structure. Memory needs to be allocated by the caller.
OUTPUTS
None.
©WAVECREST Corporation 2005
SECTION 2 – Measurement Commands and Structures 107
void __stdcall FCNL_ClrApll ( APLL *apll )
This function frees any dynamic memory that may have been allocated during previous data acquisitions and clears
out the apll structure.
INPUTS
apll - Pointer to a APLL structure. Memory needs to be allocated by the caller.
OUTPUTS
None.
EXAMPLE
static APLL pll;
108
memset ( &pll, 0, sizeof ( APLL ) );
FCNL_DefApll ( &pll);
//declare pll to a structure of type
//APLL
//clear the memory for pll structure
//set pll structures to default values
FCNL_RqstPkt ( ApiDevId, &pll, WIND_APLL );
FCNL_RqstAll ( ApiDevId, &pll, WIND_APLL );
//execute the measurement.
//get plot data
FCNL_ClrApll ( &pll);
//deallocate the structure
Section 2 – Measurement Commands and Structures
©WAVECREST Corporation 2005
2-38 RAMBUS DRCG TOOL
The Rambus DRCG tool was developed specifically to test Rambus® clock generator chips which
have a compliance test that includes adjacent cycle jitter at 6 incremental accumulations for both
period polarities. This tool is a true compliance tool such that the specification, as defined by
Rambus Corporation, has been incorporated into this tool to validate a DRCG’s performance relative
to the standard.
The measurement consists of accumulated adjacent cycle jitter measurements (cycle to cycle) for
both rising edges and falling edges. The measurement algorithm is depicted above. Each
measurement configuration is executed in 4 “sweeps”. Each sweep is a burst of 4000 measurements.
For a given execution, 4 sweeps of 4000 measurements for both rising and falling edges at 6
different amplitudes of accumulation results in 4x4000x2x6=192,000 measurements. The results are
placed in arrays, which are organized by cumulative cycles and sweep number.
W ave c r e s t
S IA 3 0 0 0
Ram bus
C o m p lia n t
D R C G IC
A ccu m u la tio n
o f 2 p e rio d s
A ccu m u la tio n
o f 4 p e rio d s
A ccu m u la tio n
o f 3 p e rio d s
A ccu m u la tio n
o f 1 p e rio d
A ccu m u la tio n
o f 6 p e rio d s
PER1 PER2
∆ P E R 1 = P E R 1 -P E R 2
∆ P E R 2 = P E R 3 -P E R 4
PER3 PER4
∆ P E R 2 = P E R 3 -P E R 4
H is to g ra m o f 4 0 0 0 ∆ P E R
m e a s u re m e n ts fo r 1 S w e e p
o f (+ )p e rio d cy cle -cy cle jitte r
PE R m PE R m+1
∆ P E R n = P E R m -P E R m + 1
dRiseMax
∆ P E R 1 = P E R 1 -P E R 2
PER3 PER4
H is to g ra m o f 4 0 0 0 ∆ P E R
m e a s u re m e n ts fo r 1 S w e e p
o f (-)p e rio d cy cle -cy c le jitte r
PE R m PE R m+1
∆ P E R n = P E R m -P E R m + 1
dRiseMax
Repeat
A cq u is itio n fo r 4
sw eeps of 4000
cy cle -c y cle
M e a s u re m e n ts
PER1 PER2
dRiseMin
R e p e a t A cq u is itio n
o f P e rio d (+ ) a n d
P e rio d (-) fo r
a c c u m u la tio n s o f:
1 p e rio d , 2 p e rio d ,
3 p e rio d , 4 p e rio d ,
5 p e rio d a n d 6
p e rio d .
Repeat
A cq u is itio n fo r 4
sw eeps of 4000
cy cle -c y cle
M e a s u re m e n ts
dRiseMin
A ccu m u la tio n
o f 5 p e rio d s
D R C G U tility ’s m e a s u re m e n t a lg o rith m
typedef struct
{
/* Input parameters */
PARM
tParm;
long
lAutoFix;
long
lDutCycl;
long
lUsrSpec;
long
lPad1;
double dSpecVal;
/* Output parameters */
long
lGood;
long
lPass;
double dDutyMax;
double dDutyMin;
©WAVECREST Corporation 2005
/*
/*
/*
/*
Contains acquisition parameters
*/
If true perform a pulsefind as req'd
*/
If non-zero make duty cycle measurement*/
If non-zero use the specified TJ value */
/* User-defined TJ specification
*/
/* Flag indicates valid data in structure */
/* Maximum value of duty cycle measurement*/
/* Minimum value of duty cycle measurement*/
SECTION 2 – Measurement Commands and Structures 109
double
PLTD
PLTD
PLTD
PLTD
PLTD
PLTD
double
double
double
double
double
} DRCG;
dDutyAvg;
/* Average value of duty cycle measurement*/
tRiseMax;
/* Minimum deltaT of rising adj. periods */
tRiseMin;
/* Maximum deltaT of rising adj. periods */
tFallMax;
/* Minimum deltaT of falling adj. periods */
tFallMin;
/* Maximum deltaT of falling adj. periods */
tMaxiLim;
/* Maximum limit per specification
*/
tMiniLim;
/* Minimum limit per specification
*/
dRiseMax[DRCG_CYCLES][DRCG_SWEEPS];
dRiseMin[DRCG_CYCLES][DRCG_SWEEPS];
dFallMax[DRCG_CYCLES][DRCG_SWEEPS];
dFallMin[DRCG_CYCLES][DRCG_SWEEPS];
dFreq;
/* Carrier frequency
*/
tParm
A structure of type PARM that contains acquisition parameter.
The PARM is discussed in full detail in Section 2-4.
lAutoFix
Flag indicating whether to perform a pulse-find as required.
Setting this value to any integer greater than zero tells the
measurement to perform a pulse find if needed. The system will
know if a measurement was recently performed and if a pulse
find is necessary.
Valid Entries: 0 – No pulsefind prior to measurement
1 – Pulsefind if the measurement mode changed.
Default:
0
lDutCycl
Flag indicating whether to perform a duty cycle measurement.
Measuring three successive transitions, this measurement
represents the absolute duty cycle and allows the user to
identify the maximum, minimum and average duty cycle.
Valid Entries: 0 – do not perform a duty cycle measurement
1 – perform a duty cycle measurement
Default:
0
lUsrSpec
Flag to indicate whether to use a user specified limit for
maximum/minimum cycle to cycle jitter or to use the Rambus
defined specification. If this flag is set, the parameter
specified in dSpecVal will be used as the pass/fail limit for
this test.
Valid Entries: 0 – Use Rambus defined specification
1 – Use limit defined in dSpecVal
Default:
0
dSpecVal
Test limit used by this tool, depending on the state of lUsrSpec,
indicate a pass/fail condition based on the measured cycle to
cycle jitter for each pass, polarity and accumulation.
lGood
Flag used to indicate valid output data in structure.
dDutyMax, dDutyMin, dDutyAvg Maximum, minimum and average values of duty
cycle measurement.
tRiseMax
Structure of type PLTD containing all of the necessary
information to draw a histogram of data containing the maximum
increase in period of adjacent positive periods (periods
characterized by a rising edges). See Section 2-3 for details
of the PLTD structure and its elements.
tRiseMin
Structure of type PLTD containing all of the necessary
information to draw a histogram of data containing the maximum
decrease in period of adjacent positive periods. See Section
2-3 for details of the PLTD structure and its elements.
tFallMax
Structure of type PLTD containing all of the necessary
information to draw a histogram of data containing the maximum
increase in period of adjacent negative periods (periods
characterized by a falling edges). See Section 2-3 for details
of the PLTD structure and its elements.
110
Section 2 – Measurement Commands and Structures
©WAVECREST Corporation 2005
tFallMin
Structure of type PLTD containing all of the necessary
information to draw a histogram of data containing the minimum
deltaT of falling adjacent periods. See Section 2-3 for
details of the PLTD structure and its elements.
tMaxiLim
Structure of type PLTD containing all of the necessary
information to draw a histogram of maximum limits per
specification. See Section 2-3 for details of the PLTD
structure and its elements.
tMiniLim
Structure of type PLTD containing all of the necessary
information to draw a histogram of minimum limits per
specification. See Section 2-3 for details of the PLTD
structure and its elements.
dRiseMax[m][n] A 6x4 array of maximum period increase between two adjacent
positive periods organized by the number of accumulated
periods and the sweep number. Each execution of this structure
results in 6 accumulations and 4 sweeps. (Each sweep is a
burst of 4000 measurements.)
dRiseMin[m][n] A 6x4 array of maximum period decrease between two adjacent
positive periods organized by the number of accumulated
periods and the sweep number. Each execution of this structure
results in 6 accumulations and 4 sweeps. (Each sweep is a
burst of 4000 measurements.)
dFallMax[m][n]A 6x4 array of maximum period increase between two adjacent
negative periods organized by the number of accumulated
periods and the sweep number. Each execution of this structure
results in 6 accumulations and 4 sweeps. (Each sweep is a
burst of 4000 measurements.)
dFallMin[m][n]A 6x4 array of maximum period decrease between two adjacent
negative periods organized by the number of accumulated
periods and the sweep number. Each execution of this structure
results in 6 accumulations and 4 sweeps. (Each sweep is a
burst of 4000 measurements.)
dFreq
Measured carrier frequency.
void __stdcall FCNL_DefDrcg ( DRCG *drcg )
This function is used to fill the drcg structure for the Rambus DRCG tool with reasonable default values. It is
recommended that this function be called initially even if parameters within the structure are to be adjusted
manually, and may be called repeatedly to reestablish initial conditions; however, this will impact test time.
Before calling this function, zero out the DRCG structure using the standard memset() function to ensure that any
information pertaining to dynamic memory allocation is cleaned out prior to using the structure.
INPUTS
drcg - Pointer to a DRCG structure. Memory needs to be allocated by the caller.
OUTPUTS
None.
©WAVECREST Corporation 2005
SECTION 2 – Measurement Commands and Structures 111
void __stdcall FCNL_ClrDrcg ( DRCG *drcg )
This function frees any dynamic memory that may have been allocated during previous data acquisitions and clears
out the drcg structure.
INPUTS
drcg - Pointer to a DRCG structure. Memory needs to be allocated by the caller.
OUTPUTS
None.
EXAMPLE
#define
#define
#define
#define
TRUE 1
FALSE 0
ACCUM_MAX 6
SWEEP_MAX 4
int i,j;
static DRCG rambus;
memset ( &rambus, 0, sizeof ( DRCG ) );
FCNL_DefDrcg (&rambus);
rambus.tparm.lChanNum = 1;
rambus.lDutCycl = TRUE;
FCNL_RqstPkt ( ApiDevId, &rambus, WIND_DRCG );
FCNL_RqstAll ( ApiDevId, & rambus, WIND_DRCG );
//declare cyc2cyc to be a structure of
//type ACYC
//clear the memory for cyc2cyc
//set histogram structures to default
//values
//capture waveform on channel 1
/Measure true duty cycle my measuring
//successive edges.
//execute the measurement.
//get plot data
printf(“MAX PERIOD DECREASE: NEGATIVE PERIODS\n”); //Display results for all sweeps and cycles
printf(“\tSweep1\tSweep2\tSweep3\tSweep4\n”);
for(i=1;i<=ACCUM_MAX;i++)
{
printf(“%i PER CYC-CYC\t”,i);
for(j=0;j<SWEEP_MAX;j++)
printf(“\t%d”,ABS(rambus.dFallMin[i][j]));
printf(“\n”));
}
printf(“MAX PERIOD INCREASE: NEGATIVE PERIODS\n”);
printf(“\tSweep1\tSweep2\tSweep3\tSweep4\n”);
for(i=1;i<=ACCUM_MAX;i++)
{
printf(“%i PER CYC-CYC\t”,i);
for(j=1;j<=SWEEP_MAX;j++)
printf(“\t%d”,ABS(rambus.dFallMax[i][j]));
printf(“\n”));
}
FCNL_ClrDrcg (&rambus);
112
Section 2 – Measurement Commands and Structures
//deallocate the structure
©WAVECREST Corporation 2005
2-39 SCOPE TOOL
The Oscilloscope tool provides a quick and easy display of the signal to be analyzed. The
Oscilloscope has many different capabilities. It can capture a waveform, measure voltage
parameters, and create eye masks.
typedef struct
{
/* Input parameters */
PARM
tParm;
long
lVoff[POSS_CHNS];
long
lVdif[POSS_CHNS];
long
lVcom[POSS_CHNS];
long
lTper;
long
lTdel;
long
lPcnt;
long
lHiRFmV;
long
lLoRFmV;
long
lInps;
long
lMeas;
long
lPass;
long
lAvgs;
long
lPad1;
MASK
tMask;
double dMargin;
double dHistDly;
double dHistWid;
double dHistVlt;
double dHistHgt;
double dAttn[POSS_CHNS];
/* Output parameters */
long
lGood;
long
lPad2;
QTYS
qNorm[ POSS_CHNS ];
QTYS
qComp[ POSS_CHNS ];
QTYS
qDiff[ POSS_CHNS ];
QTYS
qComm[ POSS_CHNS ];
PLTD
tXval;
PLTD
tNorm[ POSS_CHNS ];
PLTD
tComp[ POSS_CHNS ];
PLTD
tDiff[ POSS_CHNS ];
PLTD
tComm[ POSS_CHNS ];
OHIS
tHorz[ POSS_CHNS ];
OHIS
tVert[ POSS_CHNS ];
} SCOP;
tParm
LVoff[n]
lVdif[n]
lVcom[n]
lTper
/*
/*
/*
/*
/*
/*
/*
/*
/*
/*
/*
/*
/*
Contains acquisition parameters
Voltage offset (mV)
- per channel
Differential offset (mV)- per channel
Common offset (mV)
- per channel
Time per division (ps) - all channels
Delay time (ps)
- all channels
Amount +/- 50% to calc. rise/fall time
Absolute rise/fall voltage if lPcnt<0
Absolute rise/fall voltage if lPcnt<0
Input selection, see defines above
Measure flag, see defines above
Acquisitions so far, set to 0 to reset
2^lAvgs = averages used to smooth data
*/
*/
*/
*/
*/
*/
*/
*/
*/
*/
*/
*/
*/
/*
/*
/*
/*
/*
/*
/*
Structure which holds mask definition
Margin in percentage [-1.0 to 1.0]
Histogram horizontal location, seconds
Histogram horizontal width, seconds
Histogram vertical location, volts
Histogram vertical height, volts
Attenuation factor (dB) - per channel
*/
*/
*/
*/
*/
*/
*/
/* Flag indicates valid data in structure */
/*
/*
/*
/*
/*
/*
/*
/*
/*
/*
/*
Normal channel quantities
Complimentary channel quantities
Differential quantities
Common (A+B) quantities
Xaxis data to go with the voltage data
Normal channel voltage data
Complimentary channel voltage data
Differential voltage data
Common (A+B) voltage data
Horizontal histogram data
Vertical histogram data
*/
*/
*/
*/
*/
*/
*/
*/
*/
*/
*/
A structure of type PARM that contains acquisition parameter.
The PARM is discussed in full detail in Section 2-4.
Offset voltage used for scope acquire, specified in mV, one
per channel
Differential offset voltage used for scope acquire, specified
in mV, one per channel
Common mode offset voltage used for scope acquire, specified
in mV, one per channel
Time per division specified in ps – applies to all channels,
any of the following are valid values:
5000000, 2000000, 1000000, 500000, 200000, 100000,
50000, 20000, 10000, 5000, 2000, 1000, 500, 200, 100, 50
©WAVECREST Corporation 2005
SECTION 2 – Measurement Commands and Structures 113
lTdel
lPcnt
lHiRFmV
lLoRFmV
lInps
lMeas
lPass
lAvgs
tMask
114
Default:
10000
Delay time to start specified in ps – applies to all channels
Valid Range:
24,000 to 100,000,000
Default:
24,000
This field specifies the voltage thresholds to be used when
calculating rise and fall times. The voltage thresholds are
assumed to be symmetrical about the 50% threshold, and this is
the distance from the 50% threshold to the starting and ending
thresholds. For example if this field is equal to 30, then 20%
and 80% thresholds are used. If this field is equal to 40,
then 10% and 90% thresholds are used. The absolute voltage
levels used are based on the previous pulsefind minimum and
maximum voltages. If this field is negative, then the absolute
rise and fall thresholds are taken from the following fields
lHiRFmV & lLoRFmv.
Default:
30
Absolute rise/fall voltage if lPcnt<0, in units of mV
Default:
+250
Absolute rise/fall voltage if lPcnt<0, in units of mV
Default:
-250
Input selection, can be any of the following:
SCOP_INPS_NORM +Input Only
SCOP_INPS_COMP –Input Only
SCOP_INPS_DIFF +Input minus -Input
SCOP_INPS_BOTH +Input and -Input
SCOP_INPS_COMM +Input plus –Input
Default:
SCOP_INPS_NORM
Measure flag, this is a bitfield which may be created by
combining any or all of the following constants:
SCOP_MEAS_RISEFALL – Rise and Fall times are calculated
SCOP_MEAS_VTYPICAL – Vtop and Vbase are calculated
SCOP_MEAS_VEXTREME – Vmin and Vmax are calculated
SCOP_MEAS_OVERUNDR – Overshoot and Undershoot are calculated
SCOP_MEAS_WAVEFORM – Vavg and Vrms are calculated
SCOP_MEAS_VERTHIST – Create a vertical histogram
SCOP_MEAS_HORZHIST – Create a horizontal histogram
SCOP_MEAS_EYEMASKS – Apply an Eye Mask Keep In/Out Region
Default:
None of the above are included
This parameter is a bi-directional structure element that
tracks the number of acquisitions since last reset. This flag
can be read after an execution or set prior to an execution.
Setting this parameter to 0 essentially resets this register.
It will be automatically incremented when a measurement is
performed.
Valid Entries: any integer greater than or equal to 0
Default:
0
This variable is used to calculate the number of averages to
use. Increasing the number of averages reduces the background
noise associated with the algorithms. The number of averages
is calculated based on the equation:
AVERAGES = 2n
where
n = lAvgs
Valid Entries: any integer greater than or equal to 0
Default:
0 (indicating 20 averages = 1 execution.)
MASK Structure which holds mask definition. See the definition
above.
Defaults:
tMask.dXwdUI = 0.40
tMask.dXflUI = 0.20
tMask.dYiPct = 0.60
tMask.dV1Rel = 0.20
Section 2 – Measurement Commands and Structures
©WAVECREST Corporation 2005
dMargin
dHistDly
dHistWid
dHistVlt
dHistHgt
dAttn[n]
lGood
qNorm[n]
qComp[n]
qDiff[n]
qComm[n]
tXval
tNorm[n]
tComp[n]
tDiff[n]
tComm[n]
tHorz[n]
tVert[n]
tMask.dV0Rel = 0.20
tMask.dVmask = 64e-3
tMask.dTmask = 700e-12
tMask.dV1pas = scop->tMask.dVmask * 0.75
scop->tMask.dV0pas = scop->tMask.dVmask * 0.75
tMask.dTflat = scop->tMask.dTmask * 3.0 / 7.0
Margin in percentage for Eye Mask [-1.0 to 1.0]
Default:
0
Histogram Box center horizontal location, seconds
Default:
120e-9
Histogram Box horizontal width, seconds
Default:
160e-9
Histogram Box center vertical location, volts
Default:
0.0
Histogram Box vertical height, volts
Default:
1.6
Attenuation factor in dB, this is provided to allow the
results to be scaled to compensate for external attenuation
from sources such as probes.
Default:
0
Flag indicates valid data in structure
Normal channel quantities, one for each channel
Complimentary channel quantities, one for each channel
Differential quantities, one for each channel
Common (A+B) quantities, one for each channel
Xaxis data to go with the voltage data
Normal channel voltage data, one for each channel
Complimentary channel voltage data, one for each channel
Differential voltage data, one for each channel
Common (A+B) voltage data, one for each channel
Horizontal histogram data, one for each channel
Vertical histogram data, one for each channel
void __stdcall FCNL_DefScop ( SCOP *scop )
This function is used to fill the scop structure for the Scope tool with reasonable default values. It is recommended
that this function be called initially even if parameters within the structure are to be adjusted manually, and may be
called repeatedly to reestablish initial conditions; however, this will impact test time.
Before calling this function, zero out the SCOP structure using the standard memset() function to ensure that any
information pertaining to dynamic memory allocation is cleaned out prior to using the structure.
INPUTS
scop - Pointer to a SCOP structure. Memory needs to be allocated by the caller.
OUTPUTS
None.
©WAVECREST Corporation 2005
SECTION 2 – Measurement Commands and Structures 115
void __stdcall FCNL_ClrScop ( SCOP *scop )
This function frees any dynamic memory that may have been allocated during previous data acquisitions and clears
out the scop structure.
INPUTS
scop - Pointer to a SCOP structure. Memory needs to be allocated by the caller.
OUTPUTS
None.
EXAMPLE
static SCOP scope;
116
memset ( &scope, 0, sizeof ( SCOP ) );
FCNL_DefScop ( &scope);
//declare scope to a structure of type
//SCOP
//clear the memory for scope structure
//set scope structures to default values
FCNL_RqstPkt ( ApiDevId, &scope, WIND_SCOP );
FCNL_RqstAll ( ApiDevId, &scope, WIND_SCOP );
//execute the measurement.
//get plot data
FCNL_ClrScop ( &scope);
//deallocate the structure
Section 2 – Measurement Commands and Structures
©WAVECREST Corporation 2005
2-40 SERIAL ATA GEN2I & GEN2M TOOL
The SERIAL ATA GEN2I & GEN2M Tool provides both timing and amplitude compliance
measurements. It accurately determines device performance by quantifying both random and
deterministic jitter components.
typedef struct
{
/* Input parameters */
long
lCompPnt;
long
lVoff;
double dAttn;
KPWM
tKpwm;
/* Output parameters */
long
lGood;
long
lPad2;
double dTjit10;
double dRjit10;
double dDjit10;
double dTjit500;
double dRjit500;
double dDjit500;
double dTjit1667;
double dRjit1667;
double dDjit1667;
PLTD
tDdjt10;
PLTD
tFreq10;
PLTD
tBath10;
PLTD
tDdjt500;
PLTD
tFreq500;
PLTD
tBath500;
PLTD
tDdjt1667;
PLTD
tFreq1667;
PLTD
tBath1667;
PLTD
tNrmScop;
PLTD
tCmpScop;
PLTD
tDifScop;
PLTD
tComScop;
} ATA2;
lCompPnt
lVoff
dAttn
tKpwm
lGood
lPad2
dTjit10
/*
/*
/*
/*
Compliance Point 0-Gen2i 1-Gen2m
Offset voltage used for scope acquire
Attenuation factor (dB)
KPWM structure holds most information
*/
*/
*/
*/
/* Flag indicates valid data in structure */
/*
/*
/*
/*
/*
/*
/*
/*
/*
/*
/*
/*
/*
/*
/*
/*
/*
/*
/*
/*
/*
/*
TJ @ Fbaud / 10
RJ @ Fbaud / 10
DJ @ Fbaud / 10
TJ @ Fbaud / 500
RJ @ Fbaud / 500
DJ @ Fbaud / 500
TJ @ Fbaud / 1667
RJ @ Fbaud / 1667
DJ @ Fbaud / 1667
DCD+DDJvsUI @ Fbaud / 10
Frequency PLTD @ Fbaud / 10
Bathtub PLTD @ Fbaud / 10
DCD+DDJvsUI @ Fbaud / 500
Frequency PLTD @ Fbaud / 500
Bathtub PLTD @ Fbaud / 500
DCD+DDJvsUI @ Fbaud / 1667
Frequency PLTD @ Fbaud / 1667
Bathtub PLTD @ Fbaud / 1667
Normal channel voltage data
Complimentary channel voltage data
Differential voltage data
Common (A+B) voltage data
*/
*/
*/
*/
*/
*/
*/
*/
*/
*/
*/
*/
*/
*/
*/
*/
*/
*/
*/
*/
*/
*/
Compliance Point, may be one of the following constants:
0 – GEN2I Specification
1 – GEN2M Specification
Default:
0
Offset voltage used for scope acquire, specified in mV
Default:
0
Attenuation factor in dB, this is provided to allow the
results to be scaled to compensate for external attenuation
from sources such as probes.
Default:
0
Known Pattern With Marker Tool which specifies most of the
input and output parameters necessary for a data signal
analysis. The user will need to review all of the default
parameters of the Known Pattern With Marker Tool and decide
which to change.
Flag indicates valid data in structure
Internal parameter, do not modify.
Total Jitter with Fbaud/10 High Pass Filter Applied
©WAVECREST Corporation 2005
SECTION 2 – Measurement Commands and Structures 117
dRjit10
dDjit10
dTjit500
dRjit500
dDjit500
dTjit1667
dRjit1667
dDjit1667
tDdjt10
tFreq10
tBath10
tDdjt500
tFreq500
tBath500
tDdjt1667
tFreq1667
tBath1667
tNrmScop
tCmpScop
tDifScop
tComScop
Random Jitter with Fbaud/10 High Pass Filter Applied
Deterministic Jitter with Fbaud/10 High Pass Filter Applied
Total Jitter with Fbaud/500 High Pass Filter Applied
Random Jitter with Fbaud/500 High Pass Filter Applied
Deterministic Jitter with Fbaud/500 High Pass Filter Applied
Total Jitter with Fbaud/1667 High Pass Filter Applied
Random Jitter with Fbaud/1667 High Pass Filter Applied
Deterministic Jitter with Fbaud/1667 High Pass Filter Applied
DCD+DDJvsUI @ Fbaud/10
Frequency plot @ Fbaud/10
Bathtub plot @ Fbaud/10
DCD+DDJvsUI @ Fbaud/500
Frequency plot @ Fbaud/500
Bathtub plot @ Fbaud/500
DCD+DDJvsUI @ Fbaud/1667
Frequency plot @ Fbaud/1667
Bathtub plot @ Fbaud/1667
Normal channel voltage data
Complimentary channel voltage data
Differential mode (IN - /IN) voltage data
Common mode (IN + /IN) voltage data
void __stdcall FCNL_DefAta2 ( ATA2 *ata2 )
This function is used to fill the ata2 structure for the Serial ATA tool with reasonable default values. It is
recommended that this function be called initially even if parameters within the structure are to be adjusted
manually, and may be called repeatedly to reestablish initial conditions; however, this will impact test time.
Before calling this function, zero out the ATA2 structure using the standard memset() function to ensure that any
information pertaining to dynamic memory allocation is cleaned out prior to using the structure.
INPUTS
ata2 - Pointer to a ATA2 structure. Memory needs to be allocated by the caller.
OUTPUTS
None.
void __stdcall FCNL_ClrAta2 ( ATA2 *ata2 )
This function frees any dynamic memory that may have been allocated during previous data acquisitions and clears
out the ata2 structure.
INPUTS
ata2 - Pointer to a ATA2 structure. Memory needs to be allocated by the caller.
OUTPUTS
None.
EXAMPLE
static ATA2 ata2;
118
memset ( &ata2, 0, sizeof ( ATA2 ) );
FCNL_DefAta2 ( &ata2);
//declare ata2 to a structure of type
//ATA2
//clear the memory for ata2 structure
//set ata2 structures to default values
FCNL_RqstPkt ( ApiDevId, &ata2, WIND_ATA2 );
FCNL_RqstAll ( ApiDevId, &ata2, WIND_ATA2 );
//execute the measurement.
//get plot data
FCNL_ClrAta2 ( &ata2);
//deallocate the structure
Section 2 – Measurement Commands and Structures
©WAVECREST Corporation 2005
2-41 SERIAL ATA GEN1X & GEN2X TOOL
The SERIAL ATA GEN1X & GEN2X Tool provides both timing and amplitude compliance
measurements. It accurately determines device performance by quantifying both random and
deterministic jitter components.
typedef struct
{
/* Input parameters */
long
lCompPnt;
long
lVoff;
double dAttn;
EYEH
tEyeh;
/* Output parameters */
long
lGood;
long
lPad2;
PLTD
tNrmScop;
PLTD
tCmpScop;
PLTD
tDifScop;
PLTD
tComScop;
} ATAX;
lCompPnt
lVoff
dAttn
tEyeh
lGood
lPad2
tNrmScop
tCmpScop
tDifScop
tComScop
/*
/*
/*
/*
Compliance Point, see defines above
Offset voltage used for scope acquire
Attenuation factor (dB)
EYEH structure holds most information
*/
*/
*/
*/
/* Flag indicates valid data in structure */
/*
/*
/*
/*
Normal channel voltage data
Complimentary channel voltage data
Differential voltage data
Common (A+B) voltage data
*/
*/
*/
*/
Compliance Point, may be one of the following constants:
ATAX_RX_1X_MODE – 1X Receive Mode
ATAX_TX_1X_MODE – 1X Transmit Mode
ATAX_RX_2X_MODE – 2X Receive Mode
ATAX_TX_2X_MODE – 2X Transmit Mode
Default:
0
Offset voltage used for scope acquire, specified in mV
Default:
0
Attenuation factor in dB, this is provided to allow the
results to be scaled to compensate for external attenuation
from sources such as probes.
Default:
0
Random Data With Bit Clock Tool which specifies most of the
input and output parameters necessary for a data signal
analysis. The user will need to review all of the default
parameters of the Random Data With Bit Clock Tool and decide
which to change.
Flag indicates valid data in structure
Internal parameter, do not modify.
Normal channel voltage data
Complimentary channel voltage data
Differential mode (IN - /IN) voltage data
Common mode (IN + /IN) voltage data
©WAVECREST Corporation 2005
SECTION 2 – Measurement Commands and Structures 119
void __stdcall FCNL_DefAtax ( ATAX *atax )
This function is used to fill the atax structure for the Serial ATA tool with reasonable default values. It is
recommended that this function be called initially even if parameters within the structure are to be adjusted
manually, and may be called repeatedly to reestablish initial conditions; however, this will impact test time.
Before calling this function, zero out the ATAX structure using the standard memset() function to ensure that any
information pertaining to dynamic memory allocation is cleaned out prior to using the structure.
INPUTS
atax - Pointer to a ATAX structure. Memory needs to be allocated by the caller.
OUTPUTS
None.
void __stdcall FCNL_ClrAtax ( ATAX *atax )
This function frees any dynamic memory that may have been allocated during previous data acquisitions and clears
out the atax structure.
INPUTS
atax - Pointer to a ATAX structure. Memory needs to be allocated by the caller.
OUTPUTS
None.
EXAMPLE
static ATAX atax;
120
memset ( &atax, 0, sizeof ( ATAX ) );
FCNL_DefAtax ( &atax);
//declare atax to a structure of type
//ATAX
//clear the memory for atax structure
//set atax structures to default values
FCNL_RqstPkt ( ApiDevId, &atax, WIND_ATAX );
FCNL_RqstAll ( ApiDevId, &atax, WIND_ATAX );
//execute the measurement.
//get plot data
FCNL_ClrAtax ( &atax);
//deallocate the structure
Section 2 – Measurement Commands and Structures
©WAVECREST Corporation 2005
2-42 SERIAL ATA TOOL
The SATA Specification requires that jitter measurements be made from Data edge to Data edge
across varying spans. The spans are from 0 to 5 UI, and then from 6 to 250 UI. This tool automates
these measurements and provides pass/fail results. For the specification point A2, or 25,000 UI, a
1010 pattern is used and the Low frequency modulation tool can be used.
This tool requires no knowledge of the data stream prior to making a measurement. It simply
measures data edge to data edge and places the measurements in their relative bins. The bin size is
base on the "Bit Rate (Gb/s)" entered into the tool plus or minus 0.5 UI. For example, if a span of
1.12UI is measured, it is placed in the 1UI bin. Some random time later (see SIA-3000 measurement
theory) another measurement is made and is 2.34 UI, so it is placed in the 2UI bin. After each bin
has sufficient data, a tail-fit is performed on each UI span to get RJ, DJ and TJ at 10-12 BER.
typedef struct
{
PARM
tParm;
long
lPassCnt;
long
lPad1;
double dBitRate;
/* Output parameters */
long
lGood;
long
lTfit;
long
lMinHits;
long
lPad2;
/* Contains acquisition parameters
*/
/* Bit Rate, must be specified
*/
/* Flag indicates valid data in structure */
/* Flag indicates all tailfits are good
*/
/* Min hits across all DJ spans
*/
long
long
long
long
double
double
lSetSave[SATA_TFITS];/*****************************************/
lPad3;
/*
*/
lBinNumb[SATA_TFITS];/* These values are all used internally */
lPad4;
/*
*/
dLtSigma[SATA_TFITS][PREVSIGMA];/* DO NOT ALTER!
*/
dRtSigma[SATA_TFITS][PREVSIGMA];/******************************/
double
double
long
long
TFIT
PLTD
PLTD
PLTD
} SATA;
dDjit5, dDjit250;
dTjit5, dTjit250;
lHits[SATA_TFITS];
lPad5;
tTfit[SATA_TFITS];
tDjit;
tTjit;
tHist[SATA_TFITS];
tParm
lPassCnt
dBitRate
lGood
/* DJ at 5 and 250 spans
/* TJ at 5 and 250 spans
/* Contains count of histogram hits
/*
/* Structure containing tail-fit info
/* Determinstic Jitter plot
/* Total Jitter plot
/* Histograms for specific spans
*/
*/
*/
*/
*/
*/
*/
*/
A structure of type PARM that contains acquisition parameter.
The PARM is discussed in full detail in Section 2-4.
This parameter is a bi-directional structure element that
tracks the number of acquisitions since last reset. This flag
can be read after an execution or set prior to an execution.
Setting this parameter to 0 essentially resets the accumulated
data. A measurement can be performed repeatedly with the same
structure. It will be automatically incremented by the next
measurement.
Valid Entries: any integer greater than or equal to 0
Default:
0
Bit Rate, must be specified
Default:
1.5e9
Flag indicates valid data in structure
©WAVECREST Corporation 2005
SECTION 2 – Measurement Commands and Structures 121
lTfit
Flag indicates all tailfits are good
lMinHits
Min hits across all DJ spans
lSetSave[n],lBinNumb[n],dLtSigma[n][m],dRtSigma[n][m] These values are all
used internally, DO NOT ALTER!
dDjit5
DJ at 5 spans
dDjit250
DJ at 250 spans
dTjit5
TJ at 5 spans
dTjit250
TJ at 250 spans
lHits[n]
Contains count of histogram hits
tTfit[n]
Structure containing tail-fit info
tDjit
Determinstic Jitter
tTjit
Total Jitter
tHist[n]
Histograms for specific spans
void __stdcall FCNL_DefSata ( SATA *sata )
This function is used to fill the sata structure for the Serial ATA tool with reasonable default values. It is
recommended that this function be called initially even if parameters within the structure are to be adjusted
manually, and may be called repeatedly to reestablish initial conditions; however, this will impact test time.
Before calling this function, zero out the SATA structure using the standard memset() function to ensure that any
information pertaining to dynamic memory allocation is cleaned out prior to using the structure.
INPUTS
sata - Pointer to a SATA structure. Memory needs to be allocated by the caller.
OUTPUTS
None.
void __stdcall FCNL_ClrSata ( SATA *sata )
This function frees any dynamic memory that may have been allocated during previous data acquisitions and clears
out the sata structure.
INPUTS
sata - Pointer to a SATA structure. Memory needs to be allocated by the caller.
OUTPUTS
None.
EXAMPLE
static SATA ser_ata;
122
memset ( &ser_ata, 0, sizeof ( SATA ) );
FCNL_DefSata ( &ser_ata);
//declare ser_ata to a structure of type
//SATA
//clear the memory for ser_ata structure
//set ser_ata structures to default values
FCNL_RqstPkt ( ApiDevId, &ser_ata, WIND_SATA );
FCNL_RqstAll ( ApiDevId, &ser_ata, WIND_SATA );
//execute the measurement.
//get plot data
FCNL_ClrSata ( &ser_ata);
//deallocate the structure
Section 2 – Measurement Commands and Structures
©WAVECREST Corporation 2005
2-43 SPREAD SPECTRUM TOOL
The SSC tool will measure the appropriate number of the input clock cycles to see the maximum
peak-to-peak deviation due to the SSC profile (see figure below). This will be equal to the
fundamental frequency divided by the frequency of ½ the SSC cycle. The tool will search for this
maximum deviation within the range of possible SSC frequencies entered in the "Max. SSC Freq.
(kHz)" and "Min. SSC Freq. (kHz)" inputs.
The SSC tool will then measure a histogram of this span and determine the PPM deviation
form the input "Nominal Freq. (MHz)". The figure below shows what this corresponds to in
the frequency domain.
©WAVECREST Corporation 2005
SECTION 2 – Measurement Commands and Structures 123
typedef struct
{
/* Input parameters */
PARM
tParm;
double dBegFreq;
double dEndFreq;
double dNomFreq;
long
lClokDiv;
long
lHstSamp;
long
lPpmAvgs;
long
lSscStds;
/* Output parameters */
long
lGood;
long
lMaxSpan;
double dCarFreq;
double dModFreq;
double dPpmPstv;
double dPpmNgtv;
double dMeasMin;
double dMeasMax;
double dMeasAvg;
double dMeasSig;
double dUnitInt;
PLTD
tHist;
PLTD
tSigm;
} SSCA;
124
/*
/*
/*
/*
/*
/*
/*
/*
Contains acquisition parameters
Starting freq to find peak jitter span
Ending freq to find peak jitter span
Nominal frequency
Scaling factor for divided clock
Samples for histogram at peak span
2^lPpmAvgs used to average results
Standard used, see above defines
*/
*/
*/
*/
*/
*/
*/
*/
/*
/*
/*
/*
/*
/*
/*
/*
/*
/*
/*
/*
/*
Flag indicates valid data in structure
Span across which max jitter is found
Measured carrier frequency
Apparent jitter modulation frequency
Parts per million positive
Parts per million negative
Minimum value in measured normal data
Maximum value in measured normal data
Average value of measured normal data
1-Sigma value of measured normal data
Unit Interval of data signal
Histogram of results for peak freq.
1-Sigma data to find max jitter span
*/
*/
*/
*/
*/
*/
*/
*/
*/
*/
*/
*/
*/
Section 2 – Measurement Commands and Structures
©WAVECREST Corporation 2005
tParm
dBegFreq
dEndFreq
dNomFreq
lClokDiv
lHstSamp
lPpmAvgs
lSscStds
lGood
lMaxSpan
dCarFreq
dModFreq
dPpmPstv
dPpmNgtv
dMeasMin
dMeasMax
dMeasAvg
dMeasSig
dUnitInt
tHist
tSigm
A structure of type PARM that contains acquisition parameter.
The PARM is discussed in full detail in Section 2-4.
Starting freq to find peak jitter span
Valid Range:
1e3 to 1e6
Default:
30e3
Ending freq to find peak jitter span
Valid Range:
1e3 to 1e6
Default:
33e3
Nominal frequency
Valid Range:
1e6 to 10e9
Default:
750e6
Scaling factor for divided clock
Valid Range:
1 to 5
Default:
1
Samples for histogram at peak span
Valid Range:
1 to 950,000
Default:
100,000
This variable is used to calculate the number of averages to
use. Increasing the number of averages reduces the background
noise associated with the algorithm. The number of averages is
calculated based on the equation:
where
n = lFftAvgs
AVERAGES = 2n
Valid Entries: any integer greater than or equal to 0
Default:
0 (indicating 20 averages = 1 execution.)
Standard used, the following defines apply:
SSCA_USER, SSCA_SATA1, SSCA_SATA2, SSCA_PCIX
Default:
SSCA_SATA1
Flag indicates valid data in structure
Span across which max jitter is found
Measured carrier frequency
Apparent jitter modulation frequency
Parts per million positive
Parts per million negative
Minimum value in measured normal data
Maximum value in measured normal data
Average value of measured normal data
1-Sigma value of measured normal data
Unit Interval of data signal
Histogram of results for peak freq.
1-Sigma data to find max jitter span
©WAVECREST Corporation 2005
SECTION 2 – Measurement Commands and Structures 125
void __stdcall FCNL_DefSsca ( SSCA *ssca )
This function is used to fill the ssca structure for the SSC tool with reasonable default values. It is recommended
that this function be called initially even if parameters within the structure are to be adjusted manually, and may be
called repeatedly to reestablish initial conditions; however, this will impact test time.
Before calling this function, zero out the SSCA structure using the standard memset() function to ensure that any
information pertaining to dynamic memory allocation is cleaned out prior to using the structure.
INPUTS
ssca - Pointer to a SSCA structure. Memory needs to be allocated by the caller.
OUTPUTS
None.
void __stdcall FCNL_ClrSsca ( SSCA *ssca )
This function frees any dynamic memory that may have been allocated during previous data acquisitions and clears
out the ssca structure.
INPUTS
ssca - Pointer to a SSCA structure. Memory needs to be allocated by the caller.
OUTPUTS
None.
EXAMPLE
static SSCA spread;
126
memset ( &spread, 0, sizeof ( SSCA ) );
FCNL_DefSsca ( &spread);
//declare spread to a structure of type
//SSCA
//clear the memory for spread structure
//set spread structures to default values
FCNL_RqstPkt ( ApiDevId, &spread, WIND_CLOK );
FCNL_RqstAll ( ApiDevId, &spread, WIND_CLOK );
//execute the measurement.
//get plot data
FCNL_ClrSsca ( &spread);
//deallocate the structure
Section 2 – Measurement Commands and Structures
©WAVECREST Corporation 2005
typedef struct
{
/* Input parameters */
PARM
tParm;
long
lPfnd;
long
lAutoFix;
/* Output parameters */
long
lGood;
long
lPad1;
double dMean;
double dMaxi;
double dMini;
double dSdev;
double dDuty;
double dFreq;
double dVmin[ 2 ];
double dVmax[ 2 ];
} STAT;
tParm
lPfnd
lAutoFix
100,000th edge
1 edge
dVmax
dVmin
measurement
tACCUM_PER
dMaxi
dMean
dFreq = 100,000/tACCUM_PER
dMini
The statistics tool is used to capture a few basic
parameters of a measurement that the user
selected in the tParm structure. The statistics tool
will also return voltage parameters of the signal
under test. As seen in the accompanying example
for a simple period measurement, the number of
parameters returned may be more extensive than
is typically desired in a production program. For
a simple time measurement, it is best to use the
histogram tool which can be set to return just the
statistics of the interest and not any of the
voltage information nor the extra timing
measurements as is captured in this tool. There is
added test time to capture duty cycle, frequency
and the voltage parameters.
0 edge
2-44 STATISTICS TOOL
Example of a period measurement using the Statistics Utility
/* Contains acquisition parameters
*/
/* Force a pulse-find before each measure */
/* If true perform a pulsefind as req'd
*/
/* Flag indicates valid data in structure */
/*
/*
/*
/*
/*
/*
/*
/*
Contains the returned average value
Contains the returned maximum value
Contains the returned minimum value
Contains the returned 1-Sigma value
Contains the returned duty cycle
Contains the carrier frequency
Pulse-find Min voltage for Start&Stop
Pulse-find Max voltage for Start&Stop
*/
*/
*/
*/
*/
*/
*/
*/
A structure of type PARM that contains acquisition parameter.
The PARM is discussed in full detail in Section 2-4.
A flag used to force the execution of a pulse find execution.
In normal operation, the SIA3000 dynamically decides whether a
pulsefind is necessary based on previous test conditions. In
may cases, this is sufficient. However, in a production
environment, the previous test may have the same type of
voltage settings, however, the devices are different and may
have different voltage characteristics and would thus require
a pulse find on each device. Be aware that most production
test have specified amplitudes at which measurements are to be
made such that the programmer must specify the amplitude in
tPARM rather than use pulse find to establish test conditions.
Valid Entries: 0 – No pulsefind prior to measurement
1 – perform a pulse find.
Default:
0
Flag to indicate to the system whether pulse find should be
performed if needed. This flag essentially enables the
“automatic pulse find” capability which will execute a
©WAVECREST Corporation 2005
SECTION 2 – Measurement Commands and Structures 127
lGood
dMean
dMaxi
dMini
dSdev
dDuty
dFreq
dVmin
dVmax
pulsefind based on the previous test setup and not with any
regard to device-device variations in amplitude.
Valid Entries: 0 – No pulsefind prior to measurement
1 – Pulsefind if the measurement mode changed.
Default:
0
Flag used to indicate valid output data in structure.
Contains the returned average value.
Contains the returned maximum value.
Contains the returned minimum value.
Contains the returned 1-Sigma value.
Contains the returned duty cycle of the signal being measured.
This is not measured if a two channel measurement is being
performed.
Contains the frequency of the signal being measured. This is
not measured if a two channel measurement is being performed.
Min voltage returned from last pulse-find. It is important to
note that the accuracy of this voltage measurement is severely
bandwidth limited. For accurate amplitude measurements, use
the oscilloscope tool.
Max voltage returned from last pulse-find. It is important to
note that the accuracy of this voltage measurement is severely
bandwidth limited. For accurate amplitude measurements, use
the oscilloscope tool.
void __stdcall FCNL_DefStat ( STAT *stat )
This function is used to fill the stat structure for the Statistics tool with reasonable default values. It is recommended
that this function be called initially even if parameters within the structure are to be adjusted manually, and may be
called repeatedly to reestablish initial conditions; however, this will impact test time.
Before calling this function, zero out the STAT structure using the standard memset() function to ensure that any
information pertaining to dynamic memory allocation is cleaned out prior to using the structure.
INPUTS
stat - Pointer to a STAT structure. Memory needs to be allocated by the caller.
OUTPUTS
None.
128
Section 2 – Measurement Commands and Structures
©WAVECREST Corporation 2005
void __stdcall FCNL_ClrStat ( STAT *stat )
This function frees any dynamic memory that may have been allocated during previous data acquisitions and clears
out the stat structure.
INPUTS
stat - Pointer to a STAT structure. Memory needs to be allocated by the caller.
OUTPUTS
None.
EXAMPLE
#define TRUE 1
#define FALSE 0
static STAT statistics;
//declare statistics to be a structure of
//type STAT
memset ( &statistics, 0, sizeof ( STAT ) );
//clear the memory for statistics structure
FCNL_DefStat ( &statistics);
//set statistics structure to default values
//NOTE: statistics.tparm, are also set to
//defaults by this command.
statistics.tParm.lChanNum = 2 | (3<<16);
//Set ch 2 for start and ch 3 for stop
statistics.tParm.lSampCnt = 1,000;
//Set sample size to 1k per burst.
statistics.tParm.lFuncNum = FUNC_TPD_PP;
//make propogation delay meas. from
//rising edge on ch2 to rising edge on
//ch 2.
statistics.tParm.lExternArm = 1;
//use ch1 as arm channel
statistics.tParm.lAutoArm = ARM_EXTRN;
//use External Arming
statistics.tParm.lStrtCnt = 1;
//start measurement on first edge of
//ch2 after the arm signal.
statistics.tParm.lStopCnt = 6;
//stop measurement on sixth edge of
//ch3 after the arm signal.
FCNL_RqstPkt ( ApiDevId, & statistics, WIND_STAT ); //execute the measurement.
If (statistics.lGood=TRUE)
{
printf(“\nSkew = %d\n”,statistics.dMean);
printf(“\nSkew jitter = %d\n”,statistics.dSdev);
}
FCNL_ClrStat ( &statistics);
©WAVECREST Corporation 2005
//Print skew measurement
//print skew jitter result
//deallocate the structure
SECTION 2 – Measurement Commands and Structures 129
2-45 STRIPCHART TOOL
The Time Series Tool is used to capture timing issues that are occurring at sub Hertz rates. This tool
performs a measurement, extracts the statistical information from the measurement burst then waits a
defined interval and performs the measurement again. This type of measurement is used in Allan
Variance measurements and in real time debugging of various environment parameters (such as
VDD, VIL/VIH, timing skew, etc.) and their impact on various time measurements (such as period,
jitter, slew rate and modulation). To use this tool, the user must initiate a measurement with the
TSER structure in a loop that includes the wait time between measurements.
If this tool is to be used as a debug tool, it is recommended that the plot be redrawn between
measurements so as to allow the user to see a real-time display of the successive measurements. It is
also recommended that this routine be placed in a user-aborted infinite loop such that the user can
initiate and stop a Time Series measurement session.
If this tool is used to simply gather a fixed number of successive measurements and to analyze the
variance of the mean/peak-peak/1s/min/max over the said number of successive iterations, then the
last execution’s plot structures will contain all of the combined results.
In both cases, be sure to initialize the TSER structure element lNumb to zero when the first
measurement is performed via a call to FCNL_RqstPkt(). On subsequent calls, be sure to leave the
lNumb parameter undeclared so that the tool will continue to accumulate measurements on each
successive measurement burst. Measurements are acquired as follows:
Call FCNL_RqstPkt() with TSER
structure element “lNumb” set
to zero to reset plot arrays and
clear old data.
*/
nth Meas.
TParm.lStopCnt
TParm.lStrtCnt
TParm.lStopCnt
TParm.lStrtCnt
2nd Meas.
TParm.lStopCnt
TParm.lStopCnt
TParm.lStrtCnt
1st Meas.
nth Meas.
TParm.lStrtCnt
TParm.lStopCnt
TParm.lStrtCnt
TParm.lStopCnt
TParm.lStrtCnt
2nd Measurement
Burst
Call FCNL_RqstPkt() with TSER
structure element “lNumb”
undeclared. Use a software wait
statement between function
calls to control delay between
bursts.
typedef struct
{
/* Input parameters
PARM
tParm;
long
lNumb;
long
lPad1;
double dSpan;
long
lAutoFix;
130
2nd Meas.
nth Meas.
1st Measurement
Burst
1st Meas.
TParm.lStopCnt
TParm.lStrtCnt
TParm.lStopCnt
2nd Meas.
TParm.lStrtCnt
TParm.lStopCnt
1st Meas.
Signal (Fc)
TParm.lStrtCnt
Time Series of Period Measurements Example
nth Measurement
Burst
Call FCNL_RqstPkt() with TSER
structure element “lNumb”
undeclared. Use a software wait
statement between function
calls to control delay between
bursts.
Implement a dialog box with
user to end loop, or, repeat
loop sufficiently to acquire
accurate Allan Variance
estimate.
/* Contains acquisition parameters
*/
/* Measurements so far, set to 0 to reset */
/* Span between measurements in seconds
/* If true perform a pulsefind as req'd
Section 2 – Measurement Commands and Structures
*/
*/
©WAVECREST Corporation 2005
/* Output parameters */
long
lGood;
double dYstd;
double dAvar;
double
double
dSumm;
dTyme;
PLTD
PLTD
PLTD
PLTD
PLTD
PLTD
} TSER;
tMean;
tMini;
tMaxi;
tTime;
tSdev;
tPeak;
tParm
lNumb
lAutoFix
lGood
dYstd
dAvar
tMean
tMini
tMaxi
/* Flag indicates valid data in structure */
/* 1-Sigma value calculated on all data
*/
/* Allan variance calculation
*/
/******************************************/
/* These values are all used internally */
/*
as part of the measurement process
*/
/*
DO NOT ALTER!
*/
/******************************************/
/* Contains the average plot array
*/
/* Contains the minimum plot array
*/
/* Contains the maximum plot array
*/
/* Contains the time samples were taken
*/
/* Contains the 1-Sigma plot array
*/
/* Contains the ( max - min ) plot array */
A structure of type PARM that contains acquisition parameter.
The PARM is discussed in full detail in Section 2-4.
When implemented correctly, a measurement is performed
repeatedly with the TSER structure to generate a Time Series
plot of a given measurement. (User defines measurement
parameters in tParm.). For the first execution, set lNumb to
zero to reset the plot arrays. All subsequent measurements
should not assign any value to this structure element. This
parameter is automatically incremented by the next measurement
and can be read after execution to determine the number of
times this structure has been called.
Valid Entries: 0 reset counter and clear all plot data.
Default:
Increment previous value.
Flag indicating whether to perform a pulse-find as required.
Setting this value to any integer greater than zero tells the
measurement to perform a pulse find if needed. The system will
know if a measurement was recently performed and if a pulse
find is necessary.
Valid Entries: 0 – no pulsefind prior to measurement
1 – pulsefind if the measurement mode changed.
Default:
0
Flag indicates valid output data in structure.
1-Sigma, or standard deviation of all data.
Allan variance estimate.
Structure of type PLTD which contains all of the plot
information to generate a diagram of mean values versus
iteration number. Use this in PLTD structure in conjunction
with the structure tTime to generate a Maximum measurement
versus time plot. See Section 2-3 for details of the PLTD
structure and its elements.
Structure of type PLTD which contains all of the plot
information to generate a diagram of minimum measurement of a
given burst versus iteration number. Use this in PLTD
structure in conjunction with the structure tTime to generate a
Maximum measurement versus time plot. See Section 2-3 for
details of the PLTD structure and its elements.
Structure of type PLTD which contains all of the plot
information to generate a diagram of maximum measurement of a
given burst versus iteration number. Use this in PLTD
structure in conjunction with the structure tTime to generate a
©WAVECREST Corporation 2005
SECTION 2 – Measurement Commands and Structures 131
Maximum measurement versus time plot. See Section 2-3 for
details of the PLTD structure and its elements.
tTime
Structure of type PLTD which contains all of the time values at
which measurements were taken. Use this structure in
conjunction with tMini, tMaxi, tSdev, tPeak & tMean to plot
said structures as a function of time. . See Section 2-3 for
details of the PLTD structure and its elements.
tSdev
Structure of type PLTD which contains all of the plot
information to generate a diagram of 1-Sigma values of a given
burst versus iteration number. Use this in PLTD structure in
conjunction with the structure tTime to generate a Maximum
measurement versus time plot. See Section 2-3 for details of
the PLTD structure and its elements.
tPeak
Structure of type PLTD which contains all of the plot
information to generate a diagram of peak to peak (maximum
measurement – minimum measurement) of a given burst versus
iteration number. Use this in PLTD structure in conjunction
with the structure tTime to generate a Maximum measurement
versus time plot. See Section 2-3 for details of the PLTD
structure and its elements.
dSumm, dTyme, dSpan These values are all used internally, DO NOT ALTER!
void __stdcall FCNL_DefTser ( TSER *tser )
This function is used to fill the tser structure for the Time Series tool with reasonable default values. It is
recommended that this function be called initially even if parameters within the structure are to be adjusted
manually, and may be called repeatedly to reestablish initial conditions; however, this will impact test time.
Before calling this function, zero out the TSER structure using the standard memset() function to ensure that any
information pertaining to dynamic memory allocation is cleaned out prior to using the structure.
INPUTS
tser - Pointer to a TSER structure. Memory needs to be allocated by the caller.
OUTPUTS
None.
132
Section 2 – Measurement Commands and Structures
©WAVECREST Corporation 2005
void __stdcall FCNL_ClrTser ( TSER *tser )
This function frees any dynamic memory that may have been allocated during previous data acquisitions and clears
out the tser structure.
INPUTS
tser - Pointer to a TSER structure. Memory needs to be allocated by the caller.
OUTPUTS
None.
EXAMPLE
#define TRUE 1
#define FALSE 0
static TSER tiseries;
memset ( &tseries, 0, sizeof ( TSER ) );
FCNL_DefTser ( &tseries);
tseries.tParm.lChanNum = 1;
tseries.tParm.lSampCnt = 1000;
tseries.tParm.lFuncNum = FUNC_PER;
//declare tseries to be a structure of
//type TSER
//clear the memory for tseries structure
//set tseries structure to default values
//NOTE: tseries.tparm, are also set to
//defaults by this command.
//Set ch 1 to be measured channel
//Set sample size to 1k per burst.
//make period measurements
for (I=0;I<100,000;I++)
{
FCNL_RqstPkt ( ApiDevId, &tseries, WIND_TSER ); //execute the measurement.
plot_data(tseries.tPeak);
//call subroutine which generates a plot
}
//of the data contained in the
//tseries.tPeak PLTD structure.
FCNL_ClrTser ( &tseries);
void plot_data(PLTD *plotstruc)
{
//deallocate the structure
//see section 2-40 for an example of
//a subroutine which will plot a PLTD
//structure.
}
©WAVECREST Corporation 2005
SECTION 2 – Measurement Commands and Structures 133
2-46 RETRIEVING SPIKELISTS
Many of the tools that contain FFT’s have the ability to detect and characterize spikes by their
frequency and amplitude from within the GUI. The commands used to retrieve the spikelists were
designed to remain flexible, and if used properly will adapt from release to release with a simple
recompile of your source code. This functionality is supported via the low level GPIB command set
and the low level communication functions in Section 4. The spikelist GPIB commands take the
following form:
Command syntax- :SPIKelist:<toolname>(@n)<offset>
<toolname>
(@n)
<offset>
is replaced with the same name used with the :ACQUIRE command
is used to specify the channel which the spikelist is taken
from
is the length in bytes from the start of a binary packet to
the pointer to the spikelist to be returned in the same binary
packet, it is normally calculated from the structure
definition
The correct way to obtain the spikelist is shown in the following example:
// Initialize RCPM structure and set to defaults
static RCPM bcam;
memset ( &bcam, 0, sizeof ( RCPM ) );
FCNL_DefRcpm ( &bcam);
//execute the measurement
FCNL_RqstPkt ( ApiDevId, &bcam, WIND_RCPM );
// Create the command to get the spikelist
sprintf(buffer, “:SPIK:CLKANDMARK(@1)%i”, (long)&bcam.lPeakData–
(long)&bcam);
// Send the command and place the returned data into the spikelist buffer
COMM_ReqBin ( ApiDevId, buffer, strlen(buffer), spikes, sizeof(spikes) );
// Use the spikelist as required
134
Section 2 – Measurement Commands and Structures
©WAVECREST Corporation 2005
2-47 EXAMPLE OF HOW TO DRAW USING A PLTD STRUCTURE:
/**********************************************************************************/
/* DrawPlot() is a function that will plot a graph based on the variables defined */
/* in the PLTD structure passed into this function.
*/
/* (1) get initial (x,y) coordinates within diagram to start plot.
*/
/* (2) Normalize (x,y) coordinates to amplitudes between 0 and 1 to represent
*/
/*
their relative location between [xmin,xmax] or [ymin,ymax] for
*/
/*
x coordinates and y coordinates respectively
*/
/* (3) Initialize the pointer pCdc to the start of the plot in units of pixels
*/
/* (4) step through the data array, normalize the coordinates and pass them to
*/
/*
the pCdc function to draw a line to from the previous pCdc location.
*/
/* (5) repeat step 4 for all coordinates.
*/
/* The variables passed into the function are:
*/
/* CDC *pCdc – Windows® pointer to communicate cursor location during plot.
*/
/* Crect *wind – Windows® pointer to indicate window size and location in the
*/
/*
display. the parameters are in units of pixels top, bottom, left */
/*
and right define the boundaries for the display window. The
*/
/*
origin is set to the upper left hand corner with increasing
*/
/*
amplitude to the lower right hand corner.
*/
/* PLTD *pldt – Wavecrest plot structure
*/
/* double xmax – user specified maximum x value for x-axis. This may be larger
*/
/*
than pltd.dXmax if a margin is desired. Xmax is in same units as */
/*
the pldt structure’s x axis elements.
*/
/* double xmin - user specified minimum x value for x-axis. This may be smaller
*/
/*
than pltd.dXmin if a margin is desired. Xmin is in same units as */
/*
the pldt structure’s x axis elements.
*/
/* double ymax – user specified maximum y value for y-axis. This may be larger
*/
/*
than pltd.dYmax if a margin is desired. Ymax is in same units
*/
/*
as the pldt structure’s y axis elements.
*/
/* double ymin - user specified minimum x value for x-axis. This may be larger
*/
/*
than pltd.dYmin if a margin is desired. Ymin is in same units
*/
/*
as the pldt structure’s y axis elements.
*/
/**********************************************************************************/
void DrawPlot(CDC *pCdc, CRect *rect, PLTD *plot,
double xmin, double xmax, double ymin, double ymax)
{
long i;
double x, y;
double xrange = xmax-xmin;
double yrange = ymax-ymin;
x = (plot->dXmin - xmin) / xrange; //normalize first X plot point
x = (double)(rect.right-rect.left)*x+(double)rect.left; //convert first plot point to
Windows®
//coordinates in pixels
y = (plot.dData[0]-ymin)/yrange; //normalize first Y plot point
y = (double)(rect.bottom-rect.top)*(1.0-y) //convert first plot point to Windows®
+ (double) rect.top;
//coordinates in pixels. Note, the
//(1.0-y) function is used to account for
//the reverse direction of the coordinate
//system between pixels and the plot elements
pCdc.MoveTo ((int)x,(int)y); //move display cursor to start of plot
for ( i = 1; i < plot.lNumb; i++ )
{
x = ((plot.dXmax–plot.dXmin)*(double)i //find next x-coordinate
/ (double)(plot.lNumb-1)+plot.dXmin );
x = (x-xmin)/xrange; //normalize new x-coordinate
x = (double)(rect.right–rect.left)*x+(double)rect.left; //convert new x-coord to Windows®
//coordinates in pixels.
y = ( plot.dData[ i ]-ymin)/yrange; //find next y-coordinate and normalize it
y = (double)(rect.bottom-rect.top)*(1.0-y) //convert y-coord to Windows® pixel
+ (double) rect.top;
//coordinates
pCdc.LineTo((int)x,(int)y); //draw a line from previous cursor
//location to new (x,y) coordinates.
}
return 0;
}
©WAVECREST Corporation 2005
SECTION 2 – Measurement Commands and Structures 135
2-48 DEFINES FOR VALUES IN MEASUREMENT STRUCTURES
The following defines were created to aid in assigning values to various fields in the binary packet
structure. They would have been referenced in the above definitions.
/* Standard acquire functions */
#define FUNC_TPD_PP
1
/* TPD +/+
2-Chan
#define FUNC_TPD_MM
2
/* TPD -/2-Chan
#define FUNC_TPD_PM
3
/* TPD +/2-Chan
#define FUNC_TPD_MP
4
/* TPD -/+
2-Chan
#define FUNC_TT_P
5
/* Rising edge
1-Chan
#define FUNC_TT_M
6
/* Falling Edge
1-Chan
#define FUNC_PW_P
7
/* Positive pulse width
1-Chan
#define FUNC_PW_M
8
/* Negative pulse width
1-Chan
#define FUNC_PER
9
/* Period
1-Chan
#define FUNC_FREQ
10
/* Frequency
1-Chan
#define FUNC_PER_M
11
/* Period minus
1-Chan
/* Available analysis macros */
#define ANAL_FUNC
0
/* Function analysis macro
#define ANAL_JITT
1
/* Jitter analysis macro
#define ANAL_RANG
2
/* Range analysis macro
#define ANAL_CLOK
3
/* PW+/PW-/PER+/PER- macro
/* Stop count designators specific to ANAL_FUNC macro */
#define ANL_FNC_FIRST 0
/* Arm start first
#define ANL_FNC_PLUS1 1
/* Start + 1
#define ANL_FNC_START 2
/* Start
/* Rise/Fall edge designators */
#define EDGE_FALL
0
/* Measurement reference is falling edge
#define EDGE_RISE
1
/* Measurement reference is rising edge
#define EDGE_BOTH
2
/* Used for DDR in EYEH, DBUS, & FCMP
/* Pulsefind mode designators */
#define PFND_FLAT
0
/* Use flat algorithm for pulse-find calc
#define PFND_PEAK
1
/* Use peak value for pulse-find calc
/* Pulsefind percentage designators */
#define PCNT_5050
0
/* Use 50/50 level for pulse-find calc
#define PCNT_1090
1
/* Use 10/90 level for pulse-find calc
#define PCNT_9010
2
/* Use 90/10 level for pulse-find calc
#define PCNT_USER
3
/* Do NOT perform pulse-find; manual mode
#define PCNT_2080
4
/* Use 20/80 level for pulse-find calc
#define PCNT_8020
5
/* Use 80/20 level for pulse-find calc
/* Arming mode designators */
#define ARM_EXTRN
0
/* Arm using one of the external arms
#define ARM_START
1
/* Auto-arm on next start event
#define ARM_STOP
2
/* Auto-arm on next stop event
/* Valid lCmdFlag values for special features */
#define CMD_PATNMARK
(1<<4)
#define CMD_BWENHANCED
(1<<10)
/* Constants to assist in setting lArmMove
#define ARMMOVE_MAX_STEP
40
#define ARMMOVE_MIN_STEP
-40
#define ARMMOVE_PICO_PER_STEP 25
/* Used for structure definitions below */
#define POSS_CHNS
10
/* Constants used to identify FFT window type
#define FFT_RCT
0
/* Rectangular window
#define FFT_KAI
1
/* Kaiser-Bessel window
#define FFT_TRI
2
/* Triangular window
#define FFT_HAM
3
/* Hamming window
#define FFT_HAN
4
/* Hanning window
#define FFT_BLK
5
/* Blackman window
136
Section 2 – Measurement Commands and Structures
*/
*/
*/
*/
*/
*/
*/
*/
*/
*/
*/
*/
*/
*/
*/
*/
*/
*/
*/
*/
*/
*/
*/
*/
*/
*/
*/
*/
*/
*/
*/
*/
*/
*/
*/
*/
*/
*/
*/
*/
©WAVECREST Corporation 2005
#define FFT_GAU
6
/* Gaussian window
*/
/* Constants used by new scope tool to identify which plot to show */
#define SCOP_INPS_NORM 0
#define SCOP_INPS_COMP 1
#define SCOP_INPS_DIFF 2
#define SCOP_INPS_BOTH 3
#define SCOP_INPS_COMM 4
/* Constants used by new scope tool for measures to calculate */
#define SCOP_MEAS_VEXTREME (1<<0)
#define SCOP_MEAS_VTYPICAL (1<<1)
#define SCOP_MEAS_WAVEFORM (1<<2)
#define SCOP_MEAS_OVERUNDR (1<<3)
#define SCOP_MEAS_RISEFALL (1<<4)
#define SCOP_MEAS_VERTHIST (1<<5)
#define SCOP_MEAS_HORZHIST (1<<6)
#define SCOP_MEAS_EYEMASKS (1<<7)
/* Used internally for tailfit algorithm */
#define PREVSIGMA 5
/* Used by Advanced PLL tool */
#define MIN_APLL_INI_DAMP_FCT 1e-3
#define MAX_APLL_INI_DAMP_FCT 10.0
#define MIN_APLL_INI_NAT_FREQ 10.0
#define MAX_APLL_INI_NAT_FREQ 10e9
#define MIN_APLL_INI_NOISEPSD -120
#define MAX_APLL_INI_NOISEPSD -40
/* Used by Phase Noise tool for number of decades to span */
#define DECADES 8
/* Constants for: lTailFit the number of dataCOM tailfits to perform */
#define DCOM_NONE
0
#define DCOM_AUTO
1
#define DCOM_FIT3
2
#define DCOM_FIT5
3
#define DCOM_FIT9
4
#define DCOM_FIT17 5
#define DCOM_ALL
6
#define DCOM_1SIGMA 7
/* Constants for: lFitPcnt the auto-mode percentage to converge within */
#define DCOM_PCNT5
0
#define DCOM_PCNT10 1
#define DCOM_PCNT25 2
#define DCOM_PCNT50 3
/* Constance used for PCI Express mode */
#define PCIX_SCOP_AVG 8
#define PCIX_RX_MODE 0
#define PCIX_TX_MODE 1
#define PCIX_RX_CARD 2
#define PCIX_TX_CARD 3
#define PCIX_RX_SYST 4
#define PCIX_TX_SYST 5
#define PCIX_SPECS 6
#define PCIX_EYE_XDOTS 408
#define PCIX_EYE_YDOTS 630
/* Constants used for Serial ATA tool */
#define SATA_SPANS 250
#define SATA_TFITS 11
/* Constants used to identify which clock analysis measures to calculate
*/
#define CANL_MEAS_RISEFALL (1<<0)
#define CANL_MEAS_VTYPICAL (1<<1)
#define CANL_MEAS_VEXTREME (1<<2)
#define CANL_MEAS_OVERUNDR (1<<3)
©WAVECREST Corporation 2005
SECTION 2 – Measurement Commands and Structures 137
#define CANL_MEAS_WAVEMATH (1<<4)
#define CANL_MEAS_TIMEPARM (1<<5)
#define CANL_MEAS_TAILFITS (1<<6)
#define CANL_MEAS_PERIODIC (1<<7)
/* Constants to define the number of random data tailfits to perform */
#define RAND_AUTO
0
#define RAND_FIT3
1
#define RAND_FIT5
2
#define RAND_FIT9
3
#define RAND_FIT17 4
/* Constants for percentage to succeed when Random Data using auto-mode */
#define RAND_PCNT5
0
#define RAND_PCNT10 1
#define RAND_PCNT25 2
#define RAND_PCNT50 3
/* Constants used for Rambus DRCG adjacent cycle tool */
#define DRCG_SWEEPS 4
#define DRCG_CYCLES 6
/* Constants used for Spread Spectrum tool */
#define SSCA_USER 0
#define SSCA_SATA1 1
#define SSCA_SATA2 2
#define SSCA_PCIX 3
/* Constants used for filter selection */
#define FILTERS_DISABLED 0
#define BRICKWALL_FILTER 1
#define ROLLOFF_1STORDER 2
#define ROLLOFF_2NDORDER 3
#define PCIX_CLOK_FILTER 10
138
Section 2 – Measurement Commands and Structures
©WAVECREST Corporation 2005
SECTION 3 – GENERAL COMMAND REFERENCE
The WAVECREST Production API provides low level and administrative functions to simplify
GPIB operations and provide advanced configuration and measurement options. With the exception
of the GPIB functions that initialize device communication via the ApiDevID, these functions are
not prerequisite for using the Production API to acquire simple measurements. Most of these
routines provide greater flexibility for the advanced user.
This chapter provides a general overview of these functions along with examples for the more
commonly used functions. These functions apply to all tools, but may require the pointer to a
specific measurement window structure to be passed along with a type identifier (i.e., WIND_HIST).
For more information regarding specific measurement tools and their corresponding measurement
window structures and commands, refer to the previous chapter.
NOTE: __stdcall and DllCall are part of the function definitions in the header file but can
essentially be ignored. They are utilized to provide options when building and using DLLs
on Microsoft® Windows. They are implemented to allow the same header file to be used for
building the DLL and importing the DLL, ensuring consistent declarations.
©WAVECREST Corporation 2005
SECTION 3 – General Command Reference 139
3-1
GPIB COMMUNICATION AND I/O LAYER FUNCTIONS
COMM Layer Functions
The functions in this section provide GPIB bus functionality. GPIB commands may be used in
conjunction with Production API commands for advanced functionality. However, COMM_InitDev and
COMM_CloseDev are the only functions that must be called in order to utilize the Production API. These
functions initialize and close a GPIB connection and acquire an API Device ID through which higherlevel Production API measurement functions are called. All other functions are strictly optional unless
low-level GPIB functions must be sent or more customized GPIB error handling is required.
Required Functions
void __stdcall COMM_CloseDev ( long ApiDevId )
Calls IO_close to close the device specified by ApiDevid.
INPUTS
ApiDevid - API Device ID of the device. This value can be from 1 to 31. The device must have been opened using
COMM_InitDev(..).
OUTPUTS
None.
long __stdcall COMM_InitDev ( long ApiDevTyp, char *devname )
This function first calls IO_open to open the device specified by devname. Then initializes the device for communication
using the COMM library and returns the API Device ID. If an error occurs, a negative number is returned instead.
INPUTS
ApiDevType - An integer value indicating the device type:
HPIB = 0 (HP Systems Only)
GPIB = 1
CUST1 = 11
CUST2 = 12
CUST3 = 13
devname - A pointer to an ASCII string containing a device name.
OUTPUTS
Returns an integer containing the API Device ID or a negative number to indicate an error.
long __stdcall COMM_ResetDev ( long ApiDevId )
This function first calls IO_clear to reset the device specified by devname. Then initializes the device for communication
using the COMM library. If an error occurs, a negative number is returned instead.
INPUTS
ApiDevid - Integer containing the API Device ID of the device. This value can be from 1 to 31.
OUTPUTS
Returns SIA_SUCCESS upon completion or a negative value to indicate error.
140 Section 3 – General Command Reference
©WAVECREST Corporation 2005
long __stdcall COMM_TalkDev (long ApiDevId, char *cmnd)
This function first clears the response byte of the specified device and then sends the specified command with an "*opc"
command appended and waits for the ESB bit in the response byte to be set or LONG_TIME (100) seconds. If the ESB
bit is set, the ESR byte is checked for errors. If a timeout occurs or an error is found, a negative value is returned.
INPUTS
ApiDevid - Integer containing the API Device ID of the device. This value can be from 1 to 31.
cmnd - A pointer to a NULL terminated ASCII string containing the command to send.
OUTPUTS
Returns SIA_SUCCESS upon completion or a negative value to indicate error.
long __stdcall COMM_TalkBin ( long ApiDevId, char *sCmnd, long lCmnd )
This function first clears the response byte of the specified device and then sends the specified command with an "*opc"
command appended and waits for the ESB bit in the response byte to be set or LONG_TIME (100) seconds. If the ESB
bit is set the ESR byte is checked for errors. If a timeout occurs or an error is found, a negative value is returned.
INPUTS
ApiDevid - Integer containing the API Device ID of the device. This value can be from 1 to 31.
sCmnd - A pointer to buffer containing the command and binary data to send.
lCmnd - Integer containing the length of sCmnd.
OUTPUTS
Returns SIA_SUCCESS upon completion or a negative value to indicate error.
long __stdcall COMM_ReqAsc ( long ApiDevId, char *cmnd, char *sval,
long svalLen )
This function first clears the response byte of the specified device and then sends the specified command and waits for the
ESB or MAV bit in the response byte to be set or LONG_TIME (100) seconds. If the MAV bit is set, an IO_read of the
specified number of bytes minus one (svalLen - 1) is done and the returned NULL terminated ASCII data is placed in the
specified location (sval). The ESR byte is then checked for errors. If a timeout occurs or an error is found, a negative
value is returned.
INPUTS
ApiDevid - Integer containing the API Device ID of the device. This value can be from 1 to 31.
cmnd - A pointer to a NULL terminated ASCII string containing the command to send.
sval - A pointer to store the returned NULL terminated ASCII data. This buffer must be long enough to hold the
expected number of ASCII bytes plus a NULL terminator.
svalLen -An integer containing the length of sval. This value must be the length of or greater than the expected
number of bytes returned plus one (1) or the IO_read will not return all the data from the specified
device.
OUTPUTS
Returns SIA_SUCCESS upon completion or a negative value to indicate error.
©WAVECREST Corporation 2005
SECTION 3 – General Command Reference 141
long __stdcall COMM_ReqBin ( long ApiDevId, char *sCmnd, long lCmnd,
char *sRetn, long *lRetn )
This function first clears the response byte of the specified device and then sends the specified command and waits for the
ESB or MAV bit in the response byte to be set or LONG_TIME (100) seconds. If the MAV bit is set, an IO_read of the
specified number of bytes (lRetn) is done and the returned binary data is placed in the specified location (sRetn). The ESR
byte is then checked for errors. If a timeout occurs or an error is found, a negative value is returned.
INPUTS
ApiDevid - Integer containing the API Device ID of the device. This value can be from 1 to 31.
sCmnd - A pointer to buffer containing the command and binary data to send.
lCmnd - Integer containing the length of sCmnd.
sRetn - A pointer to store the returned binary data. This buffer must be long enough to hold the expected number
of bytes.
lRetn - An integer containing the length of sRetn. This value must be the length or greater than the expected
number of bytes returned or the IO_read will not return all the data from the specified device.
OUTPUTS
Returns SIA_SUCCESS upon completion or a negative value to indicate error.
long __stdcall COMM_ReqInt ( long ApiDevId, char *cmnd, long *ival )
This function first clears the response byte of the specified device and then sends the specified command and waits for the
ESB or MAV bit in the response byte to be set or LONG_TIME (100) seconds. If the MAV bit is set, an IO_read is done
and the returned ASCII data is converted to a long integer and placed in the specified location (ival). The ESR byte is then
checked for errors. If a timeout occurs or an error is found, a negative value is returned.
INPUTS
ApiDevid - Integer containing the API Device ID of the device. This value can be from 1 to 31.
cmnd - A pointer to a NULL terminated ASCII string containing the command to send.
ival - A pointer to a long integer to store the returned value.
OUTPUTS
Returns SIA_SUCCESS upon completion or a negative value to indicate error.
long __stdcall COMM_ReqDbl ( long ApiDevId, char *cmnd, double *dval )
This function first clears the response byte of the specified device and then sends the specified command and waits
for the ESB or MAV bit in the response byte to be set or LONG_TIME (100) seconds. If the MAV bit is set, an
IO_read is done and the returned ASCII data is converted to a double and placed in the specified location (dval). The
ESR byte is then checked for errors. If a timeout occurs or an error is found, a negative value is returned.
INPUTS
ApiDevid - Integer containing the API Device ID of the device. This value can be from 1 to 31.
cmnd - A pointer to a NULL terminated ASCII string containing the command to send.
dval - A pointer to a double to store the returned value.
OUTPUTS
Returns SIA_SUCCESS upon completion or a negative value to indicate error.
142 Section 3 – General Command Reference
©WAVECREST Corporation 2005
long __stdcall COMM_PollUntilTrue ( long ApiDevId, long mask, time_t
tyme )
This function will poll the response byte of the specified device until one of the specified bits becomes true or the specified
number seconds elapses.
INPUTS
ApiDevid - Integer containing the API Device ID of the device. This value can be from 1 to 31.
mask - Integer containing the response bits to wait for. Refer to the device documentation for definition of the
response bits.
tyme - Integer containing the amount of time in seconds to wait for one of the specified response bits to
become true.
OUTPUTS
Returns an integer containing the response byte from ApiDevId (Refer to the device documentation for definition
of the response bits.) or a negative value to indicate error.
long __stdcall COMM_PollWhileTrue ( long ApiDevId, long mask, time_t
tyme )
This function will poll the response byte of the specified device until one of the specified bits becomes true or the specified
number seconds elapses.
INPUTS
ApiDevid - Integer containing the API Device ID of the device. This value can be from 1 to 31.
mask - Integer containing the response bits to wait for. Refer to the device documentation for definition of the
response bits.
tyme - Integer containing the amount of time in seconds to wait for one of the specified response bits to
become true.
OUTPUTS
Returns an integer containing the response byte from ApiDevId (Refer to the device documentation for definition
of the response bits.) or a negative value to indicate error.
long __stdcall COMM_PollWithStatUntilTrue ( long ApiDevId, long mask,
time_t tyme )
This function will poll both the status byte and the response byte of the specified device while all of the specified bits are
clear, or the specified number of seconds elapses.
INPUTS
ApiDevid - Integer containing the API Device ID of the device. This value can be from 1 to 31.
mask - Integer containing the response bits to wait for. Refer to the device documentation for definition of the
response bits.
tyme - Integer containing the amount of time in seconds to wait for one of the specified response bits to become true.
OUTPUTS
Returns an integer containing the response byte from ApiDevId (Refer to the device documentation for definition of
the response bits.) or a negative value to indicate error.
©WAVECREST Corporation 2005
SECTION 3 – General Command Reference 143
long __stdcall COMM_ClearRspByt ( long ApiDevId )
If any of the status indicators are set on the specified device, this function send a "*cls" command to the specified device and
waits for the response byte to clear or SHORT_TIME (5) seconds. If the function times out, an error is returned.
INPUTS
ApiDevid - Integer containing the API Device ID of the device. This value can be from 1 to 31.
OUTPUTS
Returns an integer containing the response byte from ApiDevId (Refer to the device documentation for definition of
the response bits.) or a negative value to indicate error.
long
__stdcall COMM_ReqEsr ( long ApiDevId, char *esr )
This function sends a "*esr?" command and waits for the byte to return or SHORT_TIME (5) seconds. If the function times
out, an error is returned.
INPUTS
ApiDevid - Integer containing the API Device ID of the device. This value can be from 1 to 31.
esr - A character pointer to the location to store the esr byte.
OUTPUTS
Returns SIA_SUCCESS upon completion or a negative value to indicate error.
long __stdcall COMM_DevChans ( long ApiDevId )
INPUTS
ApiDevid - Integer containing the API Device ID of the device. This value can be from 1 to 31. The device
must have been opened using COMM_InitDev(..).
OUTPUTS
Returns the number of channels installed in the specified device or a negative number to indicate error.
long __stdcall COMM_DevMarkers ( long ApiDevId )
INPUTS
ApiDevid - Integer containing the API Device ID of the device. This value can be from 1 to 31. The device must
have been opened using COMM_InitDev(..).
OUTPUTS
Returns the number of pattern markers installed in the specified device or a negative number to indicate error.
char * __stdcall COMM_DevIdn ( long ApiDevId )
INPUTS
ApiDevid - Integer containing the API Device ID of the device. This value can be from 1 to 31. The device must
have been opened using COMM_InitDev(..).
OUTPUTS
Returns a pointer to the IDN of the specified device or NULL to indicate error.
long __stdcall COMM_GetApiDevId ( char *devname, long *ApiDevId )
INPUTS
ApiDevid - Integer pointer to location to return ApiDevId.
devname - A pointer to an ASCII string containing a device name.
OUTPUTS
Returns SIA_SUCCESS upon completion or a negative value to indicate error.
144 Section 3 – General Command Reference
©WAVECREST Corporation 2005
long __stdcall COMM_GetDevName ( long ApiDevId, char *devname )
INPUTS
ApiDevid - Integer containing the API Device ID of the device. This value can be from 1 to 31. The device must
have been opened using COMM_InitDev(..).
devname - A pointer to location to return device name.
OUTPUTS
Returns SIA_SUCCESS upon completion or a negative value to indicate error.
long __stdcall COMM_ReadFile ( long ApiDevId, const char *srcFilename,
const char *destFilename, long lFileSize )
Use this function to read back a file from the SIA3000 and save the contents in a specified file on the host.
INPUTS
ApiDevid - Integer containing the API Device ID of the device. This value can be from 1 to 31. The device must
have been opened using COMM_InitDev(..).
srcFilename - A pointer to the name of the file to read data from. This file is located on the SIA3000 hard drive.
destFilename - A pointer to the location of the file the data will be saved to.
lFileSize - The known size (in bytes) of the file being read in.
OUTPUTS
Returns SIA_SUCCESS upon completion or a negative value to indicate error.
long __stdcall COMM_SendFile ( long ApiDevId, const char *filename )
Use this function to send a file to the SIA3000.
INPUTS
ApiDevid - Integer containing the API Device ID of the device. This value can be from 1 to 31. The
device must have been opened using COMM_InitDev(..).
filename - A pointer to the name of the file whose contents will be saved to the SIA3000 in a file with the
same name.
OUTPUTS
Returns SIA_SUCCESS upon completion or a negative value to indicate error.
long __stdcall COMM_InitSingleShot ( long ApiDevId, char *sCmnd,
long lCmnd )
Use this function to configure a device specified by ApiDevId to perform a "Single Shot" measurement. If a timeout
occurs or an error occurs, a negative value is returned.
INPUTS
ApiDevid - Integer containing the API Device ID of the device. This value can be from 1 to 31.
sCmnd - A pointer to buffer containing the command and binary data to send.
lCmnd - Integer containing the length of sCmnd.
OUTPUTS
Returns SIA_SUCCESS upon completion or a negative value to indicate error.
©WAVECREST Corporation 2005
SECTION 3 – General Command Reference 145
long __stdcall COMM_ReqSingleShot ( long ApiDevId, char *sRetn,
long *lRetn )
Use this function to read the results of the "Single Shot" measurement requested by COMM_InitSingleShot for the
device specified by ApiDevId. If result exists, the returned binary data is placed in the location specified by sRetn.
If a timeout occurs or an error is found, a negative value is returned.
INPUTS
ApiDevid - Integer containing the API Device ID of the device. This value can be from 1 to 31.
sRetn - A pointer to store the returned binary data. This buffer must be long enough to hold the expected
number of bytes.
lRetn - An integer containing the length of sRetn. This value must be the length or greater than the expected
number of bytes returned or the IO_read will not return all the data from the specified device.
OUTPUTS
Returns SIA_SUCCESS upon completion or a negative value to indicate error.
void __stdcall COMM_libver (char *StrPtr)
This function returns the current COMM library versions (i.e. "2.5.0").
INPUTS
Strptr - Pointer to location to store version string. Memory must be allocated by user.
OUTPUTS
None.
146 Section 3 – General Command Reference
©WAVECREST Corporation 2005
I/O Layer Functions
NOTE: These functions can be used to control other devices using the same I/O protocol (GPIB, HPIB
or Custom).
void __stdcall IO_clear ( int ApiDevid )
Clears the internal or device functions of the specified device.
INPUTS
ApiDevid - Integer containing the API Device ID of the device. This value can be from 1 to 31. The device
must have been opened using IO_open (...).
OUTPUTS
None.
void __stdcall IO_close ( int ApiDevid )
Closes the device specified by ApiDevid.
INPUTS
ApiDevid - Integer containing the API Device ID of the device. This value can be from 1 to 31. The device
must have been opened using IO_open (...).
OUTPUTS
None.
int __stdcall IO_count (int ApiDevid)
This function returns the byte count of the last data transfer operation.
INPUTS
ApiDevTyp - Integer containing the API Device ID of the device. This value can be from 1 to 31.
OUTPUTS
Returns an integer containing the byte count of the last data transfer operation.
void __stdcall IO_libver (char *StrPtr)
This function returns the current IO library version (i.e. "2.5.0").
INPUTS
Strptr - Pointer to location to store version string. Memory must be allocated by user.
OUTPUTS
None.
int __stdcall IO_open ( int ApiDevTyp, char *devname )
INPUTS
ApiDevType - An integer value indicating the device type:
HPIB = 0 (HP Systems Only)
GPIB = 1
CUST1 = 11
CUST2 = 12
CUST3 = 13
devname - A pointer to an ASCII string containing a device name.
OUTPUTS
Returns an integer containing the API Device ID or a negative number to indicate an error. Opens the device
specified by devname and returns the API Device ID. If an error occurs, a negative number is returned instead.
©WAVECREST Corporation 2005
SECTION 3 – General Command Reference 147
int __stdcall IO_read ( int ApiDevid, void *buf, long cnt )
Read a maximum of cnt bytes from ApiDevid and place it in buf. Use IO_count() to check actual number of bytes read.
INPUTS
ApiDevid - Integer containing the API Device ID of the device. This value can be from 1 to 31. The device must
have been opened using IO_open (...).
buf - Location to place data read. Must be at least cnt long.
cnt - Number of bytes to try and read.
OUTPUTS
Returns an integer containing the status of the last I/O operation.
int __stdcall IO_response ( int ApiDevid, char *rsp )
Get response byte from ApiDevid and place it in rsp. Refer to the device documentation for definition of the response bits.
INPUTS
ApiDevid - Integer containing the API Device ID of the device. This value can be from 1 to 31. The device must
have been opened using IO_open (...).
rsp - Location to place response byte.
OUTPUTS
Returns an integer containing the status of the last I/O operation.
int __stdcall IO_status (int ApiDevid)
This function returns the status of the last I/O operation. Fourteen bits within the status word are meaningful. Three are
used throughout the API:
ERROR - bit 15, hex value 8000, Error detected
TIMEO - bit 14, hex value 4000, Time out
END - bit 13, hex value 2000, END detected.
INPUTS
ApiDevid - Integer containing the API Device ID of the device. This value can be from 1 to 31.
OUTPUTS
Returns an integer containing the status of the last I/O operation.
void __stdcall IO_trigger ( int ApiDevid )
Sends a device trigger to the specified device.
INPUTS
ApiDevid - Integer containing the API Device ID of the device. This value can be from 1 to 31. The device
must have been opened using IO_open (...).
OUTPUTS
None.
int __stdcall IO_write ( int ApiDevid, void *buf, long cnt )
Write cnt bytes from buf to ApiDevid. Use IO_count() to check actual number of bytes written.
INPUTS
ApiDevid - Integer containing the API Device ID of the device. This value can be from 1 to 31. The device must
have been opened using IO_open (...).
buf - Location of data to write.
cnt - Number of bytes to write.
OUTPUTS
Returns an integer containing the status of the last I/O operation.
148 Section 3 – General Command Reference
©WAVECREST Corporation 2005
3-2
MEASUREMENT UTILITY FUNCTIONS
The following functions perform actions that will prepare a configured measurement for execution by
setting thresholds or timing values based on detection algorithms.
long __stdcall FCNL_CalcArmDelay ( double dFreq, PARM *tParm )
This function calculates the Arm Delay for a given input frequency If a math error occurs or an error is found, a negative
value is returned.
INPUTS
dFreq - The current test frequency in MHz.
tParm - A pointer to the PARM structure.
OUTPUTS
Returns SIA_SUCCESS upon completion or a negative value to indicate error.
long __stdcall FCNL_PulsFnd (long ApiDevId, PARM *tParm )
This function is used to perform a pulse-find operation. The pulse-find feature determines minimum and maximum voltage
levels for the channels specified in the PARM structure and sets the voltage thresholds based on the percentage set in the
tParm.lFndPcnt field supplied in the PARM structure.
INPUTS
ApiDevid - Integer containing the API Device ID of the device. This value can be from 1 to 31.
tParm - A pointer to the PARM structure.
OUTPUTS
Returns SIA_SUCCESS upon successful completion or a specific error code (negative value) indicating what type
of error occurred.
©WAVECREST Corporation 2005
SECTION 3 – General Command Reference 149
3-3
PATTERN AND PM50 FUNCTIONS
The following functions are related to configuration of patterns. The first function, FCNL_PtnName(),
will set the pattern file name within a measurement window structure of any tool that requires it. All
other functions are related to the configuration of a PM50 to generate a pattern marker.
long __stdcall FCNL_PtnName ( char sPtnName[], char *name )
This function is used to load the pattern file name into the required measurement structure. This function is included to
assist when programming in Microsoft Visual Basic. When programming in C, it is best to use a sprintf() command to
write a character string into the structure element associated with the pattern name.
INPUTS
sPtnName - Location where pattern name will be updated. Memory needs to be allocated by the caller.
name - Name of pattern file to load into measurement structure.
OUTPUTS
Returns SIA_SUCCESS if operation is successful or a negative value to indicate error. Error codes are defined in
Appendix B.
EXAMPLE
memset(&dcom,0,sizeof(DCOM));
FCNL_DefDcom(&dcom);
FCNL_Ptn(&dcom.sPtnName[0], “cjtpat.ptn”);
//allocate memory space for dcom structure
//set dcom structure to defaults
//load cjtpat.ptn file into dcom’s pattern
//name element. This command could be
//replaced with a sprintf command when
//programming in C.
long __stdcall FCNL_MarkerInit ( long ApiDevId, long MarkerId, PMKR
*tPmkr )
Use this function to initialize the specified PM50. This must be called before using a PM50 in any application.
INPUTS
ApiDevid - Contains the API Device ID of the device. This value can be from 1 to 31.
MarkerId - Which PM50 card in the system to initialize
tPmkr - Pointer to a PM50 PMKR measurement and control structure
OUTPUTS
Returns SIA_SUCCESS upon successful completion or a specific error code (negative value) indicating
what type of error occurred.
long __stdcall FCNL_MarkerReset ( long ApiDevId, PMKR *tPmkr )
Use this function to reset the state of the specified PM50.
INPUTS
ApiDevid - Contains the API Device ID of the device. This value can be from 1 to 31.
tPmkr - Pointer to a PM50 PMKR measurement and control structure.
OUTPUTS
Returns SIA_SUCCESS upon successful completion or a specific error code negative value) indicating what type of
error occurred.
150 Section 3 – General Command Reference
©WAVECREST Corporation 2005
long __stdcall FCNL_MarkerConfig ( long ApiDevId, PMKR *tPmkr )
Use this function to change the configuration of the PM50 specified.
INPUTS
ApiDevid - Contains the API Device ID of the device. This value can be from 1 to 31.
tPmkr - Pointer to a PM50 PMKR measurement and control structure.
OUTPUTS
Returns SIA_SUCCESS upon successful completion or a specific error code (negative value) indicating what
type of error occurred.
long __stdcall FCNL_MarkerStatus ( long ApiDevId, PMKR *tPmkr )
Use this function to monitor the current state of the specified PM50.
INPUTS
ApiDevid - Contains the API Device ID of the device. This value can be from 1 to 31.
tPmkr - Pointer to a PM50 PMKR measurement and control structure.
OUTPUTS
Returns a value > 0 to indicate the presence of an arming condition on the specified PM50 or an error code
(negative value) indicating what type of error occurred.
long __stdcall FCNL_MarkerReadErr ( long ApiDevId, PMKR *tPmkr )
Use this function to read bit errors recorded by the specified PM50.
INPUTS
ApiDevid - Contains the API Device ID of the device. This value can be from 1 to 31.
tPmkr - Pointer to a PM50 PMKR measurement and control structure.
OUTPUTS
Returns SIA_SUCCESS upon successful completion or a specific error code (negative value) indicating
what type of error occurred.
long __stdcall FCNL_PatternMatch ( long ApiDevId, PARM *tParm,
const char *filename, double *dBits, long lSize )
Use this function to perform a functional pattern match test and report results to the user.
INPUTS
ApiDevid - Contains the API Device ID of the device. This value can be from 1 to 31.
tParm - Pointer to a PARM acquisition structure.
filename - Name of pattern file to be used for comparison purposes.
dBits - Pointer to a array representing each bit in a pattern.
lSize - Size of array representing each bit in a pattern.
OUTPUTS
Returns SIA_SUCCESS upon successful completion or a specific error code (negative value) indicating what type
of error occurred.
©WAVECREST Corporation 2005
SECTION 3 – General Command Reference 151
3-4
CALIBRATION UTILITY FUNCTIONS
long __stdcall FCNL_GoReq (long ApiDevId, long (*CallBackFunc) (long
ApiDevID, char *Prompt), char *Prompt)
This is an internal function used by the calibration functions to allow the programmer to physically change the connections to
the instrument either through a matrix or manually with cables. This function requires that a process be running on the
SIA3000 which has paused operation and sent a RQC_BIT back. At present, the only functions doing this are the calibration
routines. Future expansion of This function waits for the RQC_BIT to be set then sends a :SYST:GO or SYST:NOGO to the
specified device based on the return value of CallBackFunc. Only the calibration commands have the ability to set
RQC_BIT and monitor :SYST:GO and SYST:NOGO.
INPUTS
ApiDevid - Integer containing the API Device ID of the device. This value can be from 1 to 31.
CallBackFunc - A pointer to a function to call to determine if a :SYST:GO (continue) or :SYST:NOGO (skip)
command should be sent to the device (see functional description below). CallBackFunc can be
NULL or it must follow these rules:
long CallBackFunc (long ApiDevID, char *Prompt)
It must return an integer value of...
... >0 Send :SYST:GO to device
... 0 Send :SYST:NOGO to device
ApiDevid - Integer containing the API Device ID of the device. This value can be from 1 to 31.
Prompt - A pointer to a string prompt generally specifying what an operator needs to do before the :SYST:GO
or :SYST:NOGO command should be sent to the device.
Prompt - A pointer to a string prompt that will be passed to the CallBackFunction generally specifying what an
operator needs to do before the :SYST:GO or :SYST:NOGO command should be sent to the device (see
functional description below). This parameter is simply passed through and is not checked for NULL.
OUTPUTS
Returns SIA_SUCCESS upon completion or a negative value to indicate error/abort.
EXAMPLE
long (*CallBackFunc)(long ApiDevId, char *prompt); //Declare CalBackFunc to be a pointer to a
//function with two parameters passed in.
static long ConChan(long ApiDevId, char * Prompt); //Declare ConChan to be function with two
//parameters passed in.
main()
{
char userPrompt[256];
//declare userPrompt to be a string of 256
//characters in length.
CallBackFunc = ConChan;
strcpy(userPrompt, “Connect CH1”);
FCNL_GoReq (ApiDevId,*CallBackFunc,inpPrompt);
}
ConChan (long ApiDevID, char *Prompt)
{
char buf[10];
printf(“Ready to execute.
gets(buf);
return (1);
}
//Let *CallBackFunc() point to ConChan()
//Define userPrompt string.
//continue execution of paused calibration
//command after ConChan is executed and
//ConChan has returned a 1.
//User defined function that prompts the
//user to “Connect CH1” as defined by the
//calling function above.
Please %s\n”,Prompt); //display string passed from FCNL_GoReq
//pause execution until enter key is pressed.
//return a value of 1 to allow SIA3000 to
//proceed with calibration routine.
152 Section 3 – General Command Reference
©WAVECREST Corporation 2005
long __stdcall FCNL_CalInt (long ApiDevId, long Multiplier)
The internal calibration function will process 10,000,000 samples multiplied by Multiplier, taking 5.5 minutes/10,000,000
samples to complete.
INPUTS
ApiDevid - Integer containing the API Device ID of the device. This value can be from 1 to 31.
Multiplier - Integer containing a value 1 - MAX_CAL_MULT. The selected multiplier, from 1 MAX_CAL_MULT, sets the calibration period of approximately 5.5 minutes by that factor.
OUTPUTS
Returns SIA_SUCCESS upon completion or a negative value to indicate error.
long __stdcall FCNL_CalDeskew (long ApiDevId, long (*CallBackFunc) (long
ApiDevID, char *prompt))
This function will calibrate all the channels installed in the device according to the following conditions determined by the
CallBackFunc function:
…If the return value is > 0, the current channel is calibrated.
…If the return value is 0, the current channel is skipped.
INPUTS
ApiDevid - Integer containing the API Device ID of the device. This value can be from 1 to 31.
CallBackFunc - A pointer to a function to call to determine if the channel should be calibrated or skip the channel
(see functional description below). CallBackFunc cannot be NULL. It must follow these rules:
long CallBackFunc (long ApiDevID, char *Prompt)
It must return an integer value of...
... >0 Continue with this channel
... 0 Skip this channel
ApiDevid - Integer containing the API Device ID of the device. This value can be from 1 to 31.
Prompt - A pointer to a string prompt generally specifying what an operator needs to do before
calibrating the channel.
OUTPUTS
Returns SIA_SUCCESS upon completion or a negative value to indicate error/abort.
Deskew (external) calibration without DC Calibration.
©WAVECREST Corporation 2005
SECTION 3 – General Command Reference 153
long __stdcall FCNL_CalDeskewDc (long ApiDevId, long (*CallBackFunc)
(long ApiDevID, char *prompt))
This function will calibrate all the channels installed in the device according to the following conditions determined
by the CallBackFunc function.
...If the return value is > 0, the current channel is calibrated.
...If the return value is 0, the current channel is skipped.
INPUTS
ApiDevid -Integer containing the API Device ID of the device. This value can be from 1 to 31.
CallBackFunc - A pointer to a function to call to determine if the channel should be calibrated or skip the channel
(see functional description below). CallBackFunc cannot be NULL. It must follow these rules:
long CallBackFunc (long ApiDevID, char *Prompt)
It must return an integer value of...
... >0 Continue with this channel
... 0 Skip this channel
ApiDevid - Integer containing the API Device ID of the device. This value can be from 1 to 31.
Prompt - A pointer to a string prompt generally specifying what an operator needs to do before
calibrating the channel.
OUTPUTS
Returns SIA_SUCCESS upon completion or a negative value to indicate error/abort.
Deskew (external) calibration with DC Calibration.
long __stdcall FCNL_CalStrobe (long ApiDevId)
The strobe calibrarion funtion does an Oscilloscope Strobe calibration.
INPUTS
ApiDevid - Integer containing the API Device ID of the device. This value can be from 1 to 31.
OUTPUTS
Returns SIA_SUCCESS upon completion or a negative value to indicate error.
long __stdcall FCNL_GetCalData(long ApiDevId, long *pChannelCards,
double *pDeSkewData)
Use this function to obtain the current external deskew values for all available channels in the device.
INPUTS
ApiDevid - Integer containing the API Device ID of the device. This value can be from 1 to 31.
pChannelCards - Upon successful completion, pointer to variable containing the number of channels in the device
pDeSkewData - Upon successful completion, pointer to an array containing a deskew value for each channel
OUTPUTS
Returns SIA_SUCCESS upon completion or a negative value to indicate error.
long __stdcall FCNL_SetCalData(long ApiDevId, long ChannelCards, double
*pDeSkewData)
Use this function to update the current external deskew values for the number of channels specified in the device.
INPUTS
ApiDevid - Integer containing the API Device ID of the device. This value can be from 1 to 31.
ChannelCards - Number of channels to set external deskew values for
pDeSkewData - Pointer to an zero-based indexed array containing the desired deskew values for each channel
OUTPUTS
Returns SIA_SUCCESS upon completion or a negative value to indicate error.
154 Section 3 – General Command Reference
©WAVECREST Corporation 2005
3-5
SIGNAL PATH FUNCTIONS (DSM16, PATH MAPPING AND PATH DESKEW)
*NOTE: MuxAddr (1 thru 8) is assigned based on the RS232C output connectors on the USB-to-RS232C
interface module.
long __stdcall FCNL_DSM16Switch ( long ApiDevId, long MuxAddr, long
switch_ON_OFF )
Use this function to enable or disable the DSM connected to the device specified in ApiDevId.
INPUTS
ApiDevid - Integer containing the API Device ID of the device. This value can be from 1 to 31.
MuxAddr - An integer address identifying DSM to select. The range is 1 to 8, based on information in above note.
switch_ON_OFF - An integer with value 0 to disable the DSM16 front panel buttons and any non zero value or 1
to enable.
OUTPUTS
Returns SIA_SUCCESS upon completion or a negative value to indicate error.
long __stdcall FCNL_DSM16Ver ( long ApiDevId, long MuxAddr, char
*outbuf )
Use this function to determine the revision level of the DSM connected to the device specified in ApiDevId
INPUTS
ApiDevid - Integer containing the API Device ID of the device. This value can be from 1 to 31.
MuxAddr - An integer address identifying DSM to select. The range is 1 to 8, based on information in above note.
OUTPUT PARAMETER
outbuf - A pointer to a character array which will be filled with the revision level.
OUTPUTS
Returns SIA_SUCCESS upon completion or a negative value to indicate error.
long __stdcall FCNL_DSM16GetSwitchNumbers ( long ApiDevId, long MuxAddr,
char *switchNums )
Use this function to determine the current configuration of the DSM connected to the device specified in ApiDevId.
INPUTS
ApiDevid - Integer containing the API Device ID of the device. This value can be from 1 to 31.
MuxAddr - An integer address identifying DSM to select. The range is 1 to 8, based on information in above
note.
OUTPUT PARAMETER
switchNum - A pointer to a character array which will be filled with the switch numbers currently active in
the banks.
OUTPUTS
Returns SIA_SUCCESS upon completion or a negative value to indicate error.
©WAVECREST Corporation 2005
SECTION 3 – General Command Reference 155
long __stdcall FCNL_DSM16SetSwitchNumber ( long ApiDevId, long MuxAddr,
long switchNum )
Use this function to reconfigure the switch settings of the DSM connected to the device specified in ApiDevId.
INPUTS
ApiDevid - Integer containing the API Device ID of the device. This value can be from 1 to 31.
MuxAddr - An integer address identifying DSM to select. The range is 1 to 8, based on information in above note.
SwitchNum - Integer containing the switch number to activate. The range for the relays is : 11 to 18 for bank 1 : 21
to 28 for bank 2.
OUTPUTS
Returns SIA_SUCCESS upon completion or a negative value to indicate error.
long __stdcall FCNL_DefPathMap ( long path, long DevType, char *DevName,
long Channel, long MuxSwitch, long MuxIsADsm )
Use this function to map an unique path (pin number) to an individual channel on a particular device. This function will
initialize the device if this had not been done previously.
INPUTS
Path - Number of the path being defined. This value can be from 0 to 511.
DevType - Number that indicates the device type:
HPIB = 0 (HP Systems Only)
GPIB = 1
CUST1 = 11
CUST2 = 12
CUST3 = 13
DevName - A pointer to an ASCII string containing a device name
Channel - A valid SIA channel of the device named in DevName above
MuxSwitch - A flag indicating if an external MUX is included in path.
MuxIsADsm - A flag indicating if a DSM is included in this path.
OUTPUTS
Returns SIA_SUCCESS upon completion or a negative value to indicate error.
long __stdcall FCNL_DefPathDutDeskew ( long path, double value )
Use this function to set the external deskew value for the DUT path indicated.
INPUTS
path - Number of the path being defined. This value can be from 0 to 511.
value - DUT Deskew value for this path
OUTPUTS
Returns SIA_SUCCESS upon completion or a negative value to indicate error.
long __stdcall FCNL_DefPathFixDeskew ( long path, double value )
Use this function to set the external deskew value for the fixture path indicated.
INPUTS
path - Number of the path being defined. This value can be from 0 to 511.
value - Fixture Deskew value for this path
OUTPUTS
Returns SIA_SUCCESS upon completion or a negative value to indicate error.
156 Section 3 – General Command Reference
©WAVECREST Corporation 2005
long __stdcall FCNL_GetPathDevName ( long path, char *DevName )
Use this function to retrieve the device name for the path indicated.
The path must have been defined previously using FCNL_DefPathMap(..).
INPUTS
path - Number of the path being defined. This value can be from 0 to 511.
DevName - A pointer to an ASCII string containing a device name
OUTPUTS
Returns SIA_SUCCESS upon completion or a negative value to indicate error.
long __stdcall FCNL_GetPathDevType ( long path, long *DevType )
Use this function to retrieve the device type for the path indicated.
The path must have been defined previously using FCNL_DefPathMap(..).
INPUTS
path - Number of the path being defined. This value can be from 0 to 511.
DevType - Pointer to location that returns the device type:
HPIB = 0 (HP Systems Only)
GPIB = 1
CUST1 = 11
CUST2 = 12
CUST3 = 13
OUTPUTS
Returns SIA_SUCCESS upon completion or a negative value to indicate error.
long __stdcall FCNL_GetPathApiDevId ( long path, long *ApiDevId )
Use this function to retrieve the device id for the path indicated.
The path must have been defined previously using FCNL_DefPathMap(..).
INPUTS
path - Number of the path being defined. This value can be from 0 to 511.
DevType - Pointer to location that returns the ApiDevId (a value between 1 and 31)
OUTPUTS
Returns SIA_SUCCESS upon completion or a negative value to indicate error.
long __stdcall FCNL_GetPathChannel ( long path, long *Channel )
Use this function to retrieve the channel for the path indicated.
The path must have been defined previously using FCNL_DefPathMap(..).
INPUTS
path - Number of the path being defined. This value can be from 0 to 511.
Channel - Pointer to location that returns the device channel
OUTPUTS
Returns SIA_SUCCESS upon completion or a negative value to indicate error.
©WAVECREST Corporation 2005
SECTION 3 – General Command Reference 157
long __stdcall FCNL_GetPathMuxSwitch ( long path, long *MuxSwitch )
Use this function to indicate the MUX switch index for the path indicated. The path must have been defined
previously using FCNL_DefPathMap(..).
INPUTS
path - Number of the path being defined. This value can be from 0 to 511.
MuxSwitch - Pointer to location that returns the MUX switch index
OUTPUTS
Returns SIA_SUCCESS upon completion or a negative value to indicate error.
long __stdcall FCNL_GetPathMuxIsADsm ( long path, long *MuxIsADsm )
Use this function to inquire if a DSM is being used as a MUX in this path indicated. The path must have been defined previously
using FCNL_DefPathMap(..).
INPUTS
path - Number of the path being defined. This value can be from 0 to 511.
MuxIsADsm - Pointer to location that indicates if a DSM is being used as a MUX in this path.
OUTPUTS
Returns SIA_SUCCESS upon completion or a negative value to indicate error.
long __stdcall FCNL_GetPathDutDeskew ( long path, double *value )
Use this function to retrieve the external deskew value for the DUT path indicated. The path must have been defined previously
using FCNL_DefPathMap(..).
INPUTS
path - Number of the path being defined. This value can be from 0 to 511.
value - Pointer to location containing the DUT Deskew value for the path indicated
OUTPUTS
Returns SIA_SUCCESS upon completion or a negative value to indicate error.
long __stdcall FCNL_GetPathFixDeskew ( long path, double *value )
Use this function to retrieve the external deskew value for the fixture path indicated. The path must have been defined
previously using FCNL_DefPathMap(..).
INPUTS
path - Number of the path being defined. This value can be from 0 to 511.
value - Pointer to location containing the fixture Deskew value for the path indicated
OUTPUTS
Returns SIA_SUCCESS upon completion or a negative value to indicate error.
158 Section 3 – General Command Reference
©WAVECREST Corporation 2005
3-6
MISCELLANEOUS RESULT AND STATUS FUNCTIONS
double __stdcall FCNL_GetXval ( PLTD *plot, long indx )
This function is used to simplify the process of extracting X-axis information from a PLTD structure. In order to reduce
memory requirements, only Y-axis values are contained within PLTD structures. This is permissible since X-axis values
represent the independent variable. This function uses the same method for calculating the X-axis values based on the
elements in the measurement structure. Results are only valid after a successful call to FCNL_RqstAll, FCNL_MultPkt,
or FCNL_GrpGetPkt.
INPUTS
*plot - Pointer to a PLTD structure. Memory needs to be allocated by the caller. This pointer will be the
PLTD structure pointer used in the measurement command of interest.
indx - Index from which to determine X-value, range is (0 to tPlot.lNumb - 10).
OUTPUTS
The value is double of the x coordinate.
EXAMPLE
FCNL_RqstAll ( ApiDevId, &hist, WIND_HIST );
//execute a histogram based on settings in
//hist structure as defined in preceding lines
val = FCNL_GetXval( &hist.tAcum, inpIndx);
//get x-value of Accumulated Jitter Plot
//inpIndx number of units from the
//minimum x value.
printf("Plot value of hist.tAcum for index %d = %2.18lf ns\n", inpIndx, val*1e9);
double __stdcall FCNL_GetYval ( PLTD *plot, long indx )
This function is used to simplify the process of extracting Y-axis information from a PLDT structure. It is primarily included
to assist when programming in Microsoft Visual Basic. When programming in C, the data array can be accessed directly.
This function is called after a successful execution of a measurement. The return value is the Y-value at an X-location offset
from X-min by indx. Results are only valid after a successful call to FCNL_RqstAll, FCNL_MultPkt, or
FCNL_GrpGetPkt.
INPUTS
plot - Pointer to a PLDT structure. Memory needs to be allocated by the caller.
indx - Index from which to determine Y-value, range is (0 to tPlot.lNumb - 10).
OUTPUTS
The value is double the y coordinate.
EXAMPLE
FCNL_RqstAll ( ApiDevId, &hist, WIND_HIST );
//execute a histogram based on settings in
//hist structure as defined in preceding lines
val = FCNL_GetYval( &hist.tAcum, inpIndx);
//get y-value of Accumulated Jitter Plot
//inpIndx number of units from the
//minimum y value.
printf("Plot value of hist.tAcum for index %d = %2.18lf ns\n", inpIndx, val*1e9);
©WAVECREST Corporation 2005
SECTION 3 – General Command Reference 159
long __stdcall FCNL_Diagnostics ( long ApiDevId )
Use this function to perform a system diagnostics test on the device. If any portion of the test fails, a negative value is
returned.
INPUTS
ApiDevid - Integer containing the API Device ID of the device. This value can be from 1 to 31.
OUTPUTS
Returns SIA_SUCCESS upon completion or a negative value to indicate error.
void __stdcall FCNL_libver (char *StrPtr)
This function returns the current API version (i.e. "2.5.0").
INPUTS
Strptr - Pointer to location to store version level. Memory must be allocated by user.
OUTPUTS
None
160 Section 3 – General Command Reference
©WAVECREST Corporation 2005
3-7
ADVANCED GROUP MEASUREMENT FUNCTIONS
Grouping of commands provides an advanced Production API technique to further minimize GPIB bus
traffic and set up complex sequences including multiple tools and/or channels. Once a group is
established, it can be quickly and repeatedly executed.
If the fastest possible test time is desired, then these commands and programming techniques may be of
use. Keep in mind that any measurement sequence can be accomplished through repeated calls to the
standard FCNL_RqstPkt, FCNL_RqstALL, or FCNL_MultPkt functions. Since the measurement
sequences are stored remotely on the GPIB host rather than the SIA-3000, the standard calls will require
some GPIB bus overhead each time a measurement is taken. This overhead is reduced via grouping by
storing all the measurement configuration information for the group locally on the SIA-3000 instrument.
Configuring a group involves the following steps:
1. Issue the FCNL_GrpDefBeg (groupNumber) command
2. Send down various measurement and configuration requests using FCNL_GrpDefAsc
(command Syntax) or FCNL_GrpDefPkt ( toolWindow, type, GetPlots? )
3. When finished defining a group, issue FCNL_GrpDefEnd (groupNumber)
Then issue:
FCNL_GrpGetAll
Then issue:
FCNL_GrpGetAsc ( dataBuffer, expectedLength ) or FCNL_GrpGetPkt (toolWindow, type,
PlotsRetrieved? ) in the same order the corresponding FCNL_GrpDefAsc and
FCNL_GrpDefPkt were originally issued.
NOTE: Nesting of groups is not allowed.
CAUTION: DO NOT intersperse group definitions to multiple devices or call FCNL_RqstPkt
or FCNL_MultPkt in the middle of a group definition. Unpredictable results will
occur.
long __stdcall FCNL_GrpDefBeg ( long nNumb )
Define a group; the group must be defined only once.
INPUTS
nNumb - Long Integer specifying the index of a group to be defined. A maximum of 20 groups are allowed
at present.
OUTPUTS
Returns an integer 0 specifying a success or a negative value to indicate error.
long __stdcall FCNL_GrpDefAsc ( char *sCmnd )
This function is for standard ASCII commands to be included in a group.
INPUTS
sCmnd - Pointer to a character array containing the ASCII command string to be used in the group. For the list of
commands not allowed in groups please consult the manual.
OUTPUTS
Returns an integer 0 specifying a success or a negative value to indicate error.
©WAVECREST Corporation 2005
SECTION 3 – General Command Reference 161
long __stdcall FCNL_GrpDefPkt ( void *pData, long nType, long bGetPlots )
This function is for setting up for getting data and/or plot values from a measurement like histogram, datacom etc within the
scope of a group command.
If bGetPlots is non-zero memory is allocated for plot too and the binary structure will hold the binary plot data when
executed later.
INPUTS
pData - Pointer to a data structure like HIST, DCOM etc to hold the input/output/plot values.
nType - Long Integer specifying the type of the request like: WIND_HIST, WIND_JITT etc.
bGetPlots - Long Integer specifying whether to get the plot data.
Zero - no plot data retrieved.
non- zero - get plot data.
OUTPUTS
Returns an integer 0 specifying a success or a negative value to indicate error.
long __stdcall FCNL_GrpDefEnd ( long ApiDevId, long nNumb )
Finalize the group definition, for group specified in nNumb.
INPUTS
ApiDevid - Integer containing the API Device ID of the device. This value can be from 1 to 31.
nNumb - Long Integer specifying the index of a group to be defined. A maximum of 20 groups are allowed at
present.
OUTPUTS
Returns an integer 0 specifying a success or a negative value to indicate error.
long __stdcall FCNL_GrpGetAll ( long ApiDevId, long nNumb )
This function does the measurements and gets the whole block of data.
INPUTS
ApiDevid - Integer containing the API Device ID of the device. This value can be from 1 to 31.
nNumb - Long Integer specifying the index of a group to be defined. A maximum of 10 groups is allowed
at present.
OUTPUTS
Returns an integer 0 specifying a success or a negative value to indicate error.
long __stdcall FCNL_GrpGetAsc ( void *sBuff, long nSize )
This function gets the ASCII data back corresponding to the FCNL_GrpDefAsc command in the sequence. Refer to the
manual for the example program that lists the order in which the commands in a group are defined and used.
INPUTS
sBuff - Pointer to a void to store the ASCII string from this call. Memory to be allocated by the caller.
nSize - Long Integer specifying the number of bytes to fetch.
OUTPUTS
Returns an integer 0 specifying a success or a negative value to indicate error.
162 Section 3 – General Command Reference
©WAVECREST Corporation 2005
long __stdcall FCNL_GrpGetPkt ( void *pData, long nType, long bGetPlots )
This function gets the data back corresponding to the FCNL_GrpDefPkt command in the sequence. Refer to the manual
for the example program that lists the order in which the commands in a group are defined and used.
This command is mostly used for getting a single histogram/dataCOM etc. data back.
INPUTS
pData - Pointer to a data structure like HIST, DCOM etc to hold the input/output/plot values.
nType - Long Integer specifying the type of the request like: WIND_HIST, WIND_JITT etc.
bGetPlots - Long Integer specifying whether to get the plot data.
Zero - no plot data retrieved.
non- zero - get plot data.
OUTPUTS
Returns an integer 0 specifying a success or a negative value to indicate error.
EXAMPLE
The following example shows how to utilize the group functions together to define a measurement group, and
acquire multiple passes of the group. This code is meant to replace Steps 6, 7, and 8 of the Sample.c example
given in Section 1.7
STEP 1 – Define a Group
Up to 20 distinct command “groups” can be sent to the SIA-3000™, where any number of commands
can be “grouped” together, sent down to the SIA-3000 and executed in the order they are received
(“pseudo-parallel” mode). Controlling the SIA3000 with Command Groups significantly reduces any
overhead associated with the remote driver (GPIB, HPIB). Refer to the sample program comments or
the SIA3000 GPIB Programming Guide for further details regarding command groups.
/* Now define a group, the group must only be defined once */
/* There can be up to 20 different groups defined */
if ( ( retn = FCNL_GrpDefBeg ( 1 ) ) != SIA_SUCCESS)
{
printf("\nFCNL_GrpDefBeg() failed...\n");
goto Error;
}
/* You can have standard ascii commands included in a group */
if ( ( retn = FCNL_GrpDefAsc ( ":ACQ:RUN PER" ) ) != SIA_SUCCESS)
{
printf("\nFCNL_GrpDefAsc() failed...\n");
goto Error;
}
/* You can also retrieve blocks of binary data */
if ( ( retn = FCNL_GrpDefAsc ( ":MEAS:DATA?" ) ) != SIA_SUCCESS)
{
printf("\nFCNL_GrpDefAsc() failed...\n");
goto Error;
}
/* And you can also use the structure calls, the zero argument skips plots */
if ( ( retn = FCNL_GrpDefPkt ( &hist, WIND_HIST, 0 ) ) != SIA_SUCCESS)
{
printf("\nFCNL_GrpDefPkt() failed...\n");
goto Error;
}
/* Ascii & structure calls can be interspersed */
if ( ( retn = FCNL_GrpDefAsc ( ":ACQ:RUN PW+" ) ) != SIA_SUCCESS)
{
printf("\nFCNL_GrpDefAsc() failed...\n");
goto Error;
}
/* With this structure call, the 1 argument requests all the plot data */
if ( ( retn = FCNL_GrpDefPkt ( &jitt, WIND_JITT, 1 ) ) != SIA_SUCCESS)
{
printf("\nFCNL_GrpDefPkt() failed...\n");
goto Error;
}
if ( ( retn = FCNL_GrpDefPkt ( &dcom, WIND_DCOM, 1 ) ) != SIA_SUCCESS)
{
©WAVECREST Corporation 2005
SECTION 3 – General Command Reference 163
printf("\nFCNL_GrpDefPkt() failed...\n");
goto Error;
}
/* You can nest multiple ascii commands, but only the last should return data */
if ( ( retn = FCNL_GrpDefAsc ( ":ACQ:FUNC FREQ;:ACQ:COUN 1000;:ACQ:MEAS" ) )
!= SIA_SUCCESS)
{
printf("\nFCNL_GrpDefAsc() failed...\n");
goto Error;
}
/* Finalize the group definition, for group 1 */
if ( ( retn = FCNL_GrpDefEnd ( ApiDevId, 1 ) ) != SIA_SUCCESS)
{
printf("\nFCNL_GrpDefEnd() failed...\n");
goto Error;
}
/* The definition doesn't acquire anything; use WavGrpGetAll to acquire */
/* You can loop and re-use the same definition over and over again */
for ( loop = 0; loop < 10; loop++ )
{
STEP 2 – Perform a Group Acquire and Print Results
When the function FCNL_GrpGetAll(deviceID, groupNumber) is called, the group of commands indicated
by groupNumber is executed by the SIA-3000 and the measurement results are available to the user in
the same order the corresponding measurement commands were defined in that particular group.
/* WavGrpGetAll does the measurements and gets the whole block of data */
if ( ( retn = FCNL_GrpGetAll ( ApiDevId, 1 ) ) != SIA_SUCCESS)
{
printf("\nFCNL_GrpGetAll() failed...\n");
goto Error;
}
/* The following calls parse the individual results out of the group data */
/* There must be a 1-to-1 correspondence between the definition and these calls */
if ( ( retn = FCNL_GrpGetAsc ( per, sizeof ( per ) ) ) != SIA_SUCCESS)
{
printf("\nFCNL_GrpGetAsc() failed...\n");
goto Error;
}
/* The same method is used for binary blocks from ascii requests */
if ( ( retn = FCNL_GrpGetAsc ( data, sizeof ( data ) ) ) != SIA_SUCCESS)
{
printf("\nFCNL_GrpGetAsc() failed...\n");
goto Error;
}
/* For structure calls, the bGetPlot argument must be the same as in the
definition */
if ( ( retn = FCNL_GrpGetPkt ( &hist, WIND_HIST, 0 ) ) != SIA_SUCCESS)
{
printf("\nFCNL_GrpGetPkt() failed...\n");
goto Error;
}
if ( ( retn = FCNL_GrpGetAsc ( pw, sizeof ( pw ) ) ) != SIA_SUCCESS)
{
printf("\nFCNL_GrpGetAsc() failed...\n");
goto Error;
}
/* If bGetPlot = 1, plots are returned; these can be
if ( ( retn = FCNL_GrpGetPkt ( &jitt, WIND_JITT, 1 )
{
printf("\nFCNL_GrpGetPkt() failed...\n");
goto Error;
}
if ( ( retn = FCNL_GrpGetPkt ( &dcom, WIND_DCOM, 1 )
{
printf("\nFCNL_GrpGetPkt() failed...\n");
goto Error;
}
if ( ( retn = FCNL_GrpGetAsc ( freq, sizeof ( freq )
{
164 Section 3 – General Command Reference
BIG and will be slower!!! */
) != SIA_SUCCESS)
) != SIA_SUCCESS)
) ) != SIA_SUCCESS)
©WAVECREST Corporation 2005
printf("\nFCNL_GrpGetAsc() failed...\n");
goto Error;
}
/* Print the simple ascii command results */
printf("Group Loop %i - Period Measurement: %s\n",
loop + 1, per);
printf("Group Loop %i - Pulsewidth Measurement: %s\n", loop + 1, pw);
printf("Group Loop %i - Frequency Measurement: %s\n",
loop + 1, freq);
/* Print the start of the binary block of raw data */
printf("Group Loop %i - Raw Period Measurements: %lf, %lf, %lf, ...\n", loop + 1,
data[0] * 1e9, data[1] * 1e9, data[2] * 1e9);
/* Print out some of the statistics from the HIST and JITT tool structures */
printf("Group Loop %i - Histogram Mean: %lfns\n", loop + 1, hist.dNormAvg * 1e9);
printf("Group Loop %i - Histogram Sdev: %lfps\n", loop + 1, hist.dNormSig * 1e12);
printf("Group Loop %i - 1Clock RJ: %lfps\n", loop + 1, jitt.dRjit1Clk * 1e12);
printf("Group Loop %i - NClock RJ: %lfps\n", loop + 1, jitt.dRjitNClk * 1e12);
/* Print the max of the FFT to show how data within a plot is accessed */
printf("Group Loop %i - NClock Plot Max: %lfps\n", loop + 1,
jitt.tFftN.dData[ jitt.tFftN.lYmaxIndx ] * 1e12);
/* Print the dataCOM tool DJ & RJ values */
printf("Group Loop %i - dataCOM DJ: %lfps\n",
printf("Group Loop %i - dataCOM RJ: %lfps\n",
©WAVECREST Corporation 2005
loop + 1, dcom.dDdjt * 1e12);
loop + 1, dcom.dRjit[0] * 1e12);
SECTION 3 – General Command Reference 165
This page intentionally left blank.
166 Section 3 – General Command Reference
©WAVECREST Corporation 2005
SECTION 4 – CODE SAMPLES
The following code samples are provided in order to aid in getting started using the WAVECREST
Production API. These code samples are provided for instructional purposes only.
4-1
MODIFYING WINDOW STRUCTURE PARAMETERS
The following code snippet shows how parameters pertaining to a high-level window structure may
be modified.
/* Allocate window structure */
STAT tStat;
/* Zero out the structure, and initialize to defaults */
memset ( &tStat, 0, sizeof ( STAT ) );
FCNL_DefStat ( &tStat );
/* Change input parameters from default */
tStat.tParm.lFuncNum = FUNC_PW_P; /* Function PW+
tStat.tParm.lChanNum = 2;
/* Channel 2
tStat.tParm.lAutoArm = ARM_EXTRN; /* External Arm
tStat.tParm.lStrtArm = 2;
/* Start Arm 2
tStat.tParm.lStopArm = 2;
/* Stop Arm 2
tStat.tParm.lSampCnt = 500;
/* Sample Size
tStat.tParm.lStopCnt = 11;
/* Stop Count
4-2
*/
*/
*/
*/
*/
*/
*/
PERFORMING TAILFIT
The following code snippet shows how a tailfit can be performed in a Histogram Window. Note that it
may take many passes for the tailfit to succeed. Therefore you may want to error if not successfully in a
certain number of passes. Set the lPass parameter to 0 to start a new tailfit analysis.
/* Allocate window structure, and initialize to defaults */
HIST tHist;
memset ( &tHist, 0, sizeof ( HIST ) );
FCNL_DefHist ( &tHist );
/* Enable tailfit */
tHist.lTailFit = 1;
/* Loop until tailfit is successful */
while ( !tHist.tTfit.lGood )
{
if ( FCNL_RqstPkt(ApiDevId, tHist, WIND_HIST ( &tHist ) )
goto ErrorHandler;
}
©WAVECREST Corporation 2005
SECTION 4 – Code Samples 167
4-3
DRAWING FROM A PLOT STRUCTURE
This code snippet shows how to draw from a plot structure. The example is for Microsoft® Visual C++, but
can be modified for other platforms.
void DrawPlot ( CDC *pCdc,
// Pointer to device context.
CRect *wind, // Window to draw within
// in device coordinates.
PLDT *pldt, // Source plot structure.
double xmin, // Plot extents to use when
double xmax, // drawing, this allows a
double ymin, // margin to be added around
double ymax )// plot or overlay of plots
{
// with differing extents.
long i;
double x, y;
// First plot X point as a percent of window extents
x = ( pldt->dXmin - xmin ) / ( xmax - xmin );
// First plot X point in device coordinates
x = ( double ) ( wind->right - wind->left )
* x + ( double ) wind->left;
// First plot Y point as a percent of window extents
y = ( pldt->dData[ 0 ] - ymin ) / ( ymax - ymin );
// First plot Y point in device coordinates
y = ( double ) ( wind->bottom - wind->top )
* ( 1.0 - y ) + ( double ) wind->top;
// Move current location to the first plot point
pCdc->MoveTo ( ( int ) x, ( int ) y );
for ( i = 1; i < pldt->lNumb; i++ )
{
// Calculate what the next X point is
x = ( ( pldt->dXmax - pldt->dXmin ) * ( double ) i
/ ( double ) ( pldt->lNumb - 1 ) + pldt->dXmin );
// This plot X point as a percent of window extents
x = ( x - xmin ) / ( xmax - xmin );
// This plot X point in device coordinates
x = ( double ) ( wind->right - wind->left )
* x + ( double ) wind->left;
// This plot Y point as a percent of window extents
y = ( pldt->dData[ i ] - ymin ) / ( ymax - ymin );
// This plot Y point in device coordinates
y = ( double ) ( wind->bottom - wind->top )
* ( 1.0 - y ) + ( double ) wind->top;
}
// Draw line to this plot point
pCdc->LineTo ( ( int ) x, ( int ) y );
}
168 SECTION 4 – Code Samples
©WAVECREST Corporation 2005
4-4
PERFORMING A DATACOM MEASUREMENT
This code snippet shows how a dataCOM measurement can be taken. Error checking is performed at
each step, and several acquisition parameters are overridden. A pulsefind is used to determine suitable
voltage levels, and results are printed.
#include
#include
#include
#include
#include
<stdio.h>
<stdlib.h>
<string.h>
"WCcomm.h"
"WCfcnl.h"
long main()
{
DCOM dcom;
long ApiDevId, retn = 0;
/* Initialize device */
if ( ( ApiDevId = COMM_InitDev ( APIDEVTYPE, DEVICENAME ) ) < 1 )
{
fprintf(stderr, “\nUnable to initialize device\n”);
return –1;
}
/* Initialize structure to default values */
memset ( &dcom, 0, sizeof ( DCOM ) );
FCNL_DefDcom ( &dcom );
/* Measure on Channel
dcom.tParm.lChanNum =
dcom.tParm.lAutoArm =
dcom.tParm.lExtnArm =
1; External Arm using Channel 2 */
1;
ARM_EXTRN;
2;
/* Select the pattern to use */
strcpy(&dcom[0].sPtnName, "crpat.ptn");
/* Do not measure the Bit Rate; assign the Bit Rate to use */
dcom.lGetRate = 0;
dcom.dBitRate = 1.0625e9;
/* Perform a pulsefind */
if ( ( retn = FCNL_PulsFnd ( ApiDevId, &dcom.tParm ) ) != SIA_SUCCESS)
goto Error;
/* Acquire measurement and obtain all values */
if ( ( retn = FCNL_RqstPkt ( ApiDevId, &dcom, WIND_DCOM ) ) != SIA_SUCCESS)
goto Error;
if ( ( retn = FCNL_RqstAll ( ApiDevId, &dcom, WIND_DCOM ) ) != SIA_SUCCESS)
goto Error;
/* Print out the dataCOM DJ, RJ
printf("dataCOM DJ: %lf ps\n",
printf("dataCOM RJ: %lf ps\n",
printf("dataCOM TJ: %lf ps\n",
and TJ values in picoseconds */
dcom.dDdjt * 1e12);
dcom.dRjit[0] * 1e12);
dcom.dTjit[0] * 1e12);
Error:
/* Return an error message if we had a problem */
if ( retn )
printf ( "Return Code: %i\n", retn );
/* Perform any cleanup and exit */
FCNL_ClrDcom ( &dcom );
COMM_CloseDev (ApiDevId);
return retn;
}
©WAVECREST Corporation 2005
SECTION 4 – Code Samples 169
4-5
USING A PM50 PATTERN MARKER IN A DATACOM MEASUREMENT
This example illustrates how to utilize a PM50 Pattern Marker in a dataCOM measurement to determine bit
errors and the Bit Error Rate using the PM50’s Bit Error Counter.
#include
#include
#include
#include
#include
<stdio.h>
<stdlib.h>
<string.h>
"WCcomm.h"
"WCfcnl.h"
/* Uncomment for SUNOS
/*#define SUNOS 1
#if (WIN32 || SUNOS || SOLARIS2)
#define APIDEVTYPE
GPIB_IO
#define DEVICENAME
"dev5"
#else
#if (HPUX)
#define APIDEVTYPE
HPIB_IO
#define DEVICENAME
"hpib,5"
#endif
#endif
#define PATN_WORD_SIZE
*/
*/
20
int main()
{
DCOM dcom;
PMKR pmkr;
char buff[PATN_WORD_SIZE];
long ApiDevId, MarkerId, indx, bitIndx, retn = 0;
/* In this example, use the PM50 associated with Input 1 */
MarkerId = 1;
/* Initialize our DCOM structure */
memset ( &dcom, 0, sizeof ( DCOM ) );
FCNL_DefDcom ( &dcom );
strcpy(&dcom.sPtnName[0], "cjtpat.ptn");
dcom.tParm.lChanNum = 1;
/* Request that the
dcom.tParm.lAutoArm
dcom.tParm.lExtnArm
dcom.tParm.lCmdFlag
PM50 be used as the arm */
= ARM_EXTRN;
= 1;
|= CMD_PATNMARK;
/* Initialize SIA3000 */
if ( ( ApiDevId = COMM_InitDev ( APIDEVTYPE, DEVICENAME ) ) < 1 )
{
printf ( "Unable to initialize SIA3000. Program terminated.\n" );
goto Error;
}
170 SECTION 4 – Code Samples
©WAVECREST Corporation 2005
/* Initialize PM50 */
if ( ( retn = FCNL_MarkerInit ( ApiDevId, MarkerId, &pmkr ) ) != SIA_SUCCESS )
printf ( "FCNL_MarkerInit: Return Code: %i\n", retn );
printf( " - Wavecrest Production API - \n - Sample PM50 Application
-\n\n" );
/* PART I: Configure the PM50 for edge count mode */
pmkr.lModeSel = PMKR_EDGE_COUNT;
strcpy(&pmkr.sPtnName[0], "cjtpat.ptn");
if ( ( retn = FCNL_MarkerConfig ( ApiDevId, &pmkr ) ) != SIA_SUCCESS )
printf ( "FCNL_MarkerConfig: Return Code: %i\n", retn );
/* Is the PM50 detecting the pattern? */
if ( ( retn = FCNL_MarkerStatus ( ApiDevId, &pmkr ) ) <= 0 )
printf ( "FCNL_MarkerStatus: Return Code: %i\n", retn );
/* Perform a pulsefind before making a DCOM measurement */
if ( ( retn = FCNL_PulsFnd ( ApiDevId, &dcom.tParm ) ) != SIA_SUCCESS )
printf ( "FCNL_PulsFnd: Return Code: %i\n", retn );
if ( ( retn = FCNL_RqstPkt ( ApiDevId, &dcom, WIND_DCOM ) ) != SIA_SUCCESS )
{
printf ( "FCNL_RqstPkt: Return Code: %i\n", retn );
goto Error;
}
/* Print the results */
printf( " Edge Count Mode\n\n" );
printf( "Pattern: %s\n",
printf( "Edge Count: %i\n",
printf( "dataCOM DCD+ISI: %lfps\n",
printf( "dataCOM RJ: %lfps\n\n",
pmkr.sPtnName
pmkr.lEdgeCnt
dcom.dDdjt
dcom.dRjit[0]
);
);
* 1e12 );
* 1e12 );
/* PART II: Configure the PM50 for pattern match mode @ 1.0625 GBit/s */
pmkr.lModeSel = PMKR_PATN_MATCH;
pmkr.lProtSel = PMKR_FC1X;
strcpy(&pmkr.sPtnName[0], "cjtpat.ptn");
if ( ( retn = FCNL_MarkerConfig ( ApiDevId, &pmkr ) ) != SIA_SUCCESS )
printf ( "FCNL_MarkerConfig: Return Code: %i\n", retn );
/* Is the PM50 detecting the pattern? */
if ( ( retn = FCNL_MarkerStatus ( ApiDevId, &pmkr ) ) <= 0 )
printf ( "FCNL_MarkerStatus: Return Code: %i\n", retn );
/* Perform a pulsefind before making a DCOM measurement */
if ( ( retn = FCNL_PulsFnd ( ApiDevId, &dcom.tParm ) ) != SIA_SUCCESS )
printf ( "FCNL_PulsFnd: Return Code: %i\n", retn );
if ( ( retn = FCNL_RqstPkt ( ApiDevId, &dcom, WIND_DCOM ) ) != SIA_SUCCESS )
{
printf ( "FCNL_RqstPkt: Return Code: %i\n", retn );
goto Error;
}
©WAVECREST Corporation 2005
SECTION 4 – Code Samples 171
/* Print the results */
printf( " Pattern Match Mode\n\n" );
printf( "Pattern: %s\n",
dcom.sPtnName );
printf( "dataCOM DCD+ISI: %lfps\n", dcom.dDdjt
* 1e12 );
printf( "dataCOM RJ: %lfps\n\n",
dcom.dRjit[0] * 1e12 );
/* Did the PM50 detect any bit errors? */
if ( ( retn = FCNL_MarkerReadErr ( ApiDevId, &pmkr ) ) != SIA_SUCCESS )
{
printf ( "FCNL_MarkerReadErr: Return Code: %i\n", retn );
goto Error;
}
/* Print
printf (
printf (
printf (
the Bit Error Counter results */
"Number of Bit Errors: %i\n",
pmkr.lNumBitErr );
"Total Compare Count: %.0lf\n", pmkr.dTtlCmpCnt );
"Bit Error Rate: %.10e\n\n",
pmkr.dBitErrRat );
for ( indx = 0; indx < BEC_ERRS; indx++ )
{
BECT *bec = &pmkr.tBerTest[indx];
if ( bec->lErrBits == 0 )
break;
printf ( "Error %i:\n", indx + 1 );
printf ( " Pattern Repeat: %.0lf\n", bec->dLoopCnt );
printf ( " Frame Number: %i\n",
bec->lFrameNo );
printf ( " 20-bit Data in Error: " );
}
/* Display each bit, noting bits in error with special characters */
buff[1] = 0;
for ( bitIndx = PATN_WORD_SIZE - 1; bitIndx >= 0; bitIndx-- )
{
if ( bec->lErrBits & ( 1 << bitIndx ) )
buff[0] = ( bec->lExpBits & ( 1 << bitIndx ) ) ? 140 : 147;
else
buff[0] = ( bec->lExpBits & ( 1 << bitIndx ) ) ? '1' : '0';
printf ( "%c", buff[0] );
if (bitIndx == (PATN_WORD_SIZE / 2))
printf( " " );
}
printf ( "\r\n\n" );
Error:
/* Perform any cleanup and exit */
FCNL_ClrDcom ( &dcom );
COMM_CloseDev ( ApiDevId );
return retn;
}
172 SECTION 4 – Code Samples
©WAVECREST Corporation 2005
SECTION 5 – BUILD CONSIDERATIONS
5-1
SUPPORTED COMPILERS FOR THE WAVECREST PRODUCTION API
The WAVECREST Production API was built and is supported using the following compilers. Other
compilers may be used and provide satisfactory results, although performance is not guaranteed.
Win32 (Win9x, WinNT 4.0 and Win2k)
Microsoft Visual C++ 5.0 and later
Microsoft C/C++ Optimizing Compiler 11.00
Microsoft Visual Basic 6.0 and later
National Instruments LabVIEW 6.1 and later
HP-UX 9.05, 10.2 and 11i
HP C/ANSI C Developer's Bundle B.10.20.03
Sun 4.1.x (Solaris 1)
SPARCompiler C 3.0.1
Sun 2.5.1 or above (Solaris 2)
SPARCompiler C 3.0.1
LINUX 7.2 and above
GNU compiler gcc version 2.96 or above
5-2
BUILD REQUIREMENTS
When building an application using the WAVECREST Production API, the following requirements
need to be considered.
5-3
DEVELOPING WITH C++
The define CPLUSPLUS must be supplied if you are developing a C++ application. This informs the
compiler that the module was created as a C library, and does not contain the additional information
that is normally contained in a C++ library. If you are developing a standard C application, supplying
this define will result in an error. If you are using a command line compiler, this define may be
supplied as follows:
cl -c -DCPLUSPLUS sample.c
5-4
WIN32 (WIN9X, WINNT 4.0, WIN2K AND WINXP)
A static stub library and dynamic library link library (DLL) are supplied for developing under Microsoft
Windows. You can link to the static stub library that relieves all the programming of the chores normally
associated with linking to a DLL. The DLL libraries must be available in the current directory or
somewhere in the PATH in order to execute the application.
The define WIN32 must be supplied to enable options specific to Microsoft Windows platforms. If you
are developing within the Visual C++ environment, this define is automatically supplied for you. If
you are using a command line compiler, this define may be supplied as follows:
cl -c -DWIN32 sample.c
©WAVECREST Corporation 2005
SECTION 5 – Build Considerations 173
5-5
ALL UNIX PLATFORMS
The define WIN32 must NOT be defined when compiling under UNIX platforms. This define enables
options that are not suitable under UNIX platforms.
5-6
HP-UX 9.05, HP-UX 10.20 AND HP-UX 11i
The ANSI C compiler must be used. ANSI compatibility is enabled from a command line by
specifying the -Aa option as follows:
cc -c -Aa –DHPUX –DHP9X (HP-UX 9.05)
cc -c -Aa –DHPUX (HP-UX 10.20)
cc -c -Aa –DHPUX (HP-UX 11.i)
Required HPIB support is supplied by linking to the Standard Instrument Control Library. This library must
already be installed per manufacturers documentation. This library can be included by adding -lsicl to
the link command. The resulting link command including the Wavecrest API libraries takes the form:
cc -Aa sample.o –lWChpb -lWCcu1 -lWCcu2 -lWCcu3 -lWCio –lWCmc -lWCfnl
-lsicl -lm –o sample
5-7
SUN 4.1.X (SOLARIS 1)
The ANSI C compiler must be used. ANSI compatibility is enabled from a command line by using the acc
command as follows:
acc -c –DSUNOS sample.c
Required GPIB support is supplied by linking to the National Instruments GPIB Library. This library must
already be installed per manufacturers documentation. This library can be included by adding -lgpib to
the link command. The resulting link command including the Wavecrest API libraries takes the form:
acc sample.o –lWChpb -lWCcu1 -lWCcu2 -lWCcu3 -lWCio –lWCmc -lWCfnl –lgpib
-o sample
5-8
SUN 2.5.1 OR ABOVE (SOLARIS 2)
The standard ANSI C compiler must be used. The command line would appear as follows:
cc –c –DSUNOS -DSOLARIS sample.c
Required GPIB support is supplied by linking to the National Instruments GPIB Library. This library must
already be installed per manufacturers documentation. This library can be included by adding -lgpib to
the link command. The resulting link command including the Wavecrest API libraries takes the form:
cc sample.o –lWChpb -lWCcu1 -lWCcu2 -lWCcu3 -lWCio –lWCmc -lWCfnl -lgpib
-lm -o sample
174 SECTION 5 – Build Considerations
©WAVECREST Corporation 2005
APPENDIX A – ERROR CODES
Define
SIA_SUCCESS
SIA_ERROR
MEM_ERROR
CMD_ERROR
VER_ERROR
FIT_ERROR
LIM_ERROR
FIO_ERROR
ARM_ERROR
TRG_ERROR
USR_ERROR
UNT_ERROR
DDJ_ERROR
VAR_ERROR
LRN_ERROR
INT_ERROR
TIM_ERROR
PCI_ERROR
LOK_ERROR
CAL_ERROR
SYS_ERROR
PTN_ERROR
FRQ_ERROR
BEC_ERROR
NOI_ERROR
PAT_ERROR
PKT_ERROR
Value
0
-1
-2
-3
-4
-5
-6
-7
-8
-9
-10
-11
-12
-13
-14
-15
-16
-17
-18
-19
-20
-21
-22
-23
-24
-25
-26
©WAVECREST Corporation 2005
Description
Success
Communication error with device
Could not allocate required memory
Invalid parameters passed to function
Wrong version of software detected
Failure applying tail-fit
Results exceed specified limits
File I/O error
No suitable arm signal detected
No suitable trigger signal detected
Operation was terminated by user
Unit Interval data exceeds limits
DCD+DDJ data exceeds limits
Variance data for RJ+PJ exceeds limits
Learn Mode data exceeds limits
Insufficient points for interpolation
Maximum measurement timeout exceeded
PCI bus error
Memory transfer error
Missing or invalid calibration file
System or hardware failure
Indicates an invalid pattern was used
Channel does not support this Bit Rate
Pattern is too long for BEC comparison
Obtained an invalid Phase Noise result
DCD+ISI calibration pattern is no longer supported
Invalid data returned in binary packet
APPENDIX A – Error Codes 175
This page intentionally left blank.
176 APPENDIX A – Error Codes
©WAVECREST Corporation 2005
APPENDIX B – VBASIC EXAMPLE
The following example shows what the sample program in Chapter 1 might look like written as a Visual
Basic subroutine:
Private Sub Sample_Click()
' Start of Sample Program
Dim bHist As HIST
Dim bJitt As JITT
Dim bDcom As DCOM
Dim
Dim
Dim
Dim
Dim
ApiDevid As Long
Round As Long
retn As Long
avg As Double
data(299) As Double
Dim
Dim
Dim
Dim
Dim
per As String
pw As String
rise As String
AsciData(255) As Byte
AsciLeng As Long
' Initialize
FCNL_DefHist
FCNL_DefJitt
FCNL_DefDcom
our structures
bHist
bJitt
bDcom
' Bitfield of input channels to measure (Channel 1 = lower 16 bits; Channel 2
= upper 16 bits)
' Equivalent to (1 + (2 << 16) in ANSI C
bHist.tParm.lChanNum = 131073
bHist.tParm.lStopCnt = 1
bHist.tParm.lFuncNum = FUNC_TPD_PP
retn = FCNL_PtnName(bDcom.sPtnName(0), "clock.ptn")
If (retn <> SIA_SUCCESS) Then
GoTo Error:
End If
bDcom.lQckMode = 1
bDcom.tParm.lChanNum = 1
bDcom.tParm.lAutoArm = ARM_EXTRN
bDcom.tParm.lExtnArm = 2
' Initialize device
ApiDevid = COMM_InitDev(GPIB_IO, "dev5")
If (ApiDevid < 1) Then
GoTo Error:
End If
©WAVECREST Corporation 2005
APPENDIX B – VBasic Example
177
' Turn on calibration source
retn = COMM_TalkDev(ApiDevid, ":CAL:SIG 10MSQ")
If (retn <> SIA_SUCCESS) Then
GoTo Error:
End If
' Go ahead and perform a pulsefind
retn = FCNL_PulsFnd(ApiDevid, bHist.tParm)
If (retn <> SIA_SUCCESS) Then
GoTo Error:
End If
' Perform a simple measurement and get the average
retn = COMM_ReqDbl(ApiDevid, ":ACQ:RUN PER", avg)
If (retn <> SIA_SUCCESS) Then
GoTo Error:
End If
' Print the results
mainDisplay.Text = " - Wavecrest Production API - " & _
vbCrLf & " Sample Application
-" & vbCrLf & _
vbCrLf & "Simple Period Command: " & _
Format(avg * 1000000000#, "0.000") & "ns" & vbCrLf
' Perform a measurement and return the statistics
retn = FCNL_RqstPkt(ApiDevid, bHist, WIND_HIST)
If (retn <> SIA_SUCCESS) Then
GoTo Error:
End If
' Now retrieve the plot structures for the previous measurement
' This call is not necessary unless you want the plot data
retn = FCNL_RqstAll(ApiDevid, bHist, WIND_HIST)
If (retn <> SIA_SUCCESS) Then
GoTo Error:
End If
' Print the results
mainDisplay.Text = mainDisplay & "Single Histogram Mean: " & _
Format(bHist.dNormAvg * 1000000000#, "0.000") & "ns" & _
vbCrLf & "Single Histogram Sdev: " & _
Format(bHist.dNormSig * 1000000000000#, "0.000") & "ps" & vbCrLf
retn = FCNL_RqstPkt(ApiDevid, bDcom, WIND_DCOM)
If (retn <> SIA_SUCCESS) Then
GoTo Error:
End If
retn = FCNL_RqstAll(ApiDevid, bDcom, WIND_DCOM)
If (retn <> SIA_SUCCESS) Then
GoTo Error:
End If
178
APPENDIX B – VBasic Example
©WAVECREST Corporation 2005
' Now define a group, the group must only be defined once
' There can be up to 20 different groups defined
retn = FCNL_GrpDefBeg(1)
If (retn <> 0) Then
GoTo Error:
End If
' You can have standard ascii commands included in a group
retn = FCNL_GrpDefAsc(":ACQ:RUN PER")
If (retn <> SIA_SUCCESS) Then
GoTo Error:
End If
' You can also retrieve blocks of binary data
retn = FCNL_GrpDefAsc(":MEAS:DATA?")
If (retn <> SIA_SUCCESS) Then
GoTo Error:
End If
' And you can also use the structure calls, the zero argument skips plots
retn = FCNL_GrpDefPkt(bHist, WIND_HIST, 0)
If (retn <> SIA_SUCCESS) Then
GoTo Error:
End If
' Ascii & structure calls can be interspersed
retn = FCNL_GrpDefAsc(":ACQ:RUN PW+")
If (retn <> SIA_SUCCESS) Then
GoTo Error:
End If
' With this structure call, the 1 argument requests all the plot data
retn = FCNL_GrpDefPkt(bJitt, WIND_JITT, 1)
If (retn <> SIA_SUCCESS) Then
GoTo Error:
End If
retn = FCNL_GrpDefPkt(bDcom, WIND_DCOM, 1)
If (retn <> 0) Then
GoTo Error:
End If
' You can nest multiple ascii commands, but only the last should return data
retn = FCNL_GrpDefAsc(":ACQ:FUNC TT+;:ACQ:COUN 1000;:ACQ:MEAS")
If (retn <> SIA_SUCCESS) Then
GoTo Error:
End If
' Finalize the group definition, for group 1
retn = FCNL_GrpDefEnd(ApiDevid, 1)
If (retn <> SIA_SUCCESS) Then
GoTo Error:
End If
©WAVECREST Corporation 2005
APPENDIX B – VBasic Example
179
' The definition doesn't acquire anything; use WavGrpGetAll to acquire
' You can loop and re-use the same definition over and over again
For Round = 0 To 1 Step 1
' WavGrpGetAll does the measurements and gets the whole block of data
retn = FCNL_GrpGetAll(ApiDevid, 1)
If (retn <> SIA_SUCCESS) Then
GoTo Error:
End If
' The following calls parse the individual results out of the group data
' There must be a 1-to-1 correspondence between the definition and these
' calls
retn = FCNL_GrpGetAsc(AsciData(0), 256)
If (retn <> SIA_SUCCESS) Then
GoTo Error:
End If
For AsciLeng = 0 To 255 Step 1
per = per & Chr$(AsciData(AsciLeng))
Next AsciLeng
' The same method is used for binary blocks from ascii requests
retn = FCNL_GrpGetAsc(data(0), 2400)
If (retn <> SIA_SUCCESS) Then
GoTo Error:
End If
' For structure calls, the bGetPlot argument must be the same as in the
' definition
retn = FCNL_GrpGetPkt(bHist, WIND_HIST, 0)
If (retn <> SIA_SUCCESS) Then
GoTo Error:
End If
retn = FCNL_GrpGetAsc(AsciData(0), 256)
If (retn <> SIA_SUCCESS) Then
GoTo Error:
End If
For AsciLeng = 0 To 255 Step 1
pw = pw & Chr$(AsciData(AsciLeng))
Next AsciLeng
' If bGetPlot = 1, plots are returned; these can be BIG and will be
' slower!!!
retn = FCNL_GrpGetPkt(bJitt, WIND_JITT, 1)
If (retn <> SIA_SUCCESS) Then
GoTo Error:
End If
retn = FCNL_GrpGetPkt(bDcom, WIND_DCOM, 1)
If (retn <> SIA_SUCCESS) Then
GoTo Error:
End If
180
APPENDIX B – VBasic Example
©WAVECREST Corporation 2005
retn = FCNL_GrpGetAsc(AsciData(0), 256)
If (retn <> SIA_SUCCESS) Then
GoTo Error:
End If
For AsciLeng = 0 To 255 Step 1
rise = rise & Chr$(AsciData(AsciLeng))
Next AsciLeng
' Print the simple ascii command results and print the start of the binary
' block of raw data
mainDisplay.Text = mainDisplay & "Group Loop " & _
Format(Round + 1, "0") & " - Period Measurement: " & per
mainDisplay.Text = mainDisplay & vbCrLf & "Group Loop " & _
Format(Round + 1, "0") & " - Pulsewidth Measurement: " & pw
mainDisplay.Text = mainDisplay & vbCrLf & "Group Loop " & _
Format(Round + 1, "0") & " - Risetime Measurement: " & rise
mainDisplay.Text = mainDisplay & vbCrLf & "Group Loop " & _
Format(Round + 1, "0") & " - Raw Period Measurements: " & _
Format(data(0) * 1000000000#, "0.000") & "ns," & _
Format(data(1) * 1000000000#, "0.000") & "ns," & _
Format(data(2) * 1000000000#, "0.000") & "ns, ..." & vbCrLf
' Print out some of the statistics from the HIST and JITT tool structures
mainDisplay.Text = mainDisplay & "Group Loop " & _
Format(Round + 1, "0") & " - Histogram Mean: " & _
Format(bHist.dNormAvg * 1000000000#, "0.000") & "ns" & _
vbCrLf & "Group Loop " & _
Format(Round + 1, "0") & " - Histogram Sdev: " & _
Format(bHist.dNormSig * 1000000000000#, "0.000") & "ps" & _
vbCrLf & "Group Loop " & _
Format(Round + 1, "0") & " - 1Clock RJ: " & _
Format(bJitt.dRjit1Clk * 1000000000000#, "0.000") & "ps" & _
vbCrLf & "Group Loop " & _
Format(Round + 1, "0") & " - NClock RJ: " & _
Format(bJitt.dRjitNClk * 1000000000000#, "0.000") & "ps" & vbCrLf
' Print the max of the FFT to show how data within a plot is accessed and
' print the dataCOM tool DJ & RJ values
mainDisplay.Text = mainDisplay & "Group Loop " & _
Format(Round + 1, "0") & " - dataCOM DJ: " & _
Format(bDcom.dDdjt * 1000000000000#, "0.000") & "ps" & _
vbCrLf & "Group Loop " & _
Format(Round + 1, "0") & " - dataCOM RJ: " & _
Format(bDcom.dRjit(0) * 1000000000000#, "0.000") & "ps" & _
vbCrLf & "Group Loop " & _
Format(Round + 1, "0") & " - NClock Plot Max: " & _
Format(FCNL_GetYval(bJitt.tFftN, bJitt.tFftN.lYmaxIndx) * 1000000000000#, "0.000")
& "ps" & vbCrLf
©WAVECREST Corporation 2005
APPENDIX B – VBasic Example
181
Next Round
Error:
' Return an error message if we had a problem
If (retn) Then
mainDisplay.Text = mainDisplay & vbCrLf & "ERROR! Return Code: " &
Format(retn, "0")
End If
' Perform any cleanup and exit
FCNL_ClrHist bHist
FCNL_ClrJitt bJitt
FCNL_ClrDcom bDcom
COMM_CloseDev ApiDevid
End Sub
182
APPENDIX B – VBasic Example
©WAVECREST Corporation 2005
APPENDIX C – PAPI REVISION CHANGES
The following listings provide changes to the measurement window structures and sub-structures for all
supported revisions of PAPI. Find the version of GigaView or VISI that is currently installed on your
SIA-3000. All the changes in that section and previous sections (newer versions) show the differences
between the latest version of PAPI and the version of PAPI compatible with your SIA-3000.
GIGAVIEW 1.5 CHANGES (FROM GIGAVIEW 1.4)
New Tools
Folded Eye Diagram (FEYE)
Measurement Window Structure Changes
Added Input Parameters
None
Sub-Structure Changes
None
GIGAVIEW 1.4 CHANGES (FROM GIGAVIEW 1.3)
New Tools
PCI Express 1.1 Clock Analysis (PCLK)
PCI Express 1.1 Hardware Clock Recovery (PCIM)
PCI Express ATA 1.1 Software Clock Recovery (EXPR)
Serial ATA Gen2i & Gen2m (ATA2)
Serial ATA Gen1x & Gen2x (ATAX)
Measurement Window Structure Changes
Added Input Parameters
None
Sub-Structure Changes
None
GIGAVIEW 1.3 CHANGES (FROM GIGAVIEW 1.2)
New Tools
Feature Analysis (FEAT)
Measurement Window Structure Changes
Added Input Parameters
EYEH – lFiltOff
Sub-Structure Changes
None
©WAVECREST Corporation 2005
APPENDIX C – PAPI Revision Changes 181
GIGAVIEW 1.2 CHANGES (FROM GIGAVIEW 1.1)
New Tools
None
Measurement Window Structure Changes
Added Input Parameters
CANL – lHiRFmV, lLoRFmV, dAttn[POSS_CHNS]
FCMP – dAttn
INFI – dAttn
PCIX – lPcnt, lHiRFmV, lLoRFmV, lIdleOk, dAttn
SCOP – lVdif[ POSS_CHNS ], lVcom[ POSS_CHNS ], lHiRFmV, lLoRFmV
Added Output Parameters
CANL - qComm[POSS_CHNS], tComm[POSS_CHNS]
INFI – tDifScop, tComScop
PCIX – dEyeOffs, dXmnDiff, dXmxDiff, dVcommonAc, dVcommonDc,
dVcmDcActv, dVcmIdleDc, dVcmDcLine, dVcmDcDpls, dVcmDcDmin,
dVIdleDiff, *bTranEye, lTranRsv, *bDeemEye, lDeemRsv
SCOP – qComm[ POSS_CHNS ], tComm[ POSS_CHNS ]
Element Order and Padding
INFI – tEyeh moved
INFI – Added lPad1 and lPad2
Sub-Structure Changes
Added Parameters
MASK – dV0pas, dXwdUI, dXflUI, dYiPct, dV1Rel, dV0Rel
QTYS – dMaskRgn1, dMaskRgn2, dMaskRgn3
Modified Parameters
MASK – dToffs, dVoffs are now ignored
MASK – dVpass renamed to dV1pas
GIGAVIEW 1.1 CHANGES (FROM GIGAVIEW 1.0)
New Tools
Spread Spectrum Clock Analysis (SSCA)
Measurement Window Structure Changes
Added Input Parameters
DCOM – lTfitCnt
EYEH – lKeepOut, dKpOutLt, dKpOutRt
HIST – lKeepOut, dKpOutLt, dKpOutRt
Added Output Parameters
EYEH – tBoth, tBothProb
Element Order and Padding
HIST – Added lPad0
EYEH, RCPM, SIMP and STRP – Added lPad1
PCIX – Added lPad0 and lPad1
SATA – Added lPad3, lPad4, and lPad5
SCOP – Added lPad1 and lPad2
Sub-Structure Changes
None
182 APPENDIX C – PAPI Revision Changes
©WAVECREST Corporation 2005
GIGAVIEW 1.0 CHANGES (FROM VISI 7.4.0)
NOTE: Beginning with this release, VISI is now called GigiView and a new version numbering
system has been started.
New Tools
Clock Analysis (CANL)
Infiniband (INFI)
PCI Express (PCIX)
Recovered Clock / Pattern Marker dataCOM (RCPM)
Serial ATA (SATA)
Measurement Window Structure Changes
Added Input Parameters
SCOP – dAttn[ POSS_CHNS ]
Added Output Parameters
HIST – tShrt, tLong, tBoth
SCOP – qNorm[ POSS_CHNS ], qComp[ POSS_CHNS ], qDiff[
POSS_CHNS ]
Modified Parameters
SCOP – qDisp[ POSS_CHNS ] eliminated. Use qNorm[ POSS_CHNS ].
Sub-Structure Changes
None
VISI 7.4.0 CHANGES (FROM VISI 7.3.0)
New Tools
None
Measurement Window Structure Changes
Added Input Parameters
SCOP – lVoff[ POSS_CHNS ], dHistDly, dHistWid, dHistVlt, dHistHgt
Added Output Parameters
SCOP – tHorz[ POSS_CHNS ], tVert[ POSS_CHNS ]
Modified Parameters
SCOP – lMask eliminated
Sub-Structure Changes
New Structures
Oscilloscope Histogram (OHIS)
Added Parameters
QTYS – dMidVolts
©WAVECREST Corporation 2005
APPENDIX C – PAPI Revision Changes 183
VISI 7.3.0 CHANGES (FROM VISI 7.2.1)
New Tools
Clock Statistics (CLOK)
New Oscilloscope (SCOP)
Measurement Window Structure Changes
Added Output Parameters
APLL - tInit
Sub-Structure Changes
New Structures
Measurement (MEAS)
Quantities (QTYS)
Mask (MASK)
VISI 7.2.1 CHANGES (FROM VISI 7.2.0)
NOTE: VISI 7.2.2 and 7.2.1 are identical as far as PAPI structures are concerned.
New Tools
None
Measurement Window Structure Changes
Added Input Parameters
APLL – dRecTime, lRecUnit, lIniCond
Modified Parameters
APLL – lAutoFix eliminated
Element Order and Padding
APLL – dCornFrq moved
APLL – lPad1 eliminated
Sub-Structure Changes
None
184 APPENDIX C – PAPI Revision Changes
©WAVECREST Corporation 2005
WAVECREST Corporation
World Headquarters:
7626 Golden Triangle Drive
Eden Prairie, MN 55344
TEL: (952) 831-0030
FAX: (952) 831-4474
Toll Free: 1-800-733-7128
www.wavecrest.com
West Coast Office:
1735 Technology Drive, Ste. 400
San Jose, CA 95110
TEL: (408) 436-9000
FAX: (408) 436-9001
1-800-821-2272
Europe Office:
Hansastrasse 136
D-81373 München
TEL: +49 (0)89 32225330
FAX: +49 (0)89 32225333
Japan Office:
Otsuka Sentcore Building, 6F
3-46-3 Minami-Otsuka
Toshima-Ku, Tokyo
170-0005, Japan
TEL: +81-03-5960-5770
FAX: +81-03-5960-5773
200212-04
REV A