1
Map Intelligence Client – User Manual
iii
Map Intelligence Client – User Manual
ii
CONTENTS
INTRODUCTION ......................................................................................................... 5
Purpose ...................................................................................................................................................5
Audience..................................................................................................................................................5
Conventions ............................................................................................................................................6
Prerequisites ...........................................................................................................................................6
CONCEPTS................................................................................................................. 7
What is Map Intelligence?......................................................................................................................7
The Map Intelligence Client for QlikView .......................................................................................7
The Map Intelligence Server and Browser Mapping Viewer ..........................................................7
What is a Layer? ............................................................................................................................8
Layer Types ....................................................................................................................................9
What is a Mapping Viewer? .........................................................................................................11
EMBED MAPPING VIEWER TO THE QLIKVIEW DOCUMENT .............................. 12
Accessing the MI Client Configuration ..............................................................................................22
MI CLIENT CONFIGURATION SCREENS ............................................................... 24
Overview ................................................................................................................................................24
Configuration Screens ..................................................................................................................24
Configuration Screen Main Menu .................................................................................................24
Global Settings .....................................................................................................................................25
Map Intelligence Layers .......................................................................................................................33
Overview ......................................................................................................................................33
Layer Directory .............................................................................................................................33
Configure Point Layers .................................................................................................................33
Configure Relationship Layers .....................................................................................................54
Configure Area Group Layers ......................................................................................................91
Logging Off and Ending BI Session ...........................................................................................125
Selection ..............................................................................................................................................126
ADVANCED TOPICS .............................................................................................. 128
Auto Pilot Mode ..................................................................................................................................128
Independent Maps and Legends .......................................................................................................128
TROUBLESHOOTING ............................................................................................ 132
Client Login Issues .............................................................................................................................132
Client Connection Issues...................................................................................................................132
Global Settings Issues .............................................................................. Error! Bookmark not defined.
Layer Issues ........................................................................................................................................133
Map Intelligence Client – User Manual
iii
Map Rendering Issues .......................................................................................................................133
APPENDICES ......................................................................................................... 134
Appendix A: Client Methods..............................................................................................................134
Appendix B: Features Rendering Attributes ...................................................................................136
Appendix C: Using the Unshaded and Transparent Color Options ..............................................140
Region Relationship and Area Group Layers ............................................................................140
Radius Relationship Layers .......................................................................................................142
Appendix D: Module Code .................................................................................................................144
Appendix E: Client Properties ...........................................................................................................148
GLOSSARY ............................................................................................................ 152
Map Intelligence Client – User Manual
iv
INTRODUCTION
PURPOSE
This manual provides information about the Map Intelligence Client for QlikView (MI Client for QlikView). It
explains the MI Client for QlikView features and options and contains the concepts, processes, procedures and
examples that you need to use this software.
AUDIENCE
The effective use of Map Intelligence involves a number of separate processes which can be performed by different
user groups. The user groups involved are described below.
LAYER DESIGNERS
Layer designers are responsible for configuring the Map Intelligence Map Intelligence layers that are displayed on
the Mapping Viewer. Layer Designers are also responsible for configuring the settings for the Map Intelligence
Server as well as the properties of the underlying map to be used for the analysis. This user group should have a
firm understanding of the spatial analysis required.
Layer designers are advised to read all sections of this manual.
END USERS
End Users are users who want to view the configured layers on a map. Their roles include launching the Mapping
Viewer to generate spatial representations of the data.
End Users are advised to read the separate Mapping Viewer User Manual.
SERVER ADMINISTRATORS
Another type of user exists that is responsible for the installation and management of the Map Intelligence Server.
These users should be familiar with the organization’s mapping server (hereinafter referred to as GIS Provider).
Server Administrators are advised to read the separate Server Installation Guide and the Server and Administration
Tools.
Map Intelligence Client – User Manual
5
CONVENTIONS
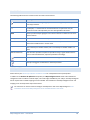
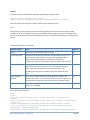
The following table shows the conventions that are used in this document.
Item
Meaning
An arrow indicates the beginning of procedures consisting of sequential steps or
one-step procedures.
<>
In examples, < > indicate that the enclosed elements are optional or they are
instances of code to be replaced by the user with applicable information.
Bold
Bold in procedural steps highlights user interface elements on which the user must
perform actions.
Example text
Courier font indicates that the example test is code or syntax.
Courier italics
Courier italic text indicates a variable field in command syntax. Substitute a value in
place of the variable shown in Courier italics.
n,x
Italic n stands for a variable number; italic x can stand for a variable number or a
letter.
Mouse Orientation
This document provides examples and procedures using a right-handed mouse. If
you use a left-handed mouse, adjust the procedures accordingly.
The Note icon indicates additional information relating to the topic.
The Tip icon suggests an alternative or shortcut procedure.
PREREQUISITES
Please refer to your MI Client for QlikView Installation Guide for a comprehensive list of prerequisites
In addition to the MI Client for QlikView Prerequisites, the Map Intelligence Server needs to be installed and
configured in order to make the relevant maps, colors and images available for your analysis. The Map Intelligence
Server requires that a suitable mapping server be installed. The installation of the Map Intelligence Server and
mapping server are beyond the scope of this manual.
For instructions on how to install and configure the Map Server refer to the Map Intelligence Server
Installation Guide and the Map Intelligence Server and Administration Tools Guide.
Map Intelligence Client – User Manual
6
CONCEPTS
WHAT IS MAP INTELLIGENCE?
Map Intelligence extends the "no programming" paradigm into mapping and merges location and spatial analytics
into enterprise decision support and Business Intelligence applications.
Map Intelligence enables bi-directional analysis between data visualized on maps and other more traditional
representations such as tables of data, charts and reports. In this environment a user can easily discover previously
hidden information and data relationships.
Map Intelligence reduces the time needed to develop the applications from weeks and months to days and hours.
In many cases organizations have given up before solving the technical challenges that Map Intelligence solves.
Using web services from the vast range of online, statistical and business information, an organization’s in-house
data can be quickly, easily and dynamically augmented and enriched with geographical and satellite imagery.
Available services include census, demographic and health data, climatic, hydrological and geological data.
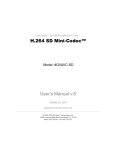
Map Intelligence has two principal components:
THE MAP INTELLIGENCE CLIENT FOR QLIKVIEW
The Map Intelligence Client for QlikView includes a number of configuration screens that enable you to design your
mapping application. Using the MI Client for QlikView you select the underlying map you want to use, specify the
‘look and feel’ and build the different Map Intelligence layers to be used in your analysis (see Layer Types). Once
this has been done, your application is finished and in operation the MI Client sends a request to the Map
Intelligence Server to display your application in a web browser.
THE MAP INTELLIGENCE SERVER AND BROWSER MAPPING VIEWER
The Map Intelligence Server is the powerhouse behind the mapping application you designed using the Client. It
processes all the information sent from the Client to produce your application which you view and interact with in
the browser Mapping Viewer (see What is a Mapping Viewer?). The Map Intelligence Server is supplied with a
number of administration tools that include license administration, global default settings for the ‘look and feel’
and customization of various applications features such as pop-ups.
Map Intelligence Client – User Manual
7
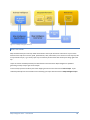
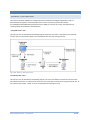
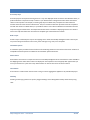
Figure 1. The Map Intelligence Platform.
WHAT IS A LAYER?
Maps are built with layers. Each layer holds characteristics that may be of interest to End Users. Layers contain
features of the map such as streets, parks, postal districts, cities, radio towers, rivers and so on. Each map layer sits
on top of another layer, e.g. a country layer may sit all the way at the bottom with street layers sitting right at the
top.
Layers can also be created dynamically from data found in external sources. Map Intelligence is capable of
generating a variety of layer types to aid analysis.
In this manual, layers that reside as part of the mapping environment are referred to as built-in layers. Layers
created dynamically from external data sources including your report data are known as Map Intelligence layers.
Map Intelligence Client – User Manual
8
LAYER TYPES
The following layers can be created and configured using Map Intelligence:
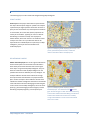
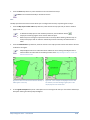
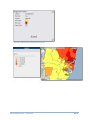
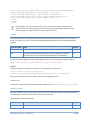
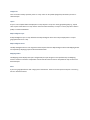
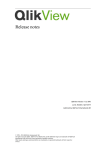
POINT LAYERS
Point Layers are map layers where data is represented on
the map as discrete point images or symbols. For example:
a particular layer might represent the location of stores as
push-pin icons and another layer could represent accidents
as colored dots, where the color (theme) represents the
severity of the accident. Typically, the rows in a table of
data belong to a business concept such as people or
address details, where each column is an attribute of that
concept. Thus each row in your business data can be
represented as an individual point in a point layer. In Map
Intelligence, point layers form the foundation for
relationship layers.
Figure 2: The Mapping Viewer displaying a Point layer. The
points, represented by colored circles, indicate the
location of fast food outlets in the Sydney area.
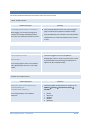
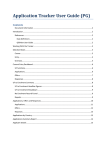
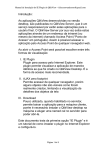
RELATIONSHIP LAYERS
Radius relationship layers are circular regions with themes
around certain points of interest that show information
about other points which fall within that circular region.
These layers are generated by Map Intelligence. They are
based on calculations made by Map Intelligence on the
specified data values as defined by the Layer Designer. For
example: different colored circles indicate the average
house price within half a kilometer of a proposed waste
plant. Another example is where different colored circles
indicate the number of burglaries that have occurred within
a five-mile distance of houses belonging to known burglars.
In the current version of Map Intelligence, the circle center
points (e.g. houses belonging to known burglars) and the
data being analyzed (burglaries), must be point layers.
Map Intelligence Client – User Manual
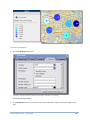
Figure 3: The Mapping Viewer displaying a Radius
Relationship layer. The small blue circles represent
gyms. Around each gym is a 2km radius colored according
to the number of fast food outlets offering a low fat menu.
Yellow Circles indicate there are more than 5 outlets,
orange circles between 1 and 5 and red circles indicate
there are no outlets.
9
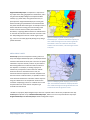
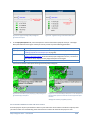
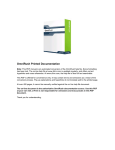
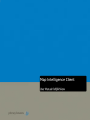
Region Relationship layers corresponds to a map area of
any shape that is solely geographical in its definition, and is
not generated by Map Intelligence. Examples would be
suburbs, zip / postal codes, local government areas, or
police precincts. Region Relationship layers can be given
themes according to specified data rules associated with
the points that fall within that region. An example of such a
theme could be color-coding precincts according to the
number of crimes that have taken place within their
boundaries, or applying different hatches to suburbs based
on the total value of house sales that have occurred in each
one. Map Intelligence works out in which region a point
(e.g. a sale or an accident) physically belongs to by doing a
spatial calculation.
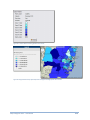
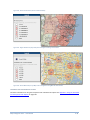
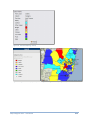
Figure 4: The Mapping Viewer displaying a Region
Relationship layer. Local Government Areas of Sydney are
color-coded according to the most common type of fast
food outlets in each area. Yellow areas show chicken
outlets are the most common, red areas burger and blue
areas pizza.
AREA GROUP LAYER
Area Group layers also correspond to existing areas on a
map. As for Region Relationship layers, the displayed theme
is based on data attribute values, but in this case no spatial
calculation is required. Instead, a column in your business
data is designated to have values that match a column in
the map data. For example, an existing map layer of
suburbs may correspond to a data column for suburbs
where the values are the suburb names. Then, for
transaction data that represents customer complaints and
that also contains a suburb column, it is possible to make a
cross-reference between the transaction and the map area
using the suburb name. An example that would use this
correlation is displaying a theme on a suburb’s area on the
map that reflects the most common complaint type
received from that suburb.
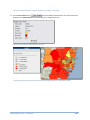
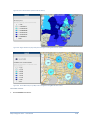
Figure 5: The Mapping Viewer displaying an Area Group
layer. The Local Government Areas of Sydney have been
color-coded according to the average household income.
The darker the area the higher the income.
Like built-in map layers, Map Intelligence layers also have a specific order in which they are placed on the map.
Point layers are placed on top of Radius Relationship layers, which in turn sit on top of the built-in map layers.
Region Relationship and Area Group layers shade existing built-in layers.
Map Intelligence Client – User Manual
10
WHAT IS A MAPPING VIEWER?
The Mapping Viewer displays the configured Map Intelligence layers overlaid on a specified map. The Mapping
Viewer also provides a number of controls and features that allow you to navigate around the map or to change
the theme displayed on the map. A number of tools are also available from the Mapping Viewer that allow you to
perform high-level analysis.
Map Intelligence Client – User Manual
11
EMBED MAPPING VIEWER TO THE QLIKVIEW DOCUMENT
This section will guide you in embedding a map to the QlikView document using the MI Client Map Viewer
extension object.
To embed the Mapping Viewer using MI Client Map Viewer
1.
Check if the MI Client Map Viewer is installed on the QlikView Server (see page 28 of the MI Client for QlikView
11 SR2 Installation Guide for the detailed steps).
2.
Open the QlikView document where you will be embedding the map.
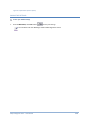
3.
In the QlikView Desktop, under the menu click View then Turn on/off WebView to activate the Web View.
Figure 6. View menu dialog - Turn on/off WebView
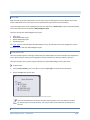
4.
Right click on the document sheet then New Sheet Object. The New Sheet Object dialog displays.
Map Intelligence Client – User Manual
12
Figure 7. Right click dialog- New Sheet Object
Figure 8. New Sheet Object dialog- MI Client Map Viewer
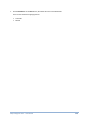
5.
Drag the MI Client Map Viewer the drop it to target Sheet content of the QlikView document.
Map Intelligence Client – User Manual
13
Figure 9. MI Client Map Viewer.
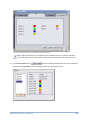
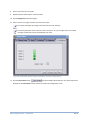
6.
Right click on the MI Client Map Viewer then Properties. Change the value of Report Server to the QlikView
Server address.
Figure 10. MI Client Map Viewer - Properties dialog.
7.
Turn off the Web View then save the document.
8.
Configure the get map filter button that allows filtering data while the map is rendered.
a.
Create a new button.
b.
On the New Button property box, set the following properties:
9.
Text area in the General tab : Get map filter or as preferred
Actions tab:
o Action Type : External
o Action : Run Macro
o Macro Name : qvMapSelection
c.
Click OK button to save and close.
d.
Save the document and proceed to write the code.
Write the QlikView Document code
a.
Go to Tools Edit Module. The Edit Module code editor displays.
Map Intelligence Client – User Manual
14
Figure 11. Tools menu dialog - Edit Module
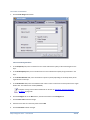
b.
Copy and paste the QlikView Client code(see Appendix D) on the editor.
Figure 12. Edit Module code editor
c.
Change the value of gMIClient constant to the location of MI Client for QlikView(i.e. http://<MI
Client machine hostname or IP address>:<port> = http://miclientserver:9050)
Replace the value of the gReportServer to the QlikView Server hostname or IP address
On the Requested Module Security, select the System Access option.
On the Current Local Security, select the Allow System Access option.
The QV Client code is also installed as part of the MI Client for QlikView installation. You may copy the source
code under <MI Client for QlikView Home>\tomcat\QV Client Script.
Click the OK button. The Edit Module code editor closes.
Map Intelligence Client – User Manual
15
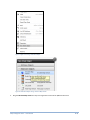
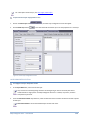
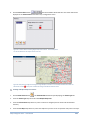
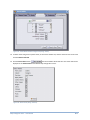
10. Create a document trigger that will set the MIURL value on open and any select action on the QlikView
document.
a.
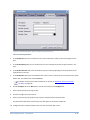
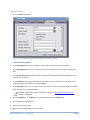
In Settings menu, click the Document Properties. The Document Properties dialog displays.
Figure 13. Settings menu dialog - Document Properties
Figure 14. Document Properties dialog
b.
On the Document Event Triggers section of Triggers tab, select the OnAnySelect then click the Add
Action(s) button . The Actions dialog displays.
Map Intelligence Client – User Manual
16
Figure 15. Actions dialog
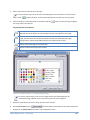
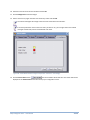
c.
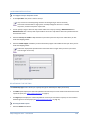
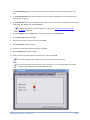
On the Actions dialog, click the Add button. The Add Action dialog displays.
Figure 16. Add Action dialog
d.
On Add Action dialog, select External on Action Type and Run Macro on Action then click OK button. The
Add Action dialog closes and the Action dialog will be activated.
Map Intelligence Client – User Manual
17
Figure 17. Action dialog with new Action
e.
On Action dialog, set the Macro Name to qvSetMIURL then click the OK button. The Action dialog closes
and the Document Properties dialog will be activated.
f.
Repeat steps 10.b through 10.e but select OnOpen on Document Event Triggers section instead of
OnAnySelect.
g.
Within Document Properties dialog, click the OK button to save the new document properties settings.
11. Declare Global Variables
a.
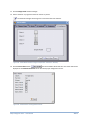
Under Settings menu, click the Variable Overview link. The Variable Overview dialog displays.
Figure 18. Settings menu dialog - Variable Overview
Map Intelligence Client – User Manual
18
Figure 19. Variable Overview dialog
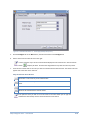
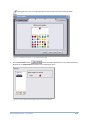
b.
On Variable Overview dialog, click the Add button. The New Variable dialog displays.
Figure 20. New Variable dialog
c.
On New Variable dialog, type the MIURL on the Variable Name then click the OK button.
d.
Do the same steps(b to c) for the following variables: MIConnId, MIDocId, MIFilter and
MIQVUser
Variable Name
Value
MIURL
MIConnId
MIFilter
Map Intelligence Client – User Manual
Description
This is used by the Launch Application since it can only
accept Global variable as basis for the parameter.
Updated when user navigates to the
document(select/deselect value).
This is the unique ID for the current instance of the
document. Generated when the document is loaded the
first time.
This stores the current selection of the QlikView
document.
19
MIDocId
MIQVUser
This stores the QlikView document's name and path.
=OSUser()
This returns the username which is used to generate a
unique MI Connection ID.
Figure 21. Global Variables' description and value before publishing the document .
Figure 22. Variable Overview dialog - Complete variables.
e.
On Variable Overview dialog, click the OK button. The Variable Overview dialog closes.
12. Save/Publish the QlikView document.
Before publishing the document, make sure that WebView is turned off and the value of all Global
Variables except for MIQVUser are empty. Please refer to Figure 21 for the required values of the
Global Variables before saving or publishing.
13. Configure the MI layers using MI Client configuration console.
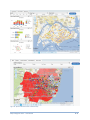
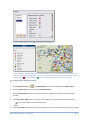
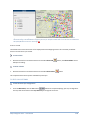
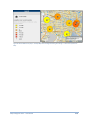
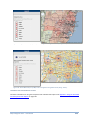
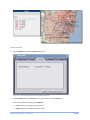
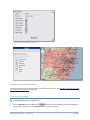
14. Render the unified dashboard with embedded map in QlikView Server 11.X using the QlikView Ajax client
a.
Open a web browser, type the URL http://<server name>/qlikview. The AJAX Client home page display the
list of available QlikView documents.
b.
On AJAX Client home page, open the QlikView document you configured.
Map Intelligence Client – User Manual
20
Figure 23. QlikView Dashboard with embedded map
Map Intelligence Client – User Manual
21
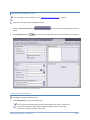
ACCESSING THE MI CLIENT CONFIGURATION
This section looks at the steps in accessing the MI Client Configuration.
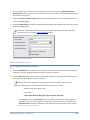
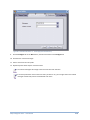
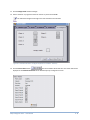
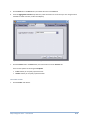
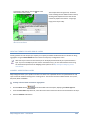
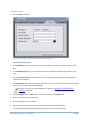
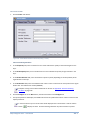
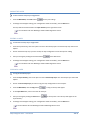
1.
Launch an IE browser, access the following URL : http://<machine-name>:<port number>/miclient.
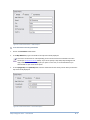
Figure 24. Login page.
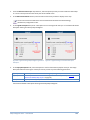
2.
Type the User Name, Password, Server and the Authentication type on the fields.
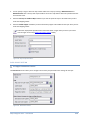
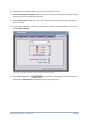
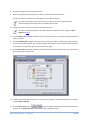
3.
On User Name, type the QlikView username that has access to QlikView Server
At Password, type the QlikView username's password
At Server, type the QlikView Server hostname or IP Address
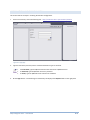
Hit the Login button. A successful login is indicated by the display of the Reports folder on the right panel.
Map Intelligence Client – User Manual
22
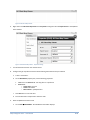
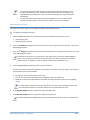
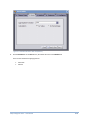
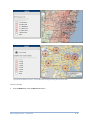
Figure 25. Successful login page.
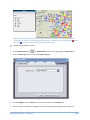
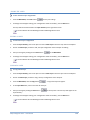
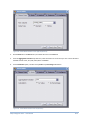
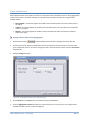
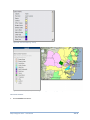
4.
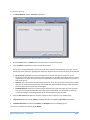
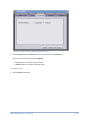
Collapse the Reports folder to view the list of reports.
Figure 26. Collapsed Report folder.
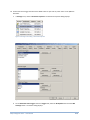
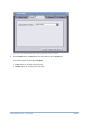
5.
Either select a specific Analysis or Dashboard Page(which may contain multiple Analysis) to configure. The
Global Settings screen displays for the selected Analysis or Dashboard Page.
Map Intelligence Client – User Manual
23
MI CLIENT CONFIGURATION SCREENS
OVERVIEW
This section looks at the steps required in configuring your analysis layers.
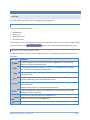
CONFIGURATION SCREENS
There are four configuration screens:
Global Settings
Point Layers
Relationship Layers
Area Group Layers
Each configuration screen can be accessed by clicking the relevant tab at the top of your screen for example clicking
the Area Group Layer tab
will take you to the Area Group Layer configuration screen.
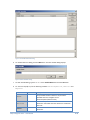
CONFIGURATION SCREEN MAIN MENU
The Main Menu appears at the top of each configuration screen. The following table explains the features of the
Main Menu.
Menu Item
Description
To import configurations from another report, click the Import button. This button only
appears on the Global Settings Main Menu.
To clear all fields and set the properties for a new layer, click the New button. This button
does not feature on the Global Settings Main Menu.
To make a copy of a layer, click the Copy button. This button does not feature on the Global
Settings Main Menu.
To save your configuration screen settings, click the Save button. Note: This button is global
and will save all changes made to all configuration screens.
To delete a layer, click the Delete button. Note: To permanently remove the layer you must
click the Save button.
This button does not feature on the Global Settings Main Menu.
To test your configuration settings, click the Test button, a new browser window will open
displaying your layer configuration.
Report Name
The name of your report will appear in the Main Menu bar.
To open the MI Client Help, click the Help button.
To log off the MI Client and end your BI Session, click the Log Off button
Map Intelligence Client – User Manual
24
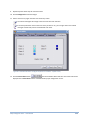
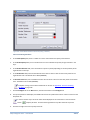
GLOBAL SETTINGS
The Global Settings screen allows you to configure the settings for your Map Intelligence Server as well as the
properties of the underlying map to be used for your analysis.
To open the Global Settings screen
1.
Click on the Global Settings tab
, the Global Settings configuration screen will appear.
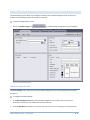
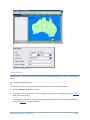
Figure 27. Global Settings Screen.
SERVER SETTINGS SECTION
The Server Settings section allows you to specify the Map Intelligence Server and underlying map to be used for
the analysis.
To configure the Server Settings
1.
In the Map Intelligence Server field, enter the Map Intelligence server and port that you wish to use.
Previously entered servers are available from the drop-down list.
2.
From the Map Name drop-down list, select the map that you want to use to display your analysis layers on.
Map Intelligence Client – User Manual
25
The Map Name drop-down list contains all the maps that have been added during the Map
Intelligence server configuration. Consult your Map Intelligence Server Administrator if the map
you wish to use is not available in the drop-down list.
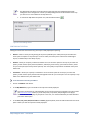
To refresh the Map Name drop-down list, click the Refresh button
.
Figure 28. Server Settings Section.
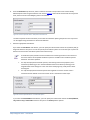
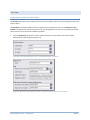
CENTER POINT SECTION
Setting the Center Point controls the way your map is initially displayed on opening.
Default – selects a center point by plotting all the points specified by the visible point layers and takes the
center point of all points. If no point layers are set as visible, the Center point is taken from visible Region
layers (i.e. Relationship or Area Group Layers).
Address – allows you to specify a valid street address to set as the center point for the map. If you select this
option, you will need to specify the street/address, suburb/city, state and zip / post code and country values
for your center point (the Country field is optional). You must specify a map width or the default center point
will be used.
Coordinates – allows you to specify a coordinate to set as the center point for the map. If you select this
option, you will need to specify the latitude and longitude values for your center point. You must specify a map
width or the default center point will be used.
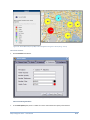
To set the Center Point using an Address
1.
Click on the Address radio button.
2.
In the Map Width field, type in the width of the map to be initially displayed.
This value is in kilometers or miles depending on the unit of measurement selected in the Units section
(see Preferences Section below). If you do not specify a map width, Map Intelligence will apply a
default width that will display all your points. In this case, it is recommended that you select Default as
your Center Point option.
3.
In the Street, City, State, ZIP/Postal Code and Country (optional) fields, enter the address details for the center
point at which you wish the map to be initially displayed.
Map Intelligence Client – User Manual
26
Figure 29. Center Point Section – Address Option.
To set the Center Point using Coordinates
1.
Click on the Coordinates radio button.
2.
In the Map Width field, type in the width of the map to be initially displayed.
This value is in kilometers or miles depending on the unit of measurement selected in the Units
section (see Preferences Section below). If you do not specify a map width, Map Intelligence will
apply a default width that will display all your points. In this case, it is recommended that you
select Default as your Center Point option.
1.
In the X (Longitude) and Y (Latitude) fields enter the coordinates for the center point at which you wish the
map to be initially displayed.
Figure 30. Center Point Section – Coordinates Option.
Map Intelligence Client – User Manual
27
For maps with projected coordinate systems, when setting Center Point properties, the Y
coordinate (or Northing) is set in the latitude field and the X coordinate (or Easting) in the
longitude field. These settings are in the units of the underlying map, usually meters rather
than degrees.
For maps with projected coordinate systems the longitude is set to the column of the X
coordinate and the latitude is set to the column of the Y coordinate in Point layers.
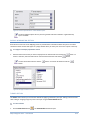
PREFERENCES SECTION
The Preferences section allows you to configure properties of the Mapping Viewer.
To configure the Preference Section
1.
Select the Units radio button for the measurement that you would like to use for your analysis.
Imperial (miles, feet)
Metric (kilometers, meters)
2.
From the 1st Delimiter drop-down list, select a character to act as a separator for your data as it is sent to the
Map Intelligence Server.
2.
From the 2 Delimiter drop-down list, select a second character to act as a separator for your data as it is sent
to the Map Intelligence Server.
nd
The delimiter characters act as a separators for your data as they are sent to the Map Intelligence
Server. You must select characters that do not exist within your data to avoid errors. The default
st
character for the 1 Delimiter is ÿ and the default character for the 2nd Delimiter is þ.
3.
From the Extent Lock drop-down list, select an extent lock option.
The Extent Lock determines the map extent to be used when a user makes a new map request from the client.
The lock extent options are listed below:
Most Recent: The last viewed extent will be used.
No Lock: The extent will be calculated on a bounding box around the visible data.
Disabled: The extent lock will be based on the Extent Lock setting selected by the user in the Mapping
Viewer.
If a center point is specified in the Center Point Section, the view of the map adheres to this center
point. Subsequent requests in the session adhere to the lock specified by the client.
4.
In the Map View Width field enter in pixels the width of the Map View.
5.
In the Map View Height field enter in pixels the height of the Map View.
The Map View Width and Height settings override the default settings set by the Server Administrator.
Map Intelligence Client – User Manual
28
Figure 31. Mapping Viewer showing the Map View highlighted in green.
Figure 32. Preferences Section.
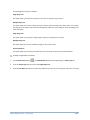
STYLES SECTION
The Styles section allow you to define the look and feel of the default Mapping Viewer or select a custom Mapping
Viewer.
To configure the Default styles
The Default Styles section allows you add a title and logo to the top panel of the Mapping Viewer.
1.
Ensure the Default radio button is selected.
2.
In the Title field, enter the title that you want to appear in the top panel of the Mapping Viewer (see Figure 33
below). This field is optional.
3.
In the Logo field, enter the file name of the image that you want to appear in the Top Panel of the Mapping
Viewer (see Figure 33). This field is optional.
Map Intelligence Client – User Manual
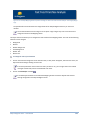
29
Figure 33. An example Mapping Viewer Top Panel showing the Title “Fast Food Franchise Analysis” and Integeo/Burger
Logo.
The specified file must be located in the Images folder of the Map Intelligence directory on the server
machine.
The recommended size for the image is 70 x 70 pixels. Larger images may cover some elements or
change the format of the Mapping Viewer
The Styles section also allows you to configure the look and feel of the Mapping Viewer. The color of the following
elements can be changed:
Background
Buttons
Header Background
Panel Background
Header Text
Button Text
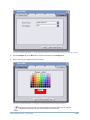
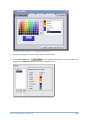
To change the color of each element
1.
Click on the colored rectangle next to the element name, a color picker will appear, select the new color, the
Style Preview will change showing the new color.
If the color picker does not have the exact color you wish to use, you can right click on the colored
rectangle and manually enter the hexadecimal color value.
2.
Click on the Send Styles checkbox
.
If the Send Styles checkbox is unchecked the Mapping Viewer will use the Default Look and Feel
settings configured on the Map Intelligence Server.
Map Intelligence Client – User Manual
30
Figure 34. Styles Section (Default option) showing a blue/gray color scheme
To use the Custom option
As of Map Intelligence Server Version 3.2.2, Map Intelligence allows organizations to create custom Mapping
Viewer User Interfaces that can be used instead of the standard Map Intelligence Mapping Viewer. Examples
of this could be to use Google Maps, Open Layers or even map layers from Excel over the existing in-house
spatial applications being used by organizations. If more than one viewer is registered with your Map
Intelligence server, you can enter the name in the Template Name field as shown below.
1.
Select the Custom radio button.
2.
In the Template Name field enter the name of the custom Mapping Viewer you wish to use.
Further information on creating custom GUI’s can be found in the Technical Note : Web Map Service
(WMS) implementation and information regarding the Map Intelligence Next Generation (MING) GUI
can be found in the MING Preliminary User Manual.
Map Intelligence Client – User Manual
31
Figure 35. Styles Section (Custom option)
SAVING THE SETTINGS
To save your Global Settings
1.
From the Main Menu, click Save button
to save your settings.
The save button will save all changes made to all configuration screens.
Map Intelligence Client – User Manual
32
MAP INTELLIGENCE LAYERS
OVERVIEW
Maps are made up of layers. Map features such as roads, parks or traffic lights are held on different layers. Each
map is composed of one or more layers that are superimposed to give the final map look and feel.
Layers that reside as part of the mapping environment are referred to as built-in layers. Layers created dynamically
from external data sources are known as Map Intelligence layers.
There are currently four Map Intelligence layer types:
Point Layers
Radius Relationship Layers
Region Relationship Layers
Area Group Layers
See Layer Types for a full description of Map Intelligence layers. The MI Client comes with configuration screens
that allow you to create your Map Intelligence layers.
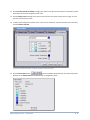
LAYER DIRECTORY
The Layer Directory appears to the right of the Point Layer, Relationship Layer and Area Group Layer configuration
screen. After testing or saving a layer configuration, the layer is listed in the directory under it’s layer type.
The Layer Directory can be used to navigate and open the various Map Intelligence layers you create.
To open a layer
1.
From the Layer Directory, click on the plus icon next to Layer Type. The Layer section will expand.
2.
Click on the Layer you want to open.
Figure 36. Layer Directory, showing the expanded Point Layer section.
Layers will be displayed on the map in the order that they appear in the Layer Directory sections.
E.g. the first layer in the Layer Directory - Point Layer section of the will be the top-most layer in
the map.
CONFIGURE POINT LAYERS
Map Intelligence Client – User Manual
33
For a description of Point layers, see Layer Types, Point Layers.
To open the Point Layer configuration screen
1.
Click on the Point Layers tab
, the Point Layer configuration screen will appear.
2.
Click the New Layer button
. This clears the fields and allows you to set the properties for a new layer.
Figure 37. Point Layer configuration screen.
LAYER PROPERTIES SECTION
To configure the Layer Properties section
1.
In the Layer Name field, enter a title for the layer.
Layer names are trimmed (spacing characters at the beginning or end are removed) and cannot
contain double or single quotes. For Map Intelligence Servers 3.1 or below, only letters, numbers
and spaces may be used.
2.
From the Data Source Name drop-down list, select the data source that contains the data to be used as points
for this layer.
Data Source Name is the concatenated Analysis' location and name..
Map Intelligence Client – User Manual
34
3.
You can specify a range in which the layer will be visible on the map by entering a Minimum Zoom and
Maximum Zoom value. The layer will only be visible if the current map width is within the specified minimum
and maximum zoom values.
4.
Select the Set Layer as Visible in Map checkbox if you wish this particular layer to be visible when you first
access the Mapping Viewer.
5.
Select the Enable Popups checkbox if you wish information popups to be enabled for the layer when you first
access the Mapping Viewer.
Information Popup boxes provide further information about a point when you move your mouse
over the point on the map (See Display Information below).
Figure 38. Layer Properties Section.
POINT PROPERTIES SECTION
To configure the Point Properties section
1.
From the Label Column drop-down list, select a column that contains the values to appear on the labels for
each point in the layer. Applying a label for each point in the layer is optional.
2.
From the URL Column drop-down list, select a column that contains URLs associated with the points in the
layer. Applying a URL for points in the layer is optional.
Multiple URLs can be assigned to a point using semi-colons to separate names and values.
The following format is required for the column that is used as a url column
<Name>;<Url>;(space)<Name>;<Url>
For example:
“Pitney Bowes Web Site;http://www.pb.com; Report;report.pdf”
From Mapping Viewer, the Active Points tool can be used for points that have been assigned to a
single URL. If a point has been assigned to multiple URLs, the active links can be viewed from the
Information Panel. For further information on the Active Points and Information sections refer to
the Mapping Viewer User Manual
Map Intelligence Client – User Manual
35
6.
From the Id Column drop-down list, select a column that contains unique values to be used to identify
individual points when using the Selection Tool. See the Selection section of this manual and the Foreground
Tools, Selection section of the Mapping Viewer User Manual.
Figure 39. Point Properties section: Label, URL and Id Columns.
The Point Properties section also allows you to select the method for plotting the points on the map. Points
can be mapped using coordinates or valid street addresses.
7.
Select the appropriate radio button.
If you select the Coordinates radio button, you must specify the columns that contain the Y (Latitude) and (X)
Longitude values for each point. You can also specify the coordinate systems to use for the layer if you do not
intend to use the inherent coordinate system of the selected map.
A coordinate system provides a frame of reference for measuring locations on the surface of
the earth. A full list of acceptable coordinate systems is available in the Coordinate Systems
document. This field is optional.
For maps with projected coordinate systems, when setting Center Point properties, the Y
coordinate (or Northing) is set in the latitude field and the X coordinate (or Easting) in the
longitude field. These settings are in the units of the underlying map, usually meters rather
than degrees.
For maps with projected coordinate systems the longitude is set to the column of the X
coordinate and the latitude is set to the column of the Y coordinate in Point layers.
Figure 40. Point Properties Section – Coordinates Option.
If you select the Street Address radio button, you must specify the columns that contain the Street/Address,
City, State and Zip / Postal Code values for each point. The Country field is optional.
Map Intelligence Client – User Manual
36
Figure 41. Point Properties Section - Street Address option.
The Street Address option will only work if a geocoder has been installed or a geocoded map
layer is available.
DISPLAY INFORMATION SECTION
Data columns can be sent to the Mapping Viewer to provide further information about each point. The values
contained in these columns will appear in a popup window when you move your mouse over a point in the map.
To configure the Display Information section
1.
Select the data columns that you want to display from the left hand list box and click the
remove a selection, select the data column from the left hand list box and click the
To select all the data columns click the
button.
button. To
button.
button. To remove all selections click the
Figure 42. Display Information section.
THEMES SECTION
The Theme section allows you to select the method for applying a theme for your layer. Setting a theme involves
color-coding or assigning images to points in the layer using the Theme Builder Wizard.
To create a theme
1.
Click the New Theme button
Map Intelligence Client – User Manual
, the Theme Builder wizard will open.
37
The following theme types are available:
Single Shape Icon
This option allows you to specify one shape of one color to represent all your points.
Multiple Shape Icon
This option allows you to select a shape and color code the shape according to the column value. For example
selecting the circle shape to represent all the fishing boat points, then color coding the circles according to the
name of the boat.
Single Image Icon
This option allows you to specify a single image to represent all the points in the layer.
Multiple Image Icon
This option allows you to select a different image for each column value.
Auto Classification
This option allows you to specify the number of classes into which column values will be distributed.
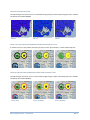
Creating a Single Shape Icon Theme
1.
Click the New Theme button
2.
From the Theme Type drop-down list select Single Shape Icon.
3.
From the Icon Shape drop-down list, select the shape that you want to use to represent each point in the layer.
Map Intelligence Client – User Manual
, the Theme Builder wizard will open displaying the Theme Type tab.
38
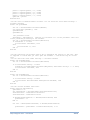
Figure 43. Theme Builder Wizard – 1. Theme Type (Single Shape Icon). In this example the Star shape has been selected.
4.
Click the Configure tab or the Next button, the wizard will move to the Configure tab.
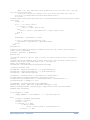
5.
Select a color for your shape from the color swatch.
Figure 44. Theme Builder Wizard – 5. Configure. In this example the color red has been selected.
If the particular color you wish to use is not shown on the color swatch you can type the
hexadecimal value directly into the text box below the color swatch.
Map Intelligence Client – User Manual
39
6.
Click the Save & Close button
. The Theme Builder Wizard will close. The theme will now be
displayed in the Theme Section of the Point Layer configuration screen.
Figure 45. Themes Section showing Single Shape Icon Theme 1. In this example we
can see we selected a star shape and the color red.
Figure 46. Map View and Legend showing the Single Shape Icon Theme. In this example all fast food outlets are
themed as red stars . Each point is labeled according to the Name of the franchise.
Creating a Multiple Shape Icon Theme
1.
Click the New Theme button
2.
From the Theme Type drop-down list select Multiple Shape Icon.
3.
From the Column Name drop-down list, select a column to configure (this list contains all selected data
columns).
4.
From the Icon Shape drop-down list, select the shape that you want to use to represent each point in the layer.
Map Intelligence Client – User Manual
, the Theme Builder wizard will open displaying the Theme Type tab.
40
Figure 47. Theme Builder Wizard – 1. Theme Type (Multiple Shape Icon).
5.
Click the Configure tab or the Next button, the wizard will move to the Configure tab.
6.
Select a value from the value list box on the right.
In some instances only a sub-set of values will be displayed in the value list box. Click the refresh
button
7.
to display all values. Be aware that large datasets may take some time to process.
From the color swatch click on the color you wish to associate with the selected value. The chosen color will
appear next to the value in the value list.
Using the Selection Arrow Buttons
Associates a color randomly to the selected value.
Associates colors randomly to the selected value and all values below the selected
value.
Removes associated color from selected value.
Removes all associated colors from all values.
If the particular color you wish to use is not shown on the color swatch you can type the
hexadecimal value directly into the text box below the color swatch.
Map Intelligence Client – User Manual
41
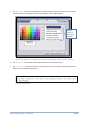
Figure 48. Theme Builder Wizard – 5. Configure (Multiple Shapes).
8.
Repeat the steps above if you want to assign themes to other columns.
9.
Click the Save & Close button
. The Theme Builder Wizard will close. The theme will now be
displayed in the Theme Section of the Point Layer configuration screen.
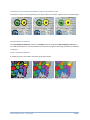
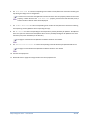
Figure 49. Themes Section showing Multiple Shape Icon Theme (Theme 2).
Map Intelligence Client – User Manual
42
Figure 50. Map View and Legend showing the Multiple Shape Icon Theme. We can see each fast food franchise is
represented by a colored circle, color-coded by food type category, for example red circles for Burger outlets , blue for
Pizza outlets . Each point is labeled according to the Name of the franchise.
Creating a Single Image Icon Theme
1.
Click the New Theme button
, the Theme Builder wizard will open displaying the Theme Type tab.
2.
From the Theme Type drop-down list select Single Image Icon.
Figure 51. Theme Builder Wizard – Theme Type (Single Image Icon).
3.
Click the Configure tab or the Next button, the wizard will move to the Configure tab.
4.
Select an Image from the bottom images list box. The selected image will be appear with a red border.
Map Intelligence Client – User Manual
43
Placing your cursor over an image will display the actual image size in the Preview box above.
Figure 52. Theme Builder Wizard – 5. Configure (Single Image).
5.
Click the Save & Close button
. The Theme Builder Wizard will close. The theme will now be
displayed in the Theme Section of the Point Layer configuration screen.
Figure 53. Themes Section showing Single Image Icon Theme (Theme 3).
Map Intelligence Client – User Manual
44
Figure 54. Map View and Legend showing the Single Image Icon Theme. In this example the location of Fast Food Outlets
are displayed as red houses
.
Creating a Multiple Image Icon Theme
1.
Click the New Theme button
, the Theme Builder wizard will open displaying the Theme Type tab.
2.
From the Theme Type drop-down list select Multiple Image Icon.
3.
From the Column Name drop-down list, select a column to configure (this list contains all selected data
columns).
Figure 55. Theme Builder Wizard – 1. Theme Type (Multiple Image Icon).
4.
Click the Configure tab or the Next button, the wizard will move to the Configure tab.
Map Intelligence Client – User Manual
45
5.
Select a value from the value list box on the right.
In some instances only a sub-set of values will be displayed in the value list box. Click the refresh
button
6.
to display all values. Be aware that large datasets may take some time to process.
Select an image from the Image list box on the left and click the
next to the value in the value list.
button. The chosen image will appear
Using the Selection Arrow Buttons
Select a value and an image then click this button to associate the image with the value.
Repeated clicks of this button will automatically select the next image from left to right.
Select a value and an image then click this button to automatically associate all values with an
image. All values below the selected value will be automatically associated with images,
starting with the selected image followed by the next image from left to right.
Removes associated image from selected value.
Removes all associated images from all values.
Figure 56. Theme Builder Wizard – 5. Configure (Multiple Image).
You do not need to assign an icon for every single column value. Map Intelligence will
automatically assign a default icon for all values that have not been configured.
7.
Repeat the steps above if you want to assign themes to other columns.
8.
Click the Save & Close button
. The Theme Builder Wizard will close. The theme will now be
displayed in the Theme Section of the Point Layer configuration screen.
Map Intelligence Client – User Manual
46
Figure 57. Themes Section showing Multiple Image Icon Theme (Theme 4).
Figure 58. Map View and Legend showing the Multiple Image Icon Theme. In this example see each fast food franchise
outlet is represented by a rectangle image, colored circle, colored according to the name of the franchise, for example red
for Burger House , green for Salad World . Each point is labeled according to the Name of the franchise.
Creating an Auto Classification Theme
1.
Click the New Theme button
, the Theme Builder wizard will open displaying the Theme Type tab.
2.
From the Theme Type drop-down list select Auto Classification.
3.
From the Column Name drop-down list, select a column to configure (this list contains all numeric data
columns).
4.
In the New Column Name, enter a new column name (This column is used to store the classified values).
Do not use a column name that already exists.
5.
From the Icon Shape drop-down list, select the shape that you want to use to represent each point in the layer.
Map Intelligence Client – User Manual
47
Figure 59. Theme Builder Wizard – 1. Theme Type (Auto Classification).
6.
Click the Features tab or the Next button, the wizard will move to the Features tab.
7.
From the Scheme drop-down list, select a classification scheme.
You can use a standard classification scheme to group similar values to look for patterns in the data. You can
choose from two schemes for grouping data values into classes based on how the data values are distributed.
8.
Equal Interval: The difference between the high and low values is the same for every class. So, the
classification of the data will be based on a set of equal splits. For example, if the lowest value is 0 and the
highest value is 10 in the data, and 5 classes are requested, the range of each class will be 0 to 2, 2 to 4, 4
to 6, 6 to 8, 8 to 10.
Quantile: Each class contains an equal number of features. In this case, the points are sorted in ascending
order (for the chosen data field) and each class is filled with (total number of points)/(number of classes)
points starting from the lowest value to the highest.
From the Class Count drop-down list, select the number of colors to appear in your shading range.
Map Intelligence Client – User Manual
48
Figure 60. Theme Builder Wizard – 1. Theme Type (Auto Classification).
9.
Click the Configure tab or the Next button, the wizard will move to the Configure tab.
10. Click the Class 1 colored rectangle.
11. Select a color from the color picker.
12. Repeat Steps the above steps for each class listed.
The colored rectangles will change to the new color after each selection.
If the color picker does not have the exact color you wish to use, you can right click on the colored
rectangle and manually enter the hexadecimal color value.
Map Intelligence Client – User Manual
49
Figure 61. Theme Builder Wizard: Configure Tab (Auto Classification).
When displaying class breaks in the legend for auto-classified themes, if the fractional part of the
class break is 0 (zero) then the class break is displayed as an integral value with no decimal places.
13. Click the Save & Close button
. The Theme Builder Wizard will close. The theme will now be
displayed in the Color Theme section of the Relationship Layer configuration screen.
Figure 62. Themes Section showing Auto Classification Theme.
Map Intelligence Client – User Manual
50
Figure 63. Map View and Legend showing the Auto Classification Theme. In this example, the fast food outlets are
themed according to the 2010 Revenue range they fall into, for example all outlets with an annual revenue in 2010 of less
than $379,201.00 are shown as a red triangle .
DEFAULT THEME
The Default Theme is the theme that is first displayed when the Mapping Viewer is first accessed, the default
theme is the last theme you created.
To edit a theme
1.
Select the theme from the theme list then and click the Theme Edit
will open for editing.
button, the Theme Builder wizard
To delete a theme
1.
Select the theme from the theme list then and click the Theme Delete
button.
This completes all the theme options available for point layers.
TO TEST YOUR SETTINGS
To test the Point Layer configuration
1.
From the Main Menu, click the Test button
. A Browser will open displaying your layer configuration.
The Layer will also be listed in the Layer Directory to the right of the screen.
Map Intelligence Client – User Manual
51
SAVING THE LAYER
To save the Point Layer configuration
1.
From the Main Menu, click Save button
to save your settings.
2.
A message box will appear stating your “Configuration saved successfully”, click the OK button.
The Layer will be saved and listed in the Layer Directory to the right of the screen.
The save button will save all changes made to all configuration screens.
EDITING A LAYER
To edit a Point Layer configuration
1.
From the Layer Directory, click on the plus icon next to Point Layers. The Point Layer section will expand.
2.
Click on the Point Layer you want to edit, the layer configuration screen will open for editing.
3.
Save your changes by clicking the click Save button
4.
A message box will appear stating your “Configuration saved successfully”, click the OK button.
on the Main Menu.
The save button will save all changes made to all configuration screens.
COPYING A LAYER
To copy a Point Layer
1.
From the Layer Directory, click on the plus icon next to Point Layers. The Point Layer section will expand.
2.
Click on the Point Layer you want to copy, the layer configuration screen will open.
3.
From the Main Menu, click the Copy button
4.
In the Layer Name field, enter a new name for the layer.
5.
Save your changes by clicking the Save button
Layer Directory.
6.
A message box will appear stating your “Configuration saved successfully”, click the OK button.
. A copy of the layer will appear.
on the top menu. The new layer will appear in the
The save button will save all changes made to all configuration screens.
Map Intelligence Client – User Manual
52
DELETING A LAYER
To delete a Point Layer
1.
From the Layer Directory, click on the plus icon next to Point Layers. The Point Layer section will expand.
2.
Click on the Point Layer you want to delete, the layer configuration screen will open.
3.
From the Main Menu, click the Delete button
.
4.
Save your changes by clicking the Save button
on the Main Menu.
5.
A message box will appear stating your “Configuration saved successfully”, click the OK button.
The save button will save all changes made to all configuration screens.
NOTE ON DATA FORMAT
Map Intelligence, by default, will place commas in numbers greater than 999. You can change the format by
specifying the column format in the universe. This only applies to columns with numeric values.
Map Intelligence Client – User Manual
53
CONFIGURE RELATIONSHIP LAYERS
For a description of Relationship Layers, see Layer Types, Relationship Layers
You will need to create at least one Point Layer before you can create a Relationship Layer.
To open the Relationship Layer configuration screen
1.
Click on the Relationship Layers tab
will appear.
2.
Click the New Layer button
, the Relationship Layer configuration screen
. This clears the fields and allows you to set the properties for a new layer.
Figure 64. Relationship Layer configuration screen.
Map Intelligence Client – User Manual
54
LAYER PROPERTIES SECTION
To configure the Layer Properties section
1.
In the Layer Name field, enter a title for the layer.
Layer names are trimmed (spacing characters at the beginning or end are removed)
and cannot contain double or single quotes. For Map Intelligence Servers 3.1 or below,
only letters, numbers and spaces may be used.
2.
You can specify a range in which the layer will be visible on the map by entering a Minimum Zoom and
Maximum Zoom value. The layer will only be visible if the current map width is within the specified minimum
and maximum values.
3.
Select the Set Layer as Visible in Map checkbox if you wish this particular layer to be visible when you first
access the Mapping Viewer.
4.
Select the Enable Popups checkbox if you wish information popups to be enabled for the layer when you first
access the Mapping Viewer.
Information Popup boxes provide further information about a region when you move your mouse
over the region on the map.
Figure 65. Layer Properties section.
RELATIONSHIP TYPE SECTION
The Relationship Type section allows you to specify the type of relationship to display on the map.
The Radius option displays the relationship between two Point layers as color-coded or hatched circles around
a particular point (see Radius relationship layers on page 9.)
The Region option displays the relationship between a Point layer and a built-in map layer as color-coded or
hatched regions on the map layer (see Region Relationship layers on page 10).
Selecting the Radius option
1.
Select the Radius radio button.
Map Intelligence Client – User Manual
55
2.
From the Reference Point Layer drop-down list, select the point layer that you want to base the relationship
on. Points in this layer become the center point of the shaded circles.
3.
In the Radius Around Point text box, enter the radius of the circle you want to display on the map.
The unit of measurement will be the unit of measurement selected in the Global Settings,
(Preferences) configuration screen.
4.
In the Legend Description field, enter a description to use in the legend for this layer. If this field is left blank a
description will be generated by Map Intelligence.
Figure 66. Legend showing a Map Intelligence generated
description.
5.
Figure 67. Legend showing a customized description.
In the Popup Description field, enter a description to use for Information Popups for this layer. The Popup
Description describes each region of the layer and may contain any of the following parameters:
${label}
${value}
Example
Will be replaced with the label for the region (see Figure 77).
Will be replaced with the value for the region determined by theme (see Creating
Themes for Relationship Layers on page 59).
${value} items in ${label}
If this field is left blank a description will be generated by Map Intelligence.
Map Intelligence Client – User Manual
56
Figure 68. Information popup displaying a Map Intelligence
generated Popup description.
Figure 69. Customized Popup description. In this example the
following description was entered into the Popup Description
text box.
There are ${value} competitors within 3 km of this ${label}
Property
Figure 70. Relationship Type – Radius Option
Selecting the Region option
1.
Select the Region radio button.
2.
From the Map Layer to Color Code drop-down list, select the built-in map layer that you want to shade.
To Refresh the Map Layer to Color Code drop-down list, click the Refresh button
.
Only layers containing regions can be used as reference layers.
Built-in layers are arranged in a particular order on the map. When selecting a built-in layer
to shade, all map layers that sit under the selected layer will be covered by the selected color
or hatch.
Map Intelligence Client – User Manual
57
3.
From the Label Column drop-down list, select the column in the map layer that contains the values to be used
as labels for the regions.
Map Intelligence IGP users: Labels will not be visible if the server setting Show Region Built-in Label
has been set to No. Refer to the Settings section of the Map Intelligence Server Tools and
Administration Guide.
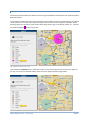
Figure 71. When no Label column has been
selected, no labels appear on the map.
4.
In the Legend Description field, enter a description to use in the legend for this layer. If this field is left blank, a
description will be generated by Map Intelligence.
Figure 73. Legend showing a generated description.
5.
Figure 72. In this example the half degree column label
was selected, now each half degree grid square on the
map displays its code number label.
Figure 74. Legend showing a customized description.
In the Popup Description field, enter a description to use for Information Popups for this layer. The Popup
Description describes each region of the layer and may contain any of the following parameters:
${label}
${value}
Example
Will be replaced with the label for the region (see Figure 77).
Will be replaced with the value for the region determined by the theme (see Creating
Themes for Relationship Layers on page 59) .
${value} items in ${label}
If this field is left blank a description will be generated by Map Intelligence.
Map Intelligence Client – User Manual
58
Figure 75. Information popup displaying a Map Intelligence
generated Popup description
Figure 76. Customized Popup description. In this example
the following description was entered into the Popup
Description text box.
Total Fast Food sales in ${label} is ${value}
Figure 77. Relationship Type – Region Option
CREATING THEMES FOR RELATIONSHIP LAYERS
Creating themes for Relationship Layers requires you to specify threshold conditions based on a Numeric or String
aggregation using the Theme Builder wizard on the Relationship Layer configuration screens.
Hatches for Radius Relationship layers are not available for the current version of Map Intelligence
IMS.
NUMERIC AGGREGATION
Map Intelligence allows you to perform a function on values from a specified column. The specified built-in map
layer or a circle around a point will then be shaded according to the resulting values. The numeric functions
available include: Count, Sum, Min, Max, Mean and Median.
Note that only one color and one hatch layer can be displayed simultaneously for a particular built-inlayer. If you have multiple layers that use the same built-in layer, you can switch between these using
the Theme Select option from the Mapping Viewer (refer to the Map Intelligence Mapping Viewer
User Manual.
Map Intelligence Client – User Manual
59
Creating a themes based on a Numeric Aggregation
1.
Click the Theme button
, the Theme Builder wizard will open, displaying the Theme Type tab.
2.
From the Point Layer drop down list, select the Point Layer containing the points that you want to
geographically relate to the reference layer.
3.
From the Column drop down list, select the Column to use to color the regions. The data for this column will be
extracted from the points and aggregated according to the geographical group of the points.
4.
Select the Numeric radio button.
Figure 78. Theme Builder Wizard: Theme Type Tab (Numeric).
5.
Click the Data tab or the Next button, the wizard will move to the Data tab.
6.
From the Aggregation Function drop-down list, select the function to use for the layer. The numeric functions
available include: Count, Sum, Min, Max, Mean and Median.
7.
For the Calculation option, click either the by Value or by Percentage radio button.
The aggregates can be used as the raw aggregate value or as a percentage of the total aggregate over the Point
Layer.
Map Intelligence Client – User Manual
60
Figure 79. Theme Builder Wizard: Data Tab (Numeric).
8.
Click the Method tab or the Next button, the wizard will move to the Method tab.
There are two methods for applying themes:
Automatic
Manual
Map Intelligence Client – User Manual
61
AUTOMATIC METHOD
1.
For Theme Method, click the Automatic radio button.
Figure 80. Theme Builder Wizard: Method Tab (Numeric- Automatic).
2.
Click the Features tab or the Next button, the wizard will move to the Features tab.
3.
From the Scheme drop-down list, select a classification scheme.
You can use a standard classification scheme to group similar values to look for patterns in the data. You can
choose from three schemes for grouping data values into classes based on how the data values are distributed.
Equal Interval: The difference between the high and low values is the same for every class. So, the
classification of the data will be based on a set of equal splits. For example, if the lowest value is 0 and the
highest value is 10 in the data, and 5 classes are requested, the range of each class will be 0 to 2, 2 to 4, 4
to 6, 6 to 8, 8 to 10.
Quantile: Each class contains an equal number of features. In this case, the points are sorted in ascending
order (for the chosen data field) and each class is filled with (total number of points)/(number of classes)
points starting from the lowest value to the highest.
Standard Deviation: Features are placed in classes based on how much their values vary from the mean.
First the mean and standard deviation of the data values are calculated. The class breaks are found by
successively adding or subtracting multiples of the standard deviation from the mean.
4.
From the Class Count drop-down list, select the number of colors to appear in your shading range.
5.
If Equal Interval was selected for Scheme, for Scale, click either the Linear or Logarithmic radio button.
6.
If Standard Deviation was selected for Scheme, for Multiplier enter the multiplying factor.
There are three options for selecting the Fill Option:
Map Intelligence Client – User Manual
62
Specific Colors: Allows you to specify a particular color for each class.
Color Range: Allows you to choose a start and end color.
Hatches: Allows you to specify a particular hatch for each class.
SELECTING SPECIFIC COLORS
1.
Click the Specific Colors radio button.
Figure 81. Theme Builder Wizard: Features Tab (Numeric- Automatic – Specific Colors).
Features Rendering Attributes
2.
In the Fill Opacity field, enter a number from 0 to 1 that indicates the opacity of the colored regions in the
layer.
3.
In the Border Opacity field, enter a number from 0 to 1 that indicates the opacity of region borders in the
layer.
4.
In the Border Thickness field, enter the thickness in points or pixels (depending on the GIS provider) of the
region borders in the layer.
5.
In the Border Color field, enter a hexadecimal color value or select a color from the color picker for the region
border color. The default color is black (#000000).
Examples of using various Feature Attributes can be seen in Appendix B: Features Rendering
Attributes on page 136.
6.
Click the Configure tab or the Next button, the wizard will move to the Configure tab.
7.
Click the Class 1 colored rectangle.
8.
Select a color from the color picker.
Map Intelligence Client – User Manual
63
9.
Repeat Steps the above steps for each class listed.
10. Click the Empty Color colored rectangle.
11. Select a color for any region that does not contain any values.
The colored rectangles will change to the new color after each selection.
If the color picker does not have the exact color you wish to use, you can right click on the colored
rectangle and manually enter the hexadecimal color value.
Figure 82. Theme Builder Wizard: Configure Tab (Numeric- Automatic – Specific Colors).
12. Click the Save & Close button
. The Theme Builder Wizard will close. The theme will now be
displayed in the Color Theme section of the Relationship Layer configuration screen.
Map Intelligence Client – User Manual
64
Figure 83. Themes Section showing Specific Color Theme.
Figure 84. Region Relationship Layer Map View and Legend showing Specific Color Theme.
Map Intelligence Client – User Manual
65
Figure 85. Radius Relationship Layer Map View and Legend showing Specific Color Theme.
SELECTING COLOR RANGE
1.
Click the Color Range radio button.
Figure 86. Theme Builder Wizard: Features Tab (Numeric- Automatic – Color Range).
Features Rendering Attributes
2.
In the Fill Opacity field, enter a number from 0 to 1 that indicates the opacity of the colored regions in the
layer.
Map Intelligence Client – User Manual
66
3.
In the Border Opacity field, enter a number from 0 to 1 that indicates the opacity of region borders in the
layer.
4.
In the Border Thickness field, enter the thickness in points or pixels (depending on the GIS provider) of the
region borders in the layer.
5.
In the Border Color field, enter a hexadecimal color value or select a color from the color picker for the region
border color. The default color is black (#000000).
Examples of using various Feature Attributes can be seen in Appendix B: Features Rendering
Attributes on page 136.
6.
Click the Configure tab or the Next button, the wizard will move to the Configure tab.
7.
Click the Start Color colored rectangle.
8.
Select the start color from the color picker and click OK.
9.
Click the End Color colored rectangle.
10. Select the end color from the color window and click OK.
11. Click the Empty Color colored rectangle.
12. Select a color for any region that does not contain any values and click OK.
The colored rectangles will change to the new color chosen after each selection.
If the color picker does not have the exact color you wish to use, you can right click on the colored
rectangle and manually enter the hexadecimal color value.
Map Intelligence Client – User Manual
67
Figure 87. Theme Builder Wizard: Configure Tab (Numeric- Automatic – Color Range).
13. Click the Save & Close button
. The Theme Builder Wizard will close. The theme will now be
displayed in the Theme Section of the Relationship Layer configuration screen.
Figure 88. Themes Section showing Ranged Color Theme.
Figure 89. Region Relationship Layer Map View and Legend showing Ranged Color Theme (Yellow to Red).
Map Intelligence Client – User Manual
68
Figure 90. Radius Relationship Layer – Example Map View and Legend showing Color Range – Custom Colors (Yellow to
Red).
Map Intelligence Client – User Manual
69
SELECTING HATCHES
1.
Click the Hatches radio button.
Figure 91. Theme Builder Wizard: Features Tab (Numeric- Automatic – Hatches).
Features Rendering Attributes
2.
In the Hatch Opacity field, enter a number from 0 to 1 that indicates the opacity of the hatches.
3.
In the Border Opacity field, enter a number from 0 to 1 that indicates the opacity of region borders in the
layer.
4.
In the Border Thickness field, enter the thickness in points or pixels (depending on the GIS provider) of the
region borders in the layer.
5.
In the Border Color field, enter the hexadecimal color value or select a color from the color picker for the
region border color. The default color is black (#000000).
6.
In the Hatch Color field, enter a hexadecimal color value or select a color from the color picker for the hatch
color. The default color is black (#000000).
Examples of using various Feature Attributes can be seen in Appendix B: Features Rendering
Attributes on page 136.
7.
Click the Configure tab or the Next button, the wizard will move to the Configure tab.
8.
Click the Class 1 hatched rectangle.
9.
Select a hatch from the picker.
10. Repeat steps the above steps for each class listed.
Map Intelligence Client – User Manual
70
11. Click the Empty Hatch hatched rectangle.
12. Select a hatch for any region that does not contain any values and click OK.
The hatched rectangles will change to the new hatch after each selection.
Figure 92. Theme Builder Wizard: Configure Tab (Numeric- Automatic – Hatches).
13. Click the Save & Close button
. The Theme Builder Wizard will close. The theme will now be
displayed in the Hatch Theme Section of the Relationship Layer configuration screen.
Figure 93. Themes Section showing Hatched Theme.
Map Intelligence Client – User Manual
71
Figure 94. Region Relationship Layer Map View and Legend showing Hatched theme (Red).
Figure 95. Radius Relationship Layer – Example Map View and Legend showing Hatched theme (Red).
MANUAL METHOD
1.
From the Method tab, select the Manual radio button.
Map Intelligence Client – User Manual
72
Figure 96. Theme Builder Wizard: Method Tab (Numeric-Manual).
2.
Click the Features tab or the Next button, the wizard will move to the Features tab.
There are two options for selecting the Fill Option:
Colors: Allows you to specify a particular color.
Hatches. Allows you to specify a particular hatch.
SELECTING COLORS
1.
Click the Colors radio button.
Map Intelligence Client – User Manual
73
Figure 97. Theme Builder Wizard: Features Tab (Numeric-Manual-Colors).
Features Rendering Attributes
2.
In the Fill Opacity field, enter a number from 0 to 1 that indicates the opacity of the colored regions in the
layer.
3.
In the Border Opacity field, enter a number from 0 to 1 that indicates the opacity of region borders in the
layer.
4.
In the Border Thickness field, enter the thickness in points or pixels (depending on the GIS provider) of the
region borders in the layer.
5.
In the Border Color field, enter a hexadecimal color value or select a color from the color picker for the region
border color. The default color is black (#000000).
Examples of using various Feature Attributes can be seen in Appendix B: Features Rendering
Attributes on page 136.
6.
Click the Configure tab or the Next button, the wizard will move to the Configure tab.
7.
Enter a threshold value in the top text box.
8.
Click the rectangle next to the text box.
9.
Select a color from the color picker that you want to associate with the threshold value.
The selected threshold value and associated color will appear in the preview window list.
10. Configure all other threshold conditions that you wish to associate with a color.
Map Intelligence Client – User Manual
74
11. Click the Values Outside Threshold rectangle, then select a color from the color picker to represent any other
values that have not been assigned a specific color.
12. Click the Empty Values rectangle, then select a color from the color picker to represent any region or circle
that does not contain any values.
13. To delete values assigned to a specific color, in the Preview window list, click the check box next to the value
and click Remove Selected.
Figure 98. Theme Builder Wizard: Configure Tab (Numeric-Manual-Colors).
14. Click the Save & Close button
. The Theme Builder Wizard will close. The theme will now be
displayed in the Theme Section of the Relationship or configuration screen.
Map Intelligence Client – User Manual
75
Figure 99. Color Themes Section (Numeric-Manual-Colors).
Figure 100. Region Relationship Layer Map View and Legend showing Manual Color Theme.
Figure 101. Radius Relationship Layer Map View and Legend showing Manual Color Theme.
SELECTING HATCHES
1.
Click the Hatches radio button.
Map Intelligence Client – User Manual
76
Figure 102. Theme Builder Wizard: Features Tab (Numeric-Manual-Hatches).
Features Rendering Attributes
2.
In the Hatch Opacity field, enter a number from 0 to 1 that indicates the opacity of the hatches.
3.
In the Border Opacity field, enter a number from 0 to 1 that indicates the opacity of region borders in the
layer.
4.
In the Border Thickness field, enter the thickness in points or pixels (depending on the GIS provider) of the
region borders in the layer.
5.
In the Border Color field, enter the hexadecimal color value or select a color from the color picker for the
region border color. The default color is black (#000000).
6.
In the Hatch Color field, enter a hexadecimal color value or select a color from the color picker for the hatch
color. The default color is black (#000000).
Examples of using various Feature Attributes can be seen in Appendix B: Features Rendering
Attributes on page 136.
7.
Click the Configure tab or the Next button, the wizard will move to the Configure tab.
8.
Enter a threshold value in the top text box.
9.
Click the rectangle next to the text box.
10. Select a hatch from the picker that you want to associate with the threshold value.
The selected threshold value and associated hatch will appear in the preview window list.
11. Configure all other threshold conditions that you wish to associate with a hatch.
Map Intelligence Client – User Manual
77
12. Click the Values Outside Threshold rectangle, then select a hatch from the picker to represent any other
values that have not been assigned a specific hatch.
13. Click the Empty Values rectangle, then select a hatch from the picker to represent any region or circle that
does not contain any values.
14. To delete values assigned to a specific color, in the Preview window lit, click the check box next to the value
and click Remove Selected.
Figure 103. Theme Builder Wizard: Configure Tab (Numeric-Manual-Hatches).
15. Click the Save & Close button
. The Theme Builder Wizard will close. The theme will now be
displayed in the Theme Section of the Relationship Layer configuration screen.
Map Intelligence Client – User Manual
78
Figure 104. Hatch Theme Section (Numeric-Manual-Hatch).
Figure 105. Region Relationship Layer Map View and Legend showing manual Hatch.
Figure 106. Radius Relationship Layer Map View and Legend showing Manual Hatch Theme.
UNSHADED AND TRANSPARENT COLORS
For further information on using the Transparent and Unshaded color options see Appendix C: Using the Unshaded
and Transparent Color Options on page 140.
Map Intelligence Client – User Manual
79
STRING AGGREGATION
Map Intelligence allows you to perform a function on string values from a specified fact column. String aggregations
require you to specify a color/hatch condition for a specific value instead of a threshold. The string functions
available include:
Most Common – this function applies the condition if the nominated value is the most common value in the
region.
Uniform – this function applies the condition if the nominated value is the only value from the specified
column in the region.
Majority – this function applies the condition if the nominated value makes up more than half of the values in
the region.
Creating a themes based on a String Aggregation
1.
Click the Theme button
, the Theme Builder wizard will open, displaying the Theme Type tab.
2.
From the Point Layer drop down list, select the Point Layer containing the points that you want to
geographically relate to the reference layer.
When related to a built-in region layer the points will be grouped according the which regions they
are contained in. When related to another Point Layer, the points will be grouped according to
which points in the reference layer they fall within the given radius of.
3.
From the Column drop down list, select the Column to use to color the regions. The data for this column will be
extracted from the points and aggregated according to the geographical group of the points.
4.
Select the String radio button.
Figure 107. Theme Builder Wizard: Theme Type Tab (String).
Map Intelligence Client – User Manual
80
5.
Click the Data tab or the Next button, the wizard will move to the Data tab.
6.
From the Aggregation Function drop-down list, select the function to use for the layer. The string functions
available are: Most Common, Uniform and Majority.
Figure 108. Theme Builder Wizard: Data Tab (String) with ‘Most Common’ selected.
7.
Click the Features tab or the Next button, the wizard will move to the Features tab.
There are two options for selecting the Fill Option:
Colors: Allows you to specify a particular color.
Hatches: Allows you to specify a particular hatch.
SELECTING COLORS
1.
Click the Colors radio button.
Map Intelligence Client – User Manual
81
Figure 109. Theme Builder Wizard: Features Tab (String – Colors).
Features Rendering Attributes
2.
In the Fill Opacity field, enter a number from 0 to 1 that indicates the opacity of the colored regions in the
layer.
3.
In the Border Opacity field, enter a number from 0 to 1 that indicates the opacity of region borders in the
layer.
4.
In the Border Thickness field, enter the thickness in points or pixels (depending on the GIS provider) of the
region borders in the layer.
5.
In the Border Color field, enter a hexadecimal color value or select a color from the color picker for the region
border color. The default color is black (#000000).
Examples of using various Feature Attributes can be seen in Appendix B: Features Rendering
Attributes on page 136.
6.
Click the Configure tab or the Next button, the wizard will move to the Configure tab.
You can shade a region by applying a color to a built-in map layer or circle around a point.
7.
The top drop-down list will display all available values from the specified fact column. Select a value from the
drop-down list .
In some instances only a sub-set of values will be displayed in the value list box. Click the refresh
button
8.
to display all values. Be aware that large datasets may take sometime to process.
Click the rectangle next to the top drop-down list.
Map Intelligence Client – User Manual
82
9.
Select a color from the color picker that you want to associate with the selected value.
The selected value and associated color will appear in the preview window list.
If the color picker does not have the exact color you wish to use, you can right click on the colored
rectangle and manually enter the hexadecimal color value.
10. Configure any other values that you wish to associate with a color.
Any values not assigned a specific color will be colored according to the color assigned to Other
Values (see below).
11. Click the Empty Values rectangle and select a color from the color picker to represent any region or circle that
does not contain any values.
12. Click the Conflict Values rectangle and select a color from the color picker to represent any region or circle that
does not meet any specified condition. E.g. A Conflict condition will be returned if the ‘Uniform’ function has
been set and there is more than one type of value present in the region.
13. Click the Other Values rectangle and select a color from the color picker to represent any values that have not
been assigned with a specific color.
Figure 110. Theme Builder Wizard: Configure Tab (String – Colors).
14. To delete values assigned to a specific color, in the Preview window list, click the check box next to the value
and click Remove Selected.
15. Click the Save & Close button
. The Theme Builder Wizard will close. The theme will now be
displayed in the Theme Section of the Relationship Layer configuration screen.
Map Intelligence Client – User Manual
83
Figure 111. Color Theme (String – Colors).
Figure 112. Region Relationship Layer Map View and Legend showing Color Theme (String – Colors).
Map Intelligence Client – User Manual
84
Figure 113. Radius Relationship Layer Map View and Legend showing Color Theme (String – Colors).
SELECTING HATCHES
1.
Click the Hatches radio button.
Figure 114. Theme Builder Wizard: Features Tab (String – Hatches).
Features Rendering Attributes
1.
In the Hatch Opacity field, enter a number from 0 to 1 that indicates the opacity of the hatches.
Map Intelligence Client – User Manual
85
2.
In the Border Opacity field, enter a number from 0 to 1 that indicates the opacity of region borders in the
layer.
3.
In the Border Thickness field, enter the thickness in points or pixels (depending on the GIS provider) of the
region borders in the layer.
4.
In the Border Color field, enter the hexadecimal color value or select a color from the color picker for the
region border color. The default color is black (#000000).
5.
In the Hatch Color field, enter a hexadecimal color value or select a color from the color picker for the hatch
color. The default color is black (#000000).
Examples of using various Feature Attributes can be seen in Appendix B: Features Rendering
Attributes on page 136.
6.
Click the Configure tab or the Next button, the wizard will move to the Configure tab.
You can shade a region by applying a hatch to a built-in map layer or circle around a point.
7.
The top drop-down list will display all available values from the specified fact column. Select a value from the
drop-down list.
In some instances only a sub-set of values will be displayed in the value list box. Click the refresh
button
to display all values. Be aware that large datasets may take sometime to process.
8.
Click the rectangle next to the top drop-down list.
9.
Select a hatch from the picker that you want to associate with the selected value.
The selected value and associated hatch will appear in the preview window list.
10. Configure any other values that you wish to associate with a hatch.
Any values not assigned a specific hatch will be hatched according to the hatch assigned to Other
Values (see below).
11. Click the Empty Values rectangle and select a hatch from the picker to represent any region or circle that does
not contain any values.
12. Click the Conflict Values rectangle and select a hatch from the picker to represent any region or circle that
does not meet any specified condition. E.g. A Conflict condition will be returned if the ‘Uniform’ function has
been set and there is more than one type of value present in the region.
13. Click the Other Values rectangle and select a hatch from the picker to represent any values that have not been
assigned with a specific hatch.
Map Intelligence Client – User Manual
86
Figure 115. Theme Builder Wizard: Configure Tab (String – Hatch).
14. To delete values assigned to a specific hatch, in the Preview window list, click the check box next to the value
and click Remove Selected.
15. Click the Save & Close button
. The Theme Builder Wizard will close. The theme will now be
displayed in the Theme Section of the Relationship configuration screen.
Figure 116. Hatch Theme (String – Hatches).
Map Intelligence Client – User Manual
87
Figure 117. Region Relationship Layer Map View and Legend showing Hatch Theme (String – Hatch).
Figure 118. Radius Relationship Layer Map View and Legend showing Hatch Theme (String – Hatch).
UNSHADED AND TRANSPARENT COLORS
For further information on using the Transparent and Unshaded color options see Appendix C: Using the Unshaded
and Transparent Color Options on page 140.
Map Intelligence Client – User Manual
88
TO TEST YOUR SETTINGS
To test the Relationship Layer configuration
1.
From the Main Menu, click the Test button
. A Browser will open displaying your layer configuration.
The Layer will also be listed in the Layer Directory to the right of the screen.
SAVING THE LAYER
To save the Relationship Layer configuration
1.
From the Main Menu, click Save button
to save your settings.
2.
A message box will appear stating your “Configuration saved successfully”, click the OK button.
The Layer will be saved and listed in the Layer Directory to the right of the screen.
The save button will save all changes made to all configuration screens.
EDITING A LAYER
To edit a Relationship Layer configuration
1.
From the Layer Directory, click on the plus icon next to Relationship Layers. The Relationship Layer section will
expand.
2.
Click on the Relationship Layer you want to edit, the layer configuration screen will open for editing.
3.
Save your changes by clicking the click Save button
4.
A message box will appear stating your “Configuration saved successfully”, click the OK button.
on the Main Menu.
The save button will save all changes made to all configuration screens.
COPYING A LAYER
To copy a Relationship Layer
1.
From the Layer Directory, click on the plus icon next to Relationship Layers. The Point Layer section will
expand.
2.
Click on the layer you want to copy, the layer configuration screen will open.
3.
From the Main Menu, click the Copy button
4.
In the Layer Name field, enter a new name for the layer.
Map Intelligence Client – User Manual
. A copy of the layer will appear.
89
5.
Save your changes by clicking the Save button
on the top menu.
6.
A message box will appear stating your “Configuration saved successfully”, click the OK button.
The new layer will appear in the Layer Directory.
The save button will save all changes made to all configuration screens.
DELETING A LAYER
To delete a Relationship Layer
1.
From the Layer Directory, click on the plus icon next to Relationship Layers. The Relationship Layer section will
expand.
2.
Click on the Relationship Layer you want to delete, the layer configuration screen will open.
3.
From the Main Menu, click the Delete button
.
4.
Save your changes by clicking the Save button
on the Main menu.
5.
A message box will appear stating your “Configuration saved successfully”, click the OK button.
The save button will save all changes made to all configuration screens.
NOTE ON DATA FORMAT
Map Intelligence, by default, will place commas in numbers greater than 999. You can change the format by
specifying the column format in the universe. This only applies to columns with numeric values.
Map Intelligence Client – User Manual
90
CONFIGURE AREA GROUP LAYERS
For a description of Area Group Layers, see Layer Types - Area Group Layer on page 10.
To open the Area Group Layer configuration screen
1.
Click on the Area Group Layers tab
appear.
2.
Click the New Layer button
, the Area Group Layer configuration screen will
. This clears the fields and allows you to set the properties for a new layer.
Figure 119. Area Group Layer configuration screen.
LAYER PROPERTIES SECTION
To configure the Layer Properties section
1.
In the Layer Name field, enter a title for the layer.
Layer names are trimmed (spacing characters at the beginning or end are removed) and
cannot contain double or single quotes. For Map Intelligence Servers 3.1 or below,
only letters, numbers and spaces may be used.
Map Intelligence Client – User Manual
91
2.
You can specify a range in which the layer will be visible on the map by entering a Minimum Zoom and
Maximum Zoom value. The layer will only be visible if the current map width is within the specified minimum
and maximum value.
3.
Select the Set Layer as Visible in Map checkbox if you wish this particular layer to be visible when you first
access the Mapping Viewer.
4.
Select the Enable Popups checkbox if you wish information popups to be enabled for the layer when you first
access the Mapping Viewer.
Information Popup boxes provide further information about a region when you move your mouse
over the region on the map (Display Information Section below).
Figure 120. Layer Properties section.
DATA SOURCE SECTION
To configure the Data Source section
The Data Source section allows you to configure the necessary map and data source settings for the layer.
Figure 121. Data Source section.
Map Intelligence Client – User Manual
92
1.
From the Name drop-down list, select the data source to be used for this layer.
Name is the concatenated Analysis' location and name.
MAP
The Map part of the Data Source section allows you to configure the necessary map settings for the layer.
1.
From the Map Layer to Color Code drop-down list, select the built-in map layer that you want to shade or
apply a color to.
2.
To Refresh the Map Layer to Color Code drop-down list, click the Refresh button
.
Only layers containing regions can be used as reference layers.
Built-in layers are arranged in a particular order on the map. When selecting a built-in layer to
shade, all map layers that sit under the selected layer will be covered by the selected color or
hatch.
From the Label Column drop-down list, select the column in the map layer that contains the values to be used
as labels for the regions.
Map Intelligence IGP users: Labels will not be visible if the server setting Show Region Built-in
Label has been set to No. Refer to the Settings section of the Map Intelligence Server Tools and
Administration Guide.
Figure 122. When no Label column has been selected, no
labels appear on the map.
3.
Figure 123. In this example the half degree column label
was selected, now each half degree grid square on the
map displays its code number label.
In the Legend Description field, enter a description to use in the legend for this layer. If this field is left blank, a
description will be generated by Map Intelligence.
Map Intelligence Client – User Manual
93
Figure 124. Legend showing a Map Intelligence
generated description.
4.
Figure 125. Legend showing a customized description
In the Popup Description field, enter a description to use for Information Popups for this layer. The Popup
Description describes each region of the layer and may contain any of the following parameters:
${label}
${value}
${ColumnName}
Example
Will be replaced with the label for the region.
${value} will be replaced with the value for the region determined by the theme (see
Creating Themes for Area Group Layers on page 96).
Replace ColumnName with the name of a column selected in Display Information (see
Display Information Section of the Area Group Layer configuration screen). The value of
this column will be displayed in the popup description for the region.
${value} items in ${label}
If this field is left blank a description will be generated by Map Intelligence.
Figure 126. Information popup displaying a Map Intelligence
generated Popup description
Figure 127. Customized Popup description. In this example the
following description was entered into the Popup Description
text box.
Average Annual Salary in ${label} is {value}.
DATA COLUMN COMMON TO MAP AND DATA SOURCE
Area Group layers require a join between a column in your data source and a column in the built-in map layer that
you want to shade. You need matching values from these two columns for the Area Group layer to work.
Map Intelligence Client – User Manual
94
1.
From the Data Source Join Column drop-down list, select the column from your data source that contains
values that will match the ones specified in the Map Layer Join Column (below).
2.
From the Map Layer Join Column drop-down list, select a column from the built in map layer that contains
values that match the ones specified in the Data Source Join Column (above).
DISPLAY INFORMATION SECTION
The Display Information section shows a list of data columns, these columns can be specified as display columns to
be included as additional information in the Information pop-up box. Each column has an associated aggregation
function.
Figure 128. Display Information Section
To configure the Display Information section
1.
Select a data column from the list. On selection a drop-down list appears displaying a list of aggregation
functions.
2.
Select an aggregation function. The selected data column will appear in the box on the right.
3.
Repeat steps 1 and 2 to add further data columns.
Map Intelligence Client – User Manual
95
To deselect a data column, click the
selected data column name.
next to the
The example shown in Figure 129, shows the
result of adding the two additional data columns,
showing Total Population for the LGA and the
number of people in the LGA for a target age
range (15 to 19 year olds).
Figure 129. Example of Information Popup box with additional
data column information.
CREATING THEMES FOR AREA GROUP LAYERS
Creating themes for Area Group Layers require you to specify threshold conditions based on a Numeric or String
aggregation using the Theme Builder wizard on the Area Group Layer configuration screen.
Note that only one color and one hatch layer can be displayed simultaneously for a particular built-inlayer. If you have multiple layers that use the same built-in layer, you can switch between these using
the Theme Select option from the Mapping Viewer (refer to the Map Intelligence Mapping Viewer
User Manual.
NUMERIC AGGREGATION LAYERS
Map Intelligence allows you to perform a function on values from a specified column. The specified built-in map
layer will then be shaded according to the resulting values. The numeric functions available include: Count, Sum,
Min, Max, Mean and Median.
Creating a themes based on a Numeric Aggregation
1.
Click the Theme button
2.
From the Fact Column drop-down list, select the column that contains the values to be measured for this layer.
3.
Select the Numeric radio button.
Map Intelligence Client – User Manual
, the Theme Builder wizard will open, displaying the Theme Type tab.
96
Figure 130. Theme Builder Wizard: Theme Type Tab (Numeric).
4.
Click the Data tab or the Next button, the wizard will move to the Data tab.
5.
From the Aggregation Function drop-down list, select the function to use for the layer. The numeric functions
available include: Count, Sum, Min, Max, Mean and Median.
6.
For the Calculation option, ick either the by Value or by Percentage radio button.
Figure 131. Theme Builder Wizard: Data Tab (Numeric).
Map Intelligence Client – User Manual
97
7.
Click the Method tab or the Next button, the wizard will move to the Method tab.
There are two methods for applying themes:
Automatic
Manual
Map Intelligence Client – User Manual
98
AUTOMATIC METHOD
1.
For Theme Method, click the Automatic radio button.
Figure 132. Theme Builder Wizard: Method Tab (Numeric- Automatic).
2.
Click the Features tab or the Next button, the wizard will move to the Features tab.
3.
From the Scheme drop-down list, select a classification scheme.
You can use a standard classification scheme to group similar values to look for patterns in the data. You can
choose from three schemes for grouping data values into classes based on how the data values are distributed.
Equal Interval: The difference between the high and low values is the same for every class. So, the
classification of the data will be based on a set of equal splits. For example, if the lowest value is 0 and the
highest value is 10 in the data, and 5 classes are requested, the range of each class will be 0 to 2, 2 to 4, 4
to 6, 6 to 8, 8 to 10.
Quantile: Each class contains an equal number of features. In this case, the points are sorted in ascending
order (for the chosen data field) and each class is filled with (total number of points)/(number of classes)
points starting from the lowest value to the highest.
Standard Deviation: Features are placed in classes based on how much their values vary from the mean.
First the mean and standard deviation of the data values are calculated. The class breaks are found by
successively adding or subtracting multiples of the standard deviation from the mean.
4.
From the Class Count drop-down list, select the number of colors to appear in your shading range.
5.
If Equal Interval was selected for Scheme, for Scale, click either the Linear or Logarithmic radio button.
6.
If Standard Deviation was selected for Scheme, for Multiplier enter the multiplying factor.
There are three options for selecting the Fill Option:
Map Intelligence Client – User Manual
99
Specific Colors: Allows you to specify a particular color for each class.
Color Range: Allows you to choose a start and end color.
Hatches. Allows you to specify a particular hatch for each class.
SELECTING SPECIFIC COLORS
1.
Click the Specific Colors radio button.
Figure 133. Theme Builder Wizard: Features Tab (Numeric- Automatic – Specific Colors).
Features Rendering Attributes
2.
In the Fill Opacity field, enter a number from 0 to 1 that indicates the opacity of the colored regions in the
layer.
3.
In the Border Opacity field, enter a number from 0 to 1 that indicates the opacity of region borders in the
layer.
4.
In the Border Thickness field, enter the thickness in points or pixels (depending on the GIS provider) of the
region borders in the layer.
5.
In the Border Color field, enter a hexadecimal color value or select a color from the color picker for the region
border color. The default color is black (#000000).
Examples of using various Feature Attributes can be seen in Appendix B: Features Rendering
Attributes on page 136.
6.
Click the Configure tab or the Next button, the wizard will move to the Configure tab.
7.
Click the Class 1 colored rectangle.
Map Intelligence Client – User Manual
100
8.
Select a color from the color picker.
9.
Repeat Steps the above steps for each class listed.
10. Click the Empty Color colored rectangle.
11. Select a color for any region that does not contain any values.
The colored rectangles will change to the new color after each selection.
If the color picker does not have the exact color you wish to use, you can right click on the colored
rectangle and manually enter the hexadecimal color value.
Figure 134. Theme Builder Wizard: Configure Tab (Numeric- Automatic – Specific Colors).
12. Click the Save & Close button
. The Theme Builder Wizard will close. The theme will now be
displayed in the Color Theme section of the Area Group Layer configuration screen.
Map Intelligence Client – User Manual
101
Figure 135. Themes Section showing Specific Color Theme.
Figure 136. Area Group Layer Map View and Legend showing Specific Color Theme.
Map Intelligence Client – User Manual
102
SELECTING COLOR RANGE
1.
Click the Color Range radio button.
Figure 137. Theme Builder Wizard: Features Tab (Numeric- Automatic – Color Range).
Features Rendering Attributes
2.
In the Fill Opacity field, enter a number from 0 to 1 that indicates the opacity of the colored regions in the
layer.
3.
In the Border Opacity field, enter a number from 0 to 1 that indicates the opacity of region borders in the
layer.
4.
In the Border Thickness field, enter the thickness in points or pixels (depending on the GIS provider) of the
region borders in the layer.
5.
In the Border Color field, enter a hexadecimal color value or select a color from the color picker for the region
border color. The default color is black (#000000).
Examples of using various Feature Attributes can be seen in Appendix B: Features Rendering
Attributes on page 136.
6.
Click the Configure tab or the Next button, the wizard will move to the Configure tab.
7.
Click the Start Color colored rectangle.
8.
Select the start color from the color picker and click OK.
9.
Click the End Color colored rectangle.
Map Intelligence Client – User Manual
103
10. Select the end color from the color window and click OK.
11. Click the Empty Color colored rectangle.
12. Select a color for any region that does not contain any values and click OK.
The colored rectangles will change to the new color chosen after each selection.
If the color picker does not have the exact color you wish to use, you can right click on the colored
rectangle and manually enter the hexadecimal color value.
Figure 138. Theme Builder Wizard: Configure Tab (Numeric- Automatic – Color Range).
13. Click the Save & Close button
. The Theme Builder Wizard will close. The theme will now be
displayed in the Theme Section of the Area Group Layer configuration screen.
Map Intelligence Client – User Manual
104
Figure 139. Themes Section showing Ranged Color Theme.
Figure 140. Area Group Layer Map View and Legend showing Ranged Color Theme.
Map Intelligence Client – User Manual
105
SELECTING HATCHES
1.
Click the Hatches radio button.
Figure 141. Theme Builder Wizard: Features Tab (Numeric- Automatic – Hatches).
Features Rendering Attributes
2.
In the Hatch Opacity field, enter a number from 0 to 1 that indicates the opacity of the hatches.
3.
In the Border Opacity field, enter a number from 0 to 1 that indicates the opacity of region borders in the
layer.
4.
In the Border Thickness field, enter the thickness in points or pixels (depending on the GIS provider) of the
region borders in the layer.
5.
In the Border Color field, enter the hexadecimal color value or select a color from the color picker for the
region border color. The default color is black (#000000).
6.
In the Hatch Color field, enter a hexadecimal color value or select a color from the color picker for the hatch
color. The default color is black (#000000).
Examples of using various Feature Attributes can be seen in Appendix B: Features Rendering
Attributes on page 136.
7.
Click the Configure tab or the Next button, the wizard will move to the Configure tab.
8.
Click the Class 1 hatched rectangle.
9.
Select a hatch from the picker.
10. Repeat Steps the above steps for each class listed.
Map Intelligence Client – User Manual
106
11. Click the Empty Hatch hatched rectangle.
12. Select a hatch for any region that does not contain any values.
The hatched rectangles will change to the new hatch after each selection.
Figure 142. Theme Builder Wizard: Configure Tab (Numeric- Automatic – Hatches).
13. Click the Save & Close button
. The Theme Builder Wizard will close. The theme will now be
displayed in the Hatch Theme Section of the Area Group Layer configuration screen.
Figure 143. Themes Section showing Hatched Theme.
Map Intelligence Client – User Manual
107
Figure 144. Area Group Layer Map View and Legend showing Hatched Theme.
MANUAL METHOD
1.
From the Method tab, select the Manual radio button.
Figure 145. Theme Builder Wizard: Method Tab (Numeric-Manual).
2.
Click the Features tab or the Next button, the wizard will move to the Features tab.
There are two options for selecting the Fill Option:
Colors: Allows you to specify a particular color.
Hatches. Allows you to specify a particular hatch.
Map Intelligence Client – User Manual
108
SELECTING COLORS
1.
Click the Colors radio button.
Figure 146. Theme Builder Wizard: Features Tab (Numeric-Manual-Colors).
Features Rendering Attributes
2.
In the Fill Opacity field, enter a number from 0 to 1 that indicates the opacity of the colored regions in the
layer.
3.
In the Border Opacity field, enter a number from 0 to 1 that indicates the opacity of region borders in the
layer.
4.
In the Border Thickness field, enter the thickness in points or pixels (depending on the GIS provider) of the
region borders in the layer.
5.
In the Border Color field, enter a hexadecimal color value or select a color from the color picker for the region
border color. The default color is black (#000000).
Examples of using various Feature Attributes can be seen in Appendix B: Features Rendering
Attributes on page 136.
6.
Click the Configure tab or the Next button, the wizard will move to the Configure tab.
7.
Enter a threshold value in the top text box.
8.
Click the rectangle next to the text box.
9.
Select a color from the color picker that you want to associate with the threshold value.
The selected threshold value and associated color will appear in the preview window list.
Map Intelligence Client – User Manual
109
10. Configure all other threshold conditions that you wish to associate with a color.
11. Click the Values Outside Threshold rectangle, then select a color from the color picker to represent any other
values that have not been assigned a specific color.
12. Click the Empty Values rectangle, then select a hatch from the picker to represent any region that does not
contain any values.
13. To delete values assigned to a specific color, in the Preview window list, click the check box next to the value
and click Remove Selected.
Figure 147. Theme Builder Wizard: Configure Tab (Numeric-Manual-Colors).
14. Click the Save & Close button
. The Theme Builder Wizard will close. The theme will now be
displayed in the Theme Section of the Area Group Layer configuration screen.
Map Intelligence Client – User Manual
110
Figure 148. Color Themes Section (Numeric-Manual-Colors).
Figure 149. Area Group Layer Map View and Legend showing Manual Color Theme.
Map Intelligence Client – User Manual
111
SELECTING HATCHES
1.
Click the Hatches radio button.
Figure 150. Theme Builder Wizard: Features Tab (Numeric-Manual-Hatches).
Features Rendering Attributes
2.
In the Hatch Opacity field, enter a number from 0 to 1 that indicates the opacity of the hatches.
3.
In the Border Opacity field, enter a number from 0 to 1 that indicates the opacity of region borders in the
layer.
4.
In the Border Thickness field, enter the thickness in points or pixels (depending on the GIS provider) of the
region borders in the layer.
5.
In the Border Color field, enter the hexadecimal color value or select a color from the color picker for the
region border color. The default color is black (#000000).
6.
In the Hatch Color field, enter a hexadecimal color value or select a color from the color picker for the hatch
color. The default color is black (#000000).
Examples of using various Feature Attributes can be seen in Appendix B: Features Rendering
Attributes on page 136.
7.
Click the Configure tab or the Next button, the wizard will move to the Configure tab.
8.
Enter a threshold value in the top text box.
9.
Click the rectangle next to the text box.
Map Intelligence Client – User Manual
112
10. Select a hatch from the picker that you want to associate with the threshold value.
The selected threshold value and associated hatch will appear in the preview window list.
11. Configure all other threshold conditions that you wish to associate with a hatch.
12. Click the Values Outside Threshold rectangle, then select a hatch from the picker to represent any other
values that have not been assigned a specific hatch.
13. Click the Empty Values rectangle, then select a hatch from the picker to represent any region that does not
contain any values.
14. To delete values assigned to a specific color, in the Preview window list, click the check box next to the value
and click Remove Selected.
Figure 151. Theme Builder Wizard: Configure Tab (Numeric-Manual-Hatches).
15. Click the Save & Close button
. The Theme Builder Wizard will close. The theme will now be
displayed in the Theme Section of the Area Group Layer configuration screen.
Map Intelligence Client – User Manual
113
Figure 152. Hatch Theme Section (Numeric-Manual-Hatch).
Figure 153. Area Group Layer Map View and Legend showing Manual Hatch Theme.
UNSHADED AND TRANSPARENT COLORS
For further information on using the Transparent and Unshaded color options see Appendix C: Using the Unshaded
and Transparent Color Options on page 140.
Map Intelligence Client – User Manual
114
STRING AGGREGATION
Map Intelligence allows you to perform a function on string values from a specified fact column. String aggregations
require you to specify a color/hatch condition for a specific value instead of a threshold. The string functions
available include:
Most Common – this function applies the condition if the nominated value is the most common value in
the region.
Uniform – this function applies the condition if the nominated value is the only value from the specified
column in the region.
Majority – this function applies the condition if the nominated value makes up more than half of the
values in the region.
Creating a themes based on a String Aggregation
1.
Click the Theme button
, the Theme Builder wizard will open, displaying the Theme Type tab.
2.
The Fact Column drop down list will display the column you selected for the Fact Column on the Area Group
Layer configuration screen. If you wish to change the column, select the another column from the Fact Column
drop-down list.
3.
Select the String radio button.
Figure 154. Theme Builder Wizard: Theme Type Tab (String).
4.
Click the Data tab or the Next button, the wizard will move to the Data tab.
5.
From the Aggregation Function drop-down list, select the function to use for the layer. The string functions
available are: Most Common, Uniform and Majority.
Map Intelligence Client – User Manual
115
Figure 155. Theme Builder Wizard: Data Tab (String) with ‘Most Common’ selected.
6.
Click the Features tab or the Next button, the wizard will move to the Features tab.
There are two options for selecting the Fill Option:
Colors: Allows you to specify a particular color.
Hatches. Allows you to specify a particular hatch.
Map Intelligence Client – User Manual
116
SELECTING COLORS
1.
Click the Colors radio button.
Figure 156. Theme Builder Wizard: Features Tab (String – Colors).
Features Rendering Attributes
2.
In the Fill Opacity field, enter a number from 0 to 1 that indicates the opacity of the colored regions in the
layer.
3.
In the Border Opacity field, enter a number from 0 to 1 that indicates the opacity of region borders in the
layer.
4.
In the Border Thickness field, enter the thickness in points or pixels (depending on the GIS provider) of the
region borders in the layer.
5.
In the Border Color field, enter a hexadecimal color value or select a color from the color picker for the region
border color. The default color is black (#000000).
Examples of using various Feature Attributes can be seen in Appendix B: Features Rendering
Attributes on page 136.
6.
Click the Configure tab or the Next button, the wizard will move to the Configure tab.
7.
The top drop-down list will display all available values from the specified fact column. Select a value from the
top drop-down list.
In some instances only a sub-set of values will be displayed in the value list box. Click the refresh
button
to display all values. Be aware that large datasets may take sometime to process.
Map Intelligence Client – User Manual
117
8.
Click the rectangle next to the top drop-down list.
9.
Select a color from the color picker that you want to associate with the selected value.
The selected value and associated color will appear in the preview window list.
If the color picker does not have the exact color you wish to use, you can right click on the
colored rectangle and manually enter the hexadecimal color value.
10. Configure any other values that you wish to associate with a color.
Any values not assigned a specific color will be colored according to the color assigned to Other
Values (see below).
11. Click the Empty Values rectangle and select a color from the color picker to represent any region that does not
contain any values.
7.
Click the Conflict Values rectangle and select a color from the color picker to represent any region that does
not meet any specified condition. E.g. A Conflict condition will be returned if the ‘Uniform’ function has been
set and there is more than one type of value present in the region.
12. Click the Other Values rectangle and select a color from the color picker to represent any values that have not
been assigned with a specific color.
Figure 157. Theme Builder Wizard: Configure Tab (String – Colors).
13. To delete values assigned to a specific color, in the Preview window list, click the check box next to the value
and click Remove Selected.
14. Click the Save & Close button
. The Theme Builder Wizard will close. The theme will now be
displayed in the Theme Section of the Area Group Layer configuration screen.
Map Intelligence Client – User Manual
118
Figure 158. Color Theme (String – Colors).
Figure 159. Area Group Layer Map View and Legend showing Color Theme (String – Colors).
SELECTING HATCHES
1.
Click the Hatches radio button.
Map Intelligence Client – User Manual
119
Figure 160. Theme Builder Wizard: Features Tab (String – Hatches).
Features Rendering Attributes
2.
In the Hatch Opacity field, enter a number from 0 to 1 that indicates the opacity of the hatches.
3.
In the Border Opacity field, enter a number from 0 to 1 that indicates the opacity of region borders in the
layer.
4.
In the Border Thickness field, enter the thickness in points or pixels (depending on the GIS provider) of the
region borders in the layer.
5.
In the Border Color field, enter the hexadecimal color value or select a color from the color picker for the
region border color. The default color is black (#000000).
6.
In the Hatch Color field, enter a hexadecimal color value or select a color from the color picker for the hatch
color. The default color is black (#000000).
Examples of using various Feature Attributes can be seen in Appendix B: Features Rendering
Attributes on page 136.
7.
Click the Configure tab or the Next button, the wizard will move to the Configure tab.
8.
The top drop-down list will display all available values from the specified fact column. Select a value from the
drop-down list.
In some instances only a sub-set of values will be displayed in the value list box. Click the refresh
button
9.
to display all values. Be aware that large datasets may take sometime to process.
Click the rectangle next to the top drop-down list.
Map Intelligence Client – User Manual
120
10. Select a hatch from the picker that you want to associate with the selected value.
The selected value and associated hatch will appear in the preview window list.
11. Configure any other values that you wish to associate with a hatch.
Any values not assigned a specific hatch will be hatched according to the hatch assigned to Other
Values (see below).
12. Click the Empty Values rectangle and select a hatch from the picker to represent any region that does not
contain any values.
13. Click the Conflict Values rectangle and select a hatch from the picker to represent any region that does not
meet any specified condition. E.g. A Conflict condition will be returned if the ‘Uniform’ function has been set
and there is more than one type of value present in the region.
14. Click the Other Values rectangle and select a hatch from the picker to represent any values that have not been
assigned with a specific hatch.
Figure 161. Theme Builder Wizard: Configure Tab (String – Hatch).
15. To delete values assigned to a specific hatch, in the Preview window list, click the check box next to the value
and click Remove Selected.
16. Click the Save & Close button
. The Theme Builder Wizard will close. The theme will now be
displayed in the Theme Section of the Area Group Layer configuration screen.
Map Intelligence Client – User Manual
121
Figure 162. Hatch Theme (String – Hatch).
Figure 163. Area Group Layer Map View and Legend showing Hatch Theme (String – Hatch).
UNSHADED AND TRANSPARENT COLORS
For further information on using the Transparent and Unshaded color options see Appendix C: Using the Unshaded
and Transparent Color Options on page 140.
TO TEST YOUR SETTINGS
To test the Area Group Layer configuration
1.
From the Main Menu, click the Test button
. A Browser will open displaying your layer configuration.
The Layer will also be listed in the Layer Directory to the right of the screen.
Map Intelligence Client – User Manual
122
SAVING THE LAYER
To save the Area Group Layer configuration
1.
From the Main Menu, click Save button
to save your settings.
2.
A message box will appear stating your “Configuration saved successfully”, click the OK button.
The Layer will be saved and listed in the Layer Directory to the right of the screen.
The save button will save all changes made to all configuration screens.
EDITING A LAYER
To edit an Area Group Layer configuration
1.
From the Layer Directory, click on the plus icon next to Area Group Layers. The Area Group Layer section will
expand.
2.
Click on the Area Group Layer you want to edit, the layer configuration screen will open for editing.
3.
Save your changes by clicking the click Save button
4.
A message box will appear stating your “Configuration saved successfully”, click the OK button.
on the Main menu.
The save button will save all changes made to all configuration screens.
COPYING A LAYER
To copy an Area Group Layer
1.
From the Layer Directory, click on the plus icon next to Area Group Layers. The Area Group Layer section will
expand.
2.
Click on the Area Group Layer you want to copy, the layer configuration screen will open.
3.
From the Main Menu, click the Copy button
4.
In the Layer Name field, enter a new name for the layer.
5.
Save your changes by clicking the Save button
Layer Directory.
6.
A message box will appear stating your “Configuration saved successfully”, click the OK button.
. A copy of the layer will appear.
on the top menu. The new layer will appear in the
The save button will save all changes made to all configuration screens.
Map Intelligence Client – User Manual
123
DELETING A LAYER
To delete an Area Group Layer
1.
From the Layer Directory, click on the plus icon next to Area Group Layers. The Area Group Layer section will
expand.
2.
Click on the Area Group Layer you want to delete, the layer configuration screen will open.
3.
From the Main Menu, click the Delete button
.
4.
Save your changes by clicking the Save button
on the top menu.
5.
A message box will appear stating your “Configuration saved successfully”, click the OK button.
The save button will save all changes made to all configuration screens.
NOTE ON DATA FORMAT
Map Intelligence, by default, will place commas in numbers greater than 999. You can change the format by
specifying the column format in the universe. This only applies to columns with numeric values.
Map Intelligence Client – User Manual
124
LOGGING OFF
If you logged on to the MI Client via the Reports page, it is advisable to end your BI session to free resources.
To log off from the MI Client
1.
From the Main Menu, click the Log Off button
Map Intelligence Client – User Manual
.
125
SELECTION
CONFIGURING LAYERS FOR SELECTIONS
The Selection tool allows users to select points from the map or regions of built in maps and bring them back to the
report as filters.
The Id Column in the Points Properties section of the Point Layer Configuration screen or the Data Source Join
Column in the Data Source section of the Area Group Layer Configuration screen the is used to specify the specific
column from the Layer that will be available for selection.
1.
From the Id Column drop-down list, select a column that contains unique values to be used to identify
individual points when using the Selection Tool.
Figure 164. Point Layer Configuration screen – Point Properties section - Id Column.
Figure 165. Area Group Layer Configuration screen – Data Source section – Data Source Join Column.
Map Intelligence Client – User Manual
126
MAKING A SELECTION FROM THE MAP
For information on how to make a selection from the map, see the Foreground Tools, Selection section of the
Mapping Viewer User Manual.
ACCESSING SELECTIONS – ROUND TRIP
To view your selections from the Report to the Mapping Viewer
1.
Click any QlikView object's value on the QlikView Dashboard.
Figure 166. QlikView Dashboard - Showing Burger as the selected item on ListBox object
To apply your selections from the Mapping Viewer to the Dashboard
1.
Select a point or area on the Mapping Viewer using the selection tool.
2.
Click the Get Map Filter button on the QlikView Dashboard.
Figure 167. Mapping Viewer with Apply Selection Filter button.
Map Intelligence Client – User Manual
127
ADVANCED TOPICS
AUTO PILOT MODE
The Auto Pilot Mode (APM) controls some of the Map Intelligence Tools depending on the document being
manipulated by the Client. For example, based on the name of a business intelligence document, a Layer Designer
can control:
what plugins must be excluded;
what plugins must be deactivated, and
what plugins must be activated and how.
An excluded plugin will not even appear in the list of plugins usually visible when the user clicks the Tools menu
button in the Map Intelligence Mapping Viewer.
Auto Pilot mode requires some programming and access to the Map Intelligence server.
Further Information relating to Auto Pilot Mode can be found in the Auto Pilot Mode in Map Intelligence Technical
Note found on the Map Intelligence Server CD.
INDEPENDENT MAPS AND LEGENDS
This section explains how to extract components of the Map Intelligence GUI and display them separately within a
MI Client and retrieve printed images based on print templates.
MAPS
Independent maps can be retrieved as images and they are also implemented as tags that can be embedded in
jsp’s. They can also be invoked directly from an HTML request. Using the tag method, the map can be requested as
an image only, or it can be interactive.
IMAGES
The following parameters are available:
Parameter Name
Value
Required
userid
The id of the user that defines the users session
Yes
w
Determines the width of the map in pixels
No
h
Determines the width of the map in pixels
No
If the width and height are not specified then the size of the map will be the size from the current user
session.
The client retrieves a legend by contacting the configuration server. The following url will retrieve a map:
http://[machine-name]:[port-number]/miclient/getMapImage
Map Intelligence Client – User Manual
128
Example
To request a map with width 400 and height 400, the following url would be used:
<img src="http://[machine-name]:[portnumber]/miclient/getMapImage?userid=123456&w=400&h=400" alt="map">
where the machine-name and port-number are those of the configuration server
TAGS
The tag creates a map image based on the main map image but scaled to the required size (usually smaller).
Attributes can be set for a border and an action to be applied when the image is clicked on. If no height is given
then the scale is based on the width of the map image and vice versa, based on the aspect ration of the main map
settings.
The following parameters are available:
Parameter Name
Value
Required
userid
The id of the user that defines the users session
Yes
map-image-width
The width in pixels of the map. NOTE that the width will be coerced to the
aspect ratio of the main map if it turns out that the suggested width is
greater than the width derived from the scaling of the main map
maintaining its aspect ratio. The default value is the width of the main map.
No
map-image-height
The height in pixels of the map. NOTE that the height will be coerced to the
aspect ratio of the main map if it turns out that the suggested height is
greater than the height derived from the scaling of the main map
maintaining its aspect ratio. The default value is the height of the main
map.
No
map-image-notclickable
Set to “true” if you do not want the map image to be interactive. The
default value is “false”, i.e. interactive. As an interactive map it will use the
last foreground tool selected, or the zoom to marquee navigation setting.
No
map-image-border
You can set a border around the map as a number of pixels. The default
value is “0” or no border.
No
Here is an example in an iframe:
<html>
<head>
<meta http-equiv="Content-Type" content="text/html; charset=utf-8">
</head>
<body onload="javascript:document.forms0.submit(); document.forms1.submit();
return true">
<iframe name="mapImage" width=400 height=300 frameborder=0></iframe>
<form action="http://localhost:11090/mapIntelligence/componentServlet"
method="post" target="mapImage">
<input type="hidden" name="frontendComponent" value="map-image-component"/>
Map Intelligence Client – User Manual
129
<input name="userid" type="hidden" value="5294334027507255954526495945">
<input name="map-image-width" type="hidden" value="320">
<input name="map-image-height" type="hidden" value="240">
<input name="map-image-not-clickable" type="hidden" value="true">
<input name="map-image-border" type="hidden" value="2">
</form>
</body>
</html>
Only the width or the height need be set but if both are set then the image is scaled based on a
minimum of the scales resulting from the width and height to the original Map Intelligence viewer
width and height. The aspect ratio of the original image is preserved.
LEGEND
Previously the image was a jsp that generated html to render the legend in the browser. It is now returned by a
servlet as an image. The servlet is named /mapIntelligence/getLegendImage and has the following parameters
available:
Parameter Name
Value
Required
userid
The id of the user that defines the users session
Yes
size
Determines the look and feel of the legend. If none is specified, the look and
feel with an id of 1 is used. See Look and Feel below for more information.
No
The client retrieves a legend by contacting the configuration server. The following url will retrieve a legend:
http://[machine-name]:[port-number]/miclient/getLegendImage
Example
To request a legend using the look and feel set of 2, the following url would be used:
<img src="http://[machine-name]:[portnumber]/miclient/getLegendImage?userid=123456&size=2" alt="legend">
where the machine-name and port-number are those of the configuration server.
LOOK AND FEEL
To obtain the desired look and feel of the independent legend refer to the Technical Note: Legend Customization.
PRINTED IMAGES
The results of printing with a print template can be returned as an image. For details on what print templates are
and creating them, see the technical note on Creating a Print Template.
The following parameters are available:
Parameter Name
Value
Required
userid
The id of the user that defines the users session
Yes
Map Intelligence Client – User Manual
130
template
The name of the print template to use.
No
p_
Custom parameters defined in the template can be passed by prefixing their
parameter names with _p
No
The client retrieves a print template image by contacting the configuration server. The following url will retrieve a
legend:
http://[machine-name]:[port-number]/miclient/getPrintTemplate
Example
To request the default print template image and pass the custom parameters w and h, the following url would be
used:
<img src="http://[machine-name]:[port-number]/miclient/getPrintTemplate?
userid=123456&template=default&p_w=400&p_h=400" alt="legend">
where the machine-name and port-number are those of the configuration server.
Map Intelligence Client – User Manual
131
TROUBLESHOOTING
This section will provide description and solution of the most common issues.
CLIENT LOGIN ISSUES
Problem Description
“Invalid login/password/server combination.”
When logging in to the Client Configuration
Console, this message immediately displays
even when the credentials entered are correct.
Solution/s
Verify if the MI QlikView Service is up and running(see
page 12 of MI Client for QlikView Installation Guide).
Verify that QlikView port is allowed on the Inbound Rules
of QlikView Server machine. By default the port number
is 4747.
CLIENT CONNECTION ISSUES
Problem Description
“Lost connection to server.
Reconnecting...”
This message appears either on the QlikView
Client (Desktop/Ajax version) or on the Map
Solution/s
Check if the logged in user-id on the QlikView
Desktop/Ajax version is not the same user-id that is used
by the MI QlikView Service(see page 8 of MI Client for
QlikView 11 SR2 Installation Guide).
Viewer.
GLOBAL SETTINGS ISSUES
Problem Description
Solution/s
Macro parse failed. Functionality was lost
qvGenerateMap Error:
'ActiveDocument.Variables(...)'
Check if the global variables below are declared in the
QlikView Settings Document Properties
Variables :
This message displays on the QlikView
document
Map Intelligence Client – User Manual
MIURL
MIConnId
MIDocId
MIFilter
MIQVUser
132
LAYER ISSUES
Problem Description
The Theme Builder data is
insufficient/incomplete when the "Multiple
Image/Shape Icon" theme is selected.
Solution/s
Check the test-max-rows and the max-rows properties in
the client.properties file. These properties limit the
1.
2.
number of retrieved records to the BI Server and
number of data to be displayed in the Theme Builder
respectively.
Refer to the client.properties(see Appendix E) for more
information.
MAP RENDERING ISSUES
Problem Description
“The page cannot be displayed.”
This message displays on the Mapping Viewer.
“Failed to generate a map: This report is not yet
map-enabled.”
This message displays on the Mapping Viewer
even the map is already configured.
Solution/s
Check if the Map Intelligence Server (and included GIS
servers) is already running.
Check if the global variables below in QlikView
Settings Document Properties Variables are empty
before saving the QlikView document:
MIURL
MIConnId
MIDocId
MIFilter
“Layer <layer name> had an invalid value <value> in
column <column name>
The report field has an invalid data type (e.g. the field
expecting a decimal value but it’s data type is an integer).
Also, check the data type of the Longitude and Latitude
fields of the report referenced by the map. These should
not be an integer type. Valid data types are Single,
Double or Decimal.
“Macro parse failed. Functionality was lost
qvGenerateMap. Error : Permission denied”
Check the user security settings. The following option in
This message displays on the QlikView
document.
Map Intelligence Client – User Manual
QlikView Settings User Preferences Security must
be selected:
Module (Allow CreateObject and File Access)
133
APPENDICES
APPENDIX A: CLIENT METHODS
There are two methods available for sending requests from the Business Intelligence application. They are
determined by the property <code>use-splash-screen<code> in the client.properties file (<installdir>\webapps\miclient\WEB-INF\properties\client). By default, the value is set to false. The implications of
choosing a particular method are described below.
use-splash-screen = true
The request is sent as described by the following diagram. While the route taken is less efficient, the Javascript
security issues are eliminated. A splash screen is displayed when the map is being retrieved.
Figure 168. Method 1: With Splash Screen.
use-splash-screen = false
The request is sent as described by the following diagram. This is the most efficient route for the request to take.
Some browsers however, have been known to have security issues with Javascript when using this method. Also, as
the property name implies, a splash screen is not displayed when waiting for a map.
Map Intelligence Client – User Manual
134
Figure 169. Method 2: No Splash Screen.
Map Intelligence Client – User Manual
135
APPENDIX B: FEATURES RENDERING ATTRIBUTES
OPACITY OF COLORED CIRCULAR REGIONS IN RADIUS LAYERS
A number from 0 to 1 that indicates the opacity of all colored circular regions in radius relationship layers.
Figure 170. Opacity set to 1
Figure 171. Opacity set to 0.5
Figure 172.Opacity set to 0.2
OPACITY OF COLORED REGIONS
A number from 0 to 1 that indicates the opacity of all colored region layers.
Figure 173. Opacity set to 1
Figure 174. Opacity set to 0.5
Figure 175.Opacity set to 0.2
OPACITY OF HATCHES ON LAYERS
A number from 0 to 1 that indicates the opacity of all hatched layers.
Figure 176. Opacity set to 1
Figure 177. Opacity set to 0.7
Map Intelligence Client – User Manual
Figure 178. Opacity set to 0.5
136
COLOR OF HATCHES ON LAYERS
The RGB setting for the hatch color has a six hexadecimal digit (3 byte) number representing Red, Green and Blue.
The default value is Black (000000).
Figure 179. hatch color set to Red
(FF0000)
Figure 180. Hatch color set to Green
(00FF00)
Figure 181. Hatch color set to Yellow
(FFFF00)
OPACITY OF CIRCULAR REGION BORDERS IN RADIUS RELATIONSHIP LAYER
A number from 0 to 1 that indicates the opacity of all the circular region borders in a radius relationship layer.
Figure 182. Border opacity set to 1
Figure 183. Border opacity set to 0.5
Figure 184. Border opacity set to 0.2
COLOR OF CIRCULAR REGION BORDERS IN RADIUS RELATIONSHIP LAYER
The RGB setting for the border color as a six hexadecimal digit (3 byte) number representing Red, Green and Blue.
The default value is Black (000000).
Figure 185. Border color set to
Red (FF0000)
Figure 186. Border color set to
Orange (#FF8000)
Map Intelligence Client – User Manual
Figure 187. Border color set to
Purple (#800080)
137
THICKNESS OF CIRCULAR REGION BORDERS IN RADIUS RELATIONSHIP LAYER
The thickness in points or pixels (depending on the GIS provider) of the circular region borders as a positive integer.
Figure 188. Border thickness set to 5
Figure 189. Border thickness set to 3
Figure 190. Border thickness set to 1
USE MAP BORDER ATTRIBUTES
If the Use Map Border Attributes option in the Settings section of the MI Server Map Intelligence Tools page, is
set to Yes (the default) then, the map's attributes are used and any region border settings specified in the MI Client
are ignored.
OPACITY OF REGION BORDERS
A number from 0 to 1 that indicates the opacity of all region borders.
Figure 191. Border opacity set to 1
Figure 192. Border opacity set to 0.5
Map Intelligence Client – User Manual
Figure 193. Border opacity set to 0.2
138
COLOR OF REGION BORDERS
The RGB setting for the border color as a six hexadecimal digit (3 byte) number representing Red, Green and Blue.
The default value is Black (000000).
Figure 194. Border color set to Blue
(#0000FF)
Figure 195. Border color set to Green
(00FF00)
Figure 196. Border color set to White
(FFFFFF)
THICKNESS OF REGION BORDERS
The thickness in points or pixels (depending on the GIS provider) of the region borders.
Figure 197. Border thickness set to 5
Map Intelligence Client – User Manual
Figure 198. Border thickness set to 3
Figure 199. Border thickness set to 1
139
APPENDIX C: USING THE UNSHADED AND TRANSPARENT COLOR OPTIONS
REGION RELATIONSHIP AND AREA GROUP LAYERS
The following example shows the differences when using the Unshaded and Transparent color options for Region
Relationship and Area Group Layers. The example uses crime data to color-code parks in Sydney, NSW, Australia,
according to the type of crime committed either Theft, Vandalism or Assault.
Figure 200 shows a map of Central Sydney using the built-in Map Layers as shown in the Internal Legend. We can
see that the underlying layer for Australia is pale green , the areas of interest to us are Sydney parks shown by
the built-in layer nsw_parks .
Figure 200 Built-in Map Layer – nsw parks
Using a Map Intelligence Region Relationship Layer, we have color-coded the nsw_parks built-in layer according to
the Most Common crime type for each park. Theft is the most common crime in parks colored yellow, Vandalism=
cyan, etc.
Figure 201 Map Intelligence Region Relationship Layer
Map Intelligence Client – User Manual
140
Where a park has an equal number of crimes of the same type, this is shown as a “Conflict” and the park is colored
Magenta .
Figure 202 shows the result for Conflict if we used the Unshaded option. You can see the parks that were once
colored magenta are now unshaded, i.e. for these particular parks you see the original color-coding of the
nsw_parks layer
. Note that the other parks having no conflict crimes are still colored coded according to their most
common crime type.
Figure 202 Unshaded option.
Figure 203 shows the same example, however this time the Transparent option has been selected for Conflict. You
can see that the “Conflict” parks are not color-coded and the original color-coding for the nsw_parks layer for these
particular parks is transparent, resulting in you seeing the underling Australia built-in layer . Note the other
parks that do not have a conflict are still colored coded according to the most common crime type.
Figure 203 Transparent option.
Map Intelligence Client – User Manual
141
RADIUS RELATIONSHIP LAYERS
The following example outlines the differences when using the Unshaded and Transparent color options for Radius
Relationship Layers.
In this example potential new sites for Fast Food outlets ‘Vacant Outlets’ are shown as black buildings, around each
‘vacant outlet’ is a 3 km radius color-coded according to the most common Food Category of competitor outlets
operating within the 3 km radius. Green circles indicate Burger outlets, grey circles Chicken outlets, etc. “Conflicts”
are shown as Magenta
as seen in Figure 204.
Figure 204 Radius Relationship Layer
If for Conflict the Unshaded option is selected, the circles are removed completely so that they do not appear on
the map, nor can they be exported. Hidden circles do not have popup information (Figure 205).
Map Intelligence Client – User Manual
142
Figure 205 Unshaded Option
If for Conflict the Transparent option is selected, the circles appear ‘see-through’, except for a surrounding border.
It will display popup information (Figure 206)..
Figure 206 Transparent option.
Map Intelligence Client – User Manual
143
APPENDIX D: MODULE CODE
Const
Const
Const
Const
Const
Const
gMIClient = "http://qlikview112-sr2:9050"
gMIRequest = "/miclient/clientRequest.action"
gMISelectionRequest = "/miclient/clientSelection.action?"
gReportServer = "qlikview112-sr2"
gFilterDelimiter = "~"
gValueDelimiter = "::"
'This will set the filter based on value pair.
Public Function qvSetFilter(pFilter)
bolTrue = true
strSoFar = pFilter
iCount = 0
iCtr = 0
iCount = InStr(strSoFar, gFilterDelimiter)
If iCount > 0 Then
strValue = Mid(strSoFar, 1, iCount - 1)
strSoFar = Mid(strSoFar, iCount + 1)
Set fld = ActiveDocument.GetField(strValue)
Set fldVal = fld.GetNoValues
Do While bolTrue
iCount = InStr(strSoFar, gFilterDelimiter)
If iCount <= 0 Then
bolTrue = False
strValue = strSoFar
Else
strValue = mid(strSoFar, 1, iCount - 1)
strSoFar = mid(strSoFar, iCount + 1)
End If
fldVal.Add
fldVal(iCtr).Text = strValue
if fld.GetProperties.IsNumeric Then
fldVal(iCtr).Number = strValue
fldVal(iCtr).IsNumeric = true
Else
fldval(iCtr).IsNumeric = false
End If
iCtr = iCtr + 1
Loop
fld.SelectValues fldVal
End If
End Function
'Encode the string to HTML "safe" values.
Public Function qvEncode(pValue)
pValue = Replace(pValue, "%", "%25")
pValue = Replace(pValue, "&", "%26")
pValue = Replace(pValue, "+", "%2B")
pValue = Replace(pValue, "=", "%3D")
pValue = Replace(pValue, "?", "%3F")
pValue = Replace(pValue, "$", "%24")
pValue = Replace(pValue, ",", "%2C")
pValue = Replace(pValue, "#", "%23")
pValue = Replace(pValue, "<", "%3C")
pValue = Replace(pValue, ">", "%3E")
pValue = Replace(pValue, "{", "%7B")
pValue = Replace(pValue, "}", "%7D")
pValue = Replace(pValue, "|", "%7C")
pValue = Replace(pValue, "\", "%5C")
Map Intelligence Client – User Manual
'Should be the first to be encoded.
144
pValue = Replace(pValue,
pValue = Replace(pValue,
pValue = Replace(pValue,
pValue = Replace(pValue,
qvEncode = pValue
End Function
"^",
"[",
"]",
"`",
"%5E")
"%5B")
"%5D")
"%60")
'Set the value of MIURL document variable. You can check the value under Settings ->
Variable Overview
Public Sub qvSetMIURL
Set var = ActiveDocument.Variables("MIURL")
var.SetContent qvGetURL(), true
qvSetMIConnId
qvSetMIDocId
'Set parameter filter
sParameter = qvParameter() 'Replace all instances of & in the parameter. This will
affect parameter processing if not encoded.
Set var = ActiveDocument.Variables("MIFilter")
if sParameter <> "" then
var.SetContent sParameter, true
else
var.SetContent "", true
end if
End Sub
'Set the Connection ID Variable used by MI to determine the session of the user. This
is supposed to called when you first open the document -- and should only be called
once.
'You can check the value under Settings -> Variable Overview
Public Sub qvSetMIConnId
Set var = ActiveDocument.Variables("MIConnId")
if var.GetContent.String = "" Then
strConnId = ActiveDocument.Variables("MIQVUser").GetContent.String & " " & time()
var.SetContent strConnId, true
end if
End Sub
Public Sub qvSetMIDocId
Set var = ActiveDocument.Variables("MIDocId")
if var.GetContent.String = "" Then
var.SetContent ActiveDocument.GetProperties.FileName, true
end if
End Sub
'Get the current document selections.
Public Function qvParameter()
qvParameter = ""
Set selGetFilter = ActiveDocument.GetCurrentSelections()
selFilterValue = selGetFilter.Selections
selFilterField = selGetFilter.VarId
If UBound(selFilterField) >= LBound(selFilterField) then
qvParameter = ""
End If
For iCtr = LBound(selFilterField) to UBound(selFilterField)
qvParameter = qvParameter & selFilterField(iCtr) & "="
Map Intelligence Client – User Manual
145
'Need to do this separately since QlikView does its own short cut if you get
the value using selections.
'It does not return the complete list. Try selecting values more than 10
set field = ActiveDocument.Fields(selFilterField(iCtr))
Set objVal =
ActiveDocument.Fields(selFilterField(iCtr)).GetSelectedValues(field.GetProperties.NoOfV
alues,true)
strVal = ""
For i = 0 to objVal.Count-1
If strVal = "" Then
strVal = objVal.item(i).text
Else
strVal = strVal & gValueDelimiter & objVal.item(i).text
End If
Next
qvParameter = qvParameter & strVal
if iCtr <> UBound(selFilterValue) then
qvParameter = qvParameter & gFilterDelimiter
end if
Next
End Function
'Generate the complete MI Request including connection id, filters and parameters.
Public Function qvGetURL()
qvGetURL = gMIClient & gMIRequest
End Function
'Get the MI Selection. This is used to filter the report based on what's selected on
the map.
'Requires Microsoft.XMLHTTP. The QlikView server user (the one which started the QV
Service) should have the permission to run a web-services.
Public Sub qvMapSelection
sDocumentId = ActiveDocument.GetProperties.FileName
'transform document name
sDocumentId = Replace(sDocumentId, "\", gFilterDelimiter)
sDocumentId = Replace(sDocumentId, "/", gFilterDelimiter)
sDocumentId = qvEncode(sDocumentId)
strCommand = "document-name=" & sDocumentId & "&connToken=" &
ActiveDocument.Variables("MIConnId").GetContent.String &
"&command=list&columnDelimiter=" & gFilterDelimiter & "&rowDelimiter=" &
gFilterDelimiter & "&Dummy=" & now()
Set xmlHTTP = CreateObject("Microsoft.XMLHTTP")
xmlHTTP.open "POST", gMIClient & gMISelectionRequest, false
xmlhttp.setRequestHeader "Content-Type", "application/x-www-form-urlencoded"
xmlHTTP.send strCommand
If Err.Number <> 0 Then
MsgBox "ERROR: " & Err.Number & " - " & Err.Description
Else
strLayer = xmlHTTP.responseText
strSoFar = strLayer
bolTrue = true
If strSoFar <> "" Then
Do While bolTrue
iCount = InStr(strSoFar, gFilterDelimiter)
If iCount <= 0 Then
Map Intelligence Client – User Manual
146
strValue = strSoFar
bolTrue = false
Else
strValue = mid(strSoFar, 1, iCount - 1)
strSoFar = mid(strSoFar, iCount + 1)
End If
strCommand = "document-name=" & sDocumentId & "&connToken=" &
ActiveDocument.Variables("MIConnId").GetContent.String &
"&command=get&columnDelimiter=" & gFilterDelimiter & "&rowDelimiter=" &
gFilterDelimiter & "&layerName=" & strValue & "&Dummy=" & now()
Set xmlHTTP2 = CreateObject("MSXML2.ServerXMLHTTP")
xmlHTTP2.open "POST", gMIClient & gMISelectionRequest, false
xmlhttp2.setRequestHeader "Content-Type", "application/x-www-formurlencoded"
xmlHTTP2.send strCommand
If Err.Number <> 0 Then
MsgBox "ERROR: " & Err.Number & " - " & Err.Description
Else
strFilter = xmlHTTP2.responseText
qvSetFilter(strFilter)
End If
Loop
qvSetMIURL
End If
End If
End Sub
Map Intelligence Client – User Manual
147
APPENDIX E: CLIENT PROPERTIES
The client.properties file contains some properties for the MI Client for QlikView configuration. This is a guide in
modifying the values of the said properties.
To update client.properties
1.
Locate this file through
<install-dir>/tomcat/webapps/miclient/WEB-INF/properties/client
2.
Open client.properties.
max-rows
delimiter
null-value
test-max-rows
render-max-rows
dir-data
delete-temp-data
web-service-location
Figure 207. client.properties
Map Intelligence Client – User Manual
148
3.
Set max-rows to a value corresponding to the number of distinct values that must be retrieved for the
provided column in the Configure tab of the Theme Builder. See the following figure.
Distinct
values of
the column
selected.
Figure 208. Configure Tab of Theme Builder with sample of retrieved values related to the max-rows setting
4.
Set delimiter to a character used to delimit parameters or filter prompt values.
5.
Set null-value property that will serve as a replacement text for null values appearing in the themebuilder and in the information popup box.
Figure 209. Null properties
Map Intelligence Client – User Manual
149
Figure 210. Null Theme Builder
Figure 211. Map with Null values. Legend - Unknown
Map Intelligence Client – User Manual
150
6.
Set test-max-rows to a value corresponding to the number of rows/data to be used when rendering the
map during the design time or configuration.
A value of zero means that the application will retrieve all the data. This property affects the max-rows
property, in which the lesser the test-max-rows property, the lesser the data retrieved, Hence, a
smaller number of distinct values will be displayed.
7.
Set render-max-rows to a value corresponding to the number of rows/data to be used when rendering
the map during runtime (QlikView Server requesting the map).
8.
Set dir-data to a value corresponding to the temp directory used by MI Client for QlikView. The QlikView
Server user (the one which started the QlikView Server service) and Map Intelligence for QlikView must have
full access (read, write and delete) to this directory.
See page 4 of the MI Client for QlikView Installation Guide for more details.
9.
Set web-service-location to a value corresponding to the URL MI Client for QlikView Web Service.
See page 12 of the MI Client for QlikView Installation Guide for more details.
10. Save the client.properties.
11. Restart MI Client to apply the changes made in the client.properties file.
Map Intelligence Client – User Manual
151
GLOSSARY
Area Group Layer
Area Group layers correspond to existing areas on a map. The displayed theme is based on data attribute values, no
spatial calculation is required. Instead, a column in your business data is designated to have values that match a
column in the map data. For example, an existing map layer of suburbs may correspond to a data column for
suburbs where the values are the suburb names. Then, for transaction data that represents customer complaints
and that also contains a suburb column, it is possible to make a cross-reference between the transaction and the
map area using the suburb name. An example that would use this correlation is displaying a theme on a suburb's
area on the map that reflects the most common complaint type received from that suburb.
Built-in Layer
A built-in layer is defined by the map on the mapping server rather than the Map Intelligence Client. These layers
may contain all types of feature such as lines, points and regions e.g. cities, rivers and parks.
Coordinate Systems
A coordinate system provides a frame of reference for measuring locations on the surface of the earth. A full list of
acceptable coordinate systems is available in the Coordinate Systems document.
Data Columns
Data Columns are columns in a report that are sent to the Map Intelligence Server and have their values available in
the Mapping Viewer. Data column values are displayed in the map data screen and popups that appear when you
move your mouse over a point in the map. Data columns can also be used as fact or theme columns.
Fact Columns
A fact column is a data column that can have a string or numeric aggregation applied to it by a Relationship layer.
Hatching
Hatching is overlaying a pattern on top of a polygon allowing it to be distinguished visually rather than by using
color.
Map Intelligence Client – User Manual
152
Image Icons
Icons are used to visually represent points on a map. Icons can be symbols (image files) selected by the user or
colored shapes.
Layers
A layer is a set of spatial features displayed on a map. Objects in a layer are usually grouped logically e.g. capital
cities or parks. Each feature in a layer has the same set of data attributes, so a layer is in many ways like a relation
(table) in a relational database.
Map Intelligence Layer
A Map Intelligence Layer is a layer defined in the Map Intelligence Client. These layers display data in a report
geographic features on a map.
Map Intelligence Server
The Map Intelligence Server is the engine that takes requests from the Map Intelligence Client and Mapping Viewer
and responds by displaying maps and associated information.
Mapping Viewer
The Mapping Viewer displays the layers configured by the Layer Designer on the specified map. The Mapping
Viewer is viewed in a browser and provides controls that allow the end user to manipulate the map to return the
desired analysis.
Point
A point is a geographic feature with a single pair of coordinates. These are used to represent objects or events e.g.
house or accident locations.
Point Layer
Point layers are map layers where data is represented on the map as discrete point images or symbols. For
example: a particular layer might represent the location of stores as push-pin icons and another layer could
represent accidents as colored dots, where the color (theme) represents the severity of the accident. Typically, the
rows in a table of data belong to a business concept such as people or address details, where each column is an
attribute of that concept. Thus each row in your business data can be represented as an individual point in a point
layer. In Map Intelligence, point layers form the foundation for relationship layers.
Radius Relationship Layer
Radius relationship layers are circular regions with themes around certain points of interest that show information
about other points that fall within that circular region. These layers are generated by Map Intelligence. They are
based on calculations made by Map Intelligence on the specified data values as specified by the layer designer. For
example: different colored circles indicate the average house price within half a kilometer of a proposed waste
plant. Another example is where different colored circles indicate the number of burglaries that have occurred
within a five-mile distance of houses belonging to known burglars. In the current version of Map Intelligence, the
circle center points (eg: houses belonging to known burglars) and the data being analyzed (burglaries), must be
point layers.
Regional Relationship Layer
A Region Relationship layer corresponds to a map area of any shape that is solely geographical in its definition and
not generated by Map Intelligence. Examples would be suburbs, zip codes, local government areas or police
precincts. Region Relationship layers can be given themes according to specified data rules associated with the
points that fall within that region. An example of such a theme could be color-coding precincts according to the
number of crimes that have taken place within their boundaries, or applying different hatches to suburbs based on
the total value of house sales that have occurred in each one. Map Intelligence works out in which region a point
(eg: a sale or accident) physically belongs by doing a spatial calculation.
Relationship Layer
For further information see: Radius Relationship Layers and Regional Relationship Layers
Theme
A theme can be described as a representation of map features according to different associated values.