1
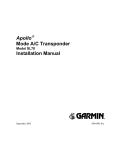
No part of this document may be reproduced in any form
or by any means without the express written consent of
UPS Aviation Technologies, Inc.
UPS Aviation Technologies, Inc., II Morrow, and Apollo
are trademarks of UPS Aviation Technologies, Inc.
© 2001 by UPS Aviation Technologies, Inc.
All rights reserved. Printed in the U.S.A.
UPS Aviation Technologies, Inc.
2345 Turner Road S.E.
Salem, OR 97302
U.S.A. Toll Free
Canada Toll Free
International
FAX
800.525.6726
800.654.3415
503.391.3411
503.364.2138
Visit our web page at http://www.upsat.com
Send comments about this manual by e-mail to:
[email protected]
SW Version 2.3
MX20 User’s Guide Supplement
What’s New
The latest software upgrade (Software Version 2.3) of the
MX20 adds several exciting features the will enhance the
value of your Apollo avionics.
•
Auto-Zoom
Map zoom scale changes between
air and ground automatically
•
Chart View
An electronic form of Jeppesen
charts viewable on screen
including the following:
ü Approaches
ü SIDS
ü STARS
ü Airspace Charts
ü Airport Surface Diagrams
Zoom Scale Auto-Transition
A zoom scale auto-transition point is supported that helps
to reduce the pilot workload by automating the selection
of the zoom scale based on the phase of flight. The two
transitions are:
•
Ground-to-Air mode
(Takeoff)
•
Air-to-Ground mode
(Landing)
When the aircraft transitions from Ground-to-Air, the
zoom scale is automatically set to a user selected ‘en route’
zoom scale.
When the aircraft transitions from
Air-to-Ground, the zoom scale is automatically set to a
user selected ‘Ground’ zoom scale. The transition point is
based on a user selected En Route/Ground Transition
Speed and is based on GPS ground speed.
The Auto-Transition feature allows for optimal close-in
viewing while on the ground and optimal long range
viewing while in flight, without the user having to make
manual zoom scale adjustments while in the takeoff and
landing phases of flight.
1
MX20 User’s Guide Supplement
SW Version 2.3
The En Route and Ground zoom scales and the transition
point are adjusted under the SYS Function (NAV
Options).
In the SYS Function (NAV Options) Menu the choices
are:
“En Route/Ground Transition Speed” – 40-100 kts
“Initial en route Zoom Scale” – Auto, .25 – 250 nm
“Initial Ground Zoom Scale” – .25 – 5 nm
The recommended settings for the initial zoom scales are
‘Auto’ for the en route mode and ‘.5nm’ for the ground
mode.
1. Press FN until you see the SYS function key.
2. Press the SYS function key.
3. With the “NAV” selection highlighted press MENU.
4. Press the NEXT PAGE Line Selection key.
5. Press the Line Selection keys as needed to select the
settings. Press ENT to save your settings.
2
SW Version 2.3
MX20 User’s Guide Supplement
Chart View
The Apollo MX20 Chart View feature provides the
capability to view Jeppesen Sanderson Inc. electronic
charts. Two basic types of charts can be viewed:
Approach charts and airport surface charts.
Approach charts can be manually loaded and overlaid on
the moving map during flight, while airport surface charts
are automatically overlaid while on the ground. Both
types of charts are also viewable from the Chart View
Function in a chart manual fashion.
The electronic chart data is generated from the standard
Jeppesen CDROM product, which is distributed and
updated by Jeppesen on a two-week schedule. The
in-flight data resides on the pilot removable front-loading
data card and is updated by the pilot using a home
PC-based data loader.
The MX20 Chart View feature does not currently
represent a sole replacement for the paper chart within the
cockpit. The presentation of the chart data is intended for
supplemental use and to provide additional situational
awareness. The pilot must still have access to the printed
chart as required by FAA regulations.
Overview
•
Charts are viewed either as a dynamic overlay on the
Custom/IFR Map, or as a static page through the
dedicated Chart View Function (‘Chart’ on the
function menu).
•
When viewed as a dynamic overlay on the
Custom/IFR Map, the chart will be properly
geo-referenced with respect to the base map.
Orientation (track up, north up, etc..), zoom scale,
and aircraft position will all be properly presented
relative to the chart data, using the standard map
controls.
3
MX20 User’s Guide Supplement
•
•
•
SW Version 2.3
When viewed under the Chart View Function, more
selection options are available for locating a specific
chart among the charts in the database, and the chart
is displayed similar to a standard chart manual (north
up) with no position overlay.
A given approach chart must be ‘loaded’ for map
overlay usage by first selecting the airport of interest,
then selecting the individual chart for that airport.
Approach charts can be loaded from either the
Custom/IFR Map or from the Chart View Function.
Pressing the INFO key while a chart is loaded or being
viewed will bring up the header, profile and
minimums associated with the chart.
Chart Data Source
The same set of charts that are available in electronic form
from the Jeppesen JeppView™ product are available for
loading onto the Apollo MX20 platform. These consist of
approaches, SIDS, STARS, airspace charts, and airport
surface diagrams. The Apollo MX20 can display all of
these charts from the Chart View Function, or a more
limited sub-set as dynamic overlays on the ‘Custom Map’
when the corresponding chart has been ‘Geo-Referenced’
by Jeppesen.
Datacard
As there are more charts available from Jeppesen than will
fit on the physical data card, predetermined coverage areas
are loaded instead of the entire contents of the Jeppesen
CD ROM. This process is performed using the data
loader software tool provided by Jeppesen. The MX20
Chart View data card can hold approximately 10,000
charts at a given time.
Chart Geo-Referencing
For the ownship position to be overlaid on the chart (as
viewed from the Custom/IFR Map), the chart must be
available in a ‘Geo-Referenced’ version, as supplied by
Jeppesen. Currently not all approach charts and airport
surface charts are geo-referenced.
4
SW Version 2.3
MX20 User’s Guide Supplement
When a chart is viewed and a red ‘X’ is present on the
earth symbol (to the left of the chart name), the chart is
NOT geo-referenced and thus cannot be ‘loaded’.
Chart Overlay in the Custom/IFR Map
On the Custom Map or the IFR en route Map, approach
charts (not airport surface charts) must be manually
‘loaded’ as there are multiple approach charts that can
apply for a given region (i.e. multiple approach charts for
the same airport). An approach chart will be displayed as
an overlay when the following conditions are met:
•
The approach chart is within the database residing on
the card
•
The approach chart is geo-referenced by Jeppesen
The approach chart has been loaded
•
•
The aircraft position is within the coverage of the
approach chart
•
The aircraft speed is above the air/ground threshold
(aircraft is in flight)
Load a specific approach chart for use as an overlay by
first selecting the airport and then selecting the approach
chart.
Selecting the Airport
Pressing the LOAD CHART key on the Custom or IFR Map
menu will present a list of airports that have
geo-referenced approach charts available. The first airport
within the list is the final destination waypoint as selected
on the external GPS navigator, with additional airports
listed based on a nearest to present position search.
Airports and approach charts that are not geo-referenced
will not be shown for selection on this menu.
5
MX20 User’s Guide Supplement
SW Version 2.3
Note
Prior to loading an approach chart, there is
operational benefit to selecting the desired
airport on the GPS navigator as the
destination waypoint, as the MX20 can
then detect this and place the corresponding
airport at the top of the airport list menu
for convenience.
The remaining number of airports within the list will vary
depending on the complexity of the database within the
current region and the number of geo-referenced
approach charts associated with the airports in the area.
The MX20 performs a complex filtering that eliminates
airports and associated approach charts that are not
geo-referenced, based on present position. This task is
time limited to three seconds, meaning that if extensive
filtering is required, the nearest based list may be shorter
in some circumstances than in others.
Loading the Approach Chart
Once the airport is selected, the individual approach chart
to be overlaid can be loaded from a list of geo-referenced
approach charts available for that airport. Not all
approach charts can be overlaid in this fashion and only
geo-referenced charts will be presented for selection from
the Custom Map. Because of this, it is possible that
approach charts that are viewable under the Chart View
Function may not be presented in this list.
Note
The pilot must be aware that not all charts
in the loaded database can be used as an
overlay.
Once the approach chart is loaded, a green Annunciator
will illuminate at the top of the screen indicating the
airport name and specific chart that has been loaded.
6
SW Version 2.3
MX20 User’s Guide Supplement
Overlay Chart Loading Example
1. Press FN and then MAP or IFR .
2. Press MENU and then the LOAD CHART Line Select key.
3. Highlight the desired airport with the arrow smart keys
and then press the SELECT smart key.
4. Highlight the desired approach with the arrow smart
keys and then press the LOAD smart key.
5. Adjust the zoom level using the IN or OUT smart keys.
7
MX20 User’s Guide Supplement
SW Version 2.3
Viewing the Chart as an Overlay
Display of Coverage Area
Once the desired approach chart has been loaded, a green
Annunciator bar with the approach name is illuminated at
the top of the Custom and IFR maps. If the aircraft is
outside the coverage area of the approach chart, a black
rectangular box will be presented that shows the coverage
of the chart itself.
Once the aircraft has entered the coverage area, the chart
contents will be displayed on the screen. Note that a
loaded approach chart is only viewable from the maps
when the aircraft is in flight, otherwise, the airport surface
chart has priority and the approach chart must be viewed
from the Chart View function.
Chart Zooming
Auto zoom mode is supported from the Custom Map and
is recommended to reduce the workload associated with
maintaining an appropriate zoom level. In auto zoom
mode (entered by zooming all the way down or all of the
way up), the zoom scale will be calculated to maintain the
current destination waypoint of your GPS receiver on the
screen at all times. The displayed zoom scale can be
determined from the range rings on the arc and 360
displays, or from the distance to the displayed destination
waypoint.
When an approach chart is loaded and being displayed,
the auto zoom mode will limit the low-end zoom level to
5 nm as the current waypoint is being approached. This
prevents the display from zooming into a level where the
overall situational awareness relative to the approach as a
whole is lost. This can be over-ridden by taking the unit
out of auto zoom mode.
8
SW Version 2.3
MX20 User’s Guide Supplement
Chart Panning
Panning on the loaded chart is currently not supported.
Entering the panning mode will disable the display of the
chart and allow the underlying map layers to be presented.
Chart Orientation
When the chart overlay is presented, the orientation is
identical to the currently selected orientation of the map
itself (North up, track up or desired track up) with
ownship position correctly geo-referenced and presented
on the chart. Note that rotation of the text on the charts
themselves is not supported, meaning that text may not be
oriented horizontally when displayed in track-up fashion.
Chart Info
Pressing the INFO key when a chart is loaded will change
the smart key labels to Header, Profile, Mins and Info.
Pressing the corresponding keys will allow the different
parts of the chart to be presented along the bottom of the
screen. Pressing the INFO key will disable this mode and
return the menu to the normal map controls.
9
MX20 User’s Guide Supplement
SW Version 2.3
The Chart View Function
The Chart View Function is accessed by pressing the FN
Function key on the front bezel, and selecting the Chart
View (CHART) function.
The Chart View Function incorporates five menu items
that control two basic operations:
•
Selecting a chart
(for static viewing)
•
Loading a chart
(for map overlay)
The term “Selecting a chart” is used to designate that a
given chart is selected for static viewing on the screen.
This is typically done by first specifying the airport, then
the specific chart for that airport.
The term “Loading a chart” is used to designate that a
given chart is loaded for flight operations and can be used
as an actual overlay on the maps. Loading a chart through
the Chart View Function is identical to loading a chart
from the Custom/IFR map as described in previous
sections.
All charts within the database, geo-referenced or not, can
be statically viewed from the Chart View Function. Only
geo-referenced charts can be loaded for map overlay
purposes.
The Chart View Function will retain the last view set and
will not change the chart, zoom level, or pan setting when
the function is exited and re-entered, allowing it to
operate similar to a physical chart manual. An exception
to this is when a chart is loaded in the Custom or IFR
Map functions. When this is done, the loaded chart is set
as the currently selected chart in the Chart View function.
Chart View Example:
1. Press FN and then CHART .
2. Depending on Chart status last used:
10
SW Version 2.3
MX20 User’s Guide Supplement
Press MENU and then the SELECT AIRPORT Line Select
key; or
Highlight the desired airport with the arrow smart keys
and then press the SELECT smart key.
3. Highlight the desired chart with the arrow smart keys
and then press the LOAD or VIEW smart key.
4. View the chart. Adjust the zoom level using the IN or
OUT smart keys. Press the PAN smart key and use the
movement Line Select keys on the right side of the
display. Use the INFO smart key to step through the
different details of the chart.
11
MX20 User’s Guide Supplement
SW Version 2.3
Menu Items
Search ID
The Search ID menu option within the Chart View
Function allow you to search for a specific airport
identifier. As this operation requires multiple key-strokes
to look up a specific chart, it is not recommended as the
primary mechanism for accessing the charts, but does
allow for flexibility. When an airport is located, it will be
set as the currently selected airport. Airport identifiers can
be entered with or without the “K” prefix.
Select Airport
The Select Airport operation allows the airport of interest
to be selected from a pop-up list. The airports presented
in the list are determined based on the final destination
waypoint as the first entry, and a nearest type search for
the remaining entries. This method allows the airport to
be quickly located based on the current flight plan on the
external GPS navigator.
Once the airport is located, the Select Chart menu is
presented (see below), allowing a specific chart for that
airport to be either loaded or simply viewed.
Select Chart
The Select Chart operation allows the list of charts for the
currently selected airport to be listed in a pop-up list.
Within this list, a circular earth symbol indicates that the
chart is geo-referenced and therefore can be loaded for use
as an overlay on the maps. If a red ‘X’ is presented
through the earth symbol, then that specific chart is not
geo-referenced and can be viewed, but not loaded as a
map overlay.
Select Loaded
The Select Loaded operation allows the currently loaded
chart to be selected for viewing. This is typically done if a
given chart was loaded from the Custom/IFR Map, and
viewing it from the Chart View Function is desired. Note
12
SW Version 2.3
MX20 User’s Guide Supplement
that loading a chart from the Custom/IFR Map will also
load and select the chart for viewing.
Load Current
The Load Current operation allows the currently selected
(viewed) approach chart to be set as the loaded approach
chart. When this operation is performed, any previously
loaded chart is replaced with the chart that is currently
being viewed.
Airport Surface Charts
Airport surface charts provide a graphical presentation of
the airport surface area (runways, taxiways, buildings,
towers and other objects), within the immediate airport
vicinity.
From either the Custom Map or the IFR en route Map,
airport surface charts will automatically be loaded and
displayed as an overlay if the following conditions are met:
•
The airport surface chart is within the loaded
database
•
The airport surface chart is geo-referenced by
Jeppesen
•
Airport Chart menu layer is turned on
The aircraft position is within the coverage of the
chart
A loaded chart is not being ‘flown’
•
•
In typical operation, the above conditions are met when
the unit is turned on, meaning that the airport surface
map is displayed as soon as GPS position is acquired.
Note that the Zoom Scale Auto-Transition feature
determines the initial zoom scale that is set when the
aircraft is on the ground, which is important when
working with surface charts.
13
MX20 User’s Guide Supplement
SW Version 2.3
Viewing Surface Charts
The airport surface charts are treated similarly to
approach type charts in that they can be viewed through
both the Chart View Function and on the Custom
Map/IFR Map as an overlay. However, as there is only
one unique surface chart for a given airport, it does not
need to be manually loaded for display. The nearest
available airport surface chart is always loaded by default.
When viewed from the Chart View Function, the airport
surface chart shows up as the first available chart for the
selected airport of interest. Thus, after selecting the
airport of interest, the list of charts will have an ‘Airport’
entry as the first item in the list. As with standard
approach charts, when viewed from the Chart View
Function, the aircraft’s ownship position is not shown on
the airport surface chart.
If an approach chart is currently loaded and being
displayed (aircraft is in the air), it will take priority over
displaying the airport surface chart. Once the aircraft
touches down and the speed drops below the air/ground
threshold, it is assumed that a missed approach procedure
is not needed. At this point, the approach chart is
un-loaded and the airport surface chart is displayed.
While on the ground, airport surface charts will take
priority over any loaded approach chart.
Operational Considerations
When to Load a Chart
An approach chart can be loaded at any point during the
flight, including on the ground before takeoff. The only
by-product of loading an approach before takeoff is if the
aircraft exceeds the air/ground speed threshold, then drops
back below this threshold, the approach will be
automatically un-loaded as the system thinks the flight
has occurred and the aircraft has landed again.
14
SW Version 2.3
MX20 User’s Guide Supplement
Note that the approach will not be shown on the map
itself until the aircraft has become airborne.
When Flying an Approach
It is important to recognize that the charts function is not
intended to provide guidance information for flying an
approach. It’s intended function is to provide basic
situational awareness as to your current position relative
to the approach as a whole. Standard instruments MUST
be used to actually provide the navigational information
required under IFR conditions.
Approach to Surface Map Transitions
Logic is incorporated that will automatically transition the
display from an in-flight approach chart display to a
zoomed in view of the airport surface chart upon landing.
The intent is to provide a hands-free transition from the
approach phase of flight to the airport surface navigation
phase without having to manually un-load the approach
and adjust the zoom scale.
The transition logic is based solely on aircraft ground
speed.
When an approach chart is loaded and being flown, and
the aircraft ground speed drops below the air/ground
threshold (set from within the SYS Function), it is
assumed that a landing has been performed. At this point,
the loaded approach chart is automatically un-loaded and
the airport surface chart will be presented on the screen
showing runways, taxiways, etc…
However, if approach chart is loaded and being flown and
the aircraft crosses the missed approach point without
slowing, it is assumed that a missed approach procedure is
being performed. In this case, the automatic transition to
surface maps does not occur and the approach is not
automatically unloaded. In the System Function, see the
section for setting the default zoom scale and transition
speed.
15
MX20 User’s Guide Supplement
SW Version 2.3
Chart NOTAMS
Any applicable NOTAMS that apply for a given chart are
shown under the INFO key when that chart is selected.
The chart should be viewed for NOTAMS before use.
Important System Limitations
Note that while on the ground and viewing airport surface
charts, the display can be oriented in the ‘Track Up’
mode. In this mode, the last known GPS based track as
obtained from the external GPS navigation system is used
to orient the map. GPS track is typically not accurate at
low speeds and does not reflect the actual heading of the
aircraft at all times.
Invert Option
As with the basic maps, the chart image can be inverted
using the standard invert key.
16
SW Version 2.3
MX20 User’s Guide Supplement
Typical Operational Scenario
The following scenario makes the assumption that:
• The appropriate charts are available and
geo-referenced
•
The default ground zoom level is set to .5nm
•
The default air zoom level is set to ‘AUTO’
Typical Taxi Scenario
On power up and GPS position acquisition, the Custom
Map Function will show the aircraft on the surface chart
at a zoom level of .5nm. The aircraft will be shown
relative to taxiways and runways throughout the taxi
procedure.
Typical Takeoff Scenario
On takeoff roll, when the aircraft reaches the air/ground
speed threshold, the display will automatically transition
to the en route zoom mode of ‘AUTO’ and adjust the
display to show the current destination waypoint.
Typical Approach Scenario
Setting the destination waypoint to the destination airport
on the GPS navigation system and pressing LOAD CHART
from the Custom/IFR Map will present the destination
airport in the selection list. Selecting this airport will then
bring up the approach charts that are available for that
airport, which can then be loaded by pressing the LOAD
smart key.
Typical Landing Scenario
With an approach chart being “flown,” upon touchdown
and rollout, the chart will be unloaded and the map will
automatically switch to the airport surface chart with the
zoom level set to .5nm.
17
MX20 User’s Guide Supplement
SW Version 2.3
Notes
18
© 2001 by UPS Aviation Technologies, Inc.
2345 Turner Rd., S.E.
Salem, OR 97302 U.S.A.
Phone 503.581.8101
800.525.6726
In Canada 800.654.3415
FAX 503.364.2138
http://www.upsat.com
Part #561-1070-00
July 2001