1
http://arstechnica.com/cpu/01q2/p4andg4e/p4andg4e-1.html
The Pentium 4 and the G4e: An
Architectural Comparison
Part I
by Jon Stokes
Copyright Ars Technica, LLC 1998-2001. The following disclaimer applies to the information,
trademarks, and logos contained in this document. Neither the author nor Ars Technica make any
representations with respect to the contents hereof. Materials available in this document are provided
"as is" with no warranty, express or implied, and all such warranties are hereby disclaimed. Ars
Technica assumes no liability for any loss, damage or expense from errors or omissions in the
materials available in this document, whether arising in contract, tort or otherwise.
The material provided here is designed for educational use only. The material in this document is
copyrighted by Ars Technica, LLC., and may not be reprinted or electronically reproduced unless prior
written consent is obtained from Ars Technica, LLC. Links can be made to any of these materials from
a WWW page, however, please link to the original document. Copying and/or serving from your local
site is only allowed with permission. As per copyright regulations, "fair use" of selected portions of the
material for educational purposes is permitted by individuals and organizations provided that proper
attribution accompanies such utilization. Commercial reproduction or multiple distribution by any
traditional or electronic based reproduction/publication method is prohibited.
Any mention of commercial products or services within this document does not constitute an
endorsement. "Ars Technica" is trademark of Ars Technica, LLC. All other trademarks and logos are
property of their respective owners.
Copyright © 1998-2001 Ars Technica, LLC
1
http://arstechnica.com/cpu/01q2/p4andg4e/p4andg4e-1.html
The Pentium 4 and the G4e: an Architectural
Comparison
by Jon "Hannibal" Stokes
When the Pentium 4 hit the market in November of 2000, it was the first
major new x86 microarchitecture from Intel since the Pentium Pro. In the
years prior to the P4's launch the P6 core dominated the market in its
incarnations as the Pentium II and Pentium III, and anyone who was paying
attention during that time learned at least one, major lesson: clock speed
sells. Intel was definitely paying attention, and as the Willamette team labored
away in Santa Clara they kept MHz foremost in their minds. This singular focus
is evident in everything from Intel's Pentium 4 promotional and technical
literature down to the very last detail of the processor's design. As this article
will show, the successor to the most successful x86 microarchitecture of all
time is a machine built from the ground up for stratospheric clock speed.
This article will examine the tradeoffs and design decisions that the P4's
architects made in their effort to build a MHz monster, paying special attention
to the innovative features that the P4 sports and the ways those features fit
with the processor's overall design philosophy and target application domain.
We'll cover the P4's ultra-deep pipeline, its trace cache, its double-pumped
ALUs, and a host of other aspects of its design, all with an eye to their impact
on performance.
One thing I've found in writing about technology is that it's never enough to
just explain how something new works. Most of us need a point of reference
from which to evaluate design decisions. When covering a new product, I
always try to compare it to either a previous version of the same product or
(even better) to a competitor's product. Such a comparison provides a context
for understanding what's "new" about a new technology and why this
technology matters. To this end, I'll be using Motorola's new MPC7450 (a.k.a.
the G4e or G4+) as a basis from which to talk about the P4. Note that this
article is not a performance comparison; performance comparisons are best
done in the lab by testing and benchmarking with real-world applications. I will
talk about performance quite a bit, but not in a manner that pits the two
processors directly against each other. In the end, it's best to think of this
article as an article about the P4 that uses the G4e as a point of reference. I'll
be using the G4e as sort of a baseline processor that will give you a feel for
how things are "normally" done. Then I'll talk about how and why the P4 does
things differently.
Before we talk about the two processors in detail, it might help to review a few
basics of processor design. If you've read my previous work, especially my G4
vs. K7 article, then you're probably familiar most of what I'll cover in the
following short review section. More advanced readers will want to skip to the
Copyright © 1998-2001 Ars Technica, LLC
2
http://arstechnica.com/cpu/01q2/p4andg4e/p4andg4e-1.html
next section. Still, if you haven't though about microarchitecture in a while you
might want to give the section below a quick read.
Basic instruction flow
One useful division that computer architects use when talking about CPUs is
that of "front end" vs. "back end" or "execution engine." When instructions are
fetched from the cache or main memory, they must be decoded and
dispatched for execution. This fetching, decoding and dispatching takes place
in the processor's front end.
Figure 1.1: Basic CPU Instruction Flow
Instructions make their way from the cache to the front end and down through
the execution engine, which is where the actual work of number crunching
gets done. Once they leave the execution engine, their results are written back
to main memory. This process, in which you FETCH the instruction from the
cache, DECODE it into a form that the internals of the processor can
understand, EXECUTE it, and WRITE its results back to memory makes up
the basic, four stage pipeline that all aspiring CPU architects learn in their
undergraduate architecture courses. Each pipeline stage must take exactly
one clock cycle to complete its business and send the instruction on to the
next stage, so the more quickly all of the stages can do their thing the shorter
the processor's clock cycle time (and the higher its clock speed or frequency)
can be.
(For a thorough explanation of all things pipelining--what it is, its relation to
the CPU's clock speed, etc.--see my first K7 article. From here on out, I'll just
Copyright © 1998-2001 Ars Technica, LLC
3
http://arstechnica.com/cpu/01q2/p4andg4e/p4andg4e-1.html
assume that you understand the basic concepts of pipelined execution. If you
don't, you should read up on it before proceeding further.)
Figure 1.2: Basic 4-stage pipeline
This basic pipeline represents the "normal" path that instructions take through
the processor, and as I just noted it assumes that all instructions spend only
one cycle being EXECUTEd. While most processors do have one-cycle
instructions (the P4 even has 0.5-cycle instructions), they also have some
really complicated instructions that need to spend multiple cycles in the
EXECUTE stage. To accommodate these multi-cycle instructions, the different
functional units their own EXECUTE pipelines (some with one stage, some with
more), so they can add stages to the processor's basic pipeline.
Copyright © 1998-2001 Ars Technica, LLC
4
http://arstechnica.com/cpu/01q2/p4andg4e/p4andg4e-1.html
Figure 1.3: 4-stage pipeline with pipelined execution units
The take-home message here is that when we talk about how many pipeline
stages a processor has we use an ideal number that pretends that each
instruction spends only one cycle in the EXECUTE stage, but most instructions
pass through multiple EXECUTE stages in the various functional units.
The general approaches and design philosophies of the P4 and G4e
While some processors still have the classic, four stage pipeline described
above, most modern CPUs are more complicated. The G4e breaks the classic,
four-stage pipeline into seven stages in order to allow it to run at increased
clock speeds on the same manufacturing process. Less work is done in each of
the G4e's shorter stages but each stage takes less time to complete. Since
each stage always lasts exactly one clock cycle, shorter pipeline stages mean
shorter clock cycles and higher clock frequencies. The P4, with a whopping 20
stages in its basic pipeline, takes this tactic to the extreme. Take a look at the
following chart from Intel, which shows the relative clock frequencies of Intel's
last six x86 designs. (This picture assumes the same manufacturing process
for all six cores). The vertical axis shows the relative clock frequency, and the
horizontal axis shows the various processors relative to each other.
Copyright © 1998-2001 Ars Technica, LLC
5
http://arstechnica.com/cpu/01q2/p4andg4e/p4andg4e-1.html
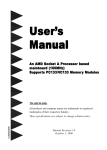
Figure 2.1: I know it says "Figure 2," but ignore that.
Intel's explanation of this diagram and the history it illustrates is enlightening,
as it shows where their design priorities were.
Figure 2 shows that the 286, Intel386 ™, Intel486 ™ and
Pentium ® (P5)processors had similar pipeline depths – they
would run at similar clock rates if they were all implemented on
the same silicon process technology. They all have a similar
number of gates of logic per clock cycle. The P6
microarchitecture lengthened the processor pipelines, allowing
fewer gates of logic per pipeline stage, which delivered
significantly higher frequency and performance. The P6
microarchitecture approximately doubled the number of pipeline
stages compared to the earlier processors and was able to
achieve about a 1.5 times higher frequency on the same process
technology. The NetBurst microarchitecture was designed to
have an even deeper pipeline (about two times the P6
microarchitecture) with even fewer gates of logic per clock cycle
to allow an industry-leading clock rate. (The Microarchitecture of
the Pentium 4 Processor, p. 3)
As we'll see, the Pentium 4 makes quite a few sacrifices for clock speed, and
although Intel tries to spin it differently, an extraordinarily deep pipeline is one
of those sacrifices. (For even more on the relationship between clock speed
and pipeline depth, see my first K7 article.)
Some might be tempted to attribute the vast differences in pipeline depth
between the P4 and the G4e to the fact that modern x86 processors like the
Athlon, PIII, and P4 need to break down large, complex x86 instructions into
smaller, more easily scheduled operations. While such instruction translation
does add pipeline stages to the P4, those stages aren't part of its basic, 20stage pipeline. (Yes, the P4 still needs to translate x86 instructions into µops,
but as we'll see later on the P4's trace cache takes the translation and decode
steps out of the P4's "critical execution path.").
Copyright © 1998-2001 Ars Technica, LLC
6
http://arstechnica.com/cpu/01q2/p4andg4e/p4andg4e-1.html
The drastic difference in pipeline depth between the G4e and the P4 actually
reflects some very important differences in the design philosophies and goals
of the two processors. Both processors want to run as many instructions as
quickly as possible, but they attack this problem in two different ways. The
G4e's approach can be summarized as "wide and shallow." Its designers added
more functional units to its back end for executing instructions, and its front
end tries to fill up all these units by issuing instructions to each functional unit
in parallel. In order to extract the maximum amount of instruction-level
parallelism (ILP) from the (linear) instruction stream the G4e's front end first
moves a small batch of instructions onto the chip. Then, its out-of-order
(OOO) execution logic examines them for interdependencies, spreads them
out to execute in parallel, and then pushes them through the execution
engine's nine functional units. Each of the G4e's functional units has a fairly
short pipeline, so the instructions take very few cycles to move through and
finish executing. Finally, in the last pipeline stages the instructions are put
back in their original program order before the results are written back to
memory.
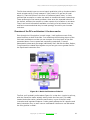
At any given moment the G4e can have up to 16 instructions spread
throughout the chip in various stages of execution simultaneously. As we'll see
when we look at the P4, this instruction window is quite small. The end result
is that the G4e focuses on getting a small number of instructions onto the chip
at once, spreading them out widely to execute in parallel, and then getting
them off the chip in as few cycles as possible.
Copyright © 1998-2001 Ars Technica, LLC
7
http://arstechnica.com/cpu/01q2/p4andg4e/p4andg4e-1.html
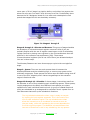
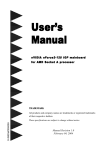
Figure 2.2: The G4e's approach
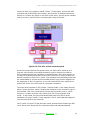
The P4 takes a "narrow and deep" approach to moving through the instruction
stream. It has fewer functional units, but each of these units has a deeper,
faster pipeline. The fact that each functional unit has a very deep pipeline
means that each unit has a large number of available execution slots and can
thus work on quite a few instructions at once. So instead of having, say, three
short FP units operating slowly in parallel, the P4 has one long FP unit that can
hold and rapidly work on more instructions in different stages of execution at
once.
It's important to note that in order to keep the P4's fast, deeply pipelined
functional units full, the machine's front end needs deep buffers that can hold
and schedule an enormous number of instructions. The P4 can have up to 126
instructions in various stages of execution simultaneously. This way, the
processor can have many more instructions on-chip for the out-of-order
execution logic to examine for dependencies and then rearrange to be rapidly
fired to the execution units.
Copyright © 1998-2001 Ars Technica, LLC
8
http://arstechnica.com/cpu/01q2/p4andg4e/p4andg4e-1.html
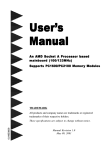
Figure 2.2: The P4's approach
It might help you to think about these two approaches in terms of a
McDonald's analogy. At McDonald's, you can either walk in or drive through. If
you walk in, there are five or six short lines that you can get in and wait to
have your order processed by a single server in one, long step. If you choose
to drive through, you'll wind up on a single, long line, but that line is geared to
move faster because more servers process your order in more, quicker steps:
a) you pull up to the speaker and tell them what you want; and b) you drive
around and pick up your order. And since the drive-through approach splits
the ordering process up into multiple, shorter stages, more customers can be
waited on in a single line because there are more stages of the ordering
process for different customers to find themselves in. So the G4e takes the
multi-line, walk-in approach, while the P4 takes the single-line, drive-through
approach.
Copyright © 1998-2001 Ars Technica, LLC
9
http://arstechnica.com/cpu/01q2/p4andg4e/p4andg4e-1.html
The perils of deep pipelining
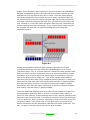
The P4's way of doing things has advantages for certain types of applications-especially 3D and streaming media applications--but it also carries with it
serious risks. The "narrow and deep" scheme gets into trouble when the
processor can't find enough instructions or data in the L1 cache to keep those
deep pipelines fed. Notice those empty execution slots in Figure 2.2. (The
empty execution slots are the white squares, while the ones containing
instructions are red). Those empty slots, called "pipeline bubbles," occur when
the processor can't schedule an instruction to fit in that slot. Pipeline bubbles
must propagate through each stage all the way to down the end of the
pipeline, and each stage that contains a bubble with no instruction is sitting
idle and wasting precious execution resources on that clock cycle.
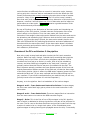
The P4's long pipeline means that bubbles take a long time to propagate off
the CPU, so a single bubble results in a lot of wasted cycles. When the G4e's
shorter pipeline has a bubble, it propagates through to the other end quickly
so that fewer cycles are wasted. So a single bubble in the P4's 20 stage
pipeline wastes at least 20 clock cycles (more if it's a bubble in one of the
longer FPU pipelines), whereas a single bubble in the G4e's 7 stage pipeline
wastes at least 7 clock cycles. 20 clock cycles is a lot of wasted work, and
even if the P4's clock is running twice as fast as the G4e's it still takes a larger
performance hit for each pipeline bubble than the shorter machine.
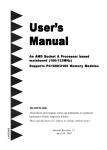
Figure 3.1
As you can see, the more deeply pipelined a machine is, the more severe a
problem pipeline bubbles become. When the P4's designers set high clock
speeds as their primary goal in crafting the new microarchitecture, they had to
do a lot of work to prevent bubbles from entering the pipeline and killing
performance. In fact, we've already discussed the extremely deep scheduling
queues in the P4's front end. These queues represent a place where the P4
spends a large number of transistors to alleviate the negative the effects of its
long pipeline, transistors that the G4e spends instead on added execution
units.
Copyright © 1998-2001 Ars Technica, LLC
10
http://arstechnica.com/cpu/01q2/p4andg4e/p4andg4e-1.html
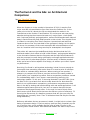
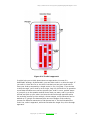
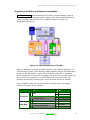
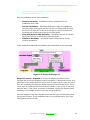
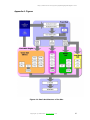
Overview of the G4e's architecture and pipeline
This large diagram shows the basics of the G4e's microarchitecture, with an
emphasis on representing the pipeline stages of the front end and functional
units. You might want to open it in a separate window and refer to it
throughout this section.
Figure 4.1: Basic Architecture of the G4e
Before instructions can enter the G4e's pipeline, they must be available in its
32K instruction cache. This instruction cache together with the 32K data cache
makes up the G4e's 64K L1 cache. The instruction leaves the L1 and goes
down through the various front end stages until it hits the execution engine, at
which point it is executed by one of the G4e's eight execution units (not
counting the Branch Processing Unit, which we'll talk about in a second).
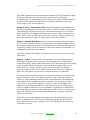
As I've already noted, the G4e breaks down the G4's classic, four stage
pipeline into seven, shorter stages:
G4
1
Fetch
2
Decode/Dispatch
3
Execute
4
Complete/Write-Back
Front End
Back End
G4e
1
Fetch1
2
Fetch2
3
Decode/Dispatch
4
Issue
5
Execute
6
Complete
7
Write-Back
Copyright © 1998-2001 Ars Technica, LLC
11
http://arstechnica.com/cpu/01q2/p4andg4e/p4andg4e-1.html
Let's take a quick look at the basic pipeline stages of the G4e, because in spite
of the fact that there are more than four of them they're still pretty
straightforward. An understanding of the G4e's more classic RISC pipeline will
provide us with a good foundation for our upcoming discussion of the P4's
much longer, more peculiar pipeline.
Stages 1 and 2 - Instruction Fetch: These two stages are both dedicated
primarily to grabbing an instruction from the L1 cache. The G4e can fetch four
instructions per clock cycle from the L1 cache and send them on to the next
stage. Hopefully, the needed instructions are in the L1 cache. If they aren't in
the L1 cache, then the G4e has to hit the much slower L2 cache to find them,
which can add up to 9 cycles of delay into the instruction pipeline.
Stage 3 - Decode/Dispatch: Once an instruction has been fetched, it goes
into a 12-entry instruction queue to be decoded. The decoding stage is where
the processor determines what kind of instruction it's looking at and where the
instruction should be sent for execution. Once the instruction is decoded, it is
dispatched to the proper issue queue.
The G4e's decoder can dispatch up to three instructions per clock cycle to the
next stage.
Stage 4 - Issue: There are three issue queues for the three main types of
instructions that the G4e can execute. The first queue is the Floating-Point
Issue Queue (FIQ), which holds floating-point (FP) instructions that are waiting
to be executed. The second queue is the Vector Issue Queue (VIQ), which
holds vector (or Altivec) operations, and the third queue is the General
Instruction Queue (GIQ), which holds everything else. Once the instruction
leaves its issue queue, it goes to the execution engine to be executed.
The issue stage, which also involves the reservation stations* attached to the
various execution units, is the stage where the linear instruction stream is
broken up into independent chunks and the instructions are rearranged and
scheduled to fit the available execution resources. This is where the "out-oforder" part in "out-of-order execution" comes in. Most of this OOO action
happens in the reservation stations, which do the dirty work of figuring out
when to schedule instructions for the execution unit that they're attached to.
The Issue Queues, however, even though they're FIFO (First In First Out) can
also send instructions to the reservation stations out of program order with
respect to each other.
The 4-entry Vector Issue Queue can accept up to two instructions per cycle
from the dispatch unit. The 6-entry General Issue Queue can accept up to
three instructions per cycle, and the 2-entry FP Issue Queue can accept one
instruction per cycle.
Copyright © 1998-2001 Ars Technica, LLC
12
http://arstechnica.com/cpu/01q2/p4andg4e/p4andg4e-1.html
Stage 5 - Execute: This stage is pretty straightforward. Here, the instructions
can pass out of order from their issue queues into their respective functional
units and be executed. Floating-point ops move into the FPU, vector ops move
into one of the four Altivec units, integer ops move into an ALU, and LOADs or
STOREs move into the LOAD/STORE Unite (LSU). We'll talk about these units
in a bit more detail when we discuss the G4e's execution engine.
Stages 6 and 7 - Complete and Write-Back: In these two stages, the
instructions are put back into program order (the order in which they came
into the processor), and their results are written back to memory. It's
important that the instructions are re-arranged to reflect their original ordering
so that the illusion of in-order execution is maintained to the world outside the
processor. The program needs to think that its commands were executed one
after the other, the way it was written.
For a look at two instructions as they travel through the G4e, check out this
animated GIF. Modem users should beware, though, because the GIF weights
in at 355K.
Before we go into detail about the back end of the G4e, let's look at one
aspect of the G4e's front end in a bit more detail: the branch processing unit.
*Note that the reservation stations are not visible in the large diagram linked above. If I were to put
them in, they'd be little white boxes that sit right on top of the each group of functional units.
The Branch Processing Unit and branch prediction
If you look on left side of the G4e's front end you'll see a unit attached to the
Instruction Fetch and Decode/Dispatch pipeline stages. This is the branch
processing unit (BPU), an execution unit which acts as the rudder that steers
the front end (and behind it the rest of the processor) through the instruction
stream. Whenever the front end's decoder encounters a conditional branch
instruction, it sends it to the BPU to be executed. The BPU in turn usually
needs to send off to one of the other execution units to have the instruction's
branch condition evaluated, so that the BPU can determine if the branch is
taken or not taken. Once the BPU determines that the branch is taken, it has
to get the address of the next block of code to be executed. This address, the
"branch target," must be calculated and the front end must be told to begin
fetching code starting at the new address.
In older processors, the entire processor would just sort of sit idle and wait for
the branch condition to be evaluated, a wait that could be quite long if the
evaluation involved a complex calculation of some sort. Modern processors use
a technique called "speculative execution," which involves making an educated
guess at the which direction the branch is going to take and then beginning
execution at the new branch target before the branch's conditional is actually
evaluated. This educated guess is made using one of a variety of "branch
prediction" techniques, which we'll talk more about in a moment. Speculative
execution is used to keep the delays associated with evaluating branches from
Copyright © 1998-2001 Ars Technica, LLC
13
http://arstechnica.com/cpu/01q2/p4andg4e/p4andg4e-1.html
introducing bubbles into the pipeline. (For a more detailed discussion of
speculative execution, see my IA-64 preview.)
Branch prediction can backfire when the processor incorrectly predicts a
branch. Such mispredicts are a bad thing, because if all of those instructions
that the processor has loaded into the pipeline and begun speculatively
executing turn out to be from the wrong branch then pipeline has to be
flushed of the erroneous, speculative instructions and results. Then the front
end has to fetch the correct branch target address so that it can begin
executing at the right place. Flushing the pipeline of instructions and results
means you're flushing a lot of work right down the toilet. Furthermore, there's
a delay (and a therefore a few cycles worth of pipeline bubbles) associated
with calculating the correct branch target and loading the new instruction
stream into the front end. This wasted work and delay can degrade
performance significantly, especially on branch intensive code.
As you can probably guess, the more deeply pipelined a machine is the bigger
a price it pays for a mispredict. We've already seen how delays and their
attendant pipeline bubbles can degrade performance for long pipelines, so
nothing more needs be said about how painful it is for a 20-stage machine like
the P4 to have to wait around while new instructions are loaded from the
cache. Also, a deeper pipeline means that more speculative instructions can be
loaded into the machine and executed simultaneously, which means that there
are more instructions and work that has to be thrown out when a mispredict
occurs.
The P4 has a minimum mispredict penalty of 19 clock cycles for code that's in
the L1 cache--that's the minimum; the damage can be much worse, especially
if the correct branch can't be found in the L1 cache. (In such a scenario, the
penalty is upwards of 30 cycles). The G4e's 7-stage pipeline doesn't pay
nearly as high of a price for mispredict as the P4, but it does take more of a
hit for one than its 4-stage predecessor, the G4. The G4e has a minimum
mispredict penalty of 6 clock cycles, as opposed to the G4's minimum penalty
of only 4 cycles.
There are two main types of branch prediction: static prediction and dynamic
prediction. Static branch prediction is simple, and relies on the assumption
that the majority of backwards pointing branches occur in the context of
repetitive loops, where a branch instruction is used to determine whether or
not to repeat the loop again. Most of the time a loop's conditional will evaluate
to "taken," thereby instructing the machine to repeat the loop's code one more
time. This being the case, static branch prediction merely assumes that all
backwards branches are "taken." For a branch that points forward to a block of
code that comes later in the program, the static predictor assumes that the
branch is "not taken."
Static prediction is very fast, as it doesn't involve any table lookups or
calculations, but its success rate varies widely with the program's instruction
mix. If the program is full of loops, static prediction works ok; if it's not, static
Copyright © 1998-2001 Ars Technica, LLC
14
http://arstechnica.com/cpu/01q2/p4andg4e/p4andg4e-1.html
branch prediction performs quite poorly. To get around the problems
associated with static prediction computer architects use a variety of
algorithms for predicting branches. These "dynamic branch prediction"
algorithms usually involve the use of either one or both of two types of tables,
the Branch History Table (BHT) and the Branch Target Buffer (BTB), to record
information about the outcomes of branches that've already been executed.
The BHT stores each conditional branch that the BPU has encountered on its
last few cycles, along with some bits that indicate the likelihood that the
branch will be taken based on its past history. For a regular 2-bit branch
history scheme, branches are marked as "strongly taken," "taken," "not
taken," and "strongly not taken." When the front end encounters a branch
instruction that has an entry in its BHT, the branch predictor uses branch
history information to decide whether or not to speculatively execute the
branch.
Should the branch predictor decide to speculatively execute the branch, it
needs to know exactly where in the L1 cache the branch is pointing--in other
words, it needs a branch target. The Branch Target Buffer (BTB) stores the
branch targets of previously executed branches, so when a branch is taken the
BPU grabs the speculative branch target from the BTB and points the front end
to begin fetching instructions from that address. Hopefully, the BTB contains
an entry for the branch you're trying to execute, and hopefully that entry is
correct. If the branch target either isn't there or it's wrong, you've got a
problem. I won't get into the issues surrounding BTB performance, but suffice
it to say that a larger BTB is usually better.
The G4e and the P4 each use both static and dynamic branch prediction
techniques to prevent mispredicts and delays. If a branch instruction does not
have an entry in the BHT, both processors will use static prediction to decide
which path to take. If the instruction does have a BHT entry, dynamic
prediction is used. The P4's BHT is quite large; at 4K entries, it has enough
space to store information on most of the branches in an average program.
The PIII's branch predictor has a success rate of around 91%, and the P4
allegedly uses an even more advanced algorithm to predict branches so it
should perform even better. The P4 also uses a BTB to store predicted branch
targets. In most of Intel's literature and diagrams, the BTB and BHT are
combined under the label "the front-end BTB."
The G4e has a BHT size of 2K entries, up from 512 entries in the G4's. I don't
have any data on the G4e's branch prediction success rate, but I'm sure it's
fairly good. The G4e has a 128-entry Branch Target Instruction Cache (BTIC),
the functional equivalent of the P4's BTB. This cache is twice as large as the
G4's 64-entry BTIC.
The take-home message here is that both processors spend more resources
than their predecessors on branch prediction, because their deeper pipelines
make mispredicted branches a major performance killer for both of them.
Copyright © 1998-2001 Ars Technica, LLC
15
http://arstechnica.com/cpu/01q2/p4andg4e/p4andg4e-1.html
The P4 does actually have one more branch prediction trick up its sleeve that's
worth at least noting (if only because if I don't note it I'll get lots of email
about it). That trick comes in the form of "software branch hints," or little
prefixes that a compiler or coder can attach to conditional branch instructions.
These prefixes give the branch predictor clues as to the expected behavior of
the branch, whether the compiler or coder expects it to be taken or not taken.
There's not much information available on how big of a help these hints are,
and Intel recommends that they be used sparingly since they can increase
code size.
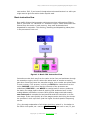
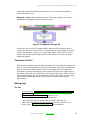
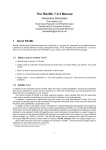
Overview of the P4's architecture I: the trace cache
Even though the P4's pipeline is much longer, it still performs most of the
same functions as that of the G4e. I've cooked up the following picture of the
P4's basic architecture so that you can compare it to the picture of the G4e
presented above. Due to space and complexity constraints, I haven't
attempted to show each pipe stage individually like I did with the G4e. Rather,
I've grouped the related ones together so you can get a more general feel for
the layout and instruction flow.
Figure 6.1: Basic Architecture of the P4
The first you'll probably notice about Figure 6.1 is that the L1 cache is split up,
with the instruction cache actually sitting inside the front end. This oddly
located instruction cache, called the trace cache, is one of the P4's most
innovative and important features. It also greatly affects the P4's pipeline and
basic instruction flow, so we'll have to understand it before we can talk about
the P4's pipeline in detail.
Copyright © 1998-2001 Ars Technica, LLC
16
http://arstechnica.com/cpu/01q2/p4andg4e/p4andg4e-1.html
In a conventional x86 processor like the PIII or the Athlon, x86 instructions
make their way from the instruction cache into the decoder, where they're
broken down into multiple smaller, more uniform, more easily managed
instructions called µops. These µops are actually what the out-of-order
execution engine schedules, executes, and retires. As you know if you've read
my K7 articles, this instruction translation happens each time an instruction is
executed, so it adds a few pipeline stages to the beginning of the processor's
basic pipeline. (Note that in the following two Figures, multiple pipeline stages
have been collapsed into each other, i.e. Instruction Fetch takes multiple
stages, Translate takes multiple stages, Decode takes multiple stages, etc.)
Figure 6.2: Normal x86 processor's critical execution path
For a block of code that's executed only a few times over the course of a single
program run, this loss of a few cycles each time isn't that big of a deal. But for
a block of code that's executed thousands and thousands of times (i.e. a loop
in a media application that applies a series of operations to a large file) the
number of cycles spent repeatedly translating and decoding the same group
of instructions can add up quickly. The P4 reclaims those lost cycles by
removing the need to translate those x86 instructions into µops each time
they're executed.
The P4's instruction cache takes translated, decoded µops that are primed and
ready to be sent straight out to the OOO execution engine, and it arranges
Copyright © 1998-2001 Ars Technica, LLC
17
http://arstechnica.com/cpu/01q2/p4andg4e/p4andg4e-1.html
them into little mini-programs called "traces." These traces, and not the x86
code that was produced by the complier, are what the P4 executes whenever
there's an L1 cache hit (which is over 90% of the time). As long as the needed
code is in the L1 cache the P4's execution path looks as follows.
Figure 6.3: The P4's critical execution path
As the front end executes the stored traces, the trace cache sends up to 3
µops per cycle directly to the OOO execution engine, without the need for
them to pass through any translation or decoding logic. Only when there's an
L1 cache miss does that top part of the front end kick in in order to fetch and
decode instructions from the L2 cache. The decoding and translating steps that
are necessitated by a trace cache miss add another eight pipeline stages onto
the beginning of the P4's pipeline, so you can see that the trace cache saves
quite a few cycles over the course of a program's execution.
The trace cache operates in two modes. "Execute mode" is the mode pictured
above, where the trace cache is feeding stored traces to the execution logic to
be executed. This is the mode that the trace cache normally runs in. When
there's an L1 cache miss the trace cache goes into "trace segment build
mode." In this mode, the front end fetches x86 code from the L2 cache,
translates into µops, builds a "trace segment" with it, and loads that segment
into the trace cache to be executed.
You'll notice in Figure 6.3 that the trace cache execution path knocks the BPU
out of the picture, along with the instruction fetch and translate/decode
Copyright © 1998-2001 Ars Technica, LLC
18
http://arstechnica.com/cpu/01q2/p4andg4e/p4andg4e-1.html
stages. This is because a trace segment is much more than just a translated,
decoded, predigested version of the x86 code that compiler actually spit out
and that the front end fetched from the L2 cache. The trace cache actually
uses branch prediction when it builds a trace so that it can splice code from
the branch that it thinks the program will take right into the trace behind the
code that it knows the program will take. So if you have a chunk of x86 code
with a branch in it, the trace cache will build a trace from the instructions up
to and including the branch instruction. Then, it'll pick which branch it thinks
the program will take and it'll continue building the trace along that
speculative branch.
Figure 6.4
Having the speculative execution path spliced in right after the branch
instruction confers on the trace cache two big advantages over a normal
instruction cache. First, in a normal machine it takes the branch predictor and
BPU some time to do their thing when they come across a conditional branch
instruction--they've got to figure out which branch to speculatively execute,
load up the proper branch target, etc.. This whole process usually adds at
least one cycle of delay after every conditional branch instruction, a delay that
often can't be filled with other code and therefore results in a pipeline bubble.
With the trace cache, however, the code from the branch target is already
sitting there right after the branch instruction, so there's no delay associated
with looking it up and hence no pipeline bubble.
The other advantage that the trace cache offers is also related to its ability to
store speculative branches. When a normal L1 instruction cache fetches a
cache line from memory, it stops fetching when it hits a branch instruction and
leaves the rest of the line blank. If the branch instruction is the first instruction
in an L1 cache line, then it's the only instruction in that line and the rest of the
line goes to waste. Trace cache lines, on the other hand, can contain both
branch instructions and the speculative code after the branch instruction. This
way, no space in the trace cache's 6-uop line goes to waste.
Copyright © 1998-2001 Ars Technica, LLC
19
http://arstechnica.com/cpu/01q2/p4andg4e/p4andg4e-1.html
Most compilers take steps to deal with the two problems I've outlined above
(the delay after the branch and the wasted cache line space.) As we've seen,
though, the trace cache solves these in its own way, so programs that are
optimized to exploit these abilities might see significant advantages from
them.
One interesting effect that the trace cache has on the P4's front end is that the
whole issue of x86 translation/decode bandwidth is for the most part
decoupled from the issue of dispatch bandwidth. If you'll recall from my K7
article, the K7 spends a lot of transistor resources on a turbocharged, beefed
up x86 decoder so that it can translate enough clunky x86 instructions each
cycle into MacroOps (the K7's version of µops) to keep the execution engine
fed. With the P4, the fact that most of the time program code is fetched from
the trace cache in the form of predigested µops means that a high bandwidth
translator/decoder isn't necessary. The P4's decoding logic only has to kick on
whenever there's an L1 cache miss, so it was designed to decode only one x86
instruction per clock cycle. This is one third the maximum theoretical decode
bandwidth of the Athlon, but the P4's trace cache should allow it to meet or
exceed the Athlon's real-world average of 2.5 dispatched instructions per clock
cycle.
The trace cache's handling of very long, multicycle x86 instructions is worth
taking a look at, because it's quite clever. You probably already know that
while most x86 instructions decode into around 2 or 3 uops, there are some
exceedingly long (and thankfully rare) x86 instructions (i.e. the string
manipulation instructions) that decode into hundreds of uops. Like the Athlon,
the P4 has a special microcode ROM that processes these longer instructions
so that the regular hardware decoder can concentrate on decoding the
smaller, faster instructions. For each long instruction the microcode ROM
stores a canned sequence of uops, which it spits out when fed that instruction.
To keep these long, prepackaged sequences of uops from polluting the trace
cache, the P4's designers devised the following solution. Whenever the trace
cache is building a trace segment and it encounters one of the long x86
instructions, instead of breaking it down and storing it as a uop sequence it
inserts a tag into the trace segment that points to the section of the microcode
ROM containing the uop sequence for that particular instruction. Later, in
execute mode when the trace cache is streaming instructions out to the
execution engine and it encounters one of these tags, it stops and temporarily
hands control of the instruction stream over to the microcode ROM. The
microcode ROM spits out the proper sequence of uops (as designated by the
tag) into the instruction stream, and then hands control back over to the trace
cache, which resumes issuing instructions again. The execution engine, which
is on the other end of this instruction stream, doesn't know or care if the
instructions are coming from the trace cache or the microcode ROM. All it sees
is a constant, uninterrupted stream of instructions.
One criticism that has been leveled at the trace cache is that it's too small.
We're not sure exactly how big the I-cache is--only that it holds 12K uops.
Intel claims this is roughly equivalent to a 16K-18K I-cache. Since the trace
Copyright © 1998-2001 Ars Technica, LLC
20
http://arstechnica.com/cpu/01q2/p4andg4e/p4andg4e-1.html
cache functions so differently from a normal L1 instruction cache, however,
you've got to do a lot more work to understand how its size affects the P4's
overall performance than merely comparing its cache size to that of another
processor. Many of the most outspoken of the P4's critics haven't actually
done that work, and neither have I so I'll end my discussion of this topic here.
However, note that I will talk about the P4's L1 data cache and its impact on
performance at a later point. (This article contains a good discussion of the
P4's cache sizes and performance.)
By way of finishing up our discussion of the trace cache and introducing our
discussion of the P4's pipeline, I should note two final aspects of the trace
cache's effect on the pipeline. First, the trace cache still needs a short
Instruction Fetch stage so that uops can be fetched from the cache and sent to
the allocation and scheduling logic. When we look at the P4's basic execution
pipeline, you'll see this stage. Second, the trace cache actually has its own
little mini-BTB and BPU for predicting the directions and return addresses of
branches within the trace cache itself. So the trace cache doesn't eliminate
branch processing and prediction entirely from the picture. It just alleviates
their effects on performance.
Overview of the P4's architecture II: the pipeline
Now we're ready to step back and take a look at the P4's basic execution
pipeline. Before we begin, though, I should clarify something that might be
confusing some of you when you look at my diagrams and tables. The P4
considers the front end to be entirely in-order, with all of the scheduling,
rename, and other OOO logic relegated to the "back end." However, you
probably noticed that this division was sort of muddied with the G4e. The
G4e's literature actually considers the Issue Queues as part of the front end
and the Reservation Stations as part of the back end, so that the Issue stage
of the G4e's pipeline (which is where the OOO action happens) spans the front
end and the back end. (If you were confused and this cleared things up for
you, excellent. If you weren't confused before you read this but you are now,
just skip it and move on because it's not that important.)
Anyway, on to the pipeline. Here's a breakdown of the various stages:
Stages 1 and 2 - Trace Cache next Instruction Pointer: In these stages,
the P4's trace cache fetch logic gets a pointer to the next instruction in the
trace cache.
Stages 3 and 4 - Trace Cache Fetch: These two stages fetch an instruction
from the trace cache to be sent to the OOO execution engine.
Stage 5 - Drive: This is the first of two of Drive stages in the P4's pipeline,
each of which is dedicated to driving signals from one part of the processor to
the next. The P4 runs so fast that sometimes a signal can't make it all the way
to where it needs to be in a single clock pulse, so the P4 dedicates some
pipeline stages to letting these signals propagate across the chip. I've actually
Copyright © 1998-2001 Ars Technica, LLC
21
http://arstechnica.com/cpu/01q2/p4andg4e/p4andg4e-1.html
never seen a "Drive" stage in a pipeline before, and neither has anyone else
whose P4 write-ups I've read. I think this may be a first. It's definitely there
because the P4's designers intend for it to reach such stratospheric clock
speeds that stages like this are absolutely necessary.
Figure 7.1: Stages 1 through 5
Stages 6 through 8 - Allocate and Rename: This group of stages handles
the allocation of microarchitectural register resources. Most of you are
probably familiar with the use of register renaming as a trick for alleviating
register conflicts by having more registers in the microarchitecture than are
specified in the instruction set architecture (ISA). These extra
microarchitectural registers (the P4 has 128 of them) are allocated and put
into use in these steps.
The Allocator/Renamer can issue three uops per cycle to the next pipeline
stage.
Stage 9 - Queue: There are two main queues that sit between the
Allocator/Renamer and the scheduling logic, a memory uop queue and an
arithmetic uop queue. These queues are where uops wait before being sent off
to one of the four "dispatch ports" that act as gateways to the execution
engine's functional units.
Stages 10 through 12 - Schedule: In these stages, instructions pass from
the Allocator to one of four scheduling main scheduling queues. These queues,
roughly analogous to the G4e's three different issue queues, are where
operations for each individual functional unit (or group of related functional
units) are scheduled to go onstage and be executed. Here's a quote from an
Intel document that sums up the schedulers' functions:
The uop schedulers determine when a uop is ready to execute
by tracking its input register operands. This is the heart of the
out-of-order execution engine. The uop schedulers are what
allow the instructions to be reordered to execute as soon as
they are ready, while still maintaining the correct dependencies
from the original program. The NetBurst microarchitecture has
two sets of structures to aid in uop scheduling: the uop queues
Copyright © 1998-2001 Ars Technica, LLC
22
http://arstechnica.com/cpu/01q2/p4andg4e/p4andg4e-1.html
and the actual uop schedulers. ("The Microarchitecture of the
Pentium 4 Processor," p. 7)
Here's a breakdown of the four schedulers:
•
•
•
•
Memory Scheduler - Schedules memory operations for the
Load/Store Unit (LSU).
Fast ALU Scheduler - Schedules Arithmetic-Logic Unit operations
(simple integer and logical ops) for the the P4's two double-pumped
ALU units. As we'll see in Part II of this article, the P4 contains two
ALUs that run at twice the main core's clock speed.
Slow ALU/General FPU Scheduler - Schedules the rest of the ALU
functions and most of the floating-point functions.
Simple FP Scheduler - Schedules simple FP operations and FP
memory operations.
These schedulers share the four dispatch ports described in the next stage.
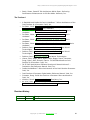
Figure 7.2: Stages 6 through 12
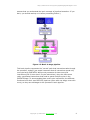
Stages 13 and 14 - Dispatch: In these two stages instructions travel
through one of the four dispatch ports for execution. These ports act sort of as
gateways to the actual execution units. Up to 6 uops total per cycle can travel
from the schedulers through the dispatch ports to the functional units. This is
more uops per cycle than the front end can execute (3 per cycle) or the back
end can retire (3 per cycle), but that's ok because it gives the machine some
headroom in its middle so that it can have bursts of activity.
Here's a diagram of the four dispatch ports and the types of instructions that
can be sent to them. If the schedulers were to be pictured below, they'd be
sitting above the four ports.
Copyright © 1998-2001 Ars Technica, LLC
23
http://arstechnica.com/cpu/01q2/p4andg4e/p4andg4e-1.html
Figure 7.3: Dispatch ports
Stages 15 and 16 - Register Files: After traveling through the dispatch
ports in the last two stages, the instructions spend these two stages being
loaded into the register files for execution.
Stage 17 - Execute: In this stage, the instructions are actually executed by
the execution engine's functional units. (Whew. It took us so long to get here I
feel like I should say more, but that's about it. If the instruction is an ADD,
some numbers are added; if it's a LOAD, some stuff is loaded; if it's a MUL,
some numbers are multiplied; etc... There's not much else to say).
Figure 7.4: Stages 13 through 17
Stage 18 - Flags: If the instruction's outcome stipulates that it needs to set
any flags, then it does so at this stage. (If you've done assembly language
programming then you know what flags are about. If you haven't, then this
stage isn't really important enough to warrant spending any time explaining
what they are.)
Stage 19 - Branch Check: Here's where the P4 checks the outcome of a
conditional branch to see if it has just wasted 19 cycles of its time executing
some code that it'll have to throw away. By Stage 19, the condition has been
Copyright © 1998-2001 Ars Technica, LLC
24
http://arstechnica.com/cpu/01q2/p4andg4e/p4andg4e-1.html
evaluated and the front end knows whether or not the branch predictor's
guess was right or not.
Stage 20 - Drive: We've already met the Drive stage. Again, this stage is
dedicated to propagating signals across the chip.
Figure 7.5: Stages 18 through 20
As you can see, the P4's 20-stage pipeline does much of the same work in
mostly the same order as the G4e's 7-stage pipeline. By dividing the pipeline
up into more stages, though, the P4 can reach higher clock rates. As we've
noted, this deeply pipelined approach fits with the P4's "narrow and deep"
design philosophy.
Conclusion to Part I
The previous discussion has provided a broad overview of both the P4 and the
G4e. It has also drilled down into some of the details of the two architectures,
with an eye to how those details fit within the bigger picture of what each
processor is trying to accomplish. The next part will look more closely at the
execution engines of the P4 and G4e; technologies like Altivec, SSE2, and the
P4's double-pumped ALU will be discussed. I'll also talk a bit in the next part
about system bandwidth issues, and how these impact overall system
performance.
Bibliography
The G4e
•
•
•
•
•
•
Chowela, John. The Motorola [7450] G4+ Processor Core -- Does it
Make the Cut? JC's News
MPC7450 Product Summary Page. Motorola, Inc.
Motorola's MCP7450 Fact Sheet. Motorola, Inc.
MPC7450 RISC Microprocessor User's Manual. Motorola, Inc.
MPC7450 RISC Microprocessor Technical Summary. Motorola, Inc.
Neal, Brian. "Motorola Introduces G4+" Ace's Hardware.
Copyright © 1998-2001 Ars Technica, LLC
25
http://arstechnica.com/cpu/01q2/p4andg4e/p4andg4e-1.html
•
Seale, Susan. PowerPC G4 Architecture White Paper: Delivering
Performance Enhancement in 60x Bus Mode. Motorola, Inc.
The Pentium 4
•
•
•
•
•
•
•
•
•
•
•
•
•
•
•
•
A Detailed Look Inside the Intel ® NetBurst ™ Micro-Architecture of the
Intel Pentium ® 4 Processor. Intel, Inc.
De Gelas, Johan. The Future of x86 Performance: Secrets of High
Performance CPUs, Part 6. Ace's Hardware
De Gelas, Johan. Mustang vs. Pentium 4: Design Decisions. Ace's
Hardware
De Gelas, Johan. Pentium 4 Architecture In Depth, Part 1. Ace's
Hardware
De Gelas, Johan. Pentium 4 Architecture In Depth, Part 2. Ace's
Hardware
De Gelas, Johan. Floating-Point Compiler Performance Analysis. Ace's
Hardware
DeMone, Paul. What's Up With Willamette? (Part 1). Real World
Technologies.
DeMone, Paul. What's Up With Willamette? (Part 2). Real World
Technologies.
DeMone, Paul. Willamette Update. Real World Technologies.
Hinton, Glen; Sager, Dave; Upton, Mike; Boggs, Darrel; Carmean,
Doug; Kyker, Alan; Roussel, Patrice. The Microarchitecture of the
Pentium ® 4 Processor. Intel, Inc.
IA-32 Intel Architecture Software Developer’s Manual Volume 2 Instruction Set Reference Manual. Intel, Inc.
Inside the NetBurst™ Micro-Architecture of the Intel Pentium Processor.
Intel, Inc.
Intel Pentium 4 Processor Optimization Reference Manual. Intel, Inc.
Carmean, Doug. Inside the Pentium 4 Processor Micro-architecture.
Intel, Inc.
Mihocka, Darek. Pentium 4: In Depth. Emulators, Inc.
de Vries, Hans. AMD's Mustang versus Intel's Willamette: A
Performance Analysis for High Tech Investors.
Revision History
Date
Version
Changes
7/4/2001
1.0
Release
Copyright © 1998-2001 Ars Technica, LLC
26
http://arstechnica.com/cpu/01q2/p4andg4e/p4andg4e-1.html
Appendix A: Figures
Figure 4.1: Basic Architecture of the G4e
Copyright © 1998-2001 Ars Technica, LLC
27
http://arstechnica.com/cpu/01q2/p4andg4e/p4andg4e-1.html
Figure 6.1: Basic Architecture of the P4
Copyright © 1998-2001 Ars Technica, LLC
28