1
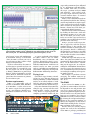
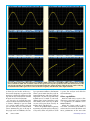
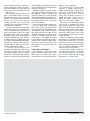
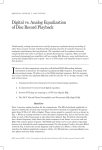
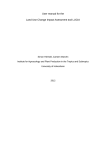
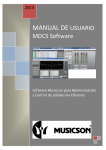
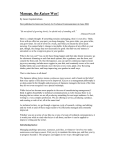
PC based virtual instrument software
By JIM ROWE
Virtins Technology
Multi-Instrument 3.2
Intrigued by the idea of using your PC as the engine for a suite of virtual
audio test instruments? Here’s a run-down on a powerful software
package that will let you use it as a 2-channel audio scope combined
with a powerful spectrum analyser, a 2-channel audio signal/function
generator and an audio DMM which even includes a frequency counter!
B
ack in the October 2011 issue
of SILICON CHIP, we explained how
to test common domestic audio gear
using a good-quality sound card with
your PC and running a virtual audio
test instrument package like TrueAudio’s TrueRTA.
While we found that TrueRTA has
many worthwhile features, including
the ability to make accurate frequency
response and noise level plots, it did
have a few limitations with regard to
things like distortion and crosstalk
measurements and plots.
Recently though, we became aware
of another software package called
16 Silicon Chip
Multi-Instrument 3.2, developed by
a Singapore-based firm called Virtins
Technology. Virtins has specialised
in PC-based virtual instrument technology since it was founded in the
early 1990s and in addition to the
Multi-Instrument software package,
it currently markets a range of virtual
DSOs together with its own real-time
audio analyser.
VMI 3.2 is the latest version of a
software package first released in late
2004, for use with PC sound cards.
It supports all Windows-compatible
sound cards and interfaces and Virtins’
own virtual instruments – plus many
industrial ADC/DAC cards like the
DAQmx series from National Instruments.
Like TrueRTA, an evaluation version
of VMI 3.2 can be downloaded free
from their website. In this case it’s a
fully-featured version which “expires”
after 21 days unless you buy a licence
from them online. There are three
performance levels which may be
purchased: “Lite” costing US$49.95,
“Standard” costing US$99.95 and
“Pro” costing US$199.95. There are
also various add-on functions, like a
Waterfall Plot/Spectrogram, Data Logger, LCR Meter and a Vibrometer, plus
siliconchip.com.au
an option which allows you to create,
save and execute a series of Device
Test Plans.
After downloading and trying out
the evaluation version of Virtins MultiInstrument 3.2 (VMI 3.2) for a week or
two, we were motivated to develop
the USB Virtual Instrument Interface
featured elsewhere in this issue.
A virtual instrument suite
In Standard form, VMI 3.2 is a suite
of the following virtual instruments:
• A 2-channel digital oscilloscope
with a bandwidth from below 10Hz to
96kHz, depending on the capabilities
for your sound card or ADC hardware.
The sampling depth can be 8, 16 or 24
bits, again depending on your sound
card. There are a range of triggering
modes and display modes such as A
and B, A + B, A - B, A x B and Lissajous
(A against B). Each frame of data can be
provided with a date/time stamp and
the data can also be recorded continuously on the PC’s hard disk.
• A 2-channel spectrum analyser with
a selection of seven different display
modes: amplitude/power spectrum,
phase spectrum, auto correlation and
cross correlation functions, coherence
function, transfer function (Bode plot)
and impulse response. The FFT window size can be selected from 16 different options, from 128 to 4,194,304
points, while there is a choice of no
less than 55 different windowing functions including rectangular, triangular,
Hanning, Hamming, Blackman, Gaussian, cosine, Poisson and so on.
The overlap between windows can
also be set to any desired percentage,
while there’s a choice of many different display and scaling options for
both the Y axis and the frequency axis.
Parameters which can be measured
using the spectrum analyser include
bandwidth, crosstalk, THD, THD+N,
SINAD, SNR and noise level (NL) in
a specified frequency band. It’s also
possible to measure IMD (SMPTE/
DIN, CCIF etc).
• A 2-channel digital signal generator, with a wide choice of waveforms
and associated functions. Waveforms
include sine, rectangle (with adjustable duty cycle), triangle, sawtooth
and multi-tones like DTMF. There’s
also a choice of white or pink noise,
maximal-length sequences with length
adjustable between 127 and 16,777,215
samples, unit impulse and unit step,
notes from the tempered musical scale
siliconchip.com.au
Fig.1: the main screen has four horizontal function bars along the top, with
icons to activate the scope, spectrum analyser, DMM and generator. Here, the
scope window is at upper left, with the analyser window below it. The smaller,
narrower window at lower right is for the signal generator.
and arbitrary waveforms (which may
be stored on hard disk).
In addition, the generator can be set
to provide any desired phase difference between the two output channels
and it can mask their outputs in order
to provide “burst” test signals. It can
also provide sinewave signals sweeping either linearly or logarithmically
between any two selected frequencies
and at any desired speed.
It’s also possible to set the exact
output frequency to a value which
minimises “spectral leakage” when
you are using the spectrum analyser.
• An AC multimeter able to display
RMS volts, dBV, dBu, dBrelative and
dBA/B/C, plus cycle RMS and cycle
mean. It can also function as a frequency counter, a tachometer (RPM), a
straight counter, a duty cycle indicator
and a frequency/voltage converter.
Calibration & compensation
VMI 3.2 also supports calibration
of the input and output channels of
your interface/sound card, so that
absolute values in engineering units
can be used for display, analysis or
export. It is also able to account for
external attenuator settings (such as
the input switch settings in the Virtual
Instrument Interface), as well as being able to compensate for hardware
characteristics such as the frequency
response deviations of the interface/
sound card. Once measured, these can
be saved as “reference curves” and
loaded in whenever they are needed.
Zooming and scrolling in both the X
and Y axes are supported in all graphs
displayed by the scope and spectrum
analyser, to allow inspection of fine
details. In any case, VMI 3.2 provides
a “cursor reader” for each graph, allowing you to determine the exact X
and Y readings for any specific point
just by clicking on it and holding the
mouse button down. There are also
two markers which can be set by double clicking, for comparison purposes.
Another nice feature of VMI 3.2 is a
row of 16 “hot panel setting” buttons
along the top of the screen. These are
pre-configured to set up all the instrument panel controls and settings for
specific tests. However you are free
to reconfigure any or all of these buttons as you wish, for your own mostfrequently performed tests. As part of
the reconfiguring, you are even able to
change the legend on the button being
“reprogrammed”.
It’s also quite easy to save any deSeptember 2012 17
Fig.2: the DMM function is displayed in its own window (shown here at upper
right) and this window can be adjusted for size and position on the screen. In
this screen grab, it is shown displaying the generator frequency in use.
sired screen layout and combination
of instrument settings as the default
“skin” for VMI 3.2 when you start it
up each time. In short, it offers a high
degree of customisation.
All data collected by the VMI 3.2
oscilloscope or spectrum analyser can
be saved, either as a wave file or a text
file. All graphs can also be exported
as bitmap (.BMP) files or printed out
directly. And waveform files saved in
either .WAV or .TXT form can be imported into the Generator to generate
that waveform again.
System requirements
VMI 3.2 is compatible with all
versions of Windows from Windows
95 to Windows 7, either 32-bit or 64bit. Virtins suggest that for optimum
results, your monitor should have a
horizontal resolution of at least 1024
pixels.
As you’ve no doubt gathered from
the above, VMI 3.2 has an almost
bewildering array of functions and
facilities. Fortunately, there is a 283page user manual which can be downloaded in PDF format. And there are
tutorial articles on FFT spectrum
analysis, including one on FFT basics
and another comparing the umpteen
different FFT windowing functions.
Trying it out
I installed a copy of VMI 3.2 Standard on an Acer AX1800 desktop PC
running Windows 7 Home Premium
(64-bit). It installed without a hitch
and very soon I was looking at a main
screen much like that shown in Fig.1.
It has four horizontal function bars
along the top, starting with the usual
Menu bar (File – Setting – Instrument
– etc). There’s a scope triggering and
sampling parameter toolbar for the
Issues Getting Dog-Eared?
Keep your copies of SILICON CHIP safe with these handy binders
Available Aust. only. Price: $A14.95 plus $10 p&p per order
(includes GST). Just fill in and mail the handy order form
in this issue; or fax (02) 9939 2648; or call (02) 9939 3295
and quote your credit card number.
Buy five and get them postage free!
18 Silicon Chip
REAL
VALUE
AT
$14.95
PLUS
P&P
scope and spectrum analyser, followed
by an “Instrument and Miscellaneous” toolbar with icons to activate
the scope, spectrum analyser, DMM
and generator – plus settings to adjust scope input sensitivity, take into
account whether there’s an external
input attenuator and so on.
There’s also a coloured bargraph on
the righthand end of this bar, showing
you the amplitude of any input signals
at the scope/analyser inputs. Finally,
there’s the row of “hot panel” toolbar
buttons, shown here with their preprogrammed default functions.
You activate the various instruments
by clicking on their icons, with each
instrument opening in its own window in the main part of the screen.
In the case of the scope and analyser
windows, you can adjust their size and
position in the usual way.
In Fig.1, you can see the scope window at upper left, with the analyser
window below it. The smaller and
narrower window at lower right is for
the generator, which is deliberately
designed to be as compact as possible
so that most of the screen is free for
you to make the other two windows
as large as possible.
Unlike the scope and analyser windows, the generator window can’t be
continuously adjusted in terms of size
but it can be truncated or “shrunk”
into just the upper 20% or so (by unticking the “Show Editor” button) once
you have set up the generator. In any
case, it automatically varies in terms of
screen height according to the operating mode selected.
For example, if you don’t activate
sweeping, the window contracts up
from the bottom to remove the bottom
20% or so.
The DMM
If you activate the DMM, it is displayed in its own window, which can
be adjusted in size and position. You
can see it at upper right in Fig.2, displaying the generator frequency in use.
Note that in this case, the generator has
been set to a frequency very close to
1kHz but not exactly so. This was done
by selecting the “No Spectral Leakage”
option in the generator window, to
change the frequency to that nearest
1kHz which would give the “sharpest”
FFT resolution in the analyser.
Because there are so many display
options for each of the instruments
in the VMI 3.2 package, providing for
siliconchip.com.au
Fig.3-6: these four screen grabs show a 1kHz sinewave, a 500Hz square-wave, a 500Hz sawtooth and a 500Hz triangular
wave, as generated by the VMI 3.2 software and displayed in the “scope” window on a PC.
their setting could easily take up a lot
of screen space and encroach into the
important data display area. But the
software designers have been clever,
because each of the main instrument
display windows (scope, spectrum
analyser and DMM) has its own “View
Parameter Toolbar”, which only appears along the bottom of the screen
when that instrument’s display window has been selected.
So if you select the scope window,
its parameter toolbar appears at the
bottom; select the analyser window
instead and its parameter toolbar
appears – that’s the one you can see
along the bottom of Fig.1. Similarly, if
you select the DMM window, its own
parameter toolbar is shown.
This makes it easy to adjust the
function and display parameters for
each instrument, without sacrificing
siliconchip.com.au
a lot of screen area. As you can see,
the spectrum analyser’s parameter
toolbar allows you to adjust many
of the important parameters, most of
them via pop-up menus (which again
minimises screen space).
Before we leave Fig.1, I should perhaps explain the displays that you can
see in the three instrument windows.
In this case, VMI 3.2 had been set up
to do an overall frequency response
and inter-channel crosstalk test of my
new USB Virtual Instrument Interface,
with a short cable looping the channel
A generator output back to the channel A input and the channel B input
terminated in a shielded 50Ω resistor.
As you can see, the generator was
set to produce sinewaves of 0.5V RMS,
sweeping linearly from 1Hz to 23.5kHz
over a period of 20 seconds. Up at the
top you can see that the scope and
analyser were set to sample both input
channels (A&B) at 48kHz and 16 bits,
for a total record length of 655,360
points – which, if you work it out,
takes 13.6 seconds (655,360 ÷ 48,000).
Down in the bottom analyser toolbar,
you can see that an FFT size of 32,768
had been selected, resulting in a total
of 20 FFT segments (655,350 ÷ 32,768)
and an analyser frequency resolution of
1.46484Hz (48,000 ÷ 32,768). A rectangular window was also selected, with
no overlap between windows.
Aliasing effects
I should comment on the strange
display in the upper scope window;
for this kind of test, it is badly affected
by aliasing because of the way the
signal is sweeping between 1Hz and
22.3kHz over the sweep period. But
the spectrum analyser display below
September 2012 19
Fig.7-12: these scope grabs show sinewaves at 10kHz & 20Hz; square waves at 100Hz & 10Hz; a triangle wave at 20Hz;
and a sawtooth at 10Hz. The overshoot visible on the square wave signals is probably due to the characteristics of the
anti-aliasing LP filter in the USB Virtual Test Instrument Interface output channels while the droop visible at the top
and bottom of the 10Hz square wave is due to the low frequency roll-off in the same output channels.
it shows the real results of the test –
the overall frequency response of the
Interface’s channel A in blue near the
top and the crosstalk into the channel
B input in red near the bottom.
It’s not easy to read off the exact
values of either curve from the display
as shown, although if you use VMI
3.2’s cursor reader facility you can
get it to show the exact value of both
curves numerically, just at the top of
the graph itself. In addition, the ana20 Silicon Chip
lyser parameter toolbar at the bottom
allows you to zoom into the graph in
terms of frequency and also in terms of
amplitude – so you can expand either
or both curves as much as you need,
shifting along to any frequency range
and shifting each curve up or down
so you can inspect them visually in
minute detail. Not bad, eh?
There’s no problem about exporting
or printing any of the analyser displays
at any time, either. All you have to do
is pause the analyser and click the
relevant buttons.
Other capabilities
Now let’s look at Fig.2 again, as this
illustrates a few more aspects of VMI
3.2’s capabilities (in addition to the
DMM window).
When this screen grab (ie, Fig.2)
was taken, I had been using VMI 3.2
to measure the overall distortion and
noise performance of the new USB
siliconchip.com.au
Test Instrument Interface’s channel A
output and input at 1kHz. As before,
these were linked via a short cable and
the channel B input terminated with
a 50Ω resistor.
The generator had been set to produce a 999.024Hz sinewave of 0.5V
RMS and the analyser to take 500,000
samples per record. The FFT size had
been set to 16,384, with a Kaiser6
window function. This gave 30 FFT
segments per record and a frequency
resolution of 2.92969Hz.
Again you shouldn’t take too much
notice of the upper scope window, because it’s showing the severely aliased
display of 500,000 samples of a 1kHz
waveform taken over 10.4 seconds.
But there’s quite a deal of information
to be gleaned from the lower analyser
window, because just before the grab
was taken I had zoomed the horizontal
frequency axis by five times and then
moved along to show just the range
between 800Hz and 3.5kHz.
As a result, you can clearly see the
fundamental peak of the 1kHz generator signal, together with the second
and third harmonic peaks generated by
distortion in the USB Test Instrument
Interface’s channel A output and input
siliconchip.com.au
Composite
circuitry (blue graph). You can also see
the crosstalk into the channel B input
circuitry (red graph).
Above the graphs, the analyser displays the calculated THD (0.0279%)
and THD+N (0.0720%) figures for
channel A (blue text), along with the
SINAD, SNR and NL. It also does these
calculations for channel B but these are
not important because they represent
crosstalk distortion.
Since I had placed the reading cursor at the 1kHz peaks (vertical red
line on the graphs), the analyser has
also calculated the amplitude of the
fundamental peaks in both channels
and displayed them in dBu on the
third line from the top. The channel
A peak is -8.00dBu, while the channel B peak is -88.99dBu. You don’t
have to subtract one from the other to
work out the crosstalk at 1kHz either,
because the analyser does that as well
and displays it at the end of the line
(-80.99dB).
Generator waveforms
The remaining screen grabs from
VMI 3.2 and the accompanying scope
grabs (Figs.7-12) indicate the variety
C
M
Y
CM MY CY
of waveforms that can be delivered by
VMI 3.2’s signal generator.
For example, Figs.3-6 show a 1kHz
sinewave, a 500Hz square-wave, a
500Hz sawtooth and a 500Hz triangular wave, as displayed on VMI 3.2’s
own scope. Figs.7-12 are a series of
scope grabs showing sinewaves at
10kHz and 20Hz; square waves at
100Hz and 10Hz; a triangle wave at
20Hz; and a sawtooth at 10Hz.
The overshoot visible on the square
wave signals is probably due to the
characteristics of the anti-aliasing LP
filter in the USB Virtual Test Instrument Interface output channel, while
the droop visible on the top and bottom of the 10Hz square wave is due
to low-frequency roll-off in the same
output channels.
There’s no doubt that Virtins Multi
Instrument 3.2 is capable of delivering
professional-grade results, especially
if you were to use it with the highest
quality ADC and DAC interface hardware. It’s extremely flexible, yet at the
same time quite user friendly.
Overall, Virtins VMI 3.2 represents
excellent value for money – especially
the Standard version at its current
price of only US$99.95. For further
CMY K
SC
information, see virtins.com
September 2012 21