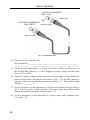
1
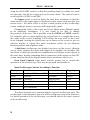
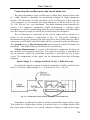
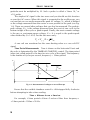
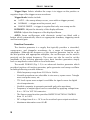
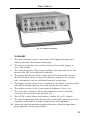
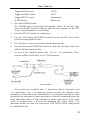
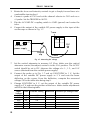
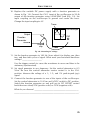
Khalil Ismailov ELECTRONICS LABORATORY MANUAL Qafqaz University Press Baku, 2011 ELECTRONICS LABORATORY MANUAL Prepared by Kh.A. Ismailov, Professor Department of Computer Engineering, Qafqaz University Reviewed by A.Z. Melikov, Professor Associate Member of the National Academy of Sciences of Azerbaijan Republic, The Institute of Cybernetics of the National Academy of Sciences of Azerbaijan Republic Reviewed by A.Z. Adamov, PhD Department of Computer Engineering, Qafqaz University Design Sahib Kazimov Is printed as a publication of Qafqaz University by the proposal of the Publishing Committee dated from 06.12.2010 (minute No 7) and decision of the Senate dated from 15.12.2010 (minute No Ç-QU-15000-000.100) Book is printed by “Sharg-Garb” Publishing House. Tel: (+994 12) 374 83 43, 374 75 62 Copyright Qafqaz University, 2011 Copyright Khalil Ismailov, 2011 Qafqaz University Press No: 45 Baku, 2011 CONTENTS PREFACE SAFETY Introduction Current Hazards and Voltage Safety Precautions Neat Working Area In Case of Electrical Shock INSTRUCTIONS FOR ELECTRONICS LABORATORY Organization Purpose and Procedure Grading Equipment Handling General Tips 5 6 6 6 7 7 8 8 8 9 10 10 EXPERIMENT 1. Oscilloscope and Function Generator Operation EXPERIMENT 2. Diode Characteristics EXPERIMENT 3. Half-Wave and Full-Wave Rectification EXPERIMENT 4. Zener Diodes EXPERIMENT 5. Light-Emitting Diodes EXPERIMENT 6. Bipolar-Junction Transistor EXPERIMENT 7. Junction Field-Effect Transistor EXPERIMENT 8. Op-Amp Characteristics EXPERIMENT 9. Linear Op-Amp Circuits EXPERIMENT 10. Electronic Hobby Circuits 11 29 38 55 69 78 94 109 120 133 REFERENCES 168 APPENDIX A Important electrical units, abbreviations and symbols APPENDIX B Using the Metric System to Help Some Familiar Metrics APPENDIX C Resistor Color Coding APPENDIX D Capacitor Color Coding APPENDIX E General Purpose NPN and PNP Transistors APPENDIX F JFET Transistors APPENDIX G Useful Electronics Sites 169 170 171 173 174 177 179 PREFACE The experiments in this laboratory course are designed to cover the theoretical and analytical materials in “Electronics”. Each experiment begins with a set of stated objectives, text references, and required equipment, followed by a procedure for meeting each objective. The objective of the experiments is to enhance the students’ understanding of important analytical principles developed in this course by engaging them in the real-world application of these principles in the laboratory. In addition to further develop the students’ laboratory practice for experimentally testing and evaluating electrical circuits. Preparing the lab is very important as it will save time and allows working more efficiently. The pre-lab includes reading the lab assignment in advance, and doing the pre-lab assignment specific to each lab experiment. All pre-lab assignments have to be handed in with the main lab report at the beginning of the class. The manual is designed as an individualized learning package and involves the student in the activities of learning. Many illustrations and line drawings are used to familiarize the student with circuit recognition and analysis, since, this is an important part of being a good electronics technician. Each unit follows the same format so that the person using the book can become accustomed to the learning procedure. The basic experiments are given on how to test the device and verify its theory of operation. Fill-in questions are given at the end of each experiment to emphasize the important points gained from performing the experiment. This manual contains several appendixes at the end. The students is encouraged to become familiar with the contents of the appendixes early. Appendix A covers descriptions of important electrical units, abbreviations and symbols. Using the Metric System to Help Some Familiar Metrics is provided in Appendix B. The information about resistor and capacitor color coding is provided in Appendices C and D. Appendices E and F covers product descriptions and pin configuration of general purpose NPN/PNP transistors and N-/P-channel FET transistors. A list of useful electronics sites is provided in Appendix G. 5 Khalil Ismailov SAFETY Introduction The experiments in this manual do not use a voltage greater than 30V (or ±15V); therefore, the chance of getting an electrical shock is greatly reduced. However, all voltages do have the potential to burn materials and start fires, to destroy electronic components, and present hazards to the person performing the operations. Common sense and an awareness of electrical circuits is important whenever you are working on these experiments. Before actual work is performed, sufficient instruction should be acquired in the proper use and safety requirements of all electronic devices. Current Hazards and Voltage Safety Precautions It takes a very small amount of current to pass through the human body from an electrical shock to injure a person severely or fatally. The 50-Hz current values affecting the human body are as follows: Current value 1 mA (0.001 A) 10 mA (0.01 A) 100 mA (0.1 A) Over 100 mA Effects Tingling or mild sensation. A shock of sufficient intensity to cause involuntary control of muscles, so that a person cannot let go of an electrical conductor. A shock of this type lasting for 1 second is sufficient to cause a crippling effect or even death. An extremely severe shock that may cause ventricular fibrillation, where a change in the rhythm of the heartbeat causes death almost instantaneously. The resistance of the human body varies from about 500,000 Ω when dry to about 300 Ω when wet (including the effects of perspiration). In this case, voltages as low as 30 V can cause sufficient current to be fatal (I=voltage / wet resistance=30 V/300 Ω=100 mA). Even though the actual voltage of a circuit being worked on is low enough not to present a very hazardous situation, the equipment being used to power and test the circuit (i.e., power supply, signal generator, meters, oscilloscopes) is usually operated on 220 V AC. To minimize the chance of getting shocked, a person should use only one hand while making voltage measurements, keeping the other hand at the side of the body, in the lap, or behind the body. Do not defeat the safety feature (fuse, circuit breaker, interlock switch) of any electrical device by shorting across it or by using a higher amperage rating than that specified by the manufacturer. These safety devices are intended to protect both the user and the equipment. 6 Elecrtronics Neat Working Area A neat working area requires a careful and deliberate approach when setting it up. Test equipment and tools should be set out on the workbench in a neat and orderly manner. Connecting wires from the test equipment to the circuit under test should be placed so as not to interfere with testing procedures. Before power is applied to a circuit, the area around the circuit should be cleared of extra wires, components, hand tools, and debris (cut wire and insulation). In Case of Electrical Shock When a person comes in contact with an electrical circuit of sufficient voltage to cause shock, certain steps should be taken as outlined in the following procedure: 1. Quickly remove the victim from the source of electricity by means of a switch, circuit breaker, pulling the cord, or cutting the wires with a wellinsulated tool. 2. It may be faster to separate the victim from the electrical circuit by using a dry stick, rope, leather belt, coat, blanket, or any other nonconducting material. CAUTION: Do not touch the victim or the electrical circuit unless the power is off. 3. Call for assistance, since other persons may be more knowledgeable in treating the victim or can call for professional medical help while first aid is being given. 4. Check the victim’s breathing and heartbeat. 5. If breathing has stopped but the victim's pulse is detectable, give mouthto-mouth resuscitation until medical help arrives. 6. If the heartbeat has stopped, use cardiopulmonary resuscitation, but only if you are trained in the proper technique. 7. If both breathing and heartbeat have stopped, alternate between mouthto-mouth resuscitation and cardiopulmonary resuscitation (but only if you are trained). 8. Use blankets or coats to keep the victim warm and raise the legs slightly above head level to help prevent shock. 9. If the victim has burns, cover your mouth and nostrils with gauze or a clean handkerchief to avoid breathing germs on the victim and then wrap the burned areas of the victim firmly with sterile gauze or a clean cloth. 10. In any case, do not just stand there – do something within your ability to give the victim some first aid. 7 Khalil Ismailov INSTRUCTIONS FOR ELECTRONICS LABORATORY Organization The laboratory work is a group activity. Students will be divided into groups of two or three. All members of a group are expected to be present and participate in conducting an experiment with as much equal contribution as possible. All members of a group are expected to come prepared, and complete the work within the scheduled laboratory period with their laboratory partners. No individual member and no individual group will be allowed to do an experiment outside the scheduled times except under extenuating circumstances and only with the consent of the instructor. Purpose and Procedure The purpose of this course is to cultivate in the student a degree of independence in carrying out an engineering task. The burden (and reward) of success is the student's, not the instructor’s. The student will perform specific electronic experiments as indicated by handouts for each experiment. These handouts are generally specific but leave much room for independent approaches. In the lectures background and motivating material and a certain degree of guidance for the experiments will be given; but the exact experimental set-up or diagrams will not be given. This is the responsibility of the student. The instructor (or the teaching assistant of the laboratory session) may give a moderate degree of specific guidance, mainly by asking the student pertinent questions to direct the student onto a correct path. He will do this only after the student has demonstrated substantial serious effort to solve the problem. The student should not expect to receive from the lab instructor exact circuit diagrams. The instructor will, however, point out errors in diagrams or hook-ups as far as this can reasonably be done. The grade given to the student for the experiment will partly depend on the degree of independence of the student. If everything else fails, the instructor will provide a good diagram, but this will be done at a severe penalty in the grading. Contrary to popular belief, most of the work must be done by the student before he or she comes to the laboratory. One should study the problems using common sense and any required textbooks and/or reference books. One must prepare a complete procedure for the experimental work including alternatives and must know what components and equipment are needed and allow for substitution if the first choice is not available. One must study the 8 Elecrtronics problem before coming to the laboratory so that the general trend of results is anticipated. This will make it possible to recognize "nonsense" results and correct the experimental procedure. Unnoticed wrong results will be considered worse than incomplete results in the grading, since the theory and the laboratory is available to the student to validate results. Each student must have a laboratory manual. The manual will contain the preliminary work done as well as the complete work plan for the experiment. It will also contain every test and check made, all in-lab computations, modifications of circuit or procedure, and results. The instructor may examine the work done and grade the preliminary during the lab periods. A concise, but complete, neatly prepared final report for each experiment by each member of the group must be handed in to the instructor within one week after the completion of the experiment. It is expected that the circuits, design calculations and data to be the same for two reports written by the members of the same group. But, this cannot be used to justify near identical reports to be submitted. Particularly, discussions, comments, conclusions and the overall style should reflect individual contribution and originality. A good presentation is clear, concise, and informative. It makes good use of graphics, has good writing style and presents ideas in a nice logical sequence. Some longer experiments will be allowed to be completed in two weeks. A quiz may be given at the beginning of each experiment. The instructor will give some overall guidance at the beginning. The work plans will be checked in the laboratory and graded. In summary the student’s endeavors will include: 1. Preparation of work plans for each experiment based on independent reading and analysis, and lecture suggestions. 2. Preparation for and taking of lab quizzes. (Note that preparation of a good work plan will aid in quiz preparation. 3. Conducting of the actual experiments in the laboratory. 4. Preparation of a final report for each experiment. Grading Grades will be assigned over the following categories with the indicated weights (approximately): Lab reports: 25% Preliminary work/design 50% Experiment and participation 25% Discussions/Conclusions NO LAB EXPERIMENT OR ITS REPORT MAY BE SKIPPED. LATE REPORTS LOSE 50% PER WEEK, COMPOUNDED. 9 Khalil Ismailov Equipment Handling Never take for granted that the equipment or components are in good condition. Always check all equipment before you start the experiment. Make certain the power supply has ripple free output voltage and that the oscilloscope has the correct gain in the ranges of interest. Check all diodes and transistors with an ohm-meter. Make sure resistors and potentiometers are close to the indicated value. Make sure that capacitors are not shorted, nor opened. In case of equipment failure, keep the malfunctioning equipment on your bench; do not swap equipment from other benches. Equipment sets are assigned to groups. Do not attempt to repair malfunctioning equipment. Do not even replace fuses. Call the lab instructor/technician for appropriate action. General Tips When something doesn’t work as you expect, be skeptical about all facets of your design, fabrication and test of the circuit. Although test equipment may fail from time to time, problems are almost always due to errors in design, documentation or wiring; faulty components occasionally; or a misunderstanding of how to use the test equipment. In the laboratory the experimenter interacts with natural phenomena which tend to be brutally honest and unforgiving in evaluating a poorly thought out experiment. Group interactions can be difficult; but Engineering is inherently a discipline requiring much team effort. Thus, the skills developed in working effectively in a grouped environment are quite important. It is the responsibility of each student to create an effective group where everyone contributes substantially. 10 Elecrtronics EXPERIMENT 1 OSCILLOSCOPE and FUNCTION GENERATOR OPERATION OBJECTIVES 1. 2. 3. 4. To understand the operation and use of an oscilloscope To learn to measure DC and AC voltages with the oscilloscope To use an oscilloscope to observe repetitive time varying waveforms To use a function generator to create repetitive waveforms BASIC INFORMATION The Oscilloscope The oscilloscope or “scope” as it is better known is one of the most versatile pieces of laboratory test equipment (Fig. 1.1). It is really a type of analog voltmeter with an arbitrary zero. It can read DC voltages as an offset voltage and as well as AC voltages by displaying the true wave form. Most modern oscilloscopes are capable of measuring AC signals over a wide range of frequencies. The heart of the oscilloscope is the cathode ray tube, which generates the electron beam, accelerates the beam to a high velocity, deflects the beam to create the image, and contains the phosphor screen where the electron beam eventually becomes visible. The electrons are called cathode rays because they are emitted by the cathode and this gives the oscilloscope its full name of cathode ray oscilloscope (CRO) or cathode ray tube (CRT) oscilloscope (Fig. 1.2). The electron beam emitted by the heated cathode at the rear end of the tube is accelerated and focused by one or more anodes, and strikes the front of the tube, producing a bright spot on the phosphorescent screen. 11 Khalil Ismailov Fig. 1.1. Cathode Ray Oscilloscope The heart of the oscilloscope is the cathode ray tube, which generates the electron beam, accelerates the beam to a high velocity, deflects the beam to create the image, and contains the phosphor screen where the electron beam eventually becomes visible. The electrons are called cathode rays because they are emitted by the cathode and this gives the oscilloscope its full name of cathode ray oscilloscope (CRO) or cathode ray tube (CRT) oscilloscope (Fig. 1.2). The electron beam emitted by the heated cathode at the rear end of the tube is accelerated and focused by one or more anodes, and strikes the front of the tube, producing a bright spot on the phosphorescent screen. The electron beam is bent, or deflected, by voltages applied to two sets of plates fixed in the tube. The horizontal deflection plates, or X-plates produce side to side movement. As you can see, they are linked to a system block called the time base. This produces a sawtooth waveform. During the rising phase of the sawtooth, the spot is driven at a uniform rate from left to right across the front of the screen. During the falling phase, the electron beam returns rapidly from right or left, but the spot is “blanked out” so that nothing appears on the screen. Although the oscilloscope can eventually be used to display practically any parameter, the input to the oscilloscope is voltage. In this way, the time base generates the X-axis of the V/t graph. The general laboratory oscilloscope can accept as low as a few millivolts per centimeter of deflection up to hundred of volts using the built-in attenuator and external probes. 12 Elecrtronics TIME/DIV X-POS Time base waveform Spot move across screen Y 0 t Spot Spot blanked out during flyback Trigger Time base Heater CH1 SIGNAL INPUT AC/DC switch Cathode Anodes Y-amplifier Signal waveform Y-plates X-plates Cathode ray tube Y 0 Electron beem t VOLTS/DIV SCREEN Y-POS Fig. 1.2. Cathode Ray Oscilloscope block-diagram The slope of the rising phase varies with the frequency of the sawtooth and can be adjusted, using the TIME/DIV control, to change the scale of the Xaxis. Dividing the oscilloscope screen into squares allows the horizontal scale to be expressed in seconds, milliseconds or microseconds per division (s/DIV, ms/DIV, µs/DIV). Alternatively, if the squares are 1 cm apart, the scale may be given as s/cm, ms/cm or µs/cm. The vertical input also will have a switch for AC or DC input signals. When the AC/DC switch is in the DC position, the probe is connected directly to the Y-amplifier. When the switch is in the AC position, there is a coupling capacitor between the probe and the amplifiers. The reason to allow the measurement of low-level AC signals which may be on the same wire as a high-level DC voltage. If the probe is connected directly to the amplifiers, the scope trace moves on the scale an amount equal to the voltage applied. If this voltage is a high voltage, say 100 V the vertical attenuator must be set to an insensitive position in order for the trace not to be deflected beyond the viewable portion of the screen. With the vertical sensitivity thus set, a small AC signal on the same wire could not be measured, when the vertical input switch is in the AC position, a capacitor blocks the direct current from reaching the amplifiers. With the direct current blocked, the vertical sensitivity can be set so the AC signal can be easily seen and measured. The Y-amplifier is linked in turn to a pair of Y-plates so that it provides the Y-axis of the V/t graph. The overall gain of the Y-amplifier can be adjusted, 13 Khalil Ismailov using the VOLTS/DIV control, so that the resulting display is neither too small nor too large, but fits the screen and can be seen clearly. The vertical scale is usually given in V/DIV or mV/DIV. The trigger circuit is used to delay the time base waveform so that the same section of the input signal is displayed on the screen each time the spot moves across. The effect of this is to give a stable picture on the oscilloscope screen, making it easier to measure and interpret the signal. Changing the scales of the X-axis and Y-axis allows many different signals to be displayed. Sometimes, it is also useful to be able to change the positions of the axes. This is possible using the X-POS and Y-POS controls. For example, with no signal applied, the normal trace is a straight line across the centre of the screen. Adjusting Y-POS allows the zero level on the Y-axis to be changed, moving the whole trace up or down on the screen to give an effective display of signals like pulse waveforms which do not alternate between positive and negative values. A dual trace oscilloscope can display two traces on the screen, allowing you to easily compare the input and output of an amplifier for example. The dual trace oscilloscope provides for amplification and display of two signals at the same time, thereby permitting direct comparison of the signals on the CRT screen (measure the phase displacement of two waveforms, and so on). Front Panel Controls Front panel controls permit you to control the operation of the oscilloscope. They may be grouped functionally as: Main Oscilloscope Controls According to Function Display Intensity Focus Beam Finder Vertical Coupling (AC-Ground-DC) Volts/Div Y-position Channel Select Magnification Cal (Calibrated) Horizontal Time base (Sec/Div) X-position Magnification Cal (Calibrated) Triggering Coupling Source Level Slope Mode The above function set is summarized for a typical oscilloscope only. The oscilloscope in the laboratory that you will be using may have more functions. For detail operation of the oscilloscope, you should refer to the user’s manual of the oscilloscope. 14 Elecrtronics Connecting the oscilloscope to the circuit under test The input impedance of an oscilloscope is rather high, being on the order of 1 MΩ, which is desirable for measuring voltages in high impedance circuits. The attenuator sets the sensitivity of the oscilloscope in the common 1-2-5 sequence. As an example, the input attenuator could provide for 10, 20, 50, 100, 200 mV, etc., per centimeter. The input attenuator must provide the correct 1-2-5 sequence attenuation while maintaining a constant input impedance, as well as maintaining both the input impedance and attenuation over the frequency range for which the oscilloscope was designed. The oscilloscope is connected to the circuit under test by means of a probe (or set of probes) as illustrated in Fig. 1.3. The probe includes a measurement tip and a ground clip and connects to the oscilloscope by a BNC connector via a flexible, shielded cable which is grounded at the oscilloscope. This ground serves as the reference point with respect to which all signals are measured. The shield helps guard electrical noise pick up. Voltage Measurements A screen is divided into centimeter divisions in the vertical and horizontal directions. The vertical sensitivity is provided (or set) in volts/cm, while the horizontal sensitivity is provided (or set) in time (s/cm). The magnitude of the signal can be determined from the following equation: Signal voltage Vs = voltage sensitivity (V/cm) × deflection (cm) If a particular signal occupies 6 vertical centimeters and the vertical sensitivity is 5 mV/cm, signal voltage Vs = (5 mV/cm) (6 cm) = 30 mV. Fig. 1.3. Connection of the oscilloscope to the circuit under test Sometimes an attenuator probe is used to expand the range of the scope. This probe has a high-value resistor in it which acts as a voltage divider with the scope input resistance. As a result, whatever voltage is read on the scope 15 Khalil Ismailov graticule must be multiplied by 10. Such a probe is called a “times 10,” or ×10, probe. The simplest AC signal is the sine wave and you should use this function as your first AC source. When this signal is connected to the oscilloscope, you can see that you can easily measure the peak AC voltage, Vp, which is defined as the voltage measured from the center or zero position to the peak (see Fig. 1.4). There are several other voltages that can also be measured. The peak-topeak voltage, Vp-p, is the voltage measured from the crest of one cycle to the bottom trough of the cycle or peak-to-peak. Finally, the most common voltage is the rms or root-mean-square voltage, Vrms. It is equal to the peak-to-peak value divided by (2×1.414). For the sine wave only: Vp = Vp − p / 2 = 2Vrms A one volt rms waveform has the same heating value as a one volt DC signal. Time Period Measurements Time is shown on the horizontal X-axis and the scale is determined by the TIMEBASE (TIME/DIV) control. The time period (often just called period) is the time for one cycle of the signal. The frequency is the number of cycles per second, frequency = 1/time period. v Vp Vrms 0 t Vp-p T Fig. 1.4. Measurement of voltages on an oscilloscope Ensure that the variable timebase control is click-stopped fully clockwise before attempting to take a time reading. Time = distance in cm × time/cm For example, if time period=4.0cm×5 ms/cm=20ms then frequency= =1/time period=1/20ms=50 Hz. 16 Elecrtronics Functional descriptions of an oscilloscope OS-5020: Coupling (AC-GND-DC): Permits selection of coupling of the input channel. When set to DC, the entire signal (AC plus any DC components) is displayed. When set to AC, DC signals are blocked by a capacitor and only AC is displayed. When set to ground, the input channel is isolated from the input source and is grounded internally. VOLTS/DIV: This is the scope’s vertical sensitivity control. It is a calibrated control that establishes how many volts each major vertical scale division represents. For example, when it is set for 1 V/DIV, each grid line represents 1 volt. Each channel has its own independent VOLTS/DIV control. CAL.: This is the fine adjust control, usually located in the inner of the VOLTS/DIV knob. When this knob is turned to the fully clockwise direction, it is at the calibrated location (the normal position of this knob) for the outer knob setting, i.e., the vertical scale of the scope is defined by the VOLTS/DIV knob. When the CAL. knob is turned away from the calibrated position, the waveform displayed in the scope will start to be attenuated. Vertical POSITION: This is the vertical position control. Each channel has its own control. It moves the trace up or down for easier observation. It is not calibrated. Channel Select: Permits displaying CH1, CH2, both channels, their sum or difference. Timebase (V MODE): This is a calibrated control that selects how many seconds each major horizontal division represents. It is calibrated in s, ms, and µs. One control handles all channels. There is also CAL. knob for the time base. The CAL. knob is located at the inner of the TIME/DIV knob. Its operation is similar to that of the previous one for the VOLTS/DIV. Magnification: For both CAL. knobs of the VOLTS/DIV and TIME/DIV, the CAL. Knob also acts as the magnification switch. The magnification is ×5 or ×10 with the knob pulled out. Horizontal POSITION: Positions the trace horizontally. One control handles all channels. Trigger Source: Selects the trigger source, e.g., CH1, CH2, an external trigger, or the AC power line. Trigger Level: Permits you to adjust the point on the trigger source waveform where you like the triggering to start. 17 Khalil Ismailov Trigger Slope: Selects whether the scope is to trigger on the positive or negative slope of the trigger source waveform. Trigger Mode: Modes include AUTO – the sweep always occurs, even with no trigger present, NORMAL – a trigger must be present, and SINGLE SWEEP – a trigger is required but only one sweep results. INTENSITY: Adjusts the intensity of the displayed beam. FOCUS: Adjusts the sharpness of the displayed beam. AUTO: Some oscilloscopes with electronic control are fitted with a button which automatically selects an appropriate timebase, triggering mode and horizontal gain. Function Generator The function generator is a supply that typically provides a sinusoidal, square-wave, and triangular waveforms for a range of frequencies and amplitudes. Although the frequency of the function generator can be set by the dial position and appropriate multiplier, the oscilloscope can be used to precisely set the output frequency. The scope can also be used to set the amplitude of the function generator since most function generators simply have an amplitude control with no level indicators. The model FG-8002 (Fig. 1.5) is an advanced function generator which provides functions of function generator, pulse generator and sweep oscillator including following versatile features: - 18 Wide frequency range from 0.02 Hz to 2 MHz. Versatile waveforms are selectable in sine wave, square wave. Triangle wave and pulse wave, etc. TTL level square wave output is available for signal source for digital circuit experiments. Variable symmetry to generate sawtooth and pulse waveform Frequency of output signal can be controlled by applying voltage from 0 to +10 V to VCF IN connector. The linear sweep function provides SWEEP FUNCTION CONTROL from 1:1 to 100:1. DC voltage from 0 to +10 V can be overload upon output waveform Maximum attenuation over 40 dB. Elecrtronics Fig. 1.5 Function Generator SUMMARY The most common scope in use today is the triggered-sweep scope. Older scopes were the recurrent sweep type. 2. The typical scope has four sections: vertical; horizontal; trigger, or sync; and display. 3. The vertical section of the scope conditions the input and causes the beam in the CRT to be deflected vertically. 4. The horizontal section of the scope controls the horizontal sweep of the CRT electron beam. It causes the beam to sweep at an accurate rate, so frequency can be calculated from the sweep time. 5. The trigger section of the scope controls how the beam is synchronized with the incoming signal to cause the waveform to be stable. 6. The display section of the scope controls brightness, focus, etc. 7. The scope has controls to allow adjustment of vertical sensitivity, vertical and horizontal beam position, etc. 8. The AC-DC switch allows the display of either AC or DC signals. 9. The function generator typically provides a sinusoidal, square-wave, and triangular waveform for a range of frequencies and amplitudes. 10. Advanced function generator provides functions of function generator, pulse generator and sweep oscillator. 1. 19 Khalil Ismailov SELF-TEST Check your understanding of the introductory information by answering the following questions. 1. What is the purpose of the horizontal time-base section? 2. Why is the AC-DC switch setting important when you are making lowlevel AC measurements? 3. The term attenuate means what? 4. What are the four sections of the scope? 5. What kind of waveforms is provided by the function generator? 6. What are the functions of the advanced function generators? MATERIALS REQUIRED • • • Oscilloscope (OS-5020) Variable DC power supply (GP-4303TP) Function generator (FG-8002) PROCEDURE Setting up an oscilloscope Before placing the instrument in use, set up and check the instrument as follows: 1. 20 Set the following controls as indicated. POWER Switch INTEN Control FOCUS Control AC/GND/DC Switch VOLTS/DIV Switch ×5MAG Switch Vertical POSITION Controls INV Switch VARIABLE Controls V MODE Switch TIME/DIV Switch VARIABLE Control Horizontal POSITION Control ×10MAG Switch OFF (released) Mid rotation Mid rotation DC 10 mV ×1 Mid rotation Norm Fully CCW CH1 1 ms CAL Mid rotation ×1 Elecrtronics Trigger MODE Switch Trigger SOURCE Switch Trigger LEVEL Control SLOPE Switch AUTO VERT Mid rotation Button out 2. Press the POWER Switch. The POWER lamp should light immediately. About 30 seconds later, rotate the INTEN. Control clockwise until the trace appears on the CRT screen. Adjust brightness to your liking. 3. Turn the FOCUS Control for a sharp trace. 4. Turn the CH1 Vertical POSITION Control to move the CH1 trace to the center horizontal graticule line. 5. See if the trace is precisely parallel with the graticule line. 6. Turn the Horizontal POSITION Control to align the left edge of the trace with the left most graticule line. 7. Set one of the supplied probes (Fig. 1.6) for ×10 attenuation. Then, connect its BNC end to the CH1 or X IN Connector. Fig. 1.6. Probe Scope probes are available with ×1 attenuation (direct connection) and ×10 attenuation. The ×10 attenuator probes increase the effective input impedance of the probe/scope combination to 10 megohms shunted by a few picofarads, the reduction in input capacitance is the most important reason for using attenuator probes at high frequencies, where capacitance is the major factor in loading down a circuit and distorting the signal. When ×10 attenuator probes are used, the scale factor (VOLTS/DIV switch setting) must be multiplied by ten. 21 Khalil Ismailov Single-trace Operation The OS-5020 is set up for single-trace operation as follows: 1. Set the following controls as indicated below. Note that the trigger source selected (CH1 or CH2 SOURCE) must match the single channel selected. (CH1 or CH2 V-MODE) POWER switch ON (pushed in) AC/GND/DC switches AC Vertical POSITION controls Mid rotation VARIABLE controls Fully CW V MODE switch CH1 (CH2) VARIABLE control CAL Trigger MODE switch AUTO Trigger SOURCE switch VERT Trigger LEVEL control Mid rotation 2. 3. 4. 5. Use the corresponding Vertical POSITION control or to set the trace near mid screen. Connect the signal to be observed to the corresponding IN connector and adjust the corresponding VOLTS/DIV switch or so the displayed signal is totally on screen. CAUTION> Do not apply a signal greater than 400 V (DC + peak AC) Set the TIME/DIV switch so the desired number of signal cycles are displayed. Adjust the Trigger LEVEL control if necessary for a stable display. If the signal you wish to observe is either DC or low enough in frequency, the AC coupling will attenuate or distort the signal. So, flip the AC/GND/DC switch or to DC. Dual-trace Operation Dual trace operation is the major operating mode of the OS-5020. The setup for dual trace operation is identical to that of single trace operation with the following exceptions: 1. Set the V MODE switch to either DUAL. Select ALT for relatively high frequency signals (TIME/DIV switch set to 0.5 ms or faster). Select CHOP for relatively low frequency signals (TIME/DIV switch set to 1 ms or slower). 2. If both channels are displayed in signals of the same frequency, set the Trigger SOURCE switch to the channel having the steepest-slope waveform. If the signals are different but harmonically related, trigger from the channel carrying the lowest frequency. Also, remember that if you disconnect the channel serving as the trigger source, the entire display will free run. 22 Elecrtronics Setting up a Function Generator 1. 2. 3. 4. 5. 6. 7. 8. 9. Pressing POWER Switch turns on power. POWER Lamp light up when power is on. Connect BNC end of the clip probe to the OUTPUT 50 Ω BNC socket. The lead is connected with a push and twist action, to disconnect you need to twist and pull. Push on of three knobs of FUNCTION Selector to get a desired waveform out of sine wave, triangle wave and square wave. Amplitude of output signal can be controlled by AMPLITUDE/PULL–20 dB knob. Maximum attenuation is more than 20 dB when the knob is rotated fully counterclockwise. Pulling this knob makes attenuation of 20 dB, so the output signal can be attenuated by 40 dB when this is pulled and rotated fully counterclockwise. Frequency range (Seven ranges: 1 – 0.02 Hz to 2 Hz, 10 – 2 Hz to 20 Hz, 100 – 20 Hz to 200 Hz, 1k – 200 Hz to 2 kHz, 10k – 2 kHz to 20 kHz, 100k – 20 kHz to 200 kHz, 1M – 200 kHz to 2 MHz,) is selected by FREQUENCY RANGE Selector. Output frequency within the selected range is varied by the Frequency Dial potentiometer. Sweep width is controlled by SWEEP WIDTH/PULL ON Control. Pulling the knob selects internal sweep and rotating it controls sweep width. Rotate it counterclockwise to get a minimum sweep width (1:1) and rotate it clockwise to get a maximum sweep width (100:1). To get a maximum sweep width, set the frequency dial to minimum scale (below 0.2 scale). Sweep rate (sweep frequency) of internal sweep oscillator is controlled by SWEEP RATE Control. Symmetry (duty cycle) of output signal waveform within range of 10:1 to 1:10 is controlled by SYMMETRY Control. The DC OFFSET control knob may be used to offset the waveform above or below ground (0 volts) by a DC voltage in the range ±10 volts. To adjust the DC level pull out the OFFSET control knob then turn slowly CW (positive volts) or CCW (negative volts). If the OFFSET knob is pushed in, there is no DC level, but only AC voltage exists in the output signal. Measurements 1. 2. Plug the power cable of the oscilloscope into the socket outlet in the bench. Practice setting up the scope to get a trace on the screen. Move the trace around. Work with all the controls until you understand their functions. 23 Khalil Ismailov 3. 4. 5. 6. Rotate the focus and intensity controls to get a sharply focused trace at a comfortable viewing level. Connect a probe to CH1 and set the channel selector to CH1 and use a ×1 probe. Set the TRIGGER to AUTO. Flip the AC-GND-DC coupling switch to GND (ground) and center the trace. Connect the output of the variable DC power supply to the input of the oscilloscope as shown in Fig. 1.7. Trace +V CH1 Variable DC power supply –V Ground clip Probe Fig. 1.7. Measuring DC voltage 7. 8. 9. Set the vertical attenuator to measure 0.5 V/cm. Make sure the vertical attenuator vernier (fine-adjust) control is in the CAL. position. The AC-DC switch should be set to DC. Measure the voltage of a 1-, 1.5-, and 2-V source (obtained from the variable power supply). Connect the probe as in Fig. 1.7 and set VIOLTS/DIV to 1 V. Set the output of the variable DC power supply to 2 V and note the beam deflection on the screen. From the deflection, compute the measured voltage. Fill in the table after doing step 9. Change VOLTS/DIV to 2 V, set the output of the variable DC power supply to 5 V and note the position of the trace. Make similar adjustments and fill in the following table. Input Voltage 2V 5V 15 V 10 V 15 V 22.5 V 24 Probe Volts/Div Setting ×1 ×1 ×1 ×10 ×10 ×10 1V 2V 5V Deflection Oscilloscope Voltage Value Elecrtronics 10. Replace the variable DC power supply with a function generator as shown in Fig. 1.8. Connect the CH 1 input of the oscilloscope to 50 Ω output of the function generator using a BNC-BNC lead (Fig. 1.9). Set input coupling on the oscilloscope to ground and center the trace. Change the input coupling to AC. Trace Oscilloscope Output Function Generator Ground CH1 Ground clip Probe Fig. 1.8. Measuring AC voltage 11. Set the function generator to 100 Hz. Now adjust it to display one, then two, and then four cycles of signal. What were your horizontal time-base settings? ___________________ . Use the trigger controls to cause the waveforms to move and then to be stationary (synchronized). 12. Set signal generator to any frequency. Set the vertical attenuator to 0.5 V/cm. Be sure the vertical attenuator vernier control is in the CAL. position. Measure the voltage of a 1-, 1.5-, and 2-V peak-to-peak (p-p) signal. 13. Connect the function generator to one of the inputs of the oscilloscope. Set the vertical attenuator to 10 V/cm and AC-DC switch to DC position. Switch the function generator on and pull out its DC OFFSET control knob then turn slowly CW (positive volts) or CCW (negative volts). What do you observe? ___________________________________________ _______________________________________________________________. 25 Khalil Ismailov OSCILLOSCOPE INPUT BNC Socket BNC plug CH1 FUNCTION GENERATOR 50 Ω OUTPUT Push and rotate Push and rotate Fig. 1.9. BNC-BNC lead 14. Flip the AC-DC switch to AC. What happens?_________________________________________________ ______________________________________________________________. 15. Set the function generator to a 2 kHz sine wave. On the oscilloscope, set the VOLTS/DIV switch to 1 V, the Trigger to positive slope, and the time base to 0.1 ms/Div. 16. Adjust the output voltage of the generator until you get a nicely sized sine wave on the screen. Record the waveform in Fig. 1.10. Set the Trigger to negative slope and record the waveform in Fig. 1.11. The peak to peak voltage is: ________ V. 17. Set the frequency of the generator to 500 Hz and change the time base to get 2 cycles on the screen (actually a bit more than two). Record the waveform and the time base setting in Fig. 1.12. 18. Set the waveform of the generator to square wave and complete Figs. 1.13 and 1.14. 26 Elecrtronics Volts/Div = Time base = Volts/Div = Fig. 1.10. Positive trigger Volts/Div = Time base = Fig. 1.11. Negative trigger Time base = Fig. 1.12. Waveform recording Volts/Div = Time base = Fig. 1.13. Positive trigger Volts/Div = Time base = Fig. 1.14. Negative trigger 27 Khalil Ismailov QUESTIONS 1. 2. 3. Is the time-base setting important when you are measuring direct current? Explain. How the magnitude of the signal is determined when you take measurements of voltage from the screen? If the vertical sensitivity is increased, it takes more signal to deflect the beam (true/false). Answers to Self-Test 1. 2. 3. 4. 5. 6. 28 To make the beam sweep across the CRT at a regular, predictable rate. This, in turn, allows for accurate frequency measurements. If there is any direct current on the same line with the low-level alternating current and the scope is set in the DC position, the trace may be detected off the screen. To keep the trace on the screen, the vertical attenuator must be set so insensitively as to make the low-level alternating current immeasurable. To make smaller. Vertical, horizontal, sync, and display. Sinusoidal, square-wave, and triangular waveforms for a range of frequencies and amplitudes. Function generator, pulse generator and sweep oscillator.