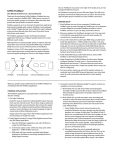
1
Calibrating your DAW Studio
Use this procedure if your studio is centered around a Digital Audio Workstation
(DAW).
We are first going to calibrate your signal path, then test your speakers and verify that
the room acoustics are all OK.
1)
Read this manual!!
2)
You may need to get these tools:
a. Multimeter with true RMS wideband response. The RadioShack 22-174A is a
good choice for under $100.
b. Sound Level Meter. For basic work the Radio Shack 22-2050 is a good choice.
For more advanced work look at the Gold Line SPL120.
c. Polarity Analyzer. The Gold line APT2 and the Galaxy Audio Cricket are good
options
d. Real Time Spectrum Analyzer (RTA). The Gold Line DSP30 and the TerraSonde
AudioToolbox are worth the investment.
e. Your ears, freshly cleaned. What more can we say?!
3)
Import Tones: The CD has a number of AIFF tones in the CD-ROM section. Import
those into your DAW. Some of the tones are single channel, and you will be
assigning those to the appropriate output, per the instructions in each section
below. Others are already stereo signals, and you will simply play those out.
4)
Set levels: We begin calibrating your studio by ensuring that the input and output
levels of your audio equipment are set uniformly.
Do this: Play the 1kHz, -20dBfs “0dBr” level set up tone [filename:
T05_Sine_1k_3m.aif]. Assign it to your system’s main Left and Right line outputs.
Verify that the meter levels register at -20dBfs (which we will also call 0dBr) on the
meters. The meters in rms mode may register –23dB, and that is normal. All the test
tones in this disc were set up to correspond to the rms value of a 1 kHz tone at –
20dBfs. We’re going to use a sound level meter on some of the tests, and all the
levels should come out the same once everything is calibrated. The levels should
also register at –20dBfs on the meter of your I/O interfaces.
Next, set the output gain level of your I/O interface so that the electric level is at
your studio operating level. Most studios that run balanced connections are set up
at 1.228Volts (+4dBu), and most studios with unbalanced connections run at 245mV
(-10dBu). Of course, you can choose the level that best suits your needs.
MSR, Inc. 61 Galli Drive, Suite A, Novato, CA94949 USA
[email protected]
Toll free: 800 497 2087
Phone: 415 883 8053
Fax: (415) 883 8147
www.msr-inc.com
StudioPanel, CloudPanel, Bazorber, and SpringTrap are trademarks of MSR, Inc. © 2003 All Rights Reserved
Calibrating your DAW Studio
Set your multimeter to AC Volts, and measure at the following points:
a) Unbalanced Inputs and Outputs: Measure between the tip and the sleeve of the
connector. You can pull back the jacket or even use a Y-connector to probe the
signal points
b) Balanced Inputs and Outputs: Measure between XLR pins 2 and 3, or for TRS
connectors between tip and ring.
Next, we will set the input gain level of your I/O interface. Patch the analog output
you just calibrated to each input, one at a time, using the appropriate cable. Set the
gain of the inputs so that the meters register at –20dBfs. On some systems you can
set the hardware input gain while looking at meters on the interface, and on other
systems you can only use software meters. Certain systems provide a calibration
mode that gives you better accuracy. Refer to your DAW manufacturer calibration
instructions for the correct procedure.
Note: Some digital devices (i.e. digital mixers, multi-track recorders, etc) come set
to –18dBfs or –16dBfs. Consult the user manual for each to find out how to ensure
they are set to –20dBfs.
5)
Check frequency response of your electronics: This step ensures that your
electronics have a flat response, that none of your equipment has a faulty
throughput, and that your wiring is good.
Do this: Play the 20Hz to 20kHz sweep Tone [filename: T19_Sweep_2020kHz_.5s.aif]. Feed it to your line outputs as above. The levels on the workstation
meters should remain the same as in Step 4 through all the tones on the sweep. The
frequencies in the sweep are easy to figure out. There is a step increment every
second, and the steps follow standard ISO 1/3rd octave spacing (20, 31.5, 40, 50, 63,
80, 100, 125, 160, 200, 250, 315, 400, 500, 630, 800, 1 k, 1.25 k, 1.6 k, 2 k, 2.5 k, 3.15 k, 4
k, 5 k, 8 k, 10 k, 12.5 k, 16 k, 20 kHz). So, using a stopwatch or counting seconds,
you can figure out what frequency you are hearing. You can use a wideband AC
voltmeter to check that the signals at the outputs are consistent throughout the
sweep. You can also check that the signals at the loudspeaker terminals are even.
Frequency response errors are very audible, and, ideally, all points in the sweep
will pass through your system with less than 1dB variation across the range of
frequencies. In case you were wondering what 1dB really is, here’s the formula:
Variation (in dB) = 20 log (measured level / level at 1kHz).
If you have a scientific calculator you can easily figure out the results. If you have a
2
Calibrating your DAW Studio
Windows PC, the calculator application, which is under Accessories, can also be
switched to a scientific mode by selection under the “view” menu item. For those of
you who want the simple way out, here are some simple equations:
+1dB value = Reference value x 1.122
-1dB value = Reference value x 0.891
The table below will give you some more example variation ranges
-1dB
1.094V
218mV
2.50V
Target Level
1.228V (+4dBu)
245mV
2.80V (1 watt into 8Ω)
+1dB
1.375V
275mV
3.14V
Set the multimeter to AC Volts, and measure at the following points:
a) Unbalanced Inputs and Outputs: Measure between the tip and the sleeve of the
connector. You can pull back the jacket or even use a Y-connector to probe the
signal points
b) Balanced Inputs and Outputs: Measure between XLR pins 2 and 3, or for TRS
connectors between tip and ring.
c) Speaker Terminals: Measure right across the speaker terminals with the speaker
connected.
Note: if you use a digital multimeter to check the levels of the various tones, you
might notice that the levels drop down above 1 kHz. That’s because very few low
cost digital multimeters are actually designed for wideband measurements. We
have found that RadioShack’s 22-174A rms meter, which costs under $100, works
pretty well up to 16 kHz.
You can also check frequency response by using pink noise and a spectrum
analyzer. Using the Pink Noise signal [filename: T06_Pink_L_20-20kHz_5m.aif] and
assigning it to the channel under test. Measure the response at various points in the
chain by using the line input of the spectrum analyzer. Included on your test disc is
a demo version of SIA SmaartLive, a powerful audio measurement and analysis
tool. Take a look at the demo, and read through the “Getting Started with
SmaartLive” document.
If your frequency response is irregular, you may want to verify that your wiring is
good, that your circuits are not defective, and that your console EQ settings are all
in the flat position.
3
Calibrating your DAW Studio
6)
Verify speaker polarity using test pulse: This step double-checks that even if your
wiring seems correct, that the polarity of the signal is consistent.
Let’s talk definitions: Most people call the way you hook up the + and – of a
speaker its Phase but more accurately it is its Polarity so we will use that term here.
It is very important for the speakers in your system to be correctly polarized.
Correct polarization means that a positive voltage going into the positive terminal
of your speakers makes the drivers move away from the center of the enclosure
(although on rare occasions the drivers are designed to move in toward it). All the
speakers in your system should be polarized identically, and the most effective way
to check that they are is to use a test pulse and a polarity tester. The Gold Line
APT2B, and the Galaxy Audio Cricket are two good tools for this use.
Do this: Play the Impulsive signals L&R test tone [filename:
T20_Impuse_APT2_2m.aif] and verify the acoustic polarity at each of the drive
units for your speakers. Note these down, and verify that they are respectively the
same for the Left/Right (and Center, Surrounds if present). If there is clearly a
problem with polarity, invert the speaker cables. If you are using active speakers
with balanced connections, verify that the balanced cables are correctly built (XLR
pins 2 and 3 are correct, or that the TRS connector tip and ring wires are correct).
7)
Verify speaker polarity using your ears: For those who don’t have a Polarity
tester, you can check the polarity this way. It is also a recommended step for those
who have a Polarity tester.
Do this: Use these tones:
[filename: T14_Pink_L+R_500-2kHz_1m.aif]
[filename: T15_Pink_Pulsed_500-2kHz_2m.aif]
[filename: T16_Pink_In_Out_500-2kHz_1m.aif]
[filename: T08_Pink_L+R_20-20kHz_3m.aif]
[filename: T09_Pink_L-R_20-20kHz_3m.aif]
[filename: T11_Pink_L+R_L-R_1m.aif]
a. Listen for a clear phantom center sound with the pulsed midrange pink noise
signal [T15]. The noise signal should appear to come from exactly between the
two speakers.
b. Then listen for the comparison in sound image between the two signals in the
midrange pink noise signal alternating between in-phase and out-of-phase
[T16]. The left and right channels are first in equal polarity, then switch to
inverse polarity, then back to equal polarity, etc. There should be an obvious
4
Calibrating your DAW Studio
“phantom center” when the signals are in equal polarity and an obvious hole in
the center when they are out of polarity.
c. Listen to the wideband pink noise signal in equal polarity in the two channels
[T8]. It should appear to come from exactly between the two speakers.
d. Listen to the wideband pink noise signal with the two channels in opposite
polarity [T9]; the sound image should present an obvious hole in the middle.
e. Listen for the comparison in sound image between the two wideband pink
noise signals alternating between in-phase and out-of-phase [T11]. The left and
right channels are first in equal polarity, and then switch to inverse polarity,
then back to equal polarity, etc. There should be an obvious “phantom center”
when the signals are in equal polarity and an obvious hole when they are out of
polarity.
Note that the results will be harder to achieve with wideband pink noise [T8, T9,
T11] than with midrange pink noise [T15 and T16].
If there is clearly a problem with polarity, try inverting the speaker cables, first
trying the right channel.
If you are using active speakers with balanced connections, verify that the balanced
cables are correctly built (XLR pins 2 and 3 are correct, or that the TRS connector tip
and ring wires are correct).
If the sound images are vague, and the difference between “in” and “out” of
polarity are less than obvious, you might have one of many issues to correct:
a. The speakers may be wired wrong internally, with only a midrange or tweeter
being out of polarity.
b. The speakers may be too close to large acoustic objects, such as consoles, rack
units, or cabinetry and the sound reflections are affecting the image.
c. The room’s acoustic character may be causing an imbalance between the two
speakers.
d. The speaker/room interactions are causing differences in frequency or phase
response.
It’s time to experiment and work on troubleshooting. Try the next few steps, too.
8)
Aim your speakers: Monitors are somewhat directional. Aiming them right can
increase clarity and image.
Do this: Play the Pink Noise test tone [filename: T06_Pink_L_20-20kHz_5m.aif] and
assign it to the left channel output. Verify that the Left speaker properly covers the
entire work area. Move across the work zone and back to the producer seat (if you
5
Calibrating your DAW Studio
have one). Listen to the character of the pink noise. It shouldn’t change as you move
around. If the high end seems to fall off as you move off-axis, you might need to
aim the speaker more inward. If the speakers are mounted overhead, they may not
be aimed down enough and you may be missing midrange due to woofer/tweeter
crossover interactions. Spend some time making sure that you are mostly in the
middle of the radiation beam of your speakers.
Note that if the variations sound more like a “phasing” effect than a loss of mids or
highs, you have some room acoustic interactions, which are addressed in Section 16
below.
Repeat the test for the right speaker using the Pink Noise test tone assigned to the
right channel [filename T06_Pink_L_20-20kHz_5m.aif].
9)
Check Left speaker-room frequency response:
Do this: Play the Pink Noise test tone [filename: T06_Pink_L_20-20kHz_5m.aif] and
assign it to the left output. Measure the acoustic frequency response at the mix
position. You will need a high quality spectrum analyzer with arithmetic averaging
and at least 1/3rd octave resolution. The Gold Line DSP30 and the Terrasonde
AudioToolbox are good choices. The SIA SmaartLive program demo version on
your test CD can also come in handy here. Take a look at it, and read through the
“Getting Started with SmaartLive” document.
If you don’t have a spectrum analyzer, you can use the 1/3rd Octave Pink Noise test
tones [filenames: T21_Pink_20 Hz.aif to T50_Pink_16k Hz.aif]. These tones are
pink noise limited to a 1/3rd octave bandwidth. Each is recorded to yield the same
rms level electrically and should therefore yield identical Sound Pressure Level
(SPL). You can use a Sound level meter to measure the levels of each test tone and
write these levels down on graph paper. The Radio Shack 22-2050 meter is an OK
starting point for this test, but it is not very reliable below 60 Hz and above 8 kHz.
You may want to try something more sophisticated.
Note that you need to measure each speaker individually, regardless of whether
you are using an analyzer or sound level meter, so first mute the right channel and
measure the left.
For good performance, the variations in response across the frequency range should
fit in a ±3dB window in relation to the level at 1 kHz. You will probably find that, at
first, the errors are much larger than that.
What to do? First check that your speaker is, in fact, getting flat response signals.
Play the pink noise again, but this time check the signals at the speaker terminals
6
Calibrating your DAW Studio
using the line input of your analyzer. You may need to keep the monitor levels low
to avoid overloading the analyzer input. If the response is OK at the speaker
terminals, you should recheck the speaker in the nearfield. Try taking the speaker
off its base or off the console top, and putting it in the middle of the room on a
stand. Place the microphone 2-3 feet from the speaker, and measure the resulting
response. If it is really rough, you have either a defective speaker, or one that was
poorly designed. In either case, you may need to get a replacement.
If the speaker is OK in the nearfield, but continues to exhibit poor response once it
is back in its place and measured at the mix position, you have a few options:
a. Try moving the speaker 6 inches back, left, right, up, and/or down. (Have a
friend move the speaker while you listen at your mix position.) Does the
response get better – especially in the lower frequencies – at any of the
positions?
b. Try using equalization to compensate for the errors. Make sure the EQ is at
least 1/3rd octave resolution or a parametric type. Don’t apply equalization
above 1 kHz. Be gentle with the compensation curve. Pull down peaks, but
avoid trying to push up dips in the response.
10) Check Right speaker room frequency response:
Repeat all of the procedure in Step 8 above, but assigning the Pink Noise signal
[filename: T06_Pink_L_20-20kHz_5m.aif] to the Right channel output. Make sure
that the measured responses of the Left and Right speakers are similar once you
have finished placing and equalizing the speakers.
11) Compare the left and right speakers: Now that we’ve seen what our frequency
response looks like to a spectrum analyzer, let’s verify with our ears!
Do this: Use the L/R/L/R…Pink - 1 sec intervals signal [filename:
T10_Pink_L_R_L_R_2m.aif] to compare the results of your work in Sections 9 and
10. If everything worked out well, the sound of the pink noise should be nearly
identical as it switches from left-to-right-to-left, etc. If the sound is vastly different,
look at the response curves measured earlier and compare them in overlay mode.
(The Gold Line DSP30 has a mode called Multiplot that’s real handy for this
purpose.)
12) Check other speaker responses: If you have center and surround speakers in a
mutlichannel setup, you can use the above test methods and test tones to adjust
positions and equalization.
7
Calibrating your DAW Studio
13) Set levels of your monitoring system: Next, we must ensure that all speakers are
set to the same output level.
Do this: Use L channel 500Hz to 2kHz Filtered Pink Noise signal [filename:
T12_Pink_L_500-20kHz_1m.aif ] assigned to the Left output to verify and set the
level of the Left speaker. The levels of this test tone should be set for a reference
value. This notion of reference level is commonplace in film and video postproduction and might as well be standardized in music production, too. We
suggest going with the post-production standard of 85dB SPL (C-weighted, Slow
mode). You can use the Radio Shack 22-2050 sound level meter for this test. Hold
the meter at arm’s length over the seated position, at ear height. Make sure the
meter is the C-weighting mode, with Slow response.
Repeat the test and calibration for the Right speaker, using the same test signal
[filename: T12_Pink_L_500-20kHz_1m.aif ], and assigning to the Right channel
output.
14) Set level of your subwoofer: Now that we’ve set the output levels for the main
channels, we can set the output level for the subwoofer.
If you use a subwoofer, its acoustic level should be set to produce the same in-band
level as the Left and Right speakers.
Do this: For 2-Channel systems use the 40Hz to 80Hz band-limited Pink Noise signal
[filename: T17_Pink_L+R_40-80Hz_2m.aif]. Make sure it is playing out of the Left
and Right channels.
For 5.1-Channel systems, use the 40Hz to 80Hz band-limited Pink Noise in LFE signal
[filename: T17_Pink_LFE_40-80Hz_2m.aif]. Assign it to the LFE channel.
Adjust the subwoofer level for 85dB SPL (C-weighted, Slow mode), or whatever
reference level you chose for the left and right speakers. It’s a good idea to move
the sound level meter around the listening position to get an average level.
Note: The sound level meter’s reading will bounce around on this low frequency
test signal, so eyeball it for the middle of the swing.
8
Calibrating your DAW Studio
15) Set the subwoofer crossover point:
Choosing a subwoofer crossover frequency is actually a very complex discussion
that we are going to cover in brief. The frequency you choose depends upon how
low your speakers will play before their response rolls off, how loud they will play
low frequency information, and how the acoustics of the room affect each speaker
given its location in the room.
Do this: Setting your crossover frequency to 80 Hz is the best solution in most
cases. Note that most Home Theaters and 5.1 Channel audio set-ups are crossed
over at 80Hz; millions of people cant be wrong!
16) Set the polarity of your subwoofer: We must make sure that the polarity of the
subwoofer is set correctly to eliminate a hole in the crossover region.
Do this: Use the 1/3rd Octave Pink noise signals [filenames : T21_Pink_20 Hz.aif to
T31_Pink_200 Hz.aif] that corresponds to the crossover point you have chosen for
the subwoofer. Listen to it at the main seated position or measure it with a sound
level meter. Choose the polarity or phase setting that yields the loudest sound level.
You can also use an RTA (Real Time Analyzer) and set the control for the smoothest
measured response through the crossover region. With an RTA use the Pink Noise
signal [filename: T06_Pink_L_20-20kHz_5m.aif ] and assign it to the Left, Right or
Left and Right outputs.
17) Detect sound reflections:
Do this: Play the Pink Noise signal [filename: T06_Pink_L_20-20kHz_5m.aif ] and
assign it to the Left output. Move your head from left to right while at the mix
position. If you hear a change in the sound of the pink noise you may be hearing
the interactions between the direct sound and the reflected sound of the left wall. If
the sound is “phasey” and appears to be pitching up as you approach the left wall,
you need to apply absorption or diffusion treatments to the first reflection point.
If you have already installed a StudioPanel™ kit, you may need to verify that there
is a panel at the first reflection point. Hold a mirror flat against the left wall and
move it forward and backward until you see the left speaker in the mirror. The
mirror’s location is the first reflection point, which should be the center of an
absorber or diffuser.
Repeat this test for the vertical direction. Bop your heat up and down around the
mix location and listen for phasing of the sound. Again, verify that you have
treatments at the first reflection point on the ceiling. Of course, your console or
workstation desk will be a serious reflection surface, which is why it is good to
move the speakers back and away from it.
9
Calibrating your DAW Studio
Note: If you hear variations that sound more like a loss of mids or highs, this may
indicate that your speakers have a focused beam width and need to be aimed at the
mix position. See Section 8 above.
Repeat the whole series of tests for the right channel, assigning the test signal to the
right output and examining the effect of the right wall on the Right speaker.
18) Find your primary room bass standing waves: All rooms build up bass resonance,
resulting in uneven bass response.
All rooms will have a set of resonating frequencies in the bass region. If you don’t
deal with them, your mixes will be flawed because you aren’t hearing what’s really
on the track. To find the resonant frequencies (also known as standing waves or
room modes), use the 1/3rd Octave Pink noise signals [filenames : T21_Pink_20 Hz.aif
to T31_Pink_200 Hz.aif]. Listen and measure the sound levels at the corners of the
room. If you find serious level peaks, you most likely have resonance issues. Find
the loudest peak and try moving your seat position, your speaker positions, or your
subwoofer position to reduce the audibility of the peak at the mix location. Also,
the use of SpringTraps™ will reduce the problem
19) Check it all again: Now that you have calibrated everything, it is a good idea to
ensure that all the work you’ve done is correct.
Do this: Once you have set speaker response, levels, room acoustics, etc., go
through the sequence of tests in Section 7 - 12 again. Things should have gotten
better; imaging should be tighter, speaker responses should match better, and
overall sonic performance should be better than when you started.
20) Good job! You’re done!
10
Appendix
Test Tone Track List
Calibrating your DAW Studio
Here is a list of the various test signals on your test CD, and what you can do with them. Many
of these test tones were sourced from the 5.1 AudioToolkit DVD released by Gold Line. If you
want to go more in-depth with measurements and calibration of multichannel systems, we
highly recommend you acquire that DVD soon!
Track
1
2
3
4
5
6
7
8
9
10
11
Content
Introduction
Auralized Demonstrations - Original signal. This clean spoken word announcement will be used to
demonstrate the effect of room acoustics
Auralized Demonstrations - Sound in untreated room. This is the sound of the spoken word
announcement played in a 300ft2 room with no acoustic treatments
Auralized Demonstrations - Sound in room with StudioPanel. This is the spoken word
announcement played in the same 300ft2 room equipped with an SP664 kit
1kHz, -20dBfs “0dBr” level set up tones at -20dBfs L and R. Uses: Level calibration of a studio
system. Debugging of signal flow. Gain staging. See Section 4
L Pink Noise @ 0dBr. Uses: Set frequency response equalization of left speaker, using an RTA.
Detect comb-filters from sound reflections off the left wall, ceiling or floor. Aim the left speaker. See
Sections 5, 8, 9, and 16
R Pink Noise@ 0dBr. Uses: Set frequency response equalization of left speaker, using an RTA.
Detect comb-filters from sound reflections off the right wall, ceiling or floor. Aim the right speaker.
See Sections 5, 8, 10, and 16
L&R Pink @ -3dBr. Use: Listen for phantom center clarity. See Section 7.
L&-R Pink @ -3dBr. Use: Listen for “hole in the middle” between the Left and Right speakers. See
Section 7
L/R/L/R…Pink - 1 sec intervals @ 0dBr. Use: Compare the sound character of the Left and Right
speakers. See Section 11.
L&R/L&-R Pink Noise @ -3dBr switching once per second. Use: compare clarity of phantom image
and “hole in the middle” as polarity switches in and out. See Section 7.
12
L channel 500Hz to 2kHz Filtered Pink Noise @ 0dBr. Use: Set level of left channel. See Section 13.
13
R channel 500Hz to 2kHz Filtered Pink Noise @ 0dBr. Use: Set level of right channel. See Section 13.
L&R 500Hz to 2kHz Filtered Pink Noise @ -3dBr. Use: Listen to clarity of phantom center image.
See Section 7.
L&R 500Hz to 2kHz Filtered Pink Noise Pulsed 1 second ON/1 second OFF@ -3dBr. Use: Listen to
clarity of phantom center image. See Section 7.
L&R/L&-R 500Hz to 2kHz Filtered Pink Noise @ -3dBr switching once per second. Use: compare
clarity of phantom image and “hole in the middle” as polarity switches in and out. See Section 7.
40Hz to 80Hz band-limited Pink Noise @ 0dBr. Use: set level of subwoofer to match the main
speakers. See Section 14.
“0” level set up tones, 1kHz, 0dBr (-20dBfs) L and R. Uses: Level calibration of a studio system.
Debugging of signal flow. Gain staging. Same as Track 5. See Section 4.
“0” level 20Hz to 20kHz sweep at 0dBr L and R. Uses: Verify frequency response of studio
electronics. Detect rattles in the room. Detect rubbing or buzzing speakers. See Section 5.
Impulsive signals L&R (Gold Line APT2). Use: Verify proper polarity (aka phase) of loudspeaker
systems. See Section 6.
1/3rd Octave Pink Noise @ 0dBr L & R. Frequencies: 20, 25, 31.5, 40, 50, 63, 80, 100, 125, 160, 200, 250,
315, 400, 500, 630, 800, 1k, 1.25k, 1.6k, 2k, 2.5k, 3.15k, 4k, 5k, 6.3k, 8k, 10k, 12.5k, 16kHz
Uses: Verify and adjust frequency response equalization, using a simple Sound Level Meter (See
Sections 9 and 10). Verify and adjust subwoofer polarity at the crossover frequency (See Section 16).
Listen to consistency of phantom center sound image throughout the frequency range..
14
15
16
17
18
19
20
21-50
11