1
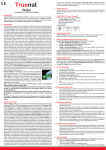
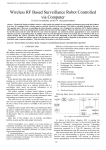
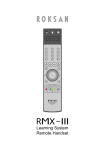
256
Proceedings of the International Conference on Information and Automation, December 15-18, 2005, Colombo, Sri Lanka.
Data Acquisition System for Hydro Power Plant
Operation and Maintenance Automation
Kamalanath Samarakoon*
*Mahaweli Hydro Power Complex
Ceylon Electricity Board, 40/20 Ampitiya Road, Kandy, Sri Lanka 20000
Email: [email protected]
Telephone: (94) 81-2499199
Abstract— In the hydropower plant operation and
maintenance, a large number of process variables are analyzed
prior to taking decisions. This necessitates automated data
acquisition systems since the manual methods of data collection
cannot provide the necessary resolution and accuracy. A vast
majority of hydro power plants in Sri Lanka do not posses
such facilities. It is not feasible to overhaul control systems
only to introduce data acquisition features. On the other hand,
off-the-shelf data acquisition systems have limited capabilities
and are also very expensive if it is tailor made. In this paper we
report successful design, development and implementation of a
data acquisition (DAQ) system for the hydro power plants of
the public power utility of Sri Lanka.
I.
H
INTRODUCTION
ydropower industry is one of the industries which
involves a large number of plants and equipment. A
large number of process variables and status
information is required for plant operation management and
maintenance automation. This data should be further
processed to take management decisions in operation and
reliability centered maintenance management activities [1].
As the first step towards the automation of such activities, it
is necessary to automate the acquisition of process variables.
Sri Lankan hydro power system comprises of power
plants built with different technologies prevailing at the
design and construction period, thus ranging from relay
logic controls to state-of-the-art PLC systems. At a majority
of power stations, the alarms and trip status are recorded
manually every minute and meter readings are recorded
every hour. The one minute reading accuracy of events is
not sufficient because a machine could be tripped within a
few seconds and hence sequence of events in chronological
order can not be recorded at all. Manually recorded
analogue measurements are kept in archives for reference
only, because the manual interpretation is an exhaustive
process. The accuracy of meter readings is also not
sufficient, as the point of change is not recorded and hence
these cannot be related to the other associated changes of
states.
The state-of-the-art technologies employ multiple
systems for data acquisition and automation purposes and
hence require separate systems for process monitoring,
history recording, fault recording and controlling purposes
etc. Each system comprises of hierarchically arranged sub
systems and those subsystems usually have more than one
processing unit. These systems are very expensive and
require complete replacement or major rehabilitation of the
existing control systems of hydro power plants. On the other
hand, off-the-shelf standalone systems that can be installed
in existing plants without overhauling the control systems
usually have specific functionalities such as Digital Fault
Recording (DFR) etc. Such systems are not capable of
acquiring a large number of process variables continuously
at a slow sampling rate. They usually capture a window of
state changes before and after a fault.
As a developing country, it is not cost effective to replace
or rehabilitate all the plants with modern control systems
with in-built data acquisition features, but it is still required
to collect the process parameters on line for fault analysis,
history recording, and trend analysis for effective operation
and maintenance management of the power plants.
The unavailability of suitable low cost DAQ solution for
our needs and the availability of commercial PC systems
which have very high processing power and are of low cost
urged us to explore the possibility of developing such a
system in-house. The developed system comprises of
commercially available industrial computers and interfacing
hardware, in-house developed signal conditioning and
monitoring hardware and in-house developed software. The
implemented systems usually comprise of about 800 digital
inputs and about 100 analogue inputs per station. The time
accuracy of digital inputs is 1ms and that of analogue inputs
can be varied between 1 second to 1 minute. This accuracy
is quite sufficient for data acquisition and controlling
purposes. This system has extra digital and analogue
channels and can be easily upgraded. Therefore any number
of additional inputs can be connected to investigate
257
Proceedings of the International Conference on Information and Automation, December 15-18, 2005, Colombo, Sri Lanka.
intermittent faults - a type of faults where diagnosis is
extremely difficult. The paper also reports the problems
encountered and solutions given in the harsh environment
encountered in power plants with high magnetic
interference, variable contact bounces, different control
voltages and inadvertent human interference etc.
This system is presently installed in all the power plants
of Mahaweli Hydro Power Complex, of Ceylon Electricity
Board. [2], [3]
circuits. Each card can accommodate 48 channels. While the
circuitry remains the same, the components of each card can
be varied depending on the input signal. By varying the
components four different types of digital isolator cards
were fabricated for the input DC voltages of 220V, 48V,
24V and 5V. In isolator card shown in Fig. 2, R0 is for
current limiting and R and C makes a noise filter and D is
the reverse voltage protection for the optocoupler. The
optocoupler isolates the field input from the PC interfacing
cards and the computer.
The RC low pass filter of analogue filter card shown in
Fig.3 suppresses the power frequency magnetic interference,
II. HARDWARE FOR DIGITAL AND ANALOGUE INPUTS
DAQ Isolater
(48 Channels)
DAQ Isolater
(48 Channels)
DAQ Isolater
DAQ Isolater
(48 Channels)
(48 Channels)
OMEGA
CIO DIO 192
(192 Channels)
Shielded Ribbon Cable
Industrial PC
OMEGA
CIO DAS 48
(48 Channels)
Shielded Ribbon Cable
DAQ Filter
(48 Channels)
V
V
+Vcc
Analogue IP
Transducer
A
Rec
Iin=0-5,10,20mA
Analogue
Analogue
IP Card
Analogue
IP(12
Card
Analogue
Ch)
IP Card
(12 Ch)
IP Card
(12 Ch)
(12 Ch)
Digital
Digital
IP Card
Digital
IP Card
(12Ch)
IP Digital
Card
(12Ch)
IP Card
(12Ch)
(12Ch)
+Vcc
Digital IP
Vin=220,48,24,5 Vdc,
-Vcc
Fig1. DAQ System Block Diagram
The system comprises of two types of off-the-shelf
electronic PC interfacing cards, two types of in-house
developed signal conditioning cards and two types of input
protection cards. One set is for digital inputs and the other
set is for analogue inputs and they are connected as shown
in Fig.1. The digital card is capable of capturing 192 digital
signals [4] and the analogue card is capable of capturing 24
or 48 analogue inputs depending on the configuration [5].
Number of digital and analogue cards varies from station to
station according to the requirement.
The Isolator Card for optical isolation of digital inputs
and the Filter Card for filtering magnetic interference at
power frequency were developed as signal conditioning
5V
Rh
DAQIsolator Card
R0
OMEGADIO192
2.2k (pull up)
Digital IP
Card
To PC
R
C
D
Fig. 2. Digital input configuration
which is a common occurrence in power plants. Also R acts
as the current to voltage converter so that PC-interface card
gets a voltage input. Filter cards were developed for input
signals of 20mA, 10mA and 5mA.
258
Proceedings of the International Conference on Information and Automation, December 15-18, 2005, Colombo, Sri Lanka.
III. HARDWARE FOR WATCHDOG – MONITOR CARD
Rh
OMEGADAS48
DAQFilter Card
R0
V
Transducer
AnalogueIP
Card
R
A/D/Converter
C
ToPC
Fig. 3. Analogue input configuration
Analogue and digital input cards were developed to
ensure the safety of the existing circuits of power station
with 12 channels per card. The digital input card which is
connected immediately after the connecting point comprises
of a high power resistor that acts as a current limiter even in
the short circuit condition and also as a voltage divider so
that the output voltage is low enough to be handled by the
next signal conditioning circuit.
The analogue input card has a zener diode, which
prevents the current transducer from being open circuited.
In such an event, the zener diode will break down and
original circuit of the power plant will not be disturbed. Due
to this, the interference made to the existing system is
minimal and a malfunction of the DAQ system will not
disturb any control function of the plant.
DAQ monitor card monitors the healthy operation of the
DAQ system and sends an interrupt signals to DAQ monitor
software to re-launch the stopped software or warm boot the
whole operating system. If both attempts fail, it will alarm
the operators.
The circuit has three similar sections to monitor the state
of the DAQ System as shown in Fig. 4. Each section
comprises of two re-triggerable mono-stable configurations.
One is waiting for at least one input pulse (to give output
high) and other is looking for the absence of an input pulse
for a given period of time to give the output high. The
output of the next stage is disabled until it receives at least
one pulse from the previous stage.
The first section is monitoring a pulse train coming from
computer through an output channel of the PC-interface
card. The scanning loop of the DAQCapture software sends
a pulse at each loop to indicate that the capturing is going
on. When first pulse is received from the digital card, the
state of the monitoring card changes to the Booted state. The
mono-stable is at an unstable state and is not allowed to
reach a stable state, as it is re-triggered by every subsequent
pulse. In the absence of the pulse, the first stage waits for T1
seconds and send an output pulse to re-launch the software.
Restart Pulse
Serial Port Driver
RS232 Port
Reboot Pulse
Alarm Signal
Alarm Interface
To Annunciation System
Booted
Stage 3
Alarm Module
Reboot Pulse
System Enabled
Stage 2
Rebbot Module
Booted
Booted
Restart Pulse
System Enabled
Stage 1
Restart Module
System Enabled
Input Pulse
Power On Reset Module
Fig 4. DAQ Monitor block diagram
The PC-interface cads and signal conditioning cards are
kept at close proximity to each other and they are connected
using screened cables so that the magnetic interference is
kept minimal.
The same pulse triggers the second mono-stable. That signal
changes the system state to Restarted state and waits T2 sec
before giving the output. If it receives the Booted signal
before giving the output, then it changes to the normal state.
The output of the second stage will change the third stage to
Rebooted state where it waits T3 sec before alarming the
operation staff through normal power plant annunciation
system. During that period it looks for "Booted" signal and
259
Proceedings of the International Conference on Information and Automation, December 15-18, 2005, Colombo, Sri Lanka.
if it receives this, the system changes to normal state
without alarming. The waiting times T1, T2, T3 are preset
considering the time taken for each operation.
tests, 13ms was used as a typical value of bounce for most
of the relays and later modified by considering the number
of bounces registered in the event list.
The re-launch, warm boot and cold boot signals are given
to DAQ PC through serial port to the monitor software,
which monitors the healthy operation of the system.
IV. SOFTWARE
Three essential software applications run continuously
and simultaneously for the operation of the DAQ system.
The DAQ capture program runs in a continuous loop,
polling all the input ports and recording any change of the
input. The information of state changes and periodically
captured analogue data are stored in the memory (RAM).
When the inputs are free from state changes for a predefined
period, it quickly flushes the data in RAM memory to the
magnetic memory (hard disk) as a random access file. The
DAQConverter, which is looking at the hard disk for new
data files, will convert the data in this file and write it into a
database. The third software is the DAQMonitor, which acts
as a watchdog to monitor the status of the DAQ system and
restart the software or restart the PC or alarm the operators
when required.
Additional software - the DAQMMI is used to display the
captured information in both text form and graphical form.
The DAQConfig is used to configure the ports and inputs.
The DAQIPCheck is a test program, which displays the
status of every port online. This program is used during the
system configuration.
V. DESIGN DETAILS
Most of the power plant control systems comprise of
relay logic and these relays have contact bounces for a
period of about 10 –100ms. Typical characteristics taken
from a high speed data recorder is shown in Fig 5. Normal
annunciation systems have inbuilt time delay of about 50ms,
to alarm operator only for persistent alarms and also have
latching circuits to hold the alarm. But in this development
our intention was to use this as a diagnostic tool and it is
necessary to get all the information without filtering so that
1ms glitch is also important. When 1ms changes are taken
as inputs, the relay bounces also appear in the event list
which makes it crowded. In order to circumvent this
problem, an algorithm was developed to record any change
(even that of 1ms duration) and also to suppress bounces
which occur within a predefined period. The period could
be set for each digital input considering the contact bounce
of the relay. This feature proved to be very effective during
the operation where the relay bounce become prolonged
when the relay becomes older and sluggish. It can be taken
as an early warning of a failing relay. After several field
Fig 5. Typical relay bounce characteristics obtained from a high speed
data recorder
Instead of single software for capturing and conversion,
two different software were developed to optimize the
speed. The capturing software is optimized for timing hence
only essential information is transferred to the temporary
random access file. This information of digital inputs
include the port number, present and past port values (8 or 4
bits) system time and millisecond counter reading of MS
Windows operating system. The analogue information
includes time, port number and binary value of the analogue
reading. This software is optimized for reading digital
values over that of analogue. Only one analogue value is
read after scanning all the digital inputs. This is done only if
the total scanning time is less than a specified time. This
ensures the correct time stamping of digital inputs at the
expense of accuracy of analogue readings. Normally
analogue readings are stored every 1-minute (this can be set
to one second also) and all the intermediate analogue values
read at every digital scan, and are averaged. Therefore
analogue readings also give very accurate reading for a
given period of one minute.
The DAQConverter software reads the information of
digital inputs and decides the present state, input channel
number and also calculate the time accurate to milliseconds
as described below. The binary value corresponding to
analogue input is used to calculate the input value based on
the transducer characteristics and scaling factors. The
collected data values are written to databases for the use of
other applications.
The computer system clock is accurate to 1 second and is
prone to drift with time. But millisecond accuracy is
required for the above system.
Hence the internal
millisecond counter of Windows operating system is used
for deriving the time accurate to millisecond. When the
DAQcapture program is started, the initial date and time is
recorded with the millisecond counter value. The counter
260
Proceedings of the International Conference on Information and Automation, December 15-18, 2005, Colombo, Sri Lanka.
value is taken at the instance of the change of second and it
is considered as the initial millisecond counter
corresponding to zero millisecond of the initial second.
Subsequent times are calculated using the initial date, time
and initial millisecond counter and present millisecond
counter values. The necessary steps have been taken to
Saving Time (mS)
1200
1000
DB Open in Advance
800
DB Open and Write
600
Memory Array
Sequential File
400
Random Access File
200
ODBC
0
0
500
1000
1500
-200
Number of Readings
Fig. 6 Comparison of time taken for saving of temporary files with the
number of readings including ODBC
Saving Time (mS)
60
50
40
DB Open in Advance
DB Open and Write
30
Memory Array
20
Sequential File
10
Random Access File
0
0
500
1000
1500
-10
Number of Readings
Fig. 7 Comparison of time taken for saving of temporary files with the
number of readings excluding ODBC
introduce GPS synchronized clocks for time synchronizing
of DAQ systems as readings of different stations are to be
analyzed on the same time base for station wide failures.
The use of random access files for temporary data
transfer between the DAQCapture and DAQConverter
showed faster operation than any of the other methods as
shown in the Fig.6 and Fig. 7, except a software array that
uses computer RAM.
VI. CONCLUSION
The introduction of the DAQ systems to the power
stations has proved the worthiness of the system from the
first date of operation. Large number of faults which went
undetected before, were corrected. It helped to pin point the
origin of some of the island wide power failures. Also it has
given indications prior to failure and also has helped to
identify bad contactors and wire connections. The captured
data is available in databases and a number of applications
have been developed to work on this data for operation
management and reliability centered maintenance
management [6]. The low cost solution itself saved about
25 million Rupees to the utility. Improvement of operations
management could save billions of Rupees to the utility and
to Sri Lanka.
The data acquisition is a preliminary requirement of any
engineering application especially when it is necessary to
acquire real world information. On the other hand such
equipment is very expensive, if they are to be imported. The
above application shows that we can develop a low cost
system at any scale ranging from a few digital and analogue
inputs to a large number of inputs as in the above case. This
can save a huge amount of money to the institution and to
the nation. Most of the projects cannot take off the ground
due to the unavailability of funds for such data acquisition
systems. In most of the cases we deploy systems that do not
employ the latest microprocessors and are purchased at an
exorbitant cost. It may be true that such equipment is well
tested and proven and posses a lot of facilities. But these
facilities may have been introduced to be competitive in the
market (even if they are not required by us) at an additional
cost. Most of our requirements are not mission critical and
also do not involve fast varying data hence our own DAQ
system could be easily made only by using a normal PC and
a few low cost DAQ PC-interfacing cards. As engineers and
technologist, it is our duty to change the mind set of our
decision makers and also of ourselves to develop our own
technology – may be crude at the beginning – to reach the
distant goals of sustainable development. This is very
important at this juncture where we are facing financial
crisis as institutions and a foreign currency crisis as a
country.
ACKNOWLEDGEMENT
Author would like to thank Mr. F.K. Mohideen and Mr.
W.R.A. Perera (DGMs of Mahaweli Hydro Power
Complex) for their initiative in this project, Mr. A.K.
Samarasinghe (Chief Engineer – Electrical and
Instrumentation , Mahaweli Hydro Power Complex) for his
continuous support and guidance in design and
implementation. Author also thanks all the Chief Engineers
and Engineers (Instrumentation & Development) of power
261
Proceedings of the International Conference on Information and Automation, December 15-18, 2005, Colombo, Sri Lanka.
stations and their technical staff for carrying out all the
station modifications and field wiring.
REFERENCES
[1]
[2]
[3]
[4]
[5]
[6]
Advid Becker, Herb Falk, “Standards-based approach integrates
utility applications,” IEEE Computer application in power, October
2000 pp. 14-20
Samarakoon, S.M.K.B. “An Inexpensive Single Microprocessor
Based Data Acquisition Card for Information Transfer.” Proceedings
of the Engineering Jubilee Congress ‘ENGINEERING BEYOND
2000’, Faculty of Engineering, University of Peradeniya, Vol1, June
2000, pp 21-24. Sri Lanka
Samarakoon, S.M.K.B. “Development of Data Acquisition System
for Fault and Efficiency Monitoring of Hydro Power Stations.”
Reference Manual Rev2.0, 2003 January
Omega Engineering “User’s Manual,” CIO-DIO 192 User’s Manual,
1997
Omega Engineering “User’s Manual,” CIO-DAS 48-PGA User’s
Manual, Rev 2, April 1995
Douglas Proudfoot, Dave Taylor, “How to turn a substation to
database server” IEEE Computer application in power, April 1999,
pp. 29-35