1
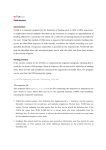
User manual for
Legacy RNA-Seq Plugin
Windows, Mac OS X and Linux
June 18, 2014
This software is for research purposes only.
CLC bio, a QIAGEN Company
Silkeborgvej 2
Prismet
DK-8000 Aarhus C
Denmark
Contents
1 Using the Legacy RNA-Seq Plugin
4
1.1 Introduction . . . . . . . . . . . . . . . . . . . . . . . . . . . . . . . . . . . . . .
4
1.2 Specifying reads, reference genome and mapping settings . . . . . . . . . . . . .
5
1.2.1 Paired data in RNA-Seq . . . . . . . . . . . . . . . . . . . . . . . . . . . .
8
1.2.2 Finding the right reference sequence for RNA-Seq . . . . . . . . . . . . . .
9
1.3 Exon identification and discovery . . . . . . . . . . . . . . . . . . . . . . . . . . .
9
1.4 RNA-Seq output options . . . . . . . . . . . . . . . . . . . . . . . . . . . . . . . .
10
1.4.1 RNA-Seq report
. . . . . . . . . . . . . . . . . . . . . . . . . . . . . . . .
12
1.4.2 Gene fusion reporting . . . . . . . . . . . . . . . . . . . . . . . . . . . . .
14
1.5 Interpreting the RNA-Seq analysis result . . . . . . . . . . . . . . . . . . . . . . .
15
1.5.1 Gene-level expression . . . . . . . . . . . . . . . . . . . . . . . . . . . . .
15
1.5.2 Transcript-level expression . . . . . . . . . . . . . . . . . . . . . . . . . .
17
1.5.3 Definition of RPKM
19
. . . . . . . . . . . . . . . . . . . . . . . . . . . . . .
2 Installation of the Legacy RNA-Seq Plugin
20
3 Uninstall
22
Bibliography
23
3
Chapter 1
Using the Legacy RNA-Seq Plugin
This manual describes legacy RNA-Seq analysis functionality that was part of the CLC Genomics
Workbench up until version 7.0 where it was replaced by a new RNA-Seq tool based on tracks.
One of the differences between the new and the old version is the algorithm used to map the
reads. The old algorithm was more memory-efficient than the new one is when launching version
7.0 of CLC Genomics Workbench 1 . This means that running RNA-Seq analysis on e.g. human
data will not be possible on small laptops with the new version, and therefore we have made it
possible to install a plugin to re-establish the old RNA-Seq analysis.
Furthermore, the results are not completely identical. There are a few differences in the way
reads are mapped. These differences are only significant when comparing expression across
samples where we recommend that the same RNA-Seq analysis tool is used for all samples.
1.1
Introduction
Based on an annotated reference genome and mRNA sequencing reads, the CLC Workbench is
able to calculate gene expression levels as well as discover novel exons. The key annotation
types for RNA-Seq analysis of eukaryotes are of type gene and type mRNA. For prokaryotes,
annotations of type gene are considered.
The approach taken by the CLC Workbench is based on [Mortazavi et al., 2008].
The RNA-Seq analysis is done in several steps: First, all genes are extracted from the reference
genome (using annotations of type gene). Other annotations on the gene sequences are
preserved (e.g. CDS information about coding sequences etc). Next, all annotated transcripts
(using annotations of type mRNA) are extracted. If there are several annotated splice variants,
they are all extracted. Note that the mRNA annotation type is used for extracting the exon-exon
boundaries.
An example is shown in figure 1.1.
Figure 1.1: A simple gene with three exons and two splice variants.
1
In later versions, this will be improved.
4
CHAPTER 1. USING THE LEGACY RNA-SEQ PLUGIN
5
This is a simple gene with three exons and two splice variants. The transcripts are extracted as
shown in figure 1.2.
Figure 1.2: All the exon-exon junctions are joined in the extracted transcript.
Next, the reads are mapped against all the transcripts plus the entire gene (see figure 1.3).
Figure 1.3: The reference for mapping: all the exon-exon junctions and the gene.
From this mapping, the reads are categorized and assigned to the genes (elaborated later in this
section), and expression values for each gene and each transcript are calculated. After that,
putative exons are identified.
Details on the process are elaborated in the sections following, which describe how to run
RNA-seq analyses.
1.2
Specifying reads, reference genome and mapping settings
To start the RNA-Seq analysis, go to:
Toolbox | Legacy Tools (
) | RNA-Seq Analysis (legacy) (
)
This opens a dialog where you select the sequencing reads, which should already have been
imported into the Workbench.
Click Next when the sequencing data are listed in the right-hand side of the dialog.
You are now presented with the dialog shown in figure 1.4.
Figure 1.4: Defining a reference genome for RNA-Seq.
At the top, there are two options concerning how the reference sequences are annotated:
CHAPTER 1. USING THE LEGACY RNA-SEQ PLUGIN
6
• Use reference with annotations. Typically, this option is chosen when you have an
annotated genome sequence. Choosing this option means that gene and mRNA annotations
on the sequence will be used if you choose the option Eukarotes in the next window. If you
choose the option Prokaryotes in the next window, the annotations of type gene only are
used. See section 1.2.2 for more information.
• Use reference without annotations. This option is suitable for situations like mapping back
reads to un-annotated EST consensus sequences. The reference in this case is a list of
sequences. A common situation is for a multi-fasta file to be imported into the Workbench
to be used for this purpose. Each sequence in the list will be treated as a "gene" (or
"transcript"). Note that the Workbench uses prokaryote settings here. This means that it
does not look for new exons (see section 1.3) and it assumes that the sequences have no
introns).
Just below these two options, you click to select the reference sequences.
Next, you can choose to extend the region around the gene to include more of the genomic
sequence by changing the value in Flanking upstream/downstream residues. This also means
that you are able to look for new exons before or after the known exons (see section 1.3).
When the reference has been defined, click Next and you are presented with the dialog shown in
figure 1.5.
Figure 1.5: Defining mapping parameters for RNA-Seq.
Different mapping algorithms are applied when mapping the reads in sequence lists containing
only short reads (those under 56bp in length) and when mapping reads in sequence lists
containing one or more reads that are 56bp or longer. The mapping algorithm used is applied to
all reads in a given sequence list. Different algorithms are not used for particular reads within a
given sequence list.
Accordingly, the mapping parameters made available to edit via the Wizard depend on the read
lengths in the sequence lists. If at least one sequence list containing only short sequences
(those under 56bp in length) was entered, then the "Maximum number of mismatches" setting
will be available to edit. If at least one sequence list of reads containing at least one read 56bp
or longer was entered, then the "Minimum length fraction" and "Minimum similarity fraction"
settings will be available. If you have entered multiple sequence lists, some lists containing only
short reads and some lists containing at least one or more longer reads, then all the mapping
parameter settings will be made available for editing. The "Maximum number of mismatches"
setting will be used only for the mapping of the lists containing all short reads. The "Minimum
CHAPTER 1. USING THE LEGACY RNA-SEQ PLUGIN
7
length fraction" and "Minimum similarity fraction" settings will be used only for the mapping of
all entries in sequence lists where one or more of the reads is 56bp or longer.
The mapping parameters are:
• Maximum number of mismatches. This parameter is available if you have selected at least
one sequence list containing only short reads (shorter than 56 nucleotides, except in the
case of color space data, which are always treated as long reads). This is the maximum
number of mismatches to be allowed. Maximum value is 3, except for color space where it
is 2.
• Minimum length fraction. This parameter is available when at least one sequence list
entered contains sequence(s) 56bp or longer. It specifies how much of a read must match
to the reference to the level of similarity specified in the last parameter for this read to be
mapped. The default is 0.9 which means that at least 90 % of the bases need to align to
the reference.
• Minimum similarity fraction. This parameter is available when at least one sequence list
entered contains sequence(s) 56bp or longer. It specifies how similar the matching part of
the read should be to the reference, for that read to be mapped. When using the default
setting at 0.8 and the default setting for the length fraction, it means that 90 % of the read
should align with 80 % similarity in order to include the read.
• Maximum number of hits for a read. A read that matches to more distinct places in the
references than the 'Maximum number of hits for a read' specified will not be mapped (the
notion of distinct places is elaborated below). If a read matches to multiple distinct places,
but below the specified maximum number, it will be randomly assigned to one of these
places. The random distribution is done proportionally to the number of unique matches
that the genes to which it matches have, normalized by the exon length (to ensure that
genes with no unique matches have a chance of having multi-matches assigned to them,
1 will be used instead of 0, for their count of unique matches). This means that if there
are 10 reads that match two different genes with equal exon length, the 10 reads will be
distributed according to the number of unique matches for these two genes. The gene that
has the highest number of unique matches will thus get a greater proportion of the 10
reads.
Places are distinct in the references if they are not identical once they have been transferred
back to the gene sequences. To exemplify, consider a gene with 10 transcripts and 11
exons, where all transcripts have exon 1, and each of the 10 transcripts have only one of
the exons 2 to 11. Exon 1 will be represented 11 times in the references (once for the
gene region and once for each of the 10 transcripts). Reads that match to exon 1 will
thus match to 11 of the extracted references. However, when transferring the mappings
back to the gene it becomes evident that the 11 match places are not distinct but in fact
identical. In this case the read will not be discarded for exceeding the maximum number of
hits limit, but will be mapped. In the RNA-seq action this is algorithmically done by allowing
the assembler to return matches that hit in the 'maximum number of hits for a read' plus
'the maximum number of transcripts' that the genes have in the specified references. The
algorithm post-processes the returned matches to identify the number of distinct matches
and only discards a read if this number is above the specified limit. Similarly, when a
multi-match read is randomly assigned to one of it's match places, each distinct place is
considered only once.
CHAPTER 1. USING THE LEGACY RNA-SEQ PLUGIN
8
• Strand-specific alignment. When this option is checked, the user can specify whether
the reads should be attempted mapped only in their forward (or reverse) orientation. This
will typically be appropriate when a strand specific protocol for read generation has been
used. It allows assignment of the reads to the right gene in cases where overlapping genes
are located on different strands. Without the strand-specific protocol, this would not be
possible (see [Parkhomchuk et al., 2009]). Also, applying the 'strand specific' 'reverse'
option in an RNA-seq run, to reads that did not map in a 'strand specific' 'forward' RNA-seq
run, will allow the user to assess the degree of antisense transcription.
There is also a checkbox to Use color space, which is enabled if you have imported a data set
from a SOLiD platform containing color space information. Note that color space data are always
treated as long reads, regardless of the read length.
1.2.1
Paired data in RNA-Seq
The CLC Workbench supports the use of paired data for RNA-Seq. A combination of single reads
and paired reads can also be used. There are three major advantages of using paired data:
• Since the mapped reads span a larger portion of the reference, there will be less nonspecifically mapped reads. This means that generally there is a greater accuracy in the
expression values.
• This in turn means that there is a greater chance of accurately measuring the expression
of transcript splice variants. As single reads (especially from the short reads platforms)
typically only span one or two exons, many cases will occur where expression splice
variants sharing the same exons cannot be determined accurately. With paired reads, more
combinations of exons will be identified as being unique for a particular splice variant.2
• It is possible to detect Gene fusions when one read in a pair maps in one gene and the
other part maps in another gene. Several reads exhibiting the same pattern is supporting
the presence of a fusion gene.
At the bottom you can specify how the mapping of Paired reads should be handled. If the
sequence list used as input for the mapping contains paired reads, this option will automatically
be shown - if it contains single reads, this option will not be shown. Paired reads lists have a field
on them that describe the expected minimum and maximum distances between reads in a pair.
These are the values that are shown in the 'minimum distance' and 'maximum distance' fields.
The RNA-seq read mapper relies on these distances to determine whether reads are mapped as
an intact or broken pair. The user may 'over-ride' the values on the read lists by providing his own
values in these fields. Note that for the RNA-seq read mapper, the distance between reads in a
pair is measured at the transcript and not the genomic level --- that is, intron regions are ignored.
When counting the mapped reads to generate expression values, the CLC Workbench needs to
decide how to handle paired reads. The standard behavior is this: if two reads map as a pair,
the pair is counted as one. If the pair is broken, none of the reads are counted. The reasoning
is that something is not right in this case, it could be that the transcripts are not represented
correctly on the reference, or there are errors in the data. In general, more confidence is placed
2
Note that the CLC Workbench only calculates the expression of the transcripts already annotated on the reference.
CHAPTER 1. USING THE LEGACY RNA-SEQ PLUGIN
9
with an intact pair. If a combination of paired and single reads are used, "true" single reads will
also count as one (the single reads that come from broken pairs will not count).
In some situations it may be too strict to disregard broken pairs. This could be in cases where
there is a high degree of variation compared to the reference or where the reference lacks
comprehensive transcript annotations. By checking the Use 'include broken pairs' counting
scheme, both intact and broken pairs are now counted as two. For the broken pairs, this means
that each read is counted as one. Reads that are single reads as input are still counted as one.
When looking at the mappings, reads from broken pairs have a darker color than reads that are
intact pairs or originally single reads.
1.2.2
Finding the right reference sequence for RNA-Seq
For prokaryotes, the reference sequence needed for RNA-Seq is quite simple. Either you input
a genome annotated with gene annotations, or you input a list of genes and select the Use
reference without annotations.
For eukaryotes, it is more complex because the Workbench needs to know the intron-exon
structure as explained at the beginning of this section. This means that you need to have a
reference genome with annotations of type mRNA and gene (you can see the annotations of a
sequence by opening the Annotation Table. You can obtain an annotated reference sequence in
different ways:
• Download the sequences from NCBI from within the Workbench. Figure 1.6 shows an
example of a search for the human refseq chromosomes.
• Retrieve the annotated sequences in supported format, e.g. GenBank format, and Import
( ) them into the Workbench.
• Download the unannotated sequences, (e.g. in fasta format) and annotate them using
a GFF/GTF file containing gene and mRNA annotations. Please do not over-annotate a
sequence that is already marked up with gene and mRNA annotations unless you are
sure that the annotation sets are exclusive. Overlapping gene and mRNA annotations
will lead to useless RNA-Seq results. Learn more about how to annotate with GFF at
http://www.clcbio.com/clc-plugin/annotate-sequence-with-gff-file/.
You need to make sure the annotations are the right type. GTF files from Ensembl are fully
compatible with the RNA-Seq functionality of the CLC Workbench: ftp://ftp.ensembl.
org/pub/current_gtf/. Note that GTF files from UCSC cannot be used for RNA-Seq
since they do not have information to relate different transcript variants of the same gene.
If you annotate your own files, please ensure that you use annotation types gene and, if it
is a eukarote, mRNA. To annotate with these types, they must be spelled correctly, and the
RNA part of the word "mRNA" must be in capitals.
1.3
Exon identification and discovery
Clicking Next will show the dialog in figure 1.7.
The choice between Prokaryote and Eukaryote is basically a matter of telling the Workbench
whether you have introns in your reference. In order to select Eukaryote, you need to have
CHAPTER 1. USING THE LEGACY RNA-SEQ PLUGIN
10
Figure 1.6: Downloading the human genome from refseq.
Figure 1.7: Exon identification and discovery.
reference sequences with annotations of the type mRNA (this is the way the Workbench expects
exons to be defined - see section 1).
Here you can specify the settings for discovering novel exons. The mapping will be performed
against the entire gene, and by analyzing the reads located between known exons, the CLC
Workbench is able to report new exons. A new exon has to fulfill the parameters you set:
• Required relative expression level. This is the expression level relative to the rest of the
gene. A value of 20% means that the expression level of the new exon has to be at least
20% of that of the known exons of this gene.
• Minimum number of reads. While the previous option asks for the percentage relative to
the general expression level of the gene, this option requires an absolute value. Just a few
matching reads will already be considered to be a new exon for genes with low expression
levels. This is avoided by setting a minimum number of reads here.
• Minimum length. This is the minimum length of an exon. There has to be overlapping reads
for the whole minimum length.
Figure 1.8 shows an example of a putative exon.
1.4
RNA-Seq output options
Clicking Next will allow you to specify the output options as shown in figure 1.9.
CHAPTER 1. USING THE LEGACY RNA-SEQ PLUGIN
11
Figure 1.8: A putative exon has been identified.
Figure 1.9: Selecting the output of the RNA-Seq analysis.
The Output options are:
• Create list of un-mapped sequences. Creates a list of the un-mapped sequences (marked
with a red arrow in figure 1.9). This list can be used to do de novo assembly and perform
BLAST searches to see whether you can identify new genes or otherwise further investigate
the results.
• Create report. Creates a report of the results. See RNA-Seq report below for a description
of the information contained in the report.
• Create fusion gene table. An option that is enabled when using paired data. Creates
a table that lists potential fusion genes. This, along with the Minimum read count, is
described further below in section Gene fusion reporting.
The standard output for the RNA-Seq analysis is a table showing values for each gene. From
the table, mappings can be opened individually by clicking on the button labeled Open mapping
found at the bottom of the table or by double clicking on one of the entries in the table (see more
below). For eukaryotes, the expression of individual transcripts is also reported.
The expression measure for use in further analysis can be specified under Expression value:
• Calculate RPKM for genes without transcripts. For eukaryotic annotated genomes, specify
whether RPKM-like values should be generated for gene features without mRNA annotations.
CHAPTER 1. USING THE LEGACY RNA-SEQ PLUGIN
12
Such features, like small RNAs and tRNAs, have no exons, and thus no exon lengths, which
are used in calculating RPKM. When ticked, the "gene length" will be used in place of an
"exon length" in the RPKM formula for genes without a corresponding mRNA feature. If this
option is not ticked, genes with no mRNA annotations will have given an RPKM value of 0.
• Expression value. The expression measure for use in further analysis can be specified at
this point. By default, this is set to Genes RPKM.
The value chosen for measuring expression is used for viewing your RNA-seq results (section 1.5),
and for carrying out downstream expression analysis. You can change this to a different value at
a later point by opening the result and set the Expression value at the bottom of the table.
1.4.1
RNA-Seq report
An example of the result of the option Create report is shown in figure 1.10.
Figure 1.10: Report of an RNA-Seq run.
The report contains the following information:
• Sequence reads. Information about the number of reads.
CHAPTER 1. USING THE LEGACY RNA-SEQ PLUGIN
13
• Reference sequences. Information about the reference sequences used and their lengths.
• Reference. Information about the total number of genes and transcripts (for eukaryotes
only) found in the reference.
• Transcripts per gene. A graph showing the number of transcripts per gene. For eukaryotes,
this will be equivalent to the number of mRNA annotations per gene annotation.
• Exons per gene. A graph showing the number of exons per gene.
• Exons per transcript. A graph showing the number of exons per transcript.
• Mapping statistics. Shows statistics on:
Counted fragments. The number of mapped reads. This number is divided into
uniquely and non-specifically mapped reads (see the point below on match specificity
for details).
Uncounted fragments. The number of unmapped reads.
Total fragments. This is the total number of reads used as input.
• Paired reads. (Only included if paired reads are used). Shows the number of reads mapped
in pairs, the number of reads in broken pairs and the number of unmapped reads.
• Match specificity. Shows a graph of the number of match positions for the reads. Most
reads will be mapped 0 or 1 time, but there will also be reads matching more than once
in the reference. This depends on the Maximum number of hits for a read setting in
figure 1.4. Note that the number of reads that are mapped 0 times includes both the
number of reads that cannot be mapped at all and the number of reads that matches to
more than the 'Maximum number of hits for a read' parameter that you set in the second
wizard step. If paired reads are used, a separate graph is produced for that part of the
data.
• Paired distance. (Only included if paired reads are used). Shows a graph of the distance
between mapped reads in pairs.
• Detailed mapping statistics. This table divides the reads into the following categories.
Exon-exon reads. Reads that overlap two exons as specified in figure 1.13.
Exon-intron reads. Reads that span both an exon and an intron. If you have many
of these reads, it could indicate a low splicing-efficiency or that a number of splice
variants are not annotated on your reference.
Total exon reads. Number of reads that fall entirely within an exon or in an exon-exon
junction.
Total intron reads. Reads that fall entirely within an intron or in the gene's flanking
regions.
Total gene reads. All reads that map to the gene and it's flanking regions. This is the
mapped reads number used for calculating RPKM, see definition below.
For each category, the number of uniquely and non-specifically mapped reads are listed
as well as the relative fractions. Note that all this detailed information is also available
on the individual gene level in the RNA-Seq table ( )(see below). When the input data is
a combination of paired and single reads, the mapping statistics will be divided into two
parts.
CHAPTER 1. USING THE LEGACY RNA-SEQ PLUGIN
14
Note that the report can be exported in pdf or Excel format.
1.4.2
Gene fusion reporting
When using paired data, there is also an option to create a table summarizing the evidence for
gene fusions. An example is shown in figure 1.11.
Figure 1.11: An example of a gene fusion table.
The table includes one row for each broken read pair where the reads are placed in different
genes. The Minimum read count option is used to make sure that only combinations of genes
supported by at least this number of read pairs are included. The default value is 5, which means
that at least 5 broken pairs need to connect two genes, in order to include the broken pairs for
this gene combination in the result table.
The result table shows the following information for each read:
• Reference. The name of the reference sequence (the name of the gene).
• Start. The position where the alignment of the read starts.
• End. The position where the alignment of the read ends.
• Match count. How many other positions this read could have mapped to equally well.
• Annotations. The type of annotation covering the read. This will show whether the read is
in an exon or not.
Note that the reporting of gene fusions is very simple and should be analyzed in much greater
detail before any evidence of gene fusions can be verified. The table should be considered more
of a pointer to genes to explore rather than evidence of gene fusions. Please note that you can
extract the reads as a separate sequence list for further investigation by selecting the relevant
reads and clicking on the button labeled Create New Sequence List at the bottom of the table.
CHAPTER 1. USING THE LEGACY RNA-SEQ PLUGIN
1.5
15
Interpreting the RNA-Seq analysis result
The main result of the RNA-Seq is the reporting of expression values, which is done on both the
gene and the transcript level (only eukaryotes).
1.5.1
Gene-level expression
When you open the result of an RNA-Seq analysis, it starts in the gene-level view as shown in
figure 1.12.
Figure 1.12: A subset of a result of an RNA-Seq analysis on the gene level. Not all columns are
shown in this figure
The table summarizes the read mappings that were obtained for each gene (or reference). The
following information is available in this table:
• Feature ID. This is the name of the gene.
• Expression values. This is based on the expression measure chosen in figure 1.9.
• Transcripts annotated. The number of transcripts based on the mRNA annotations on the
reference. Note that this is not based on the sequencing data - only on the annotations
already on the reference sequence(s).
• Detected transcripts. The number of transcripts which have reads assigned (see the
description of transcript-level expression below).
• Exon length. The total length of all exons (not all transcripts).
• Unique gene reads. This is the number of reads that match uniquely to the gene.
• Total gene reads. This is all the reads that are mapped to this gene --- both reads that map
uniquely to the gene and reads that matched to more positions in the reference (but fewer
than the 'Maximum number of hits for a read' parameter) which were assigned to this gene.
• Unique exon reads. The number of reads that match uniquely to the exons (including the
exon-exon and exon-intron junctions).
CHAPTER 1. USING THE LEGACY RNA-SEQ PLUGIN
16
• Total exon reads. Number of reads mapped to this gene that fall entirely within an exon
or in exon-exon or exon-intron junctions. As for the 'Total gene reads' this includes both
uniquely mapped reads and reads with multiple matches that were assigned to an exon of
this gene.
• Ration of unique to total (exon reads). The ratio of the unique reads to the total number
of reads in the exons. This can be convenient for filtering the results to exclude the ones
where you have low confidence because of a relatively high number of non-unique exon
reads.
• Unique exon-exon reads. Reads that uniquely match across an exon-exon junction of the
gene (as specified in figure 1.13). The read is only counted once even though it covers
several exons.
• Total exon-exon reads. Reads that match across an exon-exon junction of the gene (as
specified in figure 1.13). As for the 'Total gene reads' this includes both uniquely mapped
reads and reads with multiple matches that were assigned to an exon-exon junction of this
gene.
• Unique intron-exon reads. Reads that uniquely map across an exon-intron boundary. If
you have many of these reads, it could indicate that a number of splice variants are not
annotated on your reference.
• Total intron-exon reads. Reads that map across an exon-intron boundary. As for the 'Total
gene reads' this includes both uniquely mapped reads and reads with multiple matches
that were assigned to an exon-intron junction of this gene. If you have many of these reads,
it could indicate that a number of splice variants are not annotated on your reference.
• Exons. The number of exons based on the mRNA annotations on the reference. Note that
this is not based on the sequencing data - only on the annotations already on the reference
sequence(s).
• Putative exons. The number of new exons discovered during the analysis (see more in
section 1.3).
• RPKM. This is the expression value measured in RPKM [Mortazavi et al., 2008]: RPKM =
total exon reads
mapped reads(millions)×exon length (KB) . See exact definition below. Even if you have chosen the
RPKM values to be used in the Expression values column, they will also be stored in a
separate column. This is useful to store the RPKM if you switch the expression measure.
See more in section 1.5.3.
• Median coverage. This is the median coverage for all exons (for all reads - not only the
unique ones). It is calculated by calculating the coverage for each base position in an exon
region of the gene, and then taking the median of those values.
• Chromosome region start. Start position of the annotated gene.
• Chromosome region end. End position of the annotated gene.
Double-clicking any of the genes will open the mapping of the reads to the reference (see
figure 1.13).
CHAPTER 1. USING THE LEGACY RNA-SEQ PLUGIN
17
Figure 1.13: Opening the mapping of the reads. Zoomed out to provide a better overview.
Reads spanning two exons are shown with a dashed line between each end as shown in figure
1.13.
At the bottom of the table you can change the expression measure. Simply select another value
in the drop-down list. The expression measure chosen here is the one used for further analysis.
When setting up an experiment, you can specify an expression value to apply to all samples in
the experiment.
The RNA-Seq analysis result now represents the expression values for the sample, and it can be
further analyzed using the various tools in the Transcriptomics Analysis toolbox.
1.5.2
Transcript-level expression
In order to switch to the transcript-level expression, click the Transcript-level expression (
button at the bottom of the view. You will now see a view as shown in figure 1.14.
)
Figure 1.14: A subset of a result of an RNA-Seq analysis on the transcript level. Not all columns
are shown in this figure
CHAPTER 1. USING THE LEGACY RNA-SEQ PLUGIN
18
The following information is available in this table:
• Feature ID. This is the gene name with a number appended to differentiate between
transcripts.
• Expression values. This is based on the expression measure chosen in figure 1.9.
• Gene name. The unique gene name.
• Transcripts annotated. The number of transcripts based on the mRNA annotations on the
reference. Note that this is not based on the sequencing data - only on the annotations
already on the reference sequence(s).
• Transcript length. The total length of all exons of that particular transcript.
• Transcript ID. This information is retrieved from transcript_ID key on the mRNA annotation.
• Unique transcript reads. This is the number of reads in the mapping for the gene that
are uniquely assignable to the transcript. This number is calculated after the reads have
been mapped and both single and multi-hit reads from the read mapping may be unique
transcript reads.
• Total transcript reads. Once the 'Unique transcript read's have been identified and their
counts calculated for each transcript, the remaining (non-unique) transcript reads are
assigned randomly to one of the transcripts to which they match. The 'Total transcript
reads' counts are the total number of reads that are assigned to the transcript once this
random assignment has been done. As for the random assignment of reads among genes,
the random assignment of reads within a gene but among transcripts, is done proportionally
to the 'unique transcript counts' normalized by transcript length, that is, using the RPKM
(see the description of the 'Maximum number of hits for a read' option', 1.2). Unique
transcript counts of 0 are not replaced by 1 for this proportional assignment of non-unique
reads among transcripts.
• Ratio of unique to total (exon reads). This will show the ratio of the two columns described
above. This can be convenient for filtering the results to exclude the ones where you have
low confidence because of a relatively high number of non-unique transcript reads.
• Exons. The number of exons for this transcript. Note that this is not based on the
sequencing data - only on the annotations already on the reference sequence(s).
• RPKM. The RPKM value for the transcript, that is, the number of reads assigned to the
transcript divided by the transcript length and normalized by 'Mapped reads' (see below).
• Relative RPKM. The RPKM value for the transcript divided by the maximum of the RPKM
values for transcripts for this gene.
• Chromosome region start. Start position of the annotated gene.
• Chromosome region end. End position of the annotated gene.
CHAPTER 1. USING THE LEGACY RNA-SEQ PLUGIN
1.5.3
19
Definition of RPKM
RPKM, Reads Per Kilobase of exon model per Million mapped reads, is defined in this way
[Mortazavi et al., 2008]:
RPKM =
total exon reads
.
mapped reads(millions) × exon length (KB)
Total exon reads This is the number in the column with header Total exon reads in the row for
the gene. This is the number of reads that have been mapped to a region in which an
exon is annotated for the gene or across the boundaries of two exons or an intron and
an exon for an annotated transcript of the gene. For eukaryotes, exons and their internal
relationships are defined by annotations of type mRNA.
Exon length This is the number in the column with the header Exon length in the row for the
gene, divided by 1000. This is calculated as the sum of the lengths of all exons annotated
for the gene. Each exon is included only once in this sum, even if it is present in more
annotated transcripts for the gene. Partly overlapping exons will count with their full length,
even though they share the same region.
Mapped reads The sum of all the numbers in the column with header Total gene reads. The
Total gene reads for a gene is the total number of reads that after mapping have been
mapped to the region of the gene. Thus this includes all the reads uniquely mapped to
the region of the gene as well as those of the reads, which match in more places (below
the limit set in the dialog in figure 1.4) that have been allocated to this gene's region. A
gene's region is that comprised of the flanking regions (if it was specified in figure 1.4),
the exons, the introns and across exon-exon boundaries of all transcripts annotated for the
gene. Thus, the sum of the total gene reads numbers is the number of mapped reads for
the sample. This number can be found in the RNA-seq report's table 3.1, in the 'Total' entry
of the row 'Counted fragments'. (The term 'fragment' is used in place of the term 'read',
because if you analyze paired reads and have chosen the 'Default counting scheme' it is
'fragments' that is counted, rather than reads (two reads in a pair will be counted as one
fragment).
Chapter 2
Installation of the Legacy RNA-Seq Plugin
The Legacy RNA-Seq Plugin is installed as a plugin. Plugins are installed using the plugin
manager1 :
Help in the Menu Bar | Plugins and Resources... (
or Plugins (
)
) in the Toolbar
The plugin manager has three tabs at the top:
• Manage Plugins. This is an overview of plugins that are installed.
• Download Plugins. This is an overview of available plugins on CLC bio's server.
• Manage Resources. This is an overview of resources that are installed.
To install a plugin, click the Download Plugins tab. This will display an overview of the plugins
that are available for download and installation (see figure 2.1).
Clicking a plugin will display additional information at the right side of the dialog. This will also
display a button: Download and Install.
Click the Legacy RNA-Seq Plugin and press Download and Install. A dialog displaying progress is
now shown, and the plugin is downloaded and installed.
If the Legacy RNA-Seq Plugin is not shown on the server, and you have it on your computer (e.g.
if you have downloaded it from our web-site), you can install it by clicking the Install from File
button at the bottom of the dialog. This will open a dialog where you can browse for the plugin.
The plugin file should be a file of the type ".cpa".
When you close the dialog, you will be asked whether you wish to restart the CLC Workbench.
The plugin will not be ready for use until you have restarted.
1
In order to install plugins on Windows Vista, the Workbench must be run in administrator mode: Right-click the
program shortcut and choose "Run as Administrator". Then follow the procedure described below.
20
CHAPTER 2. INSTALLATION OF THE LEGACY RNA-SEQ PLUGIN
Figure 2.1: The plugins that are available for download.
21
Chapter 3
Uninstall
Plugins are uninstalled using the plugin manager:
Help in the Menu Bar | Plugins and Resources... (
or Plugins (
)
) in the Toolbar
This will open the dialog shown in figure 3.1.
Figure 3.1: The plugin manager with plugins installed.
The installed plugins are shown in this dialog. To uninstall:
Click the Legacy RNA-Seq Plugin | Uninstall
If you do not wish to completely uninstall the plugin but you don't want it to be used next time
you start the Workbench, click the Disable button.
When you close the dialog, you will be asked whether you wish to restart the workbench. The
plugin will not be uninstalled until the workbench is restarted.
22
Bibliography
[Mortazavi et al., 2008] Mortazavi, A., Williams, B. A., McCue, K., Schaeffer, L., and Wold,
B. (2008). Mapping and quantifying mammalian transcriptomes by rna-seq. Nat Methods,
5(7):621--628.
[Parkhomchuk et al., 2009] Parkhomchuk, D., Borodina, T., Amstislavskiy, V., Banaru, M.,
Hallen, L., Krobitsch, S., Lehrach, H., and Soldatov, A. (2009). Transcriptome analysis by
strand-specific sequencing of complementary dna. Nucleic Acids Res, 37(18):e123.
23