1
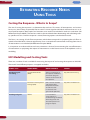
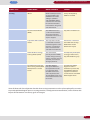
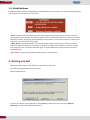
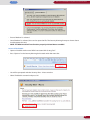
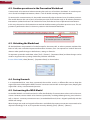
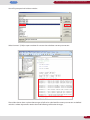
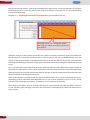
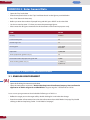
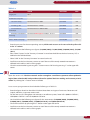
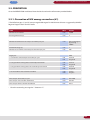
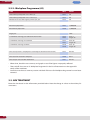
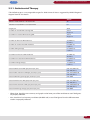
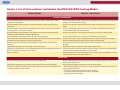
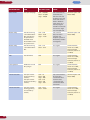
User Manual
MDG-Consistent HIV/AIDS
Costing Model
for Asia and the Pacific
UNDP HIV/AIDS Practice Team
Regional Centre Colombo
User Manual
MDG-Consistent HIV/AIDS
Costing Model
for Asia and the Pacific
UNDP HIV/AIDS Practice Team
Regional Centre Colombo
Costing the Response - What is In Scope?
01
HIV Modelling and Costing Tools
01
Using the MDG-Consistent HIV/AIDS Costing Model for Asia and the Pacific (MDG Model)
03
1. Overview of the MDG Model
05
1-1. Worksheet
05
1-2. Structure
05
1-3. Colour Scheme
06
1-4. US Dollar - Local currency conversion
06
1-5. Useful buttons
07
2. Getting started
07
3. Working on the “TOP” Worksheet
09
4. Working on the “Enabling Environment,” “Prevention,” ARV Treatment,”
“Care & Support” and “Health Systems” Worksheets
10
4-1 Including/excluding interventions in the total cost calculation
10
4-2. Entering data
11
4-2-1. Opening the data entry section
11
4-2-2. Closing the data entry section
12
4-2-3. Setting the target
12
4-3. Data entry
4-3-1. Unit costs
13
14
4-3-2. Entering costs that cannot be included anywhere or that are shared
by multiple interventions
15
5. Reviewing the results
16
(a) Total cost of a particular intervention
16
(b) A total cost for a particular field of response 16
(c) Aggregate total costs
16
6. Areas that need special attention
18
6-1. The Health Systems Worksheet
18
6-2. Condom provisions in the Prevention Worksheet
19
6-3. Unlocking the Worksheet
19
6-4. Saving the work
19
6-5. Customising the MDG Model
19
7. Hands-on Exercise - The best way to get accustomed to the model
22
EXERCISE 1: Basic Moves
22
EXERCISE 2: Enter General Data
23
EXERCISE 3: Enter Intervention Data
23
Annex 1. List of interventions included in the MDG HIV/AIDS Costing Model
30
Annex 2 - Data needs for the MDG Model
32
Annex 3: Reference unit costs
34
User Manual
<< Contents
Estimating Resource Needs
Using Tools
Costing the Response - What is In Scope?
The aim of costing the response is to determine the total cost. This means all interventions and services
have a cost, even if they are provided free or even if it is envisage that individuals will bear that cost as an
out-of-pocket expense. Both capital and recurrent costs need to be included in total cost estimation (UN
Millennium Project 2005b). The total cost needs to be considered when determining and calculating country specific unit costs. Once the response is costed, financing options can then be discussed.
The focus is on costing all cash flow components, which then corresponds to projecting the cash flow required to fund the MDGs. However opportunity costs associated with communities investing their time in
an intervention is not included (UN Millennium Project 2005b).
It is important to understand that total cost estimation is distinct from estimating the cost-effectiveness
of interventions or projecting the impact of interventions on the future course of the epidemic such as
modelling.
HIV Modelling and Costing Tools
There are a number of tools available for measuring the impact of and costing the response to HIV/AIDS.
These tools have different purposes as mapped out below.
Model type
Model Name
Model purpose
Source
Epidemiological
modelling
Asia Epidemic Model
(AEM)
Allows examination of
the impacts of different
prevention program
choices on the course of
the epidemic.
http://www.eastwestcenter.org
Estimation and Projection
Package (EPP)
EPP is used to estimate
and project adult
HIV prevalence from
surveillance data
in countries with
generalised epidemics.
http://www.constellafutures.com
GOALS
It is intended to
assist planners in
understanding the effects
of funding levels and
allocation patterns on
program impact.
http://www.constellafutures.com
Funding and goals
1
<< Contents
MDG-Consistent HIV/AIDS Costing Model for Asia and the Pacific
Model type
Model Name
Model purpose
Source
Costing
INPUT
INPUT accompanies the
Costing Guidelines for
HIV/AIDS Intervention
Strategies (UNAIDS
and ADB 2004). INPUT
calculates the unit costs
for common HIV/AIDS
interventions using local
cost information.
Jointly developed by
UNAIDS and ADB
Resource Needs Model
(RNM)
The RNM model costs
a suite of interventions
split into prevention,
treatment and care and
orphan support.
http://www.constellafutures.com
Cape Town ARV treatment
model
The Cape Town model
is a detailed treatment
model designed to assist
planners in estimating
costs associated with
antiretroviral treatment.
Included as a module in
the Health Care Costing
Model from the UN
Millennium Project.
ASAP HIV/AIDS Strategy
Costing Model (ASAP)
The ASAP model,
partially based on RNM,
creates linkages among
costing, national chart of
accounts, and national
strategic priorities.
Developed by ASAP (AIDS
Strategy & Action Plan)
http://www.worldbank.org/asap
The MDG-consistent HIV/
AIDS Costing model (MDG
Model) for Asia and the
Pacific
The MDG Model is
built upon RNM and
the Cape Town model.
It is consistent with
the MDG time frame
and incorporates HIVspecific MDG targets and
interventions for Asia and
the Pacific.
Developed by UNDP
Regional Centre in
Colombo in partnership
with UNAIDS Regional
Support Team for Asia
and the Pacific and UNDP
MDG Support Team.
Some of these tools have objectives broader than costing interventions and may be employed by countries
to provide epidemiological inputs to costing exercises, to help prioritise interventions, and to monitor the
impact of interventions on country goals and targets.
2
User Manual
<< Contents
Using the MDG-Consistent HIV/AIDS Costing Model for Asia
and the Pacific (MDG Model)
This section focuses on estimating the total cost of HIV/AIDS responses using the MDG-consistent HIV/
AIDS Costing Model or the MDG Model.
The MDG Model is principally built upon the widely-used Resource Needs Model developed by the Futures
Group and partially upon the Cape Town ARV Costing Model developed by the University of Cape Town. It
has been developed by UNDP Regional Centre in Colombo in partnership with UNAIDS Regional Support
Team for Asia and the Pacific and UNDP MDG Support Team (the former UN Millennium Project).
The MDG Model was primarily developed to assist the governments in Asia and the Pacific carrying out
MDG needs assessment exercises, based upon recommendations from experts from the region that the
existing tools had not addressed some of the key issues that are critical to Asia and the Pacific region and
some tools had been highly complex and unfriendly to users. The MDG Model is making constant adjustments and improvements based upon feedback from users in the region.
While inheriting strengths of the above widely-accepted models, the MDG still offers useful functions,
unique features, and high utility.
The key features of the MDG Model are as follows:
1. Flexible, MDG-consistent timeline
• Users can plan up to or beyond 2015, the MDG target year
• Users can define start and end years (up to a range of 10 years), which makes the single model useful
for multiple planning horizons (short-, mid- and long-terms)
2. UNAIDS targets for the 2010 universal access goal incorporated
• All UNAIDS non-negotiable and other key targets for Asia & Pacific for the 2010 universal access have
been incorporated, making the tool consistent with both the 2010 (universal access) and 2015 (MDG
6) goals:. In 2007, the universal access became one of the HIV MDG targets (6B) for Asia and the Pacific, on
which countries are required to report.
3. Target, result-based costing
• All the interventions in the MDG Model have their own target(s), defined by each country and
prominently listed at the top of respective data entry section. The target enables result-based costing
and provides a good system of accountability and monitoring the progress towards the target.
4. Expanded Scope
• New interventions, which have been shown as important for an effective HIV/AIDS response in Asia
and the Pacific, have been added under the heading “Enabling Environment.” Particularly this section
addresses human rights, gender and governance dimensions of HIV responses.
• Flexible interventions have been included, allowing users to define and add country-specific
interventions (e.g., Other Programs to Support PLWHAs)
3
<< Contents
MDG-Consistent HIV/AIDS Costing Model for Asia and the Pacific
• Human resources have been expanded to include more than only physicians; in fact, users can define
multiple cadres of human resources as necessary, including managerial and administrative staff
• Facility capital and recurrent costs have been added
5. More detail and disaggregation
• Major cost components of interventions are clearly defined (e.g., costs of home-based Care include
salaries/incentives to providers, salaries of supervisors, transportation equipment or reimbursements
to each cadre, etc.)
• STIs and OIs are disaggregated and costed by individual infection, as defined by users
• Where applicable capital and recurrent costs are differentiated
6. Increased transparency and simplicity
• All data and calculations for each major HIV/AIDS category (e.g., prevention, treatment, etc.) occur on a
single worksheet that runs top-to-bottom
• No hidden assumptions
• The Model calculates total capital costs, which are extremely important in expenditure analysis and
resource mobilization.
7. User-friendly interface with high utility
• Color coding helps users easily differentiate between input and output cells
• Unit cost inputs have been reorganized for conceptual ease (e.g., cost per outreach worker visit is
disaggregated into its constituent inputs that may be more readily understood by users)
• User provides population data directly so that that model can be used at sub- or supra-national levels
as necessary
• Users can change unit costs and coverage scale-up paths each year
• It can explicitly include health infrastructure, and human resource costs.
• Users can restore the original formula and conditions with a push of a button “RESET.”
• Users can refer to proxy data and reference information to assist data entry.
• Projected inflation can be easily accommodated
8. Synchronised with an MDG-consistent HIV/AIDS needs assessment user guide
• The MDG Model can be used in tandem with the MDG-consistent HIV/AIDS needs assessment user
guide. As needs assessment and prioritization have vital implications on the total cost of intervention,
synchronization between the needs assessment user guide and the MDG Model provides a principled
approach to the needs assessment and costing exercises.
4
User Manual
<< Contents
1. Overview of the MDG Model:
The MDG model is an Excel-based tool, with imbedded formulas. The tool calculates costs per intervention,
sub totals costs at the level of the following five categories or “Response Fields”: Enabling Environment, Prevention, ARV Treatment, Care and Support, and Health Systems. It also calculates an annual grand total for
the HIV/AIDS response. It has a dynamic 10-year time period that users can specify start and end years for.
The following section describes the basic features and functions of the MDG Model.
1-1. Worksheet
The MDG model has 7 active worksheets (working areas) as shown below: (1) TOP, (2) Enabling Environment, (3) Prevention, (4) ARV Treatment, (5) Care & Support, (6) Health Systems, and (7) Cost Summary. Each
tab has a different colour for easy identification:
The worksheets with gray tabs such as “TP” and “EE” as shown above are not for use (and should not be
altered or deleted. See 6-4 for more details).
1-2. Structure
Each worksheet for specific intervention area (Enabling Environment, Prevention, ARV Treatment, Care &
Support and Health Systems) is consisted of 4 sections.
List of interventions
Data entry section
Cost summary section
Graphical representations
of the costing results
5
<< Contents
MDG-Consistent HIV/AIDS Costing Model for Asia and the Pacific
1-3. Colour Scheme
The MDG model uses the following cell colour scheme to visually guide users for easy data entry and
analysis.
1-4. US Dollar - Local Currency Conversion
Users can work either with the US dollar or the local currency of choice. The default setting is US dollar, but
it can be changed to the local currency at any time by selecting [Currency Converter] - [Convert] located
at the menu bar. Note: Currency Converter does not appear unless Macros are enabled (See 2: Getting
Started).
This will translate all USD figures in the model into the local currency across all the worksheets as per the
US exchange rate defined in the TOP worksheet. If you want to go back to USD, simply select [Currency
Converter] - [US dollar].
The currency unit can be converted between the US$ and the local currency at any time. When conversion
is performed, all the financial values across all the worksheets in the model will be converted into the currency of choice.
It is a useful function, as it allows users to work with the local currency unit while the cost can be converted
into the US$ for resource mobilisation purposes. Additionally, the conversion function allows only one currency unit to be displayed as opposed to two different currencies as seen in some other costing models,
which can sometimes be quite confusing.
In case of Excel 2007:
• Click on the “Add-Inns” tab in the menu bar (see below) and the [Currency Converter] will appear.
6
User Manual
<< Contents
1-5. Useful buttons
The MDG model introduces useful functions to facilitate the data entry work. You will see the following buttons located at certain places in the model:
• “RESET” Button: This allows the restoration of the original cell formulas/values in certain sections.
This is helpful when formulas contained in certain cells are accidentally deleted or when users wish to
perform sensitivity analyses by placing different sets of values to assess their impact on outputs such
as the total cost or the level of coverage.
• “PROX” Button: The MDG model or any costing model requires extensive sets of data in order to
perform calculations. However, sometimes some data are simply not available in a country. To help
users deal with such a situation, the model gives an onsite reference to proxy indicators based on
established data.
• “REF” Button: It gives onsite reference information on certain topics.
2. Getting started
• Open an Excel file with a name “MDG-consistent HIV Costing Tool”
• You will be prompted with security warning.
• Select “Enable Macros”
• If you do not see this Security Warning, select [Tools] (on the menu bar at the top) - [Macro] [Security]. You will see the following window.
7
<< Contents
MDG-Consistent HIV/AIDS Costing Model for Asia and the Pacific
• Ensure “Medium” is selected.
• Once “Medium” is selected, close and re-open the file. The Security Warning Prompt as shown above
should appear this time.
• NOTE: The MDG model will not function properly without Macros enabled.
In case of Excel 2007:
• Open an Excel file with a name “MDG-consistent HIV Costing Tool”
• Press “Options” in the Security Warning bar located under the menu bar.
• You will be prompted with the Security Alert – Macro window.
• Select “Enable this content” and press OK.
8
User Manual
<< Contents
3. Working on the “TOP” Worksheet
The TOP Worksheet is where basic information such as currency, start & end years, and demographic information, is entered.
• Enter basic information into the yellow cells (1. country, 2. currency unit, 3.US exchange rate, 4. Start
Year, 5. End Year, 6. population in Start Year, 7. annual population growth rate, 8. number of PLHIV in
Start Year and its annual growth rate).
• Start & End Years can be a maximum of 10 years apart from each other. For example, if the Start Year is
2008, the End Year has to be 2017 or earlier. It is recommended that the 10-year interval be used.
• As mentioned above, figures in the orange cells can be changed manually.
• For instance, if the annual PLHIV growth rate is expected to grow from 6% in 2008 to 8% in 2010 &
onwards in the above example, simply left single click the target cell (shown in a red box above) and
type “8” and hit Enter. The following years will be automatically changed to 8%.
• Note that there is a RESET button to clear all the cells in the section on # of PLHIV.
9
<< Contents
MDG-Consistent HIV/AIDS Costing Model for Asia and the Pacific
4. Working on the “Enabling Environment,” “Prevention,”
ARV Treatment,” “Care & Support” and “Health Systems”
Worksheets
These Worksheets share the common styles and procedures. The following provides information that is applicable to all these Worksheets. Issues specific to a particular worksheet or intervention will be addressed
separately.
4-1 Including/excluding interventions in the total cost calculation
As outlined in Part 3 of this user guide, country teams need to identify interventions that are relevant for
their epidemic which will allow them to achieve their HIV/AIDS Millennium Development Goal and target.
The MDG model offers flexibility in including relevant interventions for each country’s response to the
epidemic.
Each worksheet has default interventions listed at the top (See the list of default interventions in Annex 1).
All the listed interventions are “selected” (a tick in the box as below) as default, which means costs of these
interventions will be included in the total cost.
However, you can also exclude particular interventions as shown below by ticking off a box. This function
also allows users to assess the financial impact of particular interventions on the total cost by checking the
box on and off.
If an intervention is not relevant simply
leave the check box.
Also, users can change the name of interventions. To change the name, right click on the cell containing
the intervention you wish to change. This will show the name of the intervention in the formula box (see
below) in which you can enter a new name.
New name can be entered here
10
User Manual
<< Contents
4-2. Entering data
4-2-1. Opening the data entry section
At default, all data entry sections are “closed,” showing only the name of intervention and its target (s). This
setting makes it easier to find a particular intervention among many and to keep the worksheet organised.
There are two ways to “open” the data entry section.
(1) Opening the data entry section for a particular intervention(s)
You can open only a selected intervention (s) by clicking a plus (+) sign located on the left side of the worksheet. For example, to open the data entry section for an intervention #1 in the example below, clicking on
the plus (+) sign located at the left side of Row# 155 opens the data entry section for the intervention #1.
Data entry section for
intervention #1 “closed”
Data entry section for
intervention #1 “open”
You can open the only section (s) you are working on so that the worksheet stays organised, less confusing,
and easier to navigate.
(2) Opening all the data entry section for all the interventions at one go
You can open the data entry section for all the interventions at one go, click on “2” located at the upper left
corner of Excel.
1 – Close all the data entry sections
2 – Open all the data entry sections
11
<< Contents
MDG-Consistent HIV/AIDS Costing Model for Asia and the Pacific
4-2-2. Closing the data entry section
The data entry section can be closed by either clicking a minus (-) sign located on the left side of the row
number or by clicking a “1” at the upper left corner of Excel.
4-2-3. Setting the target
One of the unique features of the MDG model is that each intervention is accompanied by its specific
target(s) defined by users. These targets are defined by each country and enables results-based costing
with a system of accountability and monitoring of the progress.
The default targets, which include UNAIDS non-negotiable targets for universal access to prevention, treatment and care by 2010 (which were officially incorporated into MDG targets for Asia and the Pacific in
2007), can be easily redefined by double-clicking on the cell that contains the target.
In some interventions, these targets are then entered (manually) into the model as below.
First you enter the Target Year (“2010” in the above example), followed by a coverage level of the current or
Start Year (“50%”) and that of the Target Year (“80%”).
The model then assumes a linear increase between the start and the end year and automatically generates
a coverage level to be achieved in each year in order to achieve the target (see below). The coverage level
after that target year will sustain the target level.
However, the coverage levels can be changed manually (as they are in orange cells), allowing users to frontload or backload efforts and to make adjustments midway depending on the progress.
The model assumes a linear increase
in the coverage level
Years after the target year maintain the
target coverage level at default
12
User Manual
<< Contents
4-3. Data entry
Data entry is straight forward in the MDG model in most cases. Users simply enter required data in yellow
cells. Some sections require all yellow cells to be filled with data – missing data will produce either no or
incorrect calculations.
In an example below, the user enters interventions that are considered necessary to achieve the target. This
is followed by the annual frequency of each intervention and its unit cost that are entered into appropriate
yellow cells.
In some other cases, interventions are pre-determined such as HIV prevention among sex workers, followed by the coverage level and unit cost.
In the below example, an intervention “Commission baseline studies” will take place once in 2007 at the
cost of $3000. An intervention “Dissemination workshops” will take place 3 times in 2008 at the cost of
$5000 per workshop.
Note that the unit cost is always entered into the “2007” or ‘Target Year’ column. In the case of “Commission
drafting of a bill,” the unit cost of $2000 is entered into the 2007 column despite the fact that the activity
will take place only in 2008. However, the $2000 in the 2007 column is shown faded, indicating that it will
not be calculated.
Enter activities that are considered
necessary to achieve the target
Dissemination
workshops
will happen 3
times in 2008
The unit cost must always be entered into yellow cells in this first (“Start Year”) column.
As mentioned previously, the MDG model has a useful “RESET” button to clear a particular field and restore
its original state. This could be a very powerful function, which allows an easy entry of different figures to
assess their impact on the cost without manually erasing each cell for a different figure.
13
<< Contents
MDG-Consistent HIV/AIDS Costing Model for Asia and the Pacific
4-3-1. Unit costs
Before entering unit costs, users need to decide what currency to use. The model uses the US Dollar as a
default currency unit. If a local currency, as defined in the Top worksheet, is preferred, you need to change
the working currency unit from US$ to a local currency.
The working currency unit can be changed from US$ to a local currency by selecting [Currency Converter]
- [Convert] as shown in 1-4 above. Note: the “Currency Converter” menu does not appear if macros are not
enabled.
Some notes on the unit cost:
• The unit cost is the total financial value of the intervention.
• As a preference use unit cost data that is country specific, only referencing globally defined figures as a
guideline (The INPUT model is designed to estimate the unit cost of various HIV interventions). Locally
developed unit costs will be more accurate, provide a better understanding of intervention costs, and
their associated implications, and thus greater ownership of the costing outputs (Alban and EASE
International n.d.).
• Ensure the unit cost equates to the intervention. For example, if the intervention is to provide harm
reduction for injecting drug users, including pharmacotherapy, needle exchange programs, condom
provision, shelter and life building skills, ensure that the unit cost includes all of those elements, not
just pharmacotherapy and needle exchange.
• Capital and human resource costs. (The INPUT model and Costing Guidelines for HIV/AIDS
interventions strategies illustrates how to include these costs in the unit cost (UNAIDS and ADB 2004).)
Alternatively the proportion of infrastructure and human resource unit costs attributable to HIV can be
entered on the Health Systems worksheets as discussed below.
• Ensure that the unit cost is reflective of the scope and coverage of the intervention. Questions such as
follows need to be examined when determining the appropriate unit cost:
- Does the unit cost vary between rural and urban populations?
- Does the unit cost vary for interventions targeting youths in school to those out of school?
• The model assumes unit costs are constant across the time period. However, this can be changed
to reflect the impact of marginal costs over time and as coverage increases (UN Millennium Project
2005b). Note that the cell colour for unit costs are orange, which means users can change values.
• Country teams need to develop and identify unit costs specific for their country and chosen
interventions. It is envisaged that available country specific resources and involvement of key
stakeholders conducting interventions on the ground will facilitate the process of collecting country
specific data.
• Identifying unit costs is vitally importance as they provide concrete criteria and key information (e.g.
operational efficiency & effectiveness) to help prioritise interventions within limited financial means as
well as help project future costs of particular interventions.
• However, when there are no local unit costs available, users can refer to proxy indicators as a reference,
which can be found in Annex 3. Some proxy indicators are also available in the model where a “prox”
button is located.
14
User Manual
<< Contents
4-3-2. Entering costs that cannot be included anywhere or that are
shared by multiple interventions
Sometimes there are costs that are not specific to a particular intervention or are better to be calculated
independently. Examples include vehicles and other capital investments that are used for multiple interventions.
The MDG model provides a space to accommodate such cross-cutting costs. At the end of the Cost Summary section in each Worksheet, there are yellow cells that can accommodate such costs.
Double-click on a cell “Other” and enter the name of the cost. If it is a capital cost, a small box needs to be
ticked so that it will be properly reflected as such in the Cost Summary Worksheet.
Additionally, this space also provides a flexibility of plugging in the total cost of a particular intervention or
response field that is already available or generated using different tools.
For example, if a country wishes to calculate the total cost of ARV medicines with a high level of details such
as combination regimen-specific estimates, which is not available in the MDG model, it can be performed
by such a tool as the Cape Town Model. Then the total amount calculated can simply be copied and pasted
in this space, while keeping all the other areas unused.
15
<< Contents
MDG-Consistent HIV/AIDS Costing Model for Asia and the Pacific
5. Reviewing the results
After entering appropriate data, costs can be viewed at 3 different levels: (a) intervention, (b) response field
(e.g. prevention), and (c) aggregate total.
(a) Total cost of a particular intervention
A total cost of a particular intervention is shown at the bottom of the data entry section of each intervention, in the Cost Summary section towards the end of the Worksheet as well as in the Cost Summary Worksheet.
(b) A total cost for a particular field of response
Total annual costs for a particular field of response such as enabling environment, prevention and ARV
treatment is shown in the Cost Summary section as below as well as in the Cost Summary Worksheet.
Total annual cost for ARV
treatment for 2008
(c) Aggregate total costs
The Cost Summary Worksheet gives a comprehensive summary of all costs, by response field, intervention,
year, and aggregate total. It also provides information on annual capital cost as well as annual per capita
cost. These disaggregated figures can be useful, particularly in budget negotiation, resource mobilisation
and donor reporting purposes.
16
User Manual
<< Contents
Additionally, users can adjust the total cost figures according to projected inflation rates to produce as realistic figures as possible. Inflation rates can be manually entered into the yellow cell as below.
As mentioned previously, the currency unit can be changed at any time using the Currency Converter to
review figures both in the US Dollars and the local currency of choice.
The model also produces graphs as a visual aid to understanding the projected trends up to the End Year
and proportion of costs by response field. (Note that the graph “HIV/AIDS Costs By Year” represents figures
without annual inflation.)
These graphs can be useful materials, which can be used for a presentation to donors and stakeholders.
17
<< Contents
MDG-Consistent HIV/AIDS Costing Model for Asia and the Pacific
6. Areas that need special attention
6-1. The Health Systems Worksheet
As a component of the cost of HIV/AIDS medical interventions will include the cost of the health facilities
and human resources associated with delivery of that intervention, users need to decide on how to incorporate those costs.
There are two possible ways these costs can be incorporated:
1) a component included in the unit cost of the medical intervention, or
2) by entering health facility and human resource details, and then specifying the HIV/AIDS proportion of those construction, maintenance and human resource cost details on the Health Systems
Worksheet.
If the latter is chosen, users need to take the following steps:
a. Check the boxes in the default intervention list to include the cost of Health Systems in total cost
calculations. At default, these boxes are NOT checked.
Ensure that these boxes are
checked before entering data
b. Specify:
•
the number of health facilities,
•
unit costs for construction, equipment, operations and maintenance and rehabilitation of facilities,
•
the number of health staff,
•
staffing costs, and
•
attribution of these costs to HIV/AIDS as shown in an example below:
Users specify the percentage of operations and
maintenance costs attributable to HIV/AIDS.
18
User Manual
<< Contents
6-2. Condom provisions in the Prevention Worksheet
Caution needs to be exercised when estimating the total cost of condoms distributed. As condom provision is found in multiple interventions, there is a risk of double-counting and overestimation.
To minimise this overestimation risk, the model automatically adjusts the total costs of condom provision.
The model subtracts the sum of costs of condom provision (male condom only) in all relevant prevention
interventions (other than that of 10. Condom Provision) from the total cost of prevention interventions.
In this way, the total cost for Prevention can exclude double-counting of condom provision costs. This adjustment is performed at the Cost Summary section in the Prevention Worksheet:
The amount of double-counted costs
for condom provision is subtracted.
6-3. Unlocking the Worksheet
All the Worksheets are protected or “locked” except for data entry cells, in order to prevent accidental deletion of cells, texts and other important information. However, users can unprotect or “unlock” the worksheet to make specific changes in default texts, settings or formulas.
To unprotect a particular worksheet, select [Tool] – [Protect] – [Unprotect Sheet] and then changes can be
made in any place and any settings under that particular worksheet.
In case of Excel 2007, select [Review] – [Unprotect Sheet] as shown below.
6-4. Saving the work
It is recommended that, once data are entered, the work be saved as a different file name to keep the
original file intact. Although the RESET function can restore certain cells to the original state, keeping the
original file is always a recommended practice.
6-5. Customising the MDG Model
As the MDG Model is an Excel-based tool, it offers the flexibility of customisation to best suit local circumstances. However, caution needs to be exercised, particularly in adding/deleting/moving rows/columns/
cells, as there is a currency conversion macro (an embedded formula) that is aligned specifically with the
default cell settings.
When changes are made and original cell locations are shifted, the currency conversion macro needs to be
adjusted accordingly. To do so, first open the macro by selecting [Tool] – [Macro] – [Macros].
19
<< Contents
MDG-Consistent HIV/AIDS Costing Model for Asia and the Pacific
You will be prompted with a Macro window:
Select “convert” - [Edit] to open an editor for a macro that calculates currency conversion:
The red box above shows a place where ranges of cells to be calculated for currency conversion are defined
and this is where adjustments need to be made following cell location changes.
20
User Manual
<< Contents
Each line of formula contains a cell range to be effected by the currency conversion function. For example,
the following formula shows that the first cell range to be effected is between C47 to L55 in the Enabling
Environment Worksheet.
RangeArr(1) = “’Enabling Environment’!C47:L55,’Enabling Environment’!C87:L95,
Cell range C47 to L55 – all the cells within
this range are subject to currency conversion
calculations
Therefore, changes in the location of cells that are subject to currency conversion need to be reflected in
the cell range in the currency conversion macro. If, for example, a new raw is inserted between rows #46
and #47 in the above example, it will affect the location of all the cells after row #47. In this case, the entire
cell ranges for Enabling Environment in the macro need to be adjusted accordingly to capture the new cell
range.
You can see that there are five blocks of formulas, which correspond to the 5 Worksheets/response fields of
the model. The adjustments such as above need to be made only within the block of a particular Worksheet
where changes have occurred. In the example above, changes in the cell range need to be made only in the
block of formulas for Enabling Environment.
After all the changes have been made, the entire worksheet needs to be copied and pasted into its corresponding “reserve” worksheet. Each Worksheet has its own reserve worksheet such as TP, EE, P, T, which
stand for “ToP,” “Enabling Environment, “ “Prevention,” and “Treatment,” respectively.
These reserve worksheets are used to restore the original state of specific cells when the “RESET” function
is used. Therefore, when changes are made in the structure of a Worksheet, they need to be reflected in its
reserve sheet.
21
<< Contents
MDG-Consistent HIV/AIDS Costing Model for Asia and the Pacific
7. Hands-on Exercise - The best way to get accustomed to
the model
Often the best way to get started and familiarised with the tool is by actually using it. There is an introductory exercise below, which walks you through all basic functions and features of the MDG model.
It is highly recommended that users wishing to use this model go through the exercise before actually
working on the model.
EXERCISE 1: Basic Moves
1-1. Open a file “MDG-Consistent HIV/AIDS Costing Tool ver.exl”
on the Desktop
Click “Enable Macro”
If you do not see this, please do the following:
(1) “Tool” - >“Option”- > “Security” -> “Macro Security” -> Check “Medium”
(2) Close and Re-start Excel
1-2. Open the following worksheets by clicking a corresponding tab
and scroll up and down to skim through the entire worksheet
• Enabling Environment
• Prevention
• ARV Treatment
• Care & Support
• Summary Cost
1-3. Open the “Enabling Environment” worksheet
• Unfold all the intervention sections by clicking the “2” button located at the upper left corner of the
worksheet
• Scroll down to see if all the sections are fully open
• Fold all the intervention sections by clicking the “1” button
• Unfold the first intervention “Review/develop/amend intellectual property laws to allow the
application of TRIPS safeguards and flexibilities” by clicking the “+” button at the left side of the target
(row 58).
• Fold the first intervention section by clicking the “-“ button (row 58)
• Again, click the + button to open the first intervention section. Go to the unit cost section to check the
currency unit is US$.
22
User Manual
<< Contents
EXERCISE 2: Enter General Data
• Open the “Top” worksheet
• Enter the required values on the “Top” worksheet based on the figures provided below
• Press “Tab” after each data entry
• Before you enter the number of people living with HIV, press RESET to clear the field
• You do not need to enter “%” when you enter the percentage figures.
• Please note that all figures mentioned in the document are for exercise purposes only.
Item
Value
Country
Gaikoku
Local Currency Unit
G$
US Exchange rate
75
Costing years
Start: 2008
End: 2017
Population
25,000,000
Annual population growth rate (%)
2.5
Estimated number of people living with HIV
25,000
Annual PLHIV growth rate (%)
3 (2008-11)
5 (2012-17)
EXERCISE 3: Enter Intervention Data
3-1. ENABLING ENVIRONMENT
(A)
• Open the Enabling Environment worksheet
• Open the intervention section #1 “Review/develop/amend intellectual property laws to allow the
application of TRIPS safeguards and flexibilities” by pressing the “+”button left to Cell 58.
Let us assume your government has decided the following as in Table 3-a:
• Reflect the target year in the target cell by double-clicking B19 and make the change
• Enter the number of intervention based on the information above Add “Media Campaign” by double
clicking on B26 and replacing “Other 1” with “Media Campaign”.
23
<< Contents
MDG-Consistent HIV/AIDS Costing Model for Asia and the Pacific
Table 3-a
Item
Value
Unit cost
Cell
Target year
2011
-
Activities to carry out:
-
-
1. baseline study
Conducted once in 2008
USD 1000
C47
2. Drafting a bill
Conducted once in 2009
USD 2000
C48
3. Dissemination
workshops
Conducted once in 2008 & 2009
USD 3000
C49
4. National consultative
meetings
Conducted twice a year in 2008, 9, 10 & 11
USD 5000
C50
Add: 5. Media Campaign
Conducted once in 2010
USD 10,000
C51
• Enter the unit cost for the corresponding activity. All the unit costs are to be entered in the yellow cells
in the “C” column.
• You should have the following cost figures: $14,000 (2008), $15,000 (2009), $20,000 (2010), $10,000
(2011)
• Now, select “Convert” in the “Currency Converter” to translate the USD into the local currency “G$” as
defined in the TOP Worksheet.
• Select “USD” in the “Currency Converter” to return back to G$
• Scroll down to the Cost Summary section to see if the cost of the newly-entered intervention is
reflected in the table as well as in the graphs.
• Close the section either by pressing the “-“ button next to Cell 58 or by pressing “1” at the upper left
corner.
(B)
Open the section #12 “Conduct research and/or strengthen surveillance system to collect epidemiological data related to HIV and provide evidence for optimal decision-making and resource prioritisation” by clicking the “+” button next to Cell 660.
Let us assume your government has decided the following as in Table 3-b:
• Enter the figures based on the table 3-b below. Note there are 2 types of unit costs: Recurrent and
Capital, which has a separate section each.
• For the unit cost for “Strengthen and maintain a surveillance system,” enter USD 10,000 in Cell D611,
USD2,000 in Cell E611 and USD 20,000 in Cell D638.
• You should have the following cost figures for this intervention: $152,000 (2009), $24,000 (2010),
$14,000 (2011), $6,4000 (2012), $14,000 (2013&14), and $6000 (2014 &15)
• Close all the sections by pressing the “1” button at the upper left corner
• Scroll down to the Cost Summary section to see if the cost of the newly-entered intervention is
reflected in the table as well as in the graphs.
24
User Manual
<< Contents
Table 3-b
Item
Value
Unit Cost (Recurrent)
Unit cost (Capital)
Target year
2010
-
Activities to carry out:
-
-
Needs assessment studies
Conducted once in 2009
USD 5000
Develop guidelines
Conducted once in 2009
USD 3000
Develop database
systems
Conducted once in 2009
& 10
USD 10000
Training of public health
officials on surveillance
Conducted twice a year
from 2009 to 2015
USD 2000
Conduct BSS studies
among general and
vulnerable populations
Conducted once in 2009
and 2012
USD 50000
Strengthen and maintain
a surveillance system
Conducted every year
from 2009 to 2015
USD 10000 (2009) and USD
2000 for the rest
USD 50000
(2009 only)
Cell D635
USD 20000
(2009 only)
Cell D 638
• Also, press the “COST SUMMARY” worksheet to see how figures are listed in the table.
• Go back to the “ENABLING ENVIRONMENT” worksheet
• Go to the list of interventions and deselect #12 pressing the box in Cell A13.
• Scroll down to the table and graph at the bottom as well as to the COST SUMMARY worksheet to see
the change
(C)
Adding miscellaneous expenses
You can add expenses that cannot be included in any section.
• Scroll down to the Cost Summary section in Enabling Environment.
• Double click on Cell B929 and type “4x4 Vehicle”
• Enter USD 30,000 in Cell C929
• As this is a capital cost, tick the box in Cell B929
• Go to the “COST SUMMARY” worksheet to see how this expense is reflected
25
<< Contents
MDG-Consistent HIV/AIDS Costing Model for Asia and the Pacific
3-2. PREVENTION
Go to the PREVENTION worksheet. Enter the data based on the information provided below:
3-2-1: Prevention of HIV among sex workers (#1)
* The default targets (1) and (2) are non-negotiable targets for 2010 Universal Access suggested by UNAIDS
Regional Support Team for Asia Pacific
Item
Cell
Value
Number of sex workers
C28
23,000
Annual growth rate (%)
C29
3
Number of commercial sex acts per sex worker per year
C34
Get a proxy figure
by pressing
“PROX”
Condom wastage (%)
C35
1
Number of sex workers contacted per counsellor per year
C36
200
Target year
2010
% sex workers contacted per counsellor per year
C41
D41
Start: 10
Target: 80
% using condoms among those reached by intervention
C42
D42
Start: 25
Target: 60
% using condoms among those not reached by intervention
C43
D43
Start: 10
Target: 50
% of all condoms that are female condoms
C44
D44
Start: 0
Target: 5
Unit cost per counsellor per year
D53
USD 1000
Unit cost per male condom distributed
D54
USD 0.3
Unit cost per female condom distributed
D55
USD 1
• Close the section by pressing the “-“ button or “1”.
26
User Manual
<< Contents
3-2-2: Workplace Programme (#9)
Item
Cell
Value
Labour force participation rate – Male (%)
C351
80
Labour force participation rate – Female (%)
C352
40
Number of sex acts with regular partners per year
C355
60
Adult male population
D359
12,000,000
Adult female population
D360
11,000,000
Target year
2015
% workforce receiving peer education/intervention
C368
D368
Start: 5
Target: 50
% workforce receiving STI treatment
C369
D369
Start: 50
Target: 80
% workforce receiving condoms
C370
D370
Start: 10
Target: 50
Unit cost of person in employment reached (peer education/intervention)
D379
USD 0.5
Unit cost of STI treated in workplace
D380
USD 1
Unit cost per male condom distributed
D381
USD 0.1
• When done, check the cost summary and graphs to see if the figures are properly reflected.
• Then, tick off a box next to “9. Workplace Programme” in the list of interventions at the upper left
corner of the worksheet.
• Scroll down to the cost summary section and check if the cost for Workplace Programme has now been
removed.
3-3. ARV TREATMENT
Enter the data based on the information provided below. Note the change in values in the midway for
some items.
27
<< Contents
MDG-Consistent HIV/AIDS Costing Model for Asia and the Pacific
3-3-1. Antiretroviral Therapy
*The default target is a non-negotiable targets for 2010 Universal Access suggested by UNAIDS Regional
Support Team for Asia Pacific
Item
Value
Adults in need of ART as % of total PLHIV
10
Children in need of ART as % of total PLHIV
0.1
Target year
2010
% Adults in need of ART receiving ART
Start: 7
Target: 75
% Children in need of ART receiving ART
Start: 5
Target: 75
% Adults on first-line ARV medicines
99 (2008-12)
95 (2013-)
% Adults on second-line ARV medicines
0.1 (2008-12)
2 (2013-)
% Adults failing therapy
0.9 (2008-12)
3 (2013-)
% Children on first-line ARV medicines
98 (2008-12)
90 (2013-)
% Children on second-line ARV medicines
0.2 (2008-12)
5 (2013-)
% Children failing therapy
1.8 (2008-12)
5 (2013-)
Cost of adult first-line ART (per person per year)
USD 138 (2008-10)
USD 100 (2011-)
Cost of adult second-line ART (per person per year)
USD 1285 (2008-10)
USD 650 (2011-)
Cost of adult failing therapy (per person per year)
USD 3000
Cost of child first-line ART (per person per year)
USD 138 (2008-10)
USD 100 (2011-)
Cost of child second-line ART (per person per year)
USD 1500 (2008-10)
USD 800 (2011-)
Cost of child failing therapy (per person per year)
USD 4000
• When done, check the cost summary and graphs at the lower part of the worksheet to see if the figures
are properly reflected.
• Also, check the Cost Summary worksheet (the Black tab) to see if the figures from the ARV treatment
section are properly reflected.
28
User Manual
<< Contents
3-4. Cost Summary
• Select the Cost Summary worksheet (Black tab at the bottom of the screen)
• Check to see all the figures are reflected and graphed
• See the graphs as to the proportion of the cost for each intervention area in light of the total cost
• See the per-capita cost and capital cost across the years
3-5. Finish
• Go back to all the sections that you have entered data. Clear all the cells by pressing the “RESET” button
29
<< Contents
MDG-Consistent HIV/AIDS Costing Model for Asia and the Pacific
Annex 1. List of interventions included in the MDG HIV/AIDS Costing Model
INTERVENTIONS
TARGETS / INDICATORS
ENABLING ENVIRONMENT
Review/develop/amend intellectual property laws to allow the application of TRIPS
safeguards and flexibilities
Presence of IP laws that will enable access to affordable generic HIV medicines by 20XX
(target year defined by each country)
Review/develop/amend legislations that protect women’s rights to property and
inheritance
Presence of legislations that protect women’s rights to property and inheritance by
20XX
Review/develop/amend legislations that discriminate against vulnerable populations
including women, sex workers and MSM
Presence of legislations that de-criminalise sex workers and MSM and that promote
and protect the rights of women by 20XX
Review/develop/amend legislations that enable harm reduction activities for IDUs
including needle exchange and drug substitutions
Presence of legislations that enable harm reduction activities for IDUs by 20XX
Provide affordable legal support for PLHIV and vulnerable groups
% of vulnerable population having access to affordable legal support
Conduct research to collect epidemiological data related to HIV and provide evidence
for optimal decision-making and resource prioritisation
Presence of reliable, recent, and longitudinal data related to the epidemic including
behavior and knowledge for planning, monitoring and evaluation
Monitor human rights violations against people living with HIV and their family
members
Presence of monitoring and redress systems of human rights violations against PLHIV
by 20XX
Implement programmes to reduce stigma and discrimination
Reduction in stigma and discrimination against the baseline
Support the empowerment and capacity building of HIV positive people’s networks for
their meaningful participation in the response
Presence of positive people’s networks organisationally and financially empowered to
advocate for their rights and provide services by 20XX
Mobilise resources
Resources (domestic and international) fully meet estimated needs by 2008 or increase
resources by three times from the 2005 level
PREVENTION
Ensure HIV testing and counseling are available and affordable
By 2015, affordable HIV testing and appropriate counseling are offered at all clinics for
STI, TB, and antenatal care
Implement programmes for prevention of parent-to-child transmission (PPTCT)
80% of pregnant women accessing services related to PPTCT
Develop and implement programs for young people: HIV prevention programmes for
in-school and out-of-school children
- 100% of young people having access to reliable information about the epidemic and
how to protect themselves
- % primary students with teachers trained in HIV/AIDS
- % secondary students with teachers trained in HIV/AIDS
- % out of school youth reached
30
User Manual
<< Contents
Develop and implement workplace HIV/AIDS policies and programmes in partnership
with the business sector
- Presence of national workplace HIV/AIDS policies
- % of industries having workplace HIV/AIDS policies
- % of workforce reached by prevention programmes
- % workforce receiving peer education
- % workforce receiving STI treatment
- % workforce receiving condoms
Develop and implement comprehensive HIV programmes for both brothel- and nobrothel based sex workers and their clients
- 80 % of sex workers reached by intervention by 2015
- 60 % of sex workers reached by intervention using condoms
- % using condoms among those not reached by intervention
- % of all condoms that are female condoms
Develop and implement comprehensive HIV programmes for IDUs
- 80% of IDUs receive harm reduction interventions (syringe and needle exchange and
drug substitution) and counseling and testing
- 60% of IDU use condoms
Provide VCT services
% of VCT needs fulfilled
Ensure blood safety
% of transfusion blood screened for HIV
Strengthen STI treatment
- At least 75% of people with STIs are appropriately diagnosed, counseled and treated
by 2015
- Decline of STI compared to the 2005 figure
TREATMENT
Provide antiretroviral therapy (ART)
Equitable and sustainable access to ART for at least 80% of those in need (both children
and adult)
Ensure treatment monitoring systems are in place
% of those on ART receiving tests for CD4 count, viral load, and full blood count
CARE & SUPPORT
31
Treat OIs and other HIV-related illnesses
% of positive people with OI are treated
Provide nutritional information and support to people living with HIV
Percentage of positive people given nutritional information and support (% target to
be set by each country)
Provide home-based care
% of PLHIV who desire home-based care have access to it
Provide palliative care
% of PLHIV in need of palliative care have access to it
Provide support to orphans and vulnerable children (OVC)
% of OVC receiving a basic external support package (e.g. school fees, shelter and food)
Provide economic support to households headed by women living with HIV, including
cash transfer, vocational training, micro-credit schemes
% of households headed by women living with HIV receiving economic support
Provide support to families of people living with HIV
% of families or positive people provided with counseling, support, including facilities
and parents participation in MTCT plus
<< Contents
MDG-Consistent HIV/AIDS Costing Model for Asia and the Pacific
Annex 2 - Data needs for the MDG Model
Depending on which interventions your country decides to pursue, the following indicates the data input
needs for the HIV/AIDS resource needs model.
Enabling Environment
Unit costs for studies commissioned on changing legislation, monitoring human rights, stigma and
discrimination and advocacy programs
Unit costs for consultation meetings on changing legislation, monitoring human rights, stigma and
discrimination and advocacy programs
Unit costs for staffing on changing legislation, monitoring human rights and stigma, discrimination and
advocacy programs
Numbers of people receiving training, frequency of training, number of people per training session and number
of trainers needed
Unit costs of training per session, per trainee and per trainer
Define and identify the number of programs for research and analysis, and their respective unit (recurrent) and
one-off costs
Define and identify the number of programs for epidemiological and BSS data collection, and their respective
unit (recurrent) and one-off costs
Define and identify the number of programs for empowerment and capacity building, and their respective unit
(recurrent) and one-off costs
Unit costs of legal support per person
Prevention
Sex workers population growth rate, number of commercial sex acts per sex worker per year, condom wastage,
number of sex workers contacted per counsellor per year, unit cost of counsellor, male and female condoms.
MSM population growth rate, number of sex acts per man having sex with men per year, condom wastage,
number of MSM contacted per counsellor per year, unit cost of counsellor and male condoms.
IDU population growth rate, number of IDUs researched per counsellor, number of sex acts per IDU per year,
number of injecting acts per IDU per year, unit cost of harm reduction (or components of harm reduction
programs)
Labour force participation rate male/female, percent of labour force in services and industry, and in wage
employment agriculture, number of sex acts with regular partners per year, unit costs per person in
employment reached, for STI treatment in workplace and male condom distributed
Population details including percentage of males in partnerships, in casual relationships, number of sex acts for
casual relationships and number of sex acts with partners per year, condom wastage, percentage of condoms
distributed through social marketing and percentage of population living in urban areas and unit cost per male
condom.
Number of people in need of VCT, average number of VCT services needed per person per year, number of
VCT services provided per counsellor per year, number of counsellor to train, unit costs of HIV test, salary per
counsellor per year and training costs per counsellor per year.
32
User Manual
<< Contents
Average number of campaigns per year, and cost per campaign.
Number of blood units required per 1,000 people, cost of screening a blood unit for HIV.
PEP kits required per million population and cost per PEP kit.
Average number of immunisations per child 0-23 months per year, number of adult injections per person per
year (15-49 years), percent of injections that are unsafe and additional cost for AD syringes.
Population details include primary and secondary school enrolments male and female, pupil-teach ratios,
frequency of teacher retraining, unit costs of primary, secondary teacher training on HIV, and cost of training
peer educator for out of school youth.
STI incidence (per 1,000) by type, and unit cost of treatment.
Number of pregnant women with HIV and unit cost of PMTCT.
Treatment
Number of adults and children in need of antiretroviral therapy, unit costs of antiretroviral therapy
Number of people in need to lab test, number of tests per year, additional number of testing equipment and
their unit costs, cost per test by test type
Care and support
Type and incidence of opportunistic infection among people living with HIV and AIDS (per 1,000), unit cost of
treatment for OI by type.
Percentage of people living with HIV and AIDS needing nutritional support, by type, number of nutritional items
per person, cost of nutritional unit by type.
Percentage of people living with HIV and AIDS desiring home based care, number of clients served per home
based care provider, number receiving training, frequency of visit to clients, number of transport items for
purchase, number of accompanied referrals, number of HBC supervised by each supervisor, training for
supervisors, number of supervisor visits per month, number of transport items for purchase for supervisors, unit
costs per home based care provider (salary, training, supplies), unit costs per provider to client, unit cost per
supervisor, per visit, per transportation, per training.
Number of orphans and vulnerable children of people living with HIV and AIDS, cost of support per orphan and
per vulnerable child.
Define programs to support PLWHAs, their demand, number of PLWHA per program, number of new programs
stated each year, recurrent and capital cost of program.
Health Systems
Define health facilities types, number of health facilities by type, number to build, number for rehabilitation,
construction and equipment costs, operations and maintenance costs, rehabilitating facilities costs, then
percentage attributable to HIV/AIDS case loads of above of total costs.
Define human resources, number of human resources by type, training numbers, numbers to receive special
HIV-related training, training costs by type, salary costs by type, cost of standard in-service and non-standard
training by type, then percentage attributable to HIV/AIDS case loads of above of total costs.
33
<< Contents
MDG-Consistent HIV/AIDS Costing Model for Asia and the Pacific
Annex 3: Reference unit costs
Intervention
Item
Unit cost (USD)
Scope
Source
Sex worker
intervention
Female condom
Low – 1.00
Med – 2.00
Per condom,
distributed
under public and
commercial sector,
Asia region
(Schwartlander,
Stover et al. 2001;
Futures Group/
Constella, Stover et
al. 2004)
Sex worker
intervention
Female condom
Low – 1.00
Med – 2.00
High – 3.00
Per condom,
distributed as
part of sex work
intervention.
Financial costing,
incremental.
(Kumaranayake and
Watts 2000)
Sex worker
intervention
Male condom
Low – 0.10
Med – 0.14
High – 0.17
Per condom,
economic cost, full
cost, sub-Saharan
Africa.
(Kumaranayake and
Watts 2000)
MSM intervention
Male condom
Low – 0.10
Med – 0.14
Per condom, Asia
region
(Schwartlander,
Stover et al. 2001;
Futures Group/
Constella, Stover et
al. 2004)
Workplace
interventions
Cost per person
in employment
reached (peer
education)
Low – 0.26
Med – 0.50
High – 0.75
sub-Saharan
Africa data, from
intervention in
Uganda. Economic
cost, full cost.
(med and high
extrapolated)
(Kumaranayake and
Watts 2000)
Workplace
interventions
Cost per STI treated
in workplace
Low – 8.34
Med – 27.85
Asia region
(Schwartlander,
Stover et al. 2001;
Futures Group/
Constella, Stover et
al. 2004)
Workplace
interventions
Male condom
Low – 0.10
Med – 0.14
Per condom, Asia
region
(Schwartlander,
Stover et al. 2001;
Futures Group/
Constella, Stover et
al. 2004)
Condom provision
Male condom
Low – 0.10
Med – 0.34
Per condom,
distributed
under public
and commercial
sector, Asia region
(extrapolated)
(Schwartlander,
Stover et al. 2001;
Futures Group/
Constella, Stover et
al. 2004)
Condom provision
Male condom
Low – 0.10
Med – 0.34
High – 0.50
Per condom,
economic cost, full,
sub-Saharan Africa.
Condom distributed
in the public sector.
(Kumaranayake and
Watts 2000)
34
User Manual
35
<< Contents
Intervention
Item
Unit cost (USD)
Scope
Source
Mass media
Cost per campaign
Low – 490,000
Med – 517,000
High – 650,00
Sub-Saharan data,
economic cost,
full cost. Low cost
includes salary and
overheads costs in
Gabon. Medium
costs relates to 3
month program
excludes overheads
and salaries. High
cost extrapolated.
(Kumaranayake and
Watts 2000)
Blood safety
Cost of screening
a unit of blood for
HIV, include cost
of replacement
of blood when
discarded because
of a positive test
Low – 5.30
Med – 12.50
High – 18.20
Sub-Saharan
data, based on
national and
hospital systems in
Zimbabwe, Zambia
and Uganda.
(Kumaranayake and
Watts 2000)
Blood safety
Cost of screening
a unit of blood for
HIV.
Low – 3.76
Med – 18.22
Asia region
(Schwartlander,
Stover et al. 2001;
Futures Group/
Constella, Stover et
al. 2004)
PEP
Cost of PEP kit
100
Asia region
(Schwartlander,
Stover et al. 2001;
Futures Group/
Constella, Stover et
al. 2004)
Safe injection
Additional cost of
AD syringes
0.03
Asia region
(Schwartlander,
Stover et al. 2001;
Futures Group/
Constella, Stover et
al. 2004)
Youth education
Cost per teacher
training (primary
school)
Cost per teacher
training (secondary
school)
Low – 75
Med – 200
High – 400
Low – 120
Med – 240
High – 495*
Sub-Saharan Africa,
financial cost,
incremental cost.
Tanzania data.
* economic cost,
incremental from
Cameroon.
(Kumaranayake and
Watts 2000)
Youth education
Cost per teacher
training (primary
and secondary
school)
Low – 35.27
Med – 199.01
Asia region
(Schwartlander,
Stover et al. 2001;
Futures Group/
Constella, Stover et
al. 2004)
Regional HIV & Development Programme
for Asia & the Pacific
UNDP Regional Centre in Colombo
23, Independence Avenue, Colombo 7, Sri Lanka
Tel: (94 - 11) 4526400 Fax: (94 - 11) 4526410
Email: [email protected]
UNDP is the UN’s global development network, an organization advocating for change and connecting countries to knowledge,
experience and resources to help people build a better life. As a trusted development partner, and co-sponsor of UNAIDS, it helps
countries put HIV/AIDS at the centre of national development and poverty reduction strategies, build national capacity to mobilize
all levels of government and civil society for a coordinated and effective response to the epidemic, and protect the right of people
living with AIDS, women, and vulnerable population. Because HIV/AIDS is a world-wide problem, UNDP supports these national
efforts by offering knowledge, resources and best practices from around the world.