1
To our customers,
Old Company Name in Catalogs and Other Documents
On April 1st, 2010, NEC Electronics Corporation merged with Renesas Technology
Corporation, and Renesas Electronics Corporation took over all the business of both
companies. Therefore, although the old company name remains in this document, it is a valid
Renesas Electronics document. We appreciate your understanding.
Renesas Electronics website: http://www.renesas.com
April 1st, 2010
Renesas Electronics Corporation
Issued by: Renesas Electronics Corporation (http://www.renesas.com)
Send any inquiries to http://www.renesas.com/inquiry.
Notice
1.
2.
3.
4.
5.
6.
7.
All information included in this document is current as of the date this document is issued. Such information, however, is
subject to change without any prior notice. Before purchasing or using any Renesas Electronics products listed herein, please
confirm the latest product information with a Renesas Electronics sales office. Also, please pay regular and careful attention to
additional and different information to be disclosed by Renesas Electronics such as that disclosed through our website.
Renesas Electronics does not assume any liability for infringement of patents, copyrights, or other intellectual property rights
of third parties by or arising from the use of Renesas Electronics products or technical information described in this document.
No license, express, implied or otherwise, is granted hereby under any patents, copyrights or other intellectual property rights
of Renesas Electronics or others.
You should not alter, modify, copy, or otherwise misappropriate any Renesas Electronics product, whether in whole or in part.
Descriptions of circuits, software and other related information in this document are provided only to illustrate the operation of
semiconductor products and application examples. You are fully responsible for the incorporation of these circuits, software,
and information in the design of your equipment. Renesas Electronics assumes no responsibility for any losses incurred by
you or third parties arising from the use of these circuits, software, or information.
When exporting the products or technology described in this document, you should comply with the applicable export control
laws and regulations and follow the procedures required by such laws and regulations. You should not use Renesas
Electronics products or the technology described in this document for any purpose relating to military applications or use by
the military, including but not limited to the development of weapons of mass destruction. Renesas Electronics products and
technology may not be used for or incorporated into any products or systems whose manufacture, use, or sale is prohibited
under any applicable domestic or foreign laws or regulations.
Renesas Electronics has used reasonable care in preparing the information included in this document, but Renesas Electronics
does not warrant that such information is error free. Renesas Electronics assumes no liability whatsoever for any damages
incurred by you resulting from errors in or omissions from the information included herein.
Renesas Electronics products are classified according to the following three quality grades: “Standard”, “High Quality”, and
“Specific”. The recommended applications for each Renesas Electronics product depends on the product’s quality grade, as
indicated below. You must check the quality grade of each Renesas Electronics product before using it in a particular
application. You may not use any Renesas Electronics product for any application categorized as “Specific” without the prior
written consent of Renesas Electronics. Further, you may not use any Renesas Electronics product for any application for
which it is not intended without the prior written consent of Renesas Electronics. Renesas Electronics shall not be in any way
liable for any damages or losses incurred by you or third parties arising from the use of any Renesas Electronics product for an
application categorized as “Specific” or for which the product is not intended where you have failed to obtain the prior written
consent of Renesas Electronics. The quality grade of each Renesas Electronics product is “Standard” unless otherwise
expressly specified in a Renesas Electronics data sheets or data books, etc.
“Standard”:
8.
9.
10.
11.
12.
Computers; office equipment; communications equipment; test and measurement equipment; audio and visual
equipment; home electronic appliances; machine tools; personal electronic equipment; and industrial robots.
“High Quality”: Transportation equipment (automobiles, trains, ships, etc.); traffic control systems; anti-disaster systems; anticrime systems; safety equipment; and medical equipment not specifically designed for life support.
“Specific”:
Aircraft; aerospace equipment; submersible repeaters; nuclear reactor control systems; medical equipment or
systems for life support (e.g. artificial life support devices or systems), surgical implantations, or healthcare
intervention (e.g. excision, etc.), and any other applications or purposes that pose a direct threat to human life.
You should use the Renesas Electronics products described in this document within the range specified by Renesas Electronics,
especially with respect to the maximum rating, operating supply voltage range, movement power voltage range, heat radiation
characteristics, installation and other product characteristics. Renesas Electronics shall have no liability for malfunctions or
damages arising out of the use of Renesas Electronics products beyond such specified ranges.
Although Renesas Electronics endeavors to improve the quality and reliability of its products, semiconductor products have
specific characteristics such as the occurrence of failure at a certain rate and malfunctions under certain use conditions. Further,
Renesas Electronics products are not subject to radiation resistance design. Please be sure to implement safety measures to
guard them against the possibility of physical injury, and injury or damage caused by fire in the event of the failure of a
Renesas Electronics product, such as safety design for hardware and software including but not limited to redundancy, fire
control and malfunction prevention, appropriate treatment for aging degradation or any other appropriate measures. Because
the evaluation of microcomputer software alone is very difficult, please evaluate the safety of the final products or system
manufactured by you.
Please contact a Renesas Electronics sales office for details as to environmental matters such as the environmental
compatibility of each Renesas Electronics product. Please use Renesas Electronics products in compliance with all applicable
laws and regulations that regulate the inclusion or use of controlled substances, including without limitation, the EU RoHS
Directive. Renesas Electronics assumes no liability for damages or losses occurring as a result of your noncompliance with
applicable laws and regulations.
This document may not be reproduced or duplicated, in any form, in whole or in part, without prior written consent of Renesas
Electronics.
Please contact a Renesas Electronics sales office if you have any questions regarding the information contained in this
document or Renesas Electronics products, or if you have any other inquiries.
(Note 1) “Renesas Electronics” as used in this document means Renesas Electronics Corporation and also includes its majorityowned subsidiaries.
(Note 2) “Renesas Electronics product(s)” means any product developed or manufactured by or for Renesas Electronics.
User’s Manual
740 PC4701 Emulator Debugger
V.1.02
User’s Manual
Renesas Microcomputer Development
Environment System
Rev.1.00 2006.08
Active X, Microsoft, MS-DOS, Visual Basic, Visual C++, Windows and Windows NT are either registered trademarks or trademarks of Microsoft
Corporation in the United States and other countries.
IBM and AT are registered trademarks of International Business Machines Corporation.
Intel and Pentium are registered trademarks of Intel Corporation.
Adobe and Acrobat are registered trademarks of Adobe Systems Incorporated.
All other brand and product names are trademarks, registered trademarks or service marks of their respective holders.
Keep safety first in your circuit designs!
! Renesas Technology Corporation and Renesas Solutions Corporation put the maximum effort into making semiconductor products better and
more reliable, but there is always the possibility that trouble may occur with them. Trouble with semiconductors may lead to personal injury,
fire or property damage. Remember to give due consideration to safety when making your circuit designs, with appropriate measures such as
(i) placement of substitutive, auxiliary circuits, (ii) use of nonflammable material or (iii) prevention against any malfunction or mishap.
Notes regarding these materials
! These materials are intended as a reference to assist our customers in the selection of the Renesas Technology product best suited to the
customer's application; they do not convey any license under any intellectual property rights, or any other rights, belonging to Renesas
Technology Corporation, Renesas Solutions Corporation or a third party.
! Renesas Technology Corporation and Renesas Solutions Corporation assume no responsibility for any damage, or infringement of any thirdparty's rights, originating in the use of any product data, diagrams, charts, programs, algorithms, or circuit application examples contained in
these materials.
! All information contained in these materials, including product data, diagrams, charts, programs and algorithms represents information on
products at the time of publication of these materials, and are subject to change by Renesas Technology Corporation and Renesas Solutions
Corporation without notice due to product improvements or other reasons. It is therefore recommended that customers contact Renesas
Technology Corporation, Renesas Solutions Corporation or an authorized Renesas Technology product distributor for the latest product
information before purchasing a product listed herein. The information described here may contain technical inaccuracies or typographical
errors. Renesas Technology Corporation and Renesas Solutions Corporation assume no responsibility for any damage, liability, or other loss
rising from these inaccuracies or errors. Please also pay attention to information published by Renesas Technology Corporation and Renesas
Solutions Corporation by various means, including the Renesas home page (http://www.renesas.com).
! When using any or all of the information contained in these materials, including product data, diagrams, charts, programs, and algorithms,
please be sure to evaluate all information as a total system before making a final decision on the applicability of the information and products.
Renesas Technology Corporation and Renesas Solutions Corporation assume no responsibility for any damage, liability or other loss
resulting from the information contained herein.
! Renesas Technology semiconductors are not designed or manufactured for use in a device or system that is used under circumstances in
which human life is potentially at stake. Please contact Renesas Technology Corporation, Renesas Solutions Corporation or an authorized
Renesas Technology product distributor when considering the use of a product contained herein for any specific purposes, such as apparatus
or systems for transportation, vehicular, medical, aerospace, nuclear, or undersea repeater use.
! The prior written approval of Renesas Technology Corporation and Renesas Solutions Corporation is necessary to reprint or reproduce in
whole or in part these materials.
! If these products or technologies are subject to the Japanese export control restrictions, they must be exported under a license from the
Japanese government and cannot be imported into a country other than the approved destination. Any diversion or reexport contrary to the
export control laws and regulations of Japan and/or the country of destination is prohibited.
! Please contact Renesas Technology Corporation or Renesas Solutions Corporation for further details on these materials or the products
contained therein.
For inquiries about the contents of this document or product, fill in the text file the installer generates in the following directory and email to your
local distributor.
\SUPPORT\Product-name\SUPPORT.TXT
Renesas Tools Homepage
http://www.renesas.com/en/tools
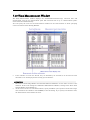
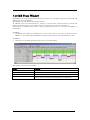
Overview
The High-performance Embedded Workshop is a Graphical User Interface intended to ease the
development and debugging of applications written in C/C++ programming language and assembly
language for Renesas microcomputers. Its aim is to provide a powerful yet intuitive way of accessing,
observing and modifying the debugging platform in which the application is running.
This help explains the function as a "debugger" of High-performance Embedded Workshop.
Target System
The Debugger operates on the emulator PC4701 system.
Supported CPU
This help explains the debugging function corresponding to the following CPUs.
•
M32C/80, M16C/80 Series
Note: In this help, the information which depends on this CPU is described as "for M32C".
M16C/60, M16C/30, M16C/Tiny, M16C/20, M16C/10 Series
•
Note: In this help, the information which depends on this CPU is described as "for M16C/R8C".
740 Family
•
Note: In this help, the information which depends on this CPU is described as "for 740".
(Blank Page)
Setup of Debugger
1
1. Features
1
1.1 Real-Time RAM Monitor Function...............................................................................................1
1.1.1 RAM Monitor Area ............................................................................................................1
1.1.2 Sampling Period ................................................................................................................2
1.1.3 Related Windows ...............................................................................................................2
1.2 Break Functions............................................................................................................................3
1.2.1 Software Breaks Function.................................................................................................3
1.2.2 Hardware Break ................................................................................................................4
1.2.3 Protect Break .....................................................................................................................5
1.3 Real-Time Trace Function ............................................................................................................6
1.3.1 Trace Area..........................................................................................................................6
1.3.2 Trace Condition Setting ....................................................................................................7
1.3.3 Trace Data Write Condition ..............................................................................................7
1.4 Time Measurement Function .......................................................................................................8
1.4.1 The Measurement Condition ............................................................................................8
1.5 Coverage Function ........................................................................................................................9
1.5.1 Coverage Measurement Area............................................................................................9
1.5.2 Related Windows ...............................................................................................................9
1.6 Real-Time OS Debugging Function............................................................................................10
1.7 GUI Input/Output Function .......................................................................................................10
2. About the Emulator PC4701
11
2.1 Communication methods ............................................................................................................11
2.2 Function table .............................................................................................................................11
3. Before starting the debugger
12
3.1 Communication method by emulator .........................................................................................12
3.1.1 USB Interface ..................................................................................................................12
3.1.2 LAN Interface ..................................................................................................................12
3.1.3 LPT Interface...................................................................................................................12
3.1.4 Proprietary Parallel Interface.........................................................................................13
3.2 Download of Firmware................................................................................................................14
3.3 Setting before emulator starts....................................................................................................15
3.3.1 USB communication with the Emulator ........................................................................15
3.3.2 LAN communication with the Emulator ........................................................................16
3.3.3 Proprietary parallel communication with emulators by Windows XP/2000/NT 4.0.....18
3.3.4 LAN communication with emulators by Windows Me/98/XP/2000...............................19
4. Preparation before Use
20
4.1 Workspaces, Projects, and Files .................................................................................................20
4.2 Starting the High-performance Embedded Workshop ..............................................................21
4.2.1 Creating a New Workspace (Toolchain Used) ................................................................22
4.2.2 Creating a New Workspace (Toolchain Not Used) .........................................................27
4.3 Starting the Debugger ................................................................................................................32
4.3.1 Connecting the Emulator ................................................................................................32
4.3.2 Ending the Emulator.......................................................................................................32
5. Setup the Debugger
33
5.1 Init Dialog....................................................................................................................................33
5.1.1 MCU Tab..........................................................................................................................34
5.1.2 Debugging Information Tab ............................................................................................36
5.1.3 F/W and Work Area Tab..................................................................................................37
5.1.4 Memory Extension Mode Tab .........................................................................................38
i
5.1.5 Clock Tab .........................................................................................................................41
5.1.6 Script Tab.........................................................................................................................42
5.2 Setting of the Communication Interface....................................................................................43
5.2.1 Setting of the USB Interface ...........................................................................................43
5.2.2 Setting of the LPT Interface ...........................................................................................44
5.2.3 Setting of the LAN Interface...........................................................................................45
5.2.4 Setting of the Parallel Interface......................................................................................46
5.2.5 Setting of the Serial Interface.........................................................................................47
5.3 Setup the Debugger for M32C ....................................................................................................48
5.3.1 Emem Dialog....................................................................................................................48
5.4 Setup the Debugger for M16C/R8C............................................................................................52
5.4.1 Map Command.................................................................................................................52
5.5 Setup the Debugger for 740 ........................................................................................................53
5.5.1 Map Command.................................................................................................................53
5.6 Method of making MCU file .......................................................................................................54
5.6.1 Method of making MCU file (the M16C/R8C Debugger) ...............................................54
5.6.2 Method of making MCU file (the 740 Debugger) ...........................................................55
Tutorial
57
6. Tutorial
59
6.1 Introduction.................................................................................................................................59
6.2 Usage ...........................................................................................................................................60
6.2.1 Step1 : Starting the Debugger ........................................................................................60
6.2.2 Step2 : Checking the Operation of RAM.........................................................................61
6.2.3 Step3 : Downloading the Tutorial Program ...................................................................62
6.2.4 Step4 : Setting a Breakpoint ...........................................................................................64
6.2.5 Step5 : Executing the Program .......................................................................................65
6.2.6 Step6 : Reviewing Breakpoints .......................................................................................67
6.2.7 Step7 : Viewing Register .................................................................................................68
6.2.8 Step8 : Viewing Memory .................................................................................................69
6.2.9 Step9 : Watching Variables.............................................................................................70
6.2.10 Step10 : Stepping Through a Program .........................................................................72
6.2.11 Step11 : Forced Breaking of Program Executions........................................................75
6.2.12 Step12 : Displaying Local Variables .............................................................................76
6.2.13 Step13 : Stack Trace Function ......................................................................................77
6.2.14 What Next? ....................................................................................................................78
Reference
79
7. Windows/Dialogs
81
7.1 RAM Monitor Window ................................................................................................................82
7.1.1 Extended Menus ..............................................................................................................84
7.1.2 Setting the RAM monitor area........................................................................................85
7.2 ASM Watch Window ...................................................................................................................86
7.2.1 Extended Menus ..............................................................................................................87
7.3 C Watch Window.........................................................................................................................88
7.3.1 Extended Menus ..............................................................................................................89
7.4 Coverage Window........................................................................................................................90
7.4.1 Extended Menus ..............................................................................................................91
7.4.2 Refer to the Source Line/the Executed Address .............................................................92
7.5 Script Window .............................................................................................................................93
ii
7.5.1 Extended Menus ..............................................................................................................94
7.6 S/W Break Point Setting Window ..............................................................................................95
7.6.1 Command Button.............................................................................................................96
7.6.2 Setting and Deleting a Break Points from Editor(Source) Window..............................97
7.7 H/W Break Point Setting Window..............................................................................................98
7.7.2 Specify the Combinatorial Condition............................................................................103
7.7.3 Specify the Process ID ...................................................................................................104
7.7.4 Command Button...........................................................................................................104
7.7.5 Specify the Events (Instruction Fetch) .........................................................................105
7.7.6 Specify the Events (Memory Access) ............................................................................109
7.7.7 Specify the Events (Bit Access) .....................................................................................133
7.7.8 Specify the Events (Interrupt) ......................................................................................135
7.7.9 Specify the Events (External Trigger Signal) ..............................................................137
7.7.10 Specify the Event Combination Condition .................................................................139
7.7.11 Specify the Process ID .................................................................................................142
7.8 Protect Window .........................................................................................................................143
7.8.1 Extended Menus ............................................................................................................143
7.9 Trace Point Setting Window.....................................................................................................144
7.9.1 Specify the Trace Event.................................................................................................145
7.9.2 Specify the Combinatorial Condition............................................................................148
7.9.3 Specify the Process ID ...................................................................................................149
7.9.4 Specify the Trace Range ................................................................................................149
7.9.5 Specify the Trace Write Condition................................................................................150
7.9.6 Command Button...........................................................................................................150
7.9.7 Specify the Events (Instruction Fetch) .........................................................................151
7.9.8 Specify the Events (Memory Access) ............................................................................151
7.9.9 Specify the Events (Bit Access) .....................................................................................151
7.9.10 Specify the Events (Interrupt) ....................................................................................151
7.9.11 Specify the Events (External Trigger Signal) ............................................................151
7.9.12 Specify the Event Combination Condition .................................................................151
7.9.13 Specify the Process ID .................................................................................................151
7.9.14 Specify the write condition..........................................................................................152
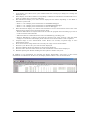
7.10 Time Measurement Window...................................................................................................156
7.10.1 Specify the Time Measurement Event........................................................................157
7.10.2 Time Measurement Condition ....................................................................................161
7.10.3 Command Button.........................................................................................................161
7.10.4 Specify the Events (Instruction Fetch) .......................................................................162
7.10.5 Specify the Events (Memory Access) ..........................................................................162
7.10.6 Specify the Events (Bit Access) ...................................................................................162
7.10.7 Specify the Events (Interrupt) ....................................................................................162
7.10.8 Specify the Events (External Trigger Signal) ............................................................162
7.10.9 Set the Measurement Condition .................................................................................163
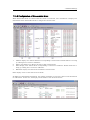
7.11 Trace Window..........................................................................................................................167
7.11.1 Configuration of Bus Mode..........................................................................................167
7.11.2 Configuration of Disassemble Mode ...........................................................................169
7.11.3 Configuration of Data Access Mode ............................................................................170
7.11.4 Configuration of Source Mode.....................................................................................171
7.11.5 Extended Menus ..........................................................................................................172
7.11.6 Display of bus information on the M32C Debugger ...................................................173
7.11.7 Display of bus information on the M16C/R8C Debugger...........................................175
7.11.8 Display of bus information on the 740 Debugger.......................................................177
7.12 Data Trace Window.................................................................................................................178
7.12.1 Extended Menus ..........................................................................................................179
7.13 GUI I/O Window......................................................................................................................180
7.13.1 Extended Menus ..........................................................................................................181
7.14 MR Window .............................................................................................................................182
7.14.2 Display the Task Status ..............................................................................................184
iii
7.14.3 Display the Ready Queue Status ................................................................................188
7.14.4 Display the Timeout Queue Status.............................................................................189
7.14.5 Display the Event Flag Status ....................................................................................191
7.14.6 Display the Semaphore Status....................................................................................193
7.14.7 Display the Mailbox Status.........................................................................................195
7.14.8 Display the Data Queue Status ..................................................................................197
7.14.9 Display the Cycle Handler Status ..............................................................................199
7.14.10 Display the Alarm Handler Status ...........................................................................201
7.14.11 Display the Memory Pool Status ..............................................................................202
7.14.12 Display the Task Context..........................................................................................204
7.15 MR Trace Window...................................................................................................................206
7.15.1 Extended Menus ..........................................................................................................208
7.15.2 Refer the Execution History of Task(MRxx Window) ................................................209
7.16 MR Analyze Window...............................................................................................................215
7.16.1 Configuration of CPU Occupancy Status Display Mode............................................215
7.16.2 Configuration of Ready State Duration Display Mode ..............................................216
7.16.3 Configuration of System Call History Display Mode .................................................216
7.16.4 Extended Menus ..........................................................................................................217
7.16.5 Analyze the Execution History of Task ......................................................................217
7.17 MR Task Pause Window .........................................................................................................220
7.17.1 About Task Pause Function ........................................................................................220
7.17.2 Extended Menus ..........................................................................................................221
7.17.3 Pause the Specified Task.............................................................................................222
7.18 Task Trace Window.................................................................................................................227
7.18.1 Extended Menus ..........................................................................................................228
7.18.2 Refer the Execution History of Task(Taskxx Window)..............................................229
7.19 Task Analyze Window.............................................................................................................234
7.19.1 Extended Menus ..........................................................................................................234
7.19.2 Analyze the Execution History of Task ......................................................................235
8. Table of Script Commands
236
8.1 Table of Script Commands (classified by function) .................................................................236
8.1.1 Execution Commands....................................................................................................236
8.1.2 File Operation Commands ............................................................................................236
8.1.3 Register Operation Commands .....................................................................................237
8.1.4 Memory Operation Commands .....................................................................................237
8.1.5 Assemble/Disassemble Commands ...............................................................................237
8.1.6 Software Break Setting Commands..............................................................................237
8.1.7 Hardware Break Setting Commands............................................................................238
8.1.8 Real-time Trace Commands ..........................................................................................238
8.1.9 Coverage Measurement Commands .............................................................................238
8.1.10 Script/Log File Commands ..........................................................................................238
8.1.11 Program Display Commands ......................................................................................238
8.1.12 Map Commands ...........................................................................................................239
8.1.13 Clock Command...........................................................................................................239
8.1.14 WatchDog Timer Commands ......................................................................................239
8.1.15 C Language Debugging Commands............................................................................239
8.1.16 Real-time OS Command..............................................................................................239
8.1.17 Utility Commands .......................................................................................................239
8.2 Table of Script Commands (alphabetical order) ......................................................................240
9. Writing Script Files
242
9.1 Structural Elements of a Script File ........................................................................................242
9.1.1 Script Command ............................................................................................................243
9.1.2 Assign Statement...........................................................................................................243
9.1.3 Conditional Statement ..................................................................................................243
9.1.4 Loop Statement(while,endw) and Break Statement ....................................................244
9.1.5 Comment statements ....................................................................................................244
iv
9.2 Writing Expressions..................................................................................................................245
9.2.1 Constants .......................................................................................................................245
9.2.2 Symbols and labels ........................................................................................................246
9.2.3 Macro Variables.............................................................................................................247
9.2.4 Register variables ..........................................................................................................248
9.2.5 Memory variables ..........................................................................................................248
9.2.6 Line Nos. ........................................................................................................................248
9.2.7 Character constants ......................................................................................................249
9.2.8 Operators .......................................................................................................................249
10.
C/C++ Expressions
250
10.1 Writing C/C++ Expressions ....................................................................................................250
10.1.1 Immediate Values........................................................................................................250
10.1.2 Scope Resolution ..........................................................................................................251
10.1.3 Mathematical Operators .............................................................................................251
10.1.4 Pointers ........................................................................................................................251
10.1.5 Reference......................................................................................................................251
10.1.6 Sign Inversion..............................................................................................................252
10.1.7 Member Reference Using Dot Operator .....................................................................252
10.1.8 Member Reference Using Arrow .................................................................................252
10.1.9 Pointers to Members....................................................................................................253
10.1.10 Parentheses................................................................................................................253
10.1.11 Arrays.........................................................................................................................253
10.1.12 Casting to Basic Types ..............................................................................................253
10.1.13 Casting to typedef Types ...........................................................................................254
10.1.14 Variable Name ...........................................................................................................254
10.1.15 Function Name ..........................................................................................................254
10.1.16 Character Constants..................................................................................................254
10.1.17 Character String Literals..........................................................................................254
10.2 Display Format of C/C++ Expressions ...................................................................................255
10.2.1 Enumeration Types .....................................................................................................255
10.2.2 Basic Types ..................................................................................................................255
10.2.3 Pointer Types ...............................................................................................................256
10.2.4 Array Types..................................................................................................................257
10.2.5 Function Types ............................................................................................................257
10.2.6 Reference Types ...........................................................................................................257
10.2.7 Bit Field Types.............................................................................................................257
10.2.8 When No C Symbol is Found ......................................................................................258
10.2.9 Syntax Errors...............................................................................................................258
10.2.10 Structure and Union Types.......................................................................................258
11.
12.
Display the Cause of the Program Stoppage
259
Attention
260
12.1 Common Attention ..................................................................................................................260
12.1.1 File operation on Windows..........................................................................................260
12.1.2 Area where software breakpoint can be set ...............................................................261
12.1.3 Get or set C variables ..................................................................................................261
12.1.4 Function name in C++.................................................................................................262
12.1.5 Debugging multi modules ...........................................................................................262
12.1.6 Syncronized debugging................................................................................................262
12.1.7 Down-load of Firmware ...............................................................................................262
12.1.8 Ristriction of LPT port.................................................................................................263
12.1.9 Notes for coverage function .........................................................................................264
12.1.10 Emulator reset switch ...............................................................................................264
12.1.11 Debugging Resource on Emulator ............................................................................264
12.2 Attention of the M32C Debugger ...........................................................................................265
12.2.1 Stack area used by the emulator ................................................................................265
v
12.2.2 Interrupt stack pointer when resetting the target program .....................................265
12.2.3 Option of C Compiler/Assembler/Linker ....................................................................265
12.2.4 Target MCU HOLD terminal......................................................................................265
12.2.5 Hardware Event ..........................................................................................................265
12.2.6 Time Measurement Resource......................................................................................266
12.2.7 CPU rewrite .................................................................................................................266
12.2.8 MR STK script command ............................................................................................266
12.3 Attention of the M16C/R8C Debugger ...................................................................................267
12.3.1 Map of stack area used by the emulator.....................................................................267
12.3.2 Options for compiler, assembler, and linker ..............................................................267
12.3.3 TASKING C Compiler .................................................................................................267
12.3.4 Target MCU HOLD terminal......................................................................................267
12.3.5 Hardware Event ..........................................................................................................268
12.3.6 Operating frequency of MCU ......................................................................................268
12.3.7 The correspondence OS version of task pause function.............................................268
12.3.8 Memory Space Expansion ...........................................................................................268
12.3.9 Watch dog timer...........................................................................................................268
12.3.10 CPU rewrite ...............................................................................................................269
12.3.11 MR STK script command ..........................................................................................269
12.4 Attention of the 740 Debugger ...............................................................................................270
12.4.1 Setting of Memory Map ...............................................................................................270
12.4.2 Emulation Pod M37515T-RPD....................................................................................270
12.4.3 Stack area used by the emulator ................................................................................270
12.4.4 Specify the Clock..........................................................................................................270
12.4.5 Watch dog timer...........................................................................................................270
12.4.6 Option of C Compiler/Assembler/Linker ....................................................................270
12.4.7 About the single-step execution and the program break function in the internal RAM
area of the mcu .......................................................................................................................271
12.4.8 Debugging in the 16-Timer functions .........................................................................271
12.4.9 Hardware Event ..........................................................................................................271
12.4.10 Operating frequency of MCU ....................................................................................271
12.5 Option of C Compiler/Assembler/Linker................................................................................272
12.5.1 When Using NCxx .......................................................................................................272
12.5.2 When Using the Assembler Package for 740 Family .................................................272
12.5.3 When Using the IAR C Compiler (EW) ......................................................................273
12.5.4 When Using the IAR C Compiler (ICC)......................................................................274
12.5.5 When Using the TASKING C Compiler (EDE) ..........................................................275
12.5.6 When Using the TASKING C Compiler (CM) ............................................................275
12.5.7 When Using the IAR EC++ Compiler (EW) ...............................................................276
vi
Setup of Debugger
1
(Blank Page)
2
1 Features
1.
Features
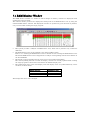
1.1 Real-Time RAM Monitor Function
This function allows you to inspect changes of memory contents without impairing the realtime
capability of target program execution.
The PC4701 emulator system contains a 1-Kbyte RAM monitor area (which cannot be divided into
smaller areas).
This debugger supports the real time RAM monitor function which allows you to reference the
memory data without sacrificing real time performance during execution of the target program.
1.1.1 RAM Monitor Area
This debugger provides a 1KB of RAM monitor area, which can be placed at any continuous addresses.
1
1.1.2 Sampling Period
Sampling cycle means the display update interval.
You can specify this function in any window which supports the RAM monitor. (The interval of 100
ms is set by default.)
The actual sampling cycle may take longer time than the specified cycle depending on the operating
environment. (Sampling cycle depends on the following environments.)
•
Communication interface
•
Number of the RAM Monitor windows displayed
•
Size of the RAM Monitor window displayed
•
Number of ASM watch points within the RAM monitor area of the ASM Watch window
•
Number of C watch points within the RAM monitor area of the C Watch window
1.1.3 Related Windows
The window where the function of the real time RAM monitor function can be used is shown below.
•
RAM Monitor Window
•
ASM Watch Window
•
C Watch Window
2
1 Features
1.2 Break Functions
1.2.1 Software Breaks Function
Software Break breaks the target program before execution of the command at the specified address.
This break point is called software breakpoint.
The software breakpoint is set/reset in the Editor (Source) window or in the S/W Breakpoint Setting
window. You can also disable/enable a software breakpoint temporarily.
You can specify up to 64 software breakpoints. When specifying two or more software breakpoints, the
breakpoint combination is based on the OR logic. (Arrival to any one of breakpoints breaks the target
program.)
1.2.1.1 Setting of software breakpoint
The software breakpoint can be set by the following windows.
•
Editor (Source) Window
•
S/W Break Point Setting Window
You can double-click the mouse to set/reset the software breakpoint in the Editor (Source) window.
You can also switch to temporarily disable/enable the software breakpoint in the S/W Breakpoint
Setting window.
1.2.1.2 Area where software breakpoint can be set
The area which can be set for software breakpoint varies depending on the product.
For the areas available for software breakpoint, see the following:
"12.1.2 Area where software breakpoint can be set"
3
1.2.2 Hardware Break
This function causes the target program to stop upon detecting a data read/write to memory,
instruction execution, or the rising/falling edge of the input signal fed from an external trace cable.
The contents of events that can be set vary with each target MCU.
The following designations are available as break events:
•
Address designation
- Instruction fetch
- Memory access
- Bit access
•
External trigger designation
•
Interruption
The number of events that can be specified are six events of all. For the address designation method,
instruction fetch and memory access allow the range designation and logical condition designation, in
addition to the normal one-address designation. Moreover, instruction fetch allows you to specify the
function name.
Memory access allows you to specify the comparison data to read/write data related to the specified
address in the same manner as when setting the H/W breakpoint. It also allows mask designation to
the comparison data.
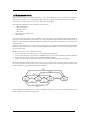
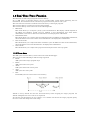
These break events can be combined as below:
•
Trace when all of the valid events are established (AND condition)
•
Trace when all of the valid events are established at the same time (simultaneous AND condition)
•
Trace when one of the valid events is established (OR condition)
•
Trace upon entering a break state during state transition (State Transition condition)
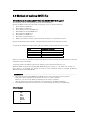
When transitional conditions set in an interstate pass are met, a state transition occurs, in which case
the target program can be made to stop upon entering a break state. The conceptual diagram shown
below depicts the relationship between state and pass.
State transition break allows you to select "specified task only" (or "other than specified task") as the
break condition to meet the real time OS.
4
1 Features
1.2.3 Protect Break
This function causes the target program to stop upon detecting a data write to the ROM area or an
access to an unused area (read/write or instruction execution).
Protect Break is a function to detect a write of data to the ROM area and an access (read, write,
command execution) to an unused area and stop the target program.
1.2.3.1 Protect Attribute
You can specify the following attributes in byte.
•
Access Disable
•
Read Only
•
R/W Enable
1.2.3.2 Access Protect Area
A protect area is a continuous 256-KB area starting from the 64KB boundary. Its start address is
called protect base address.
The protect base address immediately after starting the emulator is set to 0h.
The entire protect area is set to "R/W Enable" by default at start of the emulator.
1.2.3.3 Set Method of Protect Break
The two types of designation methods are provided:
•
To fetch the memory attribute from the target program section information
•
To specify the memory attribute of any area
5
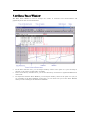
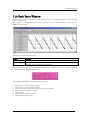
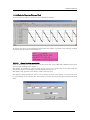
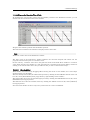
1.3 Real-Time Trace Function
This function records a target program execution history.
Up to 32K cycles of execution history can be recorded. This record allows inspecting the bus
information, executed instructions, and source program execution path for each cycle.
The real-time trace function records the execution history of the target program.
The execution history is referred to in the tracing window.
The execution history can be referred to in the following mode.
•
BUS mode
This mode allows you to inspect cycle-by-cycle bus information. The display content depends on
the MCU and emulator system used. In addition to bus information, this mode allows
disassemble, source line or data access information to be displayed in combination.
•
Disassemble mode
This mode allows you to inspect the executed instructions. In addition to disassemble information,
this mode allows source line or data access information to be displayed in combination.
•
Data access mode
This mode allows you to inspect the data read/write cycles. In addition to data access information,
this mode allows source line information to be displayed in combination.
•
Source mode
This mode allows you to inspect the program execution path in the source program.
1.3.1 Trace Area
The 32K cycles execution history can be referred to with this debugger.
The trace area of the following 5 mode is being supported.
•
Break
32K cycles before target program stops
•
Before
32K cycles before trace point
•
About
16K cycles either side of trace point
•
After
32K cycles after trace point
•
Full
Until 32K cycles are written in the trace memory
"Break" is set by default. To refer the execution history before stopping the target program, use
"Break" (designation of trace event is not required).
To refer the execution history at any position, or to continue execution of the target program, specify
the trace event and change the trance range.
6
1 Features
1.3.2 Trace Condition Setting
The following designations are available as trace events:
•
Address designation
- Instruction fetch
- Memory access
- Bit access
•
External trigger designation (eight events)
•
Interruption
The number of events that can be specified are six events of all. These break events can be combined
as below:
•
Trace when all of the valid events are established (AND condition)
•
Trace when all of the valid events are established at the same time (And(same time) comdition)
•
Trace when one of the valid events is established (OR condition)
•
Trace upon entering a break state during state transition (State Transition condition)
You can select "specified task only" (or "other than specified task") as the trace condition to meet the
real time OS.
1.3.3 Trace Data Write Condition
Trace data write conditions can be specified.
You can specify the following write conditions:
•
Write conditions unlimited (default)
•
Cycles from the start event established to the end event established
•
Only cycles where the start event is established
•
Cycles from the start event established to the start event unestablished
•
Other than cycles from the start event established to the end event established
•
Other than cycles where the start event is established
•
Other than cycles from the start event established to the start event unestablished
7
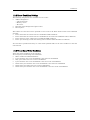
1.4 Time Measurement Function
The time measurement function allows you to measure the maximum, minimum, and average
execution times and measurement counts of a specified zone.
With this debugger, time can be measured up to four points simultaneously.
1.4.1 The Measurement Condition
The measurement condition of the zone time can specify the following in each measurement zone.
•
Execution time of the specified function
•
Time between two events
•
Time between event establishments
•
Time of event occurrence period
8
1 Features
1.5 Coverage Function
Coverage Measurement is a function to record the addresses executed (accessed) by the target
program (C0 coverage).
After stopping execution of the target program, you can understand which addresses are not executed
yet.
By using the coverage measurement function in the test process, you can check for missing test items.
1.5.1 Coverage Measurement Area
The coverage measurement area is any continuous 256 KB area starting from the 64 KB boundary.
The starting address is called coverage base address.
The coverage base address immediately after starting the emulator is set to 0h.
1.5.2 Related Windows
Refer to the coverage measurement result in the following windows.
•
Editor (Source) Window
•
Memory Window
•
Coverage Window
9
1.6 Real-Time OS Debugging Function
This function debugs the realtime OS-dependent parts of the target program that uses the realtime
OS.
This function helps to show the status of the realtime OS and inspect a task execution history, etc.
The debugger for 740 can't show the status of the realtime OS.
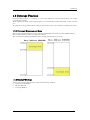
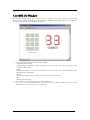
1.7 GUI Input/Output Function
This function simulates the user target system's key input panel (buttons) and output panel on a
window.
Buttons can be used for the input panel, and labels (strings) and LEDs can be used for the output
panel.
10
2 About the Emulator PC4701
2.
About the Emulator PC4701
The PC4701 emulator system is a generic term used for the 8/16-bit MCU emulators. It can be used in
combination with the emulation pod for the PC4701 to debug application programs for each MCU.
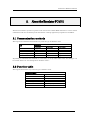
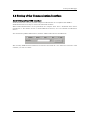
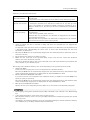
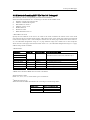
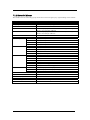
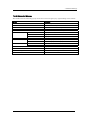
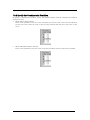
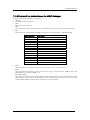
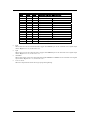
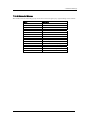
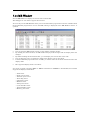
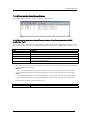
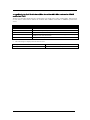
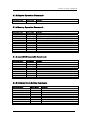
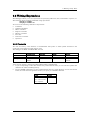
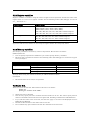
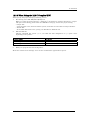
2.1 Communication methods
The supported communication methods vary with the type of emulator used.
I/F
Emulator
PC4701U
PC4701M
PC4701HS
USB
LAN
LPT
Proprietary parallel
Serial
Support
Support
Support
-
Support
Support
Support
Support
Support
Support
Depending on communication methods, it is necessary to set up some items before the debugger can
be started. Please see "3.3 Setting before emulator starts "
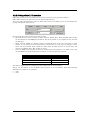
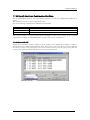
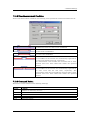
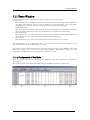
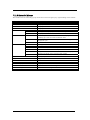
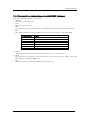
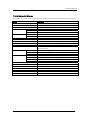
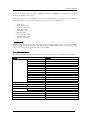
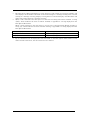
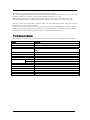
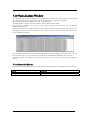
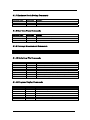
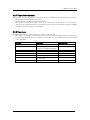
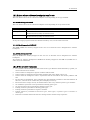
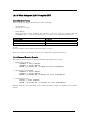
2.2 Function table
The supported functions vary with the type of emulator used.
PC4701U/M/HS
S/W Break
H/W Break
Real-Time Trace
RAM Monitor
C0 Coverage
Time Measurement
Protect Break
64 points
6 points
32K Cycles
1K bytes area
256K bytes area
Go to Stop / 4 points interval
Access Protect
11
3.
Before starting the debugger
3.1 Communication method by emulator
The supported communication methods are as follows. (The supported communication methods vary
with the type of emulator used. )
USB, LAN, LPT, Proprietary parallel, Serial
3.1.1 USB Interface
Supported only when using the PC4701U emulator.
•
The supported host computer OS is Windows Me/98/2000/XP. USB communication cannot be
used in any other OS.
•
Compliant with USB Standard 1.1.
•
Connections via USB hub are not supported.
•
By connecting the host computer and the emulator with USB cable, it is possible to install the
supported device drivers using a wizard.
•
The necessary cable is included with the emulator.
3.1.2 LAN Interface
Supported only when using the PC4701U/HS emulator.
•
The IP address, etc. must be set in the emulator before it can be connected in a LAN.
•
To communicate with the emulator via a LAN on Windows Me/98/2000/XP, Windows' registry
information must partly be modified.
•
The PC4701U emulator in a LAN can be connected to the PC4701Us on another network
connected to the LAN via a router.
•
The emulators PC4701U and PC4701HS use different LAN cables. Specifically, the PC4701U
uses LAN cable (10BASE-T only) generally available on the market, whereas the PC4701HS uses
the LAN cable (10BASE-T/5) included with it.
•
The host computer and the emulator can be connected directly.
3.1.3 LPT Interface
Supported only when using the PC4701U/M emulator.
•
This communication uses the host computer's parallel (printer) interface.
•
The necessary cable is included with the emulator.
•
Four communication modes are supported that include ECP, EPP, Byte, and Nibble.
Communication modes that can be supported depend on the host computer's BIOS settings.
(Communication modes may not always be used even when they are supported by BIOS.)
12
3 Before starting the debugger
3.1.4 Proprietary Parallel Interface
Supported only when using the PC4701HS emulator.
•
The host computer must have a dedicated interface board, the PCA4202G02, incorporated in it
(only the ISA bus is supported). The necessary cable is included with the emulator.
•
When using this communication on Windows NT 4.0/2000/XP, a device driver must separately be
set.
3.1.4.1 Serial Interface
Supported only when using the PC4701M/HS emulator.
•
This communication uses the host computer's serial interface.
•
The necessary cable is included with the emulator.
13
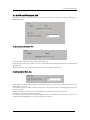
3.2 Download of Firmware
It is necessary to down-load the firmware which corresponds to connected Emulation Pod when the
debugger is started to the emulator.
•
You have changed your emulation pod.
•
The firmware downloaded to the emulator is unknown one.
•
You have setup the debugger for the first time.
•
You have upgraded emulator debugger.
Press the system reset switch within two seconds after powering up the PC4701 to establish the
maintenance mode.
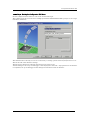
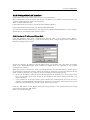
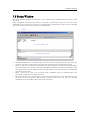
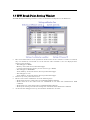
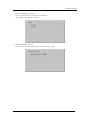
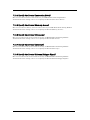
This debugger searches the version of the firmware downloaded to the emulator at start. Also when
the firmware downloaded to the emulator is of old version, a mode which drives this debugger to
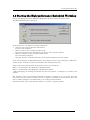
download firmware is set.
When this debugger gets started while the emulator is set in the mode which drives the debugger to
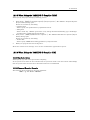
download firmware forcedly, the following dialog is opened at start.
Click the OK button to download the firmware.
ATTENTION
•
•
If the emulator being used is the PC4701HS, use other communication methods (dedicated
parallel or serial) to download the firmware.
Before the firmware can be downloaded by the emulator in a LAN connection, the IP address, etc.
must first be registered in the emulator.
14
3 Before starting the debugger
3.3 Setting before emulator starts
3.3.1 USB communication with the Emulator
Connection of USB devices is detected by Windows' Plug & Play function. The device driver needed
for the connected USB device is automatically installed.
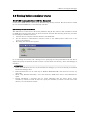
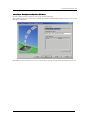
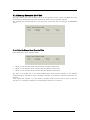
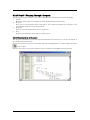
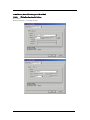
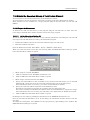
3.3.1.1 Install of USB device driver
The USB devices connected are detected by Windows' Plug & Play function. The installation wizard
for USB device drivers starts after the device had been detected. The following shows the procedure
for installing the USB device drivers.
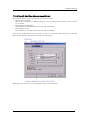
1.
Connect the host computer and the emulator with USB cable.
2. Set the emulator's communication interface switch to the "USB" position. Then turn on the
power to the emulator.
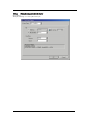
3. The dialog box shown below appears.
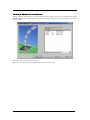
Go on following the wizard, and a dialog box for specifying the setup information file (inf file) is
displayed. Specify the musbdrv.inf file stored in a location below the directory where this debugger is
installed.
ATTENTION
•
•
•
•
Before the USB device drivers can be installed, the debugger you use must already be installed.
Install this debugger first.
USB communication can be used only in Windows Me/98/2000/XP, and cannot be used in any
other OSs.
When using Windows 2000/XP, a user who install the USB device driver need administrator
rights.
During installation, a message may be output indicating that the device driver proper
musbdrv.sys cannot be found. In this case, specify the musbdrv.sys which is stored in the same
directory as is the musbdrv.inf file.
15
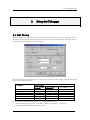
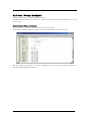
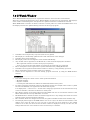
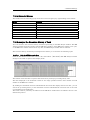
3.3.2 LAN communication with the Emulator
Before the emulator can be connected in a LAN, the IP address, etc. must first be registered in the
emulator. For the emulator in default settings, the utility "setip.exe" included with the debugger may
be used to set the IP address, etc. in the emulator.
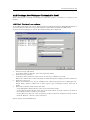
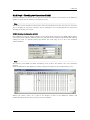
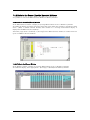
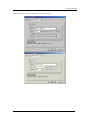
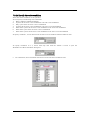
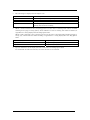
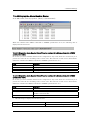
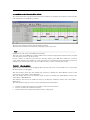
3.3.2.1 Setting of the LAN Interface using the SETIP.EXE
The utility "SETIP" included with this debugger may be used to set the IP address, etc. in the
emulator while in default settings. SETIP detects the Emulator's in default settings that are
connected to the same network. SETIP is stored in a location below the directory where this debugger
is installed . The file name is "setip.exe".
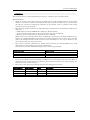
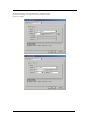
To register the IP address in the emulator, follow the procedure described below.
1. Connect the emulator with LAN cable to the same network (same subnet) as the host computer
is connected.
2. Set the emulator's communication interface switch to the "LAN" position. Then turn on the
power to the emulator.
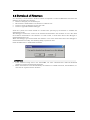
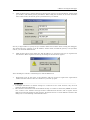
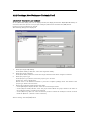
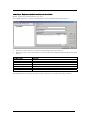
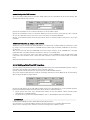
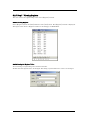
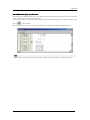
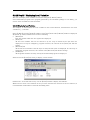
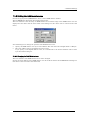
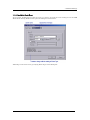
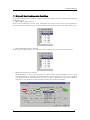
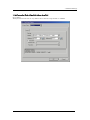
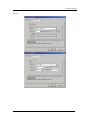
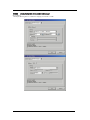
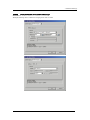
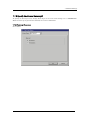
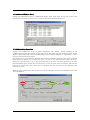
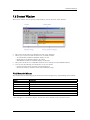
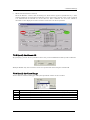
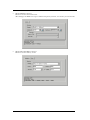
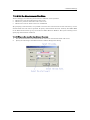
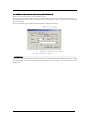
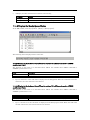
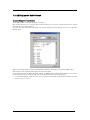
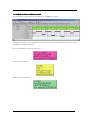
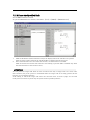
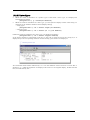
3. Start SETIP. When SETIP has started up, the dialog box shown below appears, choose the
emulator of use, click the OK button.
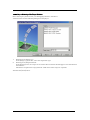
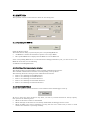
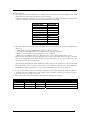
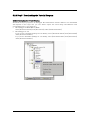
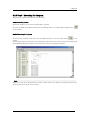
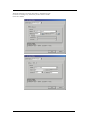
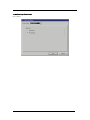
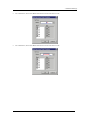
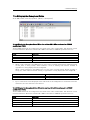
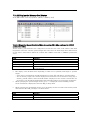
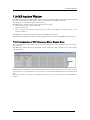
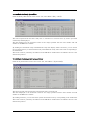
4.
Click the OK button, and showing information on the emulator connected to the network. (This
information consists of the MAC address followed by the serial number of the emulator.)
To register the IP address, click the Next button. To cancel registration, click the Close button. If not
displayed, check whether the communication interface switch is set correctly and after temporarily
turning off the power, turn it back on again. Then click the Search button.
16
3 Before starting the debugger
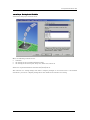
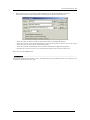
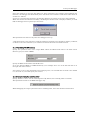
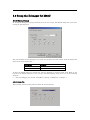
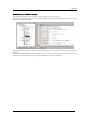
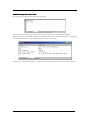
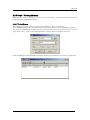
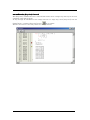
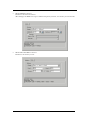
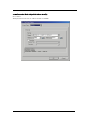
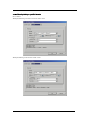
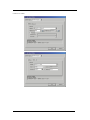
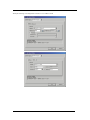
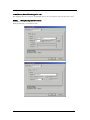
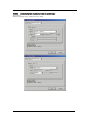
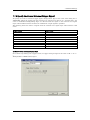
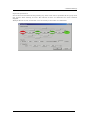
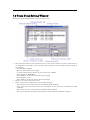
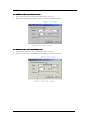
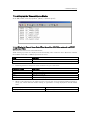
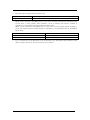
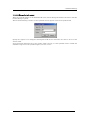
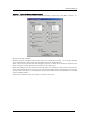
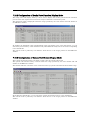
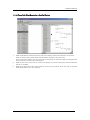
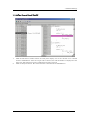
5.
Click the Next button, and the dialog box shown below appears. Set the IP address, subnet mask,
port number, and default gateway IP address. When using the emulator on the same network's
same subnet mask, the default gateway IP address may be omitted.
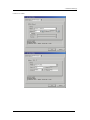
Use any 4-digit number to specify the port number. (Enter that number when starting the debugger.)
For details about the contents of the IP address, subnet mask, and default gateway to be specified,
contact your network administrator.
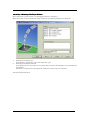
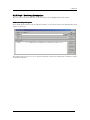
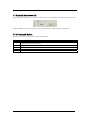
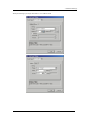
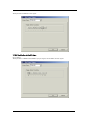
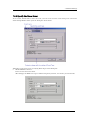
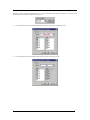
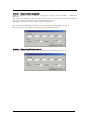
6.
Click the Set button on the dialog box. The IP address, etc. that have been set are registered in
the emulator. When registered correctly, the dialog box shown below appears.
After checking the contents of the dialog box, click the OK button.
7.
Temporarily turn off the power to the emulator and turn it back on again. The registered IP
address becomes effective after the emulator is powered up again.
ATTENTION
•
•
If multiple Emulators in default settings are connected on the same network, only the first
emulator detected is displayed.
The emulators which have had an IP address already set cannot be detected by SETIP. In such a
case, connect to the emulator through another communication interface and re-register the IP
address from the Init dialog box that appears. For details on how to set IP addresses from the Init
dialog box, see "5.2.3Setting of the LAN Interface."
17
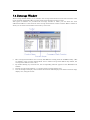
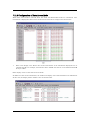
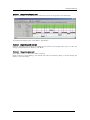
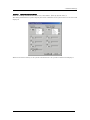
3.3.3 Proprietary parallel communication with emulators by Windows
XP/2000/NT 4.0
If you are using this debugger in a combination of Windows XP/2000/NT 4.0 + the parallel I/F, you
need to specify the start address of I/O addresses (7 bytes) to the device driver for PCA4202G02, (The
I/O address for PCA4202G02 is set to 100h initially.) You can set this setting with setPca4202.exe
included with this debugger. The above programs are installed in the directory where this debugger is
installed. At the first time of using this debugger,or when you want to change the I/O address for
PCA4202G02 because of conflict with other devices, please follow the procedure of the setting
described below.
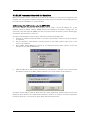
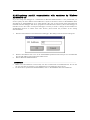
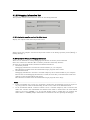
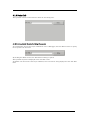
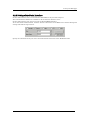
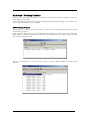
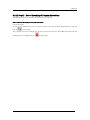
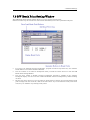
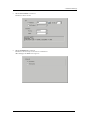
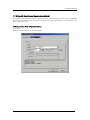
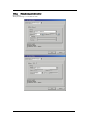
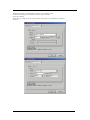
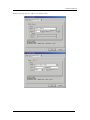
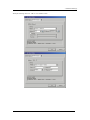
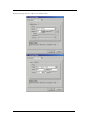
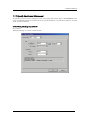
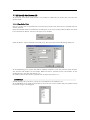
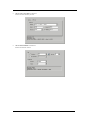
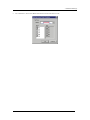
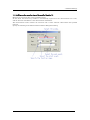
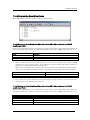
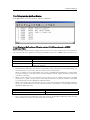
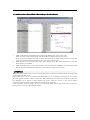
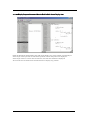
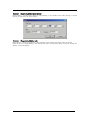
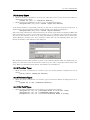
1.
Execute setPca4202.exe included with this debugger. The dialog box shown below will appear.
2.
Find the I/O address that is set on the PCA4202G02 parallel board and input it in hexadecimal
into the I/O Address input field. Click "OK" button.
Restart Windows XP/2000/NT 4.0.
3.
ATTENTION
•
•
Make sure setPca4202.exe is executed by one who is authorized as an Administrator. No one but
the user who has the authority of an Administrator can install the device driver.
For detail about parallel board PCA4202G02, refer to "PCA4202G02 Instruction Manual".
18
3 Before starting the debugger
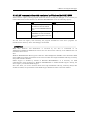
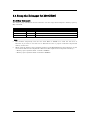
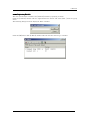
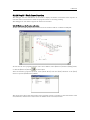
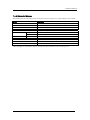
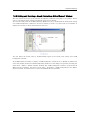
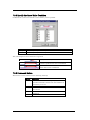
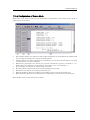
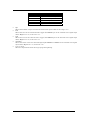
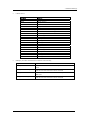
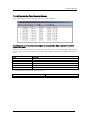
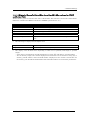
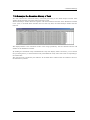
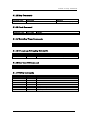
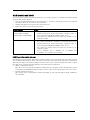
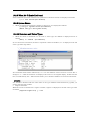
3.3.4 LAN communication with emulators by Windows Me/98/XP/2000
Please exexute registry setting program (Sack.exe) before starting the debugger. It is necessary for
LAN communication with emulators by Windows Me/98/XP/2000 to set the following registry.
OS
Key
Data
Windows Me/98
HKEY_LOCAL_MACHINE¥S
ystem¥CurrentControlSet¥
Services¥VxD¥MSTCP¥Sack
Opts
HKEY_LOCAL_MACHINE¥S
YSTEM¥CurrentControlSet¥
Services¥Tcpip¥Parameters¥
SackOpts
0(REG_SZ)
Windows XP/2000
0(REG_DWORD)
You can clear the registry with executing the program "UnSack.exe". The above programs are
installed in the directory where this debugger is installed.
ATTENTION
Make sure Sack.exe and UnSack.exe is executed by one who is authorized as an
Administrator.(Windows XP/2000) No one but the user who has the authority of an Administrator can
install the device driver.
Note
Windows Me/98/XP/2000 TCP supports "Selective Acknowledgments (SACK)" as documented in RFC
2018. SACK gives higher performance in the network which have high bandwidth and long round-trip
delays like satellite channels.
SACK support is enabled by default in Windows Me/98/XP/2000. It is necessary for LAN
communication with emulators by Windows Me/98/XP/2000 to disable SACK support. Setting the
above registry can disable SACK support.
Note that when you use the network which have high bandwidth and long round-trip delays like
satellite channels, the performance with SACK support disabled is lower than with enabled.
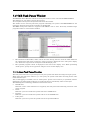
19
4.
Preparation before Use
Please run the High-performance Embedded Workshop and connect the emulator .
In addition, in order to debug with this product, it is necessary to create a workspace.
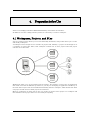
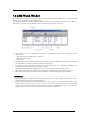
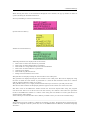
4.1 Workspaces, Projects, and Files
Just as a word processor allows you to create and modify documents, this product allows you to create
and modify workspaces.
A workspace can be thought of as a container of projects and, similarly, a project can be thought of as
a container of project files. Thus, each workspace contains one or more projects and each project
contains one or more files.
Workspaces allow you to group related projects together. For example, you may have an application
that needs to be built for different processors or you may be developing an application and library at
the same time. Projects can also be linked hierarchically within a workspace, which means that when
one project is built all of its "child" projects are built first.
However, workspaces on their own are not very useful, we need to add a project to a workspace and
then add files to that project before we can actually do anything.
20
4 Preparation before Use
4.2 Starting the High-performance Embedded Workshop
Activate the High-performance Embedded Workshop from [Programs] in the [Start] menu.
The [Welcome!] dialog box is displayed.
In this dialog box, A workspace is created or displayed.
•
[Create a new project workspace] radio button:
Creates a new workspace.
•
[Open a recent project workspace] radio button:
Uses an existing workspace and displays the history of the opened workspace.
•
[Browse to another project workspace] radio button:
Uses an existing workspace;
this radio button is used when the history of the opened workspace does not remain.
In the case of Selecting an Existing Workspace, select [Open a recent project workspace] or [Browse to
another project workspace] radio button and select the workspace file (.hws).
Please refer to the following about the method to create a new workspace.
Refer to "4.2.1Creating a New Workspace (Toolchain Used)"
Refer to "4.2.2Creating a New Workspace (Toolchain Not Used)"
* When debugging the existing load module file with this product, a workspace is created by this
method.
The method to create a new workspace depends on whether a toolchain is or is not in use. Note that
this product does not include a toolchain. Use of a toolchain is available in an environment where the
C/C++ compiler package for the CPU which you are using has been installed.
For details on this, refer to the manual attached to your C/C++ compiler package.
21
4.2.1 Creating a New Workspace (Toolchain Used)
4.2.1.1 Step1 : Creation of a new workspace
In the [Welcome!] dialog box that is displayed when the High-performance Embedded Workshop is
activated, select the [Create a new project workspace] radio button and click the [OK] button.
Creation of a new workspace is started.
The following dialog box is displayed.
1.
2.
3.
4.
Select the target CPU family
In the [CPU family] combo box, select the target CPU family.
Select the target toolchain
In the [Tool chain] combo box, select the target toolchain name when using the toolchain.
Select the project type
In the [Project type] list box, select the project type to be used.
In this case, select "Application" .
(Please refer to the manual attached to your C/C++ compiler package about the details of the
project type which can be chosen.)
Specify the workspace name and project name
- In the [Workspace Name] edit box, enter the new workspace name.
- In the [Project Name] edit box, enter the project name. When the project name is the same as
the workspace name, it needs not be entered.
- In the [Directory] edit box, enter the directory name in which the workspace will be created.
Click the [Browse...] button to select a directory.
After a setting, click the [OK] button.
22
4 Preparation before Use
4.2.1.2 Step2 : Setting for the Toolchain
A wizard for the project creation starts.
Here, the following contents are set.
•
toolchain
•
the setting for the real-time OS (when using)
•
the setting for the startup file, heap area, stack area, and so on
Please set required information and click the [Next] button.
The contents of a setting change with C/C++ compiler packages of use. Please refer to the manual
attached to your C/C++ compiler package about the details of the contents of a setting.
23
4.2.1.3 Step 3: Selecting of the Target Platform
Select the target system used for your debugging (emulator, simulator).
When the setting for the toolchain has been completed, the following dialog box is displayed.
1.
2.
Selecting of the Target type
In the [Target type] list box, select the target CPU type.
Selecting of the Target Platform
In the [Targets] area, the target for the session file used when this debugger is activated must be
selected here.
Check the box against the target platform. (And choose other target as required.)
And click the [Next] button.
24
4 Preparation before Use
4.2.1.4 Step4 : Setting the Configuration File Name
Set the configuration file name for each of the all selected target.
The configuration file saves the state of High-performance Embedded Workshop except for the target
(emulator, simulator).
The default name is already set. If it is not necessary to change, please click the [next] button as it is.
25
4.2.1.5 Step5 : The check of a created file name
Finally, confirm the file name you create. The files which will be generated by the High-performance
Embedded Workshop are displayed If you want to change the file name, select and click it then enter
the new name.
This is the end of the emulator settings.
Exit the Project Generator following the instructions on the screen.
26
4 Preparation before Use
4.2.2 Creating a New Workspace (Toolchain Not Used)
When debugging the existing load module file with this product, a workspace is created by this
method.
4.2.2.1 Step1 : Creation of a new workspace
In the [Welcome!] dialog box that is displayed when the High-performance Embedded Workshop is
activated, select the [Create a new project workspace] radio button and click the [OK] button.
Creation of a new workspace is started. The following dialog box is displayed.
1.
2.
3.
4.
Select the target CPU family
In the [CPU family] combo box, select the target CPU family.
Select the target toolchain
In the [Tool chain] combo box, select "None". In this case, toolchain is not used.
(When the toolchain has not been installed, the fixed information is displayed in this combo box.)
Select the project type
(When the toolchain is not used, it is displayed on a [Project Type] list box as "Debugger only Target Name". Select it. (When two or more project types are displayed, please select one of
them.)
Specify the workspace name and project name
- In the [Workspace Name] edit box, enter the new workspace name.
- In the [Project Name] edit box, enter the project name. When the project name is the same as
the workspace name, it needs not be entered.
- In the [Directory] edit box, enter the directory name in which the workspace will be created.
Click the [Browse...] button to select a directory.
After a setting, click the [OK] button.
27
4.2.2.2 Step 2: Selecting of the Target Platform
Select the target system used for your debugging (emulator, simulator).
A wizard starts and the following dialog box is displayed.
1.
2.
Selecting of the Target type
In the [Target type] list box, select the target CPU type.
Selecting of the Target Platform
In the [Targets] area, the target for the session file used when this debugger is activated must be
selected here.
Check the box against the target platform. (And choose other target as required.)
And click the [Next] button.
28
4 Preparation before Use
4.2.2.3 Step3 : Setting the Configuration File Name
Set the configuration file name for each of the all selected target.
The configuration file saves the state of High-performance Embedded Workshop except for the target
(emulator, simulator).
The default name is already set. If it is not necessary to change, please click the [next] button as it is.
This is the end of the emulator settings.
Exit the Project Generator following the instructions on the screen.
And the dialog for the setup of a debugger is also displayed at this time . If preparation of an emulator
is completed, set up the debugger in this dialog box and connect with an emulator.
29
4.2.2.4 Step4 : Registering the Load modules to be downloaded
Finally, register the load module file to be used.
Select [Debug Settings...] from the [Debug] menu to open the [Debug Settings] dialog box.
1.
2.
Select the product name to be connected in the [Target] drop-down list box.
Select the format of the load module to be downloaded in the [Default Debug Format] drop-down
list box.
Format Name
IEEE695_RENESAS
IEEE695_IAR
IEEE695_TASKING
ELF/DWARF2_IAR
ELF/DWARF2_TASKING
Intel-Hex+Sym
IEEE695_ICC740
Contents
IEEE-695 format file (When Using NCxx)
IEEE-695 format file (When Using IAR cross tool)
IEEE-695 format file (When Using Tasking cross tool)
ELF/DWARF2 format file (When Using IAR cross tool)
ELF/DWARF2 format file (When Using Tasking cross tool)
Intel Hex format file with Symbol format file (When Using SRA74)
IEEE-695 format file (When Using ICC740)
This debugger does not support the object formats, which are not shown in the drop down list.
30
4 Preparation before Use
3.
Then register the corresponding download module in the [Download Modules] list box.
A download module can be specified in the dialog opened with a [Add...] button.
- Enter the offset at which to load the download module in the [Offset] edit box.
- Select the format of the download module in the [Format] edit box. Please refer to the upper
table about the format name of a download module.
- Enter the full path and filename of the download module in the [Filename] edit box.
- Specifies the access size for the current download module in the [Access size] list box.
After that, click the [OK] button.
ATTENTION
"Access size" and "Perform memory verify during download" is ignored.The access size is always set to
1 and the verification does not work.
31
4.3 Starting the Debugger
The debugging can be started by connecting with an emulator.
4.3.1 Connecting the Emulator
Connect the emulator by simply switching the session file to one in which the setting for the emulator
use has been registered.
The session file is created by default. The session file has information about the target selected when
a project was created.
In the circled list box in the following tool bars, select the session name including the character string
of the target to connect.
After the session name is selected, the dialog box for setting the debugger is displayed and the
emulator will be connected.
4.3.2 Ending the Emulator
The emulator can be exited by using the following methods:
1. Selecting the "DefaultSession"
Select the "DefaultSession" in the list box that was used at the time of emulator connection.
2.
Exiting the High-performance Embedded Workshop
Select [Exit] from the [File] menu. High-performance Embedded Workshop will be ended.
The message box, that asks whether to save a session, will be displayed when an emulator is exited. If
necessary to save it, click the [Yes] button. If not necessary, click the [No] button.
32
5 Setup the Debugger
5.
Setup the Debugger
5.1 Init Dialog
The Init dialog box is provided for setting the items that need to be set when the debugger starts up.
The contents set from this dialog box are also effective the next time the debugger starts. The data set
in this dialog remains effective for the next start.
The tabs available on this dialog box vary with each product used. For details, click the desired tab
name shown in the table below.
Tab Name
MCU
Debugging Information
F/W and Work Area
Memory Extension Mode
Clock
Script
Product Name
The debugger
for M32C
Exist
Exist
----Exist
Exist
The debugger for
M16C/R8C
exist
exist
exist
exist
exist
exist
The debugger for 740
exist
exist
----exist
exist
You can open the Init dialog using either one of the following methods:
•
After the debugger gets started, select Menu - [Setup] -> [Emulator] -> [System...].
•
Start Debugger while holding down the Ctrl key.
33
5.1.1 MCU Tab
The specified content becomes effective when the next being start.
5.1.1.1 Specifying the MCU file
Click the "Refer" button.
The File Selection dialog is opened. Specify the corresponding MCU file.
•
An MCU file contains the information specific to the target MCU.
•
The specified MCU file is displayed in the MCU area of the MCU tab.
If the corresponding MCU file is not contained in the debugger/emulation pod, you must create a new
MCU file. To do this, see the following:
"5.6 Method of making MCU file "
5.1.1.2 Setting of the Communication Interface
The displayed data varies depending on the specified communication interface.
The available communication interface varies depending on the products.
The following shows the setting for each communication interface.
•
Refer to "5.2.1Setting of the USB Interface"
•
Refer to "5.2.2Setting of the LPT Interface"
•
Refer to "5.2.3Setting of the LAN Interface"
•
Refer to "5.2.4Setting of the Parallel Interface"
•
Refer to "5.2.5Setting of the Serial Interface"
5.1.1.3 Executing Self-Check
Specify this option to execute self-check* on the emulator when the debugger starts up.
Be sure to select the above check box only when you want to perform self-check at startup. Specify
this option in the following cases:
•
When the firmware cannot be downloaded
•
When although the firmware is successfully downloaded, the debugger does not start
•
When the MCU goes wild or something is wrong with the trace results and you want to check
whether the emulator is operating normally.
34
5 Setup the Debugger
Select the check box to close the Init dialog box. After connecting to the emulator and confirming the
firmware, the debugger will immediately start self-check on the emulator. (Self-check takes about 30
seconds to 1 minute.)
If an error is found in this self-check, the debugger displays the content of the error and is finished.
When the self-check terminated normally, the dialog box shown below is displayed. When you click
OK, the debugger starts up directly in that state.
This specification is effective only when the debugger starts up.
* Self-check refers to the function to check the emulator's internal circuit boards for memory condition,
etc. Refer to the user's manual of your emulator for details about the self-check function.
5.1.1.4 Specifying Clock Frequency
Specify the operation clock of the target MCU within the MCU Clock field in the Time Count
Resource group (in units of MHz).
Specify the MCU clock and the clock divide ratio.
If you are using the MCU at 10 MHz divided by 4, for example, enter "10" on the left side and "4" on
the right side of the text box.
If no values are set in the clock divide ratio specifying area, it is assumed that the clock is not divided
(i.e., the same as you would specify the value 1).
5.1.1.5 Using/unusing the watchdog timer
Specify whether or not to use the watchdog timer. (By default, the watchdog timer is unused.)
This specification exist for the M32C debugger only.
When debugging the target system that uses a watchdog timer, select the check box shown above.
35
5.1.2 Debugging Information Tab
The specified content becomes effective when the next being download.
5.1.2.1 display the compiler used and its object format
Display the compiler used and its object file format.
Please specify the compiler used and its object file format in the dialog opened by menu [Debug] ->
[Debug Settings...].
5.1.2.2 Specify the Storing of Debugging Information
There are two methods for storing debugging information: on-memory and on-demand.
Select one of these two methods. (The on-memory method is selected by default.)
To select the on-demand method, click the On Demand check box.
•
On-memory method
Debugging information is stored in the internal memory of your computer.
This method is suitable when the load module (target program) size is small.
•
On-demand method
Debugging information is stored in a reusable temporary file on the hard disk of your computer.
Because the stored debugging information is reused, the next time you download the same load
module it can be downloaded at high speed.
This method is suitable when the load module (target program) size is large.
Notes
•
•
If the load module size is large, the on-memory method may be inefficient because it requires a
very large amount of time for downloading. In such a case, select the on-demand method.
In the on-demand method, a folder in which to store a reusable temporary file is created in the
folder that contains the downloaded load module. This folder is named after the load module
name by the word "~INDEX_" to it. If the load module name is "sample.abs", for example, the
folder name is "~INDEX_sample". This folder is not deleted even after quitting the debugger.
36
5 Setup the Debugger
5.1.3 F/W and Work Area Tab
The specified content becomes effective when the next being start. In this tab, only the debugger for
M16C/R8C exists.
5.1.3.1 Select the Firmware File
Usually, click the Default radio button in the F/W group.
Click the Select radio button when you have to download firmware different from the one described in
the MCU file.
The F/W Name list box is enabled only when you click the Select radio button.
5.1.3.2 Specify the Work Area
In the Work Area Start Address field in the Work Area group, specify the top address of the area to be
used as the work area.
The emulator uses the MCU internal reservation area (unused area) as the debugging work area
(about 10 bytes).
Specify the work area so that it is accommodated in its MCU internal reservation area.
The default work area top address is 2C00h.
To debug a microcomputer (ex. 20K-byte RAM version if the M16C/62 group) whose work area is
within the internal RAM area, you must change the work area.
37
5.1.4 Memory Extension Mode Tab
This tab enabled only when the MCU tab in the Init dialog is used to specify the MCU file of the
microcomputer (M16C/62 group) which supports the memory space expansion function.
The specified data remains effective for the next start. In this tab, only the debugger for M16C/R8C
exists.
5.1.4.1 Select the Memory Space Extension Mode
Select the memory space extension mode.
•
•
•
When you use a normal mode, Please click the "Normal" radio button.
When you use extension mode 1, Please click the "Mode1" radio button.
When you use extension mode 2, Please click the "Mode2" radio button.
The data of the eighth line of the selected MCU (data which specifies whether or not memory
extension mode is required) is used to determine whether or not memory extension mode has to be
selected.
If the eighth line contains a '1', The memory extension mode selection area is active. If the line
contains a '0' or nothing, the memory extension mode selection area is inactive.
38
5 Setup the Debugger
ATTENTION
The functions may be restricted depending on the type of memory space expansion mode.
Extension Mode 1
•
When the memory space expansion area is displayed in the dis-assemble mode in the Program
window or the Source window, the displayed data may be different from what you would expect
through the operation accompanying redrawing of the window, such as up/down scroll, during
execution of the target program.
•
The following emulator functions are implemented by analyzing the bus information (address bus,
data bus).
- RAM monitor function (RAM Monitor window, C Watch window)
- Coverage measurement function (Coverage window, Coverage command)
- Memory protect function (Protect window, Protect command)
MCU accesses the program bank if Fetch (command) is specified for the bank duplicated area,
and the data bank if Read/Write is specified for the bank duplicated area. In above cases, a signal
which can distinguish which bank accesses the bus information is not output. Therefore, the
above function may not work as expected.
•
The memory reference commands are added, which reference the internal ROM in the bank
duplicated area in the dump format (see the table below).
You cannot use the DA command during execution of the target program.
•
•
Command name
Abbreviation
DumpByte2
DumpWord2
DumpLword2
DB2
DW2
DL2
If you use the Memory Reference/Change command for the bank duplicated area before MCU is
switched from the normal mode to the memory space expansion mode1 by the target program, the
function may not work as expected.
The memory map shows the following data after the debugger gets started.
Start Address
End Address
Map
Attention
00000
00400
04000
30000
003FF
03FFF
2FFFF
FFFFF
External
Internal
External
Internal
Cannot be changed (SFR area).
The internal RAM area cannot be changed.
Cannot be changed.
39
Extension Mode 2
•
The memory reference commands are added, which reference the internal ROM in the bank
duplicated area in the dump format (see the table below).
A memory reference command with the bank specification is added. The memory reference/the
change to the bank repetition area must use the following commands.
•
Command name
Abbreviation
DumpByte2
DumpWord2
DumpLword2
SetMemoryByte2
SetMemoryWord2
SetMemoryLword2
FillByte2
FillWord2
FillLword2
Move2
MoveWord2
DB2
DW2
DL2
MB2
MW2
ML2
FB2
FW2
FL2
MoveW2
The following emulator functions are implemented by analyzing the bus information (address bus,
data bus).
- RAM monitor function (RAM Monitor window, C Watch window)
- Coverage measurement function (Coverage window, Coverage command)
- Memory protect function (Protect window, Protect command)
- Hardware event (H/W break event*, Real-time trace event*, Time measurement event)
MCU switches the bank to be accessed based on the value in the bank selection register. A signal
which can distinguish which bank accesses the bus information is not output. Therefore, the
above function may work as expected.
*By specifying Simultaneous And (AND logic) (same time) for the hardware event and the bank
selection register, both of which are detected as the combined condition in the State Transient
Break/Trace window, the hardware event for the bank duplicated area can be detected.
•
•
If you use the Memory Reference/Change command for the bank duplicated area before MCU is
switched from the normal mode to the memory space expansion mode 2 by the target program,
the function may not work as expected.
The memory map shows the following data after the debugger gets started.
Start Address
End Address
Map
Attention
00000
00400
40000
C0000
003FF
3FFFF
BFFFF
FFFFF
External
Internal
External
Internal
Cannot be changed (SFR area).
The internal RAM area cannot be changed.
Cannot be changed.
40
5 Setup the Debugger
5.1.5 Clock Tab
The specified content becomes effective when the next being start.
5.1.5.1 Specify the Target Clock
Change the setting by synchronizing with the clock used by the target microcomputer. (Internal is set
by default.)
(The debugger for 740 does not have designation of Sub clock.)
Select Internal to set the internal clock, and External to set the external clock.
41
5.1.6 Script Tab
The specified content becomes effective when the next being start.
5.1.6.1 Automatically Execute the Script Commands
To automatically execute the script command at start of Debugger, click the "Refer" button to specify
the script file to be executed.
By clicking the "Refer" button, the File Selection dialog is opened.
The specified script file is displayed in the "Init File:" field.
To disable auto-execution of the script command, erase a character string displayed in the "Init File:"
field.
42
5 Setup the Debugger
5.2 Setting of the Communication Interface
5.2.1 Setting of the USB Interface
USB communication uses the personal computer's USB interface. It is compliant with USB 1.1.
USB communication can only be used on the PC4701U emulator.
Before USB communication can be performed, the computer must have a dedicated device driver
installed in it. For details on how to install USB device drivers, see "3.3.1.1Install of USB device
driver."
For connection by USB communication, click the "USB" radio button on the MCU tab.
The currently USB-connected emulators are listed in the Serial No. area. Select the serial No. of the
emulator you want to connect.
43
5.2.2 Setting of the LPT Interface
LPT communication uses a parallel interface (printer interface) of the personal computer.
LPT communication can only be used on the PC4701U/M emulator.
To set the LPT communication, click the "LPT" radio button of the MCU tab in the Init dialog. The
setting looks like the figure below.
Specify the mode for data transfers in the Type field.
•
The LPT interface has four modes for data transfers, Nibble, Byte, ECP, and EPP. Their modes
are documented in the IEEE-1284 standard. The mode possible to use depends on the PC with
the debugger.
•
When selecting AUTO, the debugger detect the LPT interface at the start and select a mode
possible to use which give better performance automatically. In some PC, the debugger cannot
detect the most suitable mode. Check the mode which the LPT interface in the PC have and
select it from Nibble, Byte, ECP or EPP, if cannot.
•
Start the BIOS setup program of the PC for checking the mode possible to use. How to start and
use the BIOS setup program depends on each PC, so refer the manuals of the PC.
Display of BIOS Setup
SPP, Standard Parallel Port, Output Only
Bidirectional, Bi-directional
ECP, Extended Capabilities Port
EPP, Enhanced Parallel Port
Communication Mode
Nibble
Byte
ECP
EPP
The address displayed in the parallel port base address field is the I/O address.
Specify the I/O address set in the BIOS setup program, in the I/O Address field. (The following
addresses are possible to be specified)
•
378h
•
278h
44
5 Setup the Debugger
5.2.3 Setting of the LAN Interface
LAN communication uses a LAN interface of the personal computer.
Before using LAN, you must register the emulator IP address, port number and subnet mask to the
emulator itself (Otherwise, LAN is not available).
Then, set LAN communication.
LAN communication can only be used on the PC4701U/HS emulator.
LAN communication with emulators by Windows Me/98/2000/XP
It is necessary for LAN communication with emulators by Windows Me/98/2000/XP to set the registry.
For details, see "3.3 Setting before emulator starts ".
5.2.3.1 Setting the IP Address and Subnet Mask
Start the debugger using other communication method. After it gets started, select Menu [Setup]->[Emulator]->[ System...] to open the Init dialog. Then, click the Target button of MCU tab.
The Target dialog will be opened.
Specify the emulator IP address in the IP Address field, port number in the Port field, and subnet
mask in the SubNetMask field. (The emulator IP address must be registered in the network
environment in advance.)
When the PC7501 or PC4701U is used, the Default Gateway area becomes effective. Please specify
the IP address of the default gateway. When the PC7501 or PC4701U is used on the identical sub net
mask of identical network, it is possible to omit the IP address of the default gateway.
•
Specify the IP address, subnet mask and Default Gateway in decimal byte by byte, by separating
every 4 bytes with a period. For details on the IP address and subnet mask, consult with your
network manager.
•
A port number set in the Port field is used to identify the communication process of the server
(emulator) in LAN (TCP/IP) communications. Specify the port number which has been set in the
emulator in hexadecimal. (Do not add a prefix which shows a base.)
Click the "OK" button in the Target dialog. The Target dialog is then closed and the Init dialog
appears again. Click the "OK" button.
Then, exit from the debugger.
45
5.2.3.2 Setting of the LAN Interface
To set the LAN communication, click the "LAN" radio button of the MCU tab in the Init dialog. The
setting looks like the figure below.
Specify the IP address of the connected emulator in the IP address field.
Specify the IP address, in bytes, in decimal. Delimit each 4 bytes with a period. The port No. is the ID
No. for the communication process of the server (emulator) on the LAN (TCP/IP).
Specify, in hexadecimal (Don't describe prefix which shows a cardinal number), the port No. set on the
emulator.
5.2.3.3 LAN connection by couple 1 with emulator
Emulators can be connected by LAN (TCP/IP) to a commercially available LAN card inserted in a PC
by using a cross conversion cable for 10BASE-T (also commercially available). A HUB is not necessary
in this case.
The cross conversion cable for 10BASE-T converts the male connector of the 10BASE-T of a straight
LAN cable that is included with the emulators to that of a cross LAN cable.
Connect a cross conversion cable to the male connector of the 10BASE-T of the straight LAN cable
connected to the emulator; then, connect the male connector of the cross conversion cable to the LAN
card.
The LAN communications can be set up the same way as normal one.
5.2.4 Setting of the Parallel Interface
Special parallel communication uses a special parallel interface board PCA4202G02 (option), which is
inserted in the extension slot (ISA bus) of the personal computer.
Special parallel communication can only be used on the PC4701HS emulator.
To set the parallel communication, click the "Parallel" radio button of the MCU tab in the Init dialog.
The setting looks like the figure below.
Specify the I/O address in the I/O Address field. which is the I/O address set on the parallel interface
board, in hexadecimal (Don't describe prefix which shows a cardinal number ).
•
Please specify the value of the hexadecimal number for the I/O address. (Don't describe prefix
which shows a cardinal number)
•
For detail about parallel board PCA4202G02, refer to "PCA4202G02 Instruction Manual".
ATTENTION
Combination of Windows NT 4.0/2000/XP and Parallel Interface
It is necessary to set the I/O address used for the device driver for a parallel communication.
Please refer to "Setting before emulator starts"3.3 Setting before emulator starts"
46
5 Setup the Debugger
5.2.5 Setting of the Serial Interface
Serial communication uses a serial interface (RS-232C) of the personal computer.
This communication method is available for all the PC4701 emulator series.
Serial communication can only be used on the PC4701M/HS emulator.
To set the Serial communication, click the "Serial" radio button of the MCU tab in the Init dialog. The
setting looks like the figure below.
Specify the communications port in the Port field and the baud rate in the Baud Rate field.
47
5.3 Setup the Debugger for M32C
5.3.1 Emem Dialog
In the Emem dialog box, setting information on the user target. The Emem dialog box opens after
closing the Init dialog box.
The tabs available on this dialog box vary with each product used. For details, click the desired tab
name shown in the table below.
Tab Name
Contents
Status
Emulation Memory
Specify the processor mode.
Specify the emulation memory area.
To keep the Emem dialog box closed next time the debugger is started, check "Next Hide" at the
bottom of the Emem dialog box. You can open the Emem dialog using either one of the following
methods:
•
After the debugger gets started, select Menu - [Setup] -> [Emulator] -> [Target...].
5.3.1.1 Status Tab
The specified content becomes effective when the next being start.
48
5 Setup the Debugger
5.3.1.1.1.
Select the Processor Mode
Specify the processor mode for the target system.
Either the following can be specified.
•
Single-chip Mode
Single-chip Mode
•
Memory Expansion
Memory Expansion Mode
•
Microprocessor
Microprocessor Mode
5.3.1.1.2.
Inspecting the MCU status
Clicking this tab displays the status of each MCU pin. It allows to check whether the MCU pin status
matches the processor mode to be set.
If the slider is at the middle position, it means that the value is indeterminate.
5.3.1.2 Emulation Memory Tab
The specified content becomes effective when the next being start.
49
5.3.1.2.1.
Debug monitor's bank address settings
This product allocates a 64-Kbyte contiguous address area as the emulator's work area for use by the
debug monitor.
Specify any bank that the target system does not use. The debug monitor uses a 64-Kbyte area from
the start address of the specified bank.
(Example: If the specified bank is "F0," then the debug monitor uses a 64-Kbyte area beginning with
address F000000h.)
•
•
The bank specified here cannot have its contents referenced or set.
The contents of this area when displayed in the Memory window or the Program/Source window's
disassemble display mode may not be correct.
The following bank addresses cannot be specified:
- MCU internal resources (e.g., SFR and RAM areas)
- DRAM area and multiplexed area
- Interrupt vector area
5.3.1.2.2.
Automatic emulation memory allocation for the internal ROM
When single-chip or memory extension mode is selected, emulation memory is automatically allocated
to the internal ROM area.
The automatically allocated internal ROM address range is displayed in this field.
5.3.1.2.3.
Emulation memory allocation for an extended area
When memory extension or microprocessor mode is selected, emulation memory can be allocated to
the extended area to be debugged (in up to four areas).
Here, allocate memory for the debug target area and specify its mapping information.
50
5 Setup the Debugger
Follow the procedure described below.
Bank
(Set bank address)
Length
(Specify size of area)
Map
(Specify area map)
•
•
•
•
Specify the bank address of the debug target area to be allocated in
hexadecimal.
If specified as C0, C00000h is the start address of the debug target area.
Specify the size of the debug target area (256 bytes or 1 Mbytes).
If Length is specified to be "256 bytes," banks 00, 04, 08, and up to FC
(every four banks) are specified for Bank; if Length is specified to be "1
Mbytes," banks 00, 10, 20, and up to F0 (every 16 banks) are specified for
Bank.
Specify the mapping information ("Internal" or "External") for the
specified area.
If no area is specified, select "No Use."
Internal The area specified to be "Internal" is mapped into the internal
area (emulation memory).
External The area specified to be "External" is mapped into the external
area (external resources in the target system).
Areas for which "No Use" is selected for Map and those not specified here are mapped into
external areas.
If compared to the case where areas are explicitly specified to be "External," the only difference is
a download speed. (Downloading into these areas is slower than downloading into the areas
specified to be "External.")
The internal ROM area is automatically mapped into the emulation memory. Therefore, there is
no need to set here.
Be careful that the debug areas will not overlap.
Make sure the total size of the specified debug target areas does not exceed the emulation
memory size of the emulation pod used.
The size of emulation memory that can be allocated varies with each emulation pod. (Consult the
user's manual of your emulation pod.)
The setting of the emulation memory area varies depending on the specified processor mode.
•
Single-chip Mode
You do not need to specify the area to be assigned as the emulation memory.
The internal ROM area is automatically mapped into the emulation memory. The address range
of the automatically mapped area is displayed in the Internal ROM Area: field.
•
Memory Expansion Mode(8bit and 16bit)
If you have an area to be assigned as the emulation memory in addition to internal ROM area,
specify it specify it separately.
The internal ROM area is automatically mapped into the emulation memory. The address range
of the automatically mapped area is displayed in the Internal ROM Area: field.
•
Microprocessor Mode(8bit and 16bit)
Specify the area to be assigned separately. (There is no area which is automatically assigned.)
ATTENTION
•
•
The mapping setting data specified using the Map command is not reflected to the Emem dialog
box.
et the emulation memory areas in the order of usage priority.
The emulation memory areas to be set by the Map command are numbered, ignoring the unused
(Not Use) areas.
Accordingly, the emulation memory areas set in the Emem dialog box and the emulation memory
area numbers set by the Map command will be mismatched.
51
5.4 Setup the Debugger for M16C/R8C
5.4.1 Map Command
The memory map information must be altered to suit the target microcomputer's memory space by
Map command.
Area
SFR
Internal RAM
Internal ROM
External ROM
Mapping
External
Internal
Internal
External
Note
Memory Expansion Mode, Microprocessor Mode
Note
•
•
The emulator temporarily uses the area from FFCh to FFFFh as a stack. Set this area as
Internal. If you want to set this area to External be sure to prepare read-/write-unprotected
memory for the area.
When using the memory space expansion function on the M16C/62 Series microcomputer, set the
areas whose addresses are duplicated to External. (The duplicated area depends on memory.)
- Memory space expansion mode 1: 4000h to 2FFFFh
- Memory space expansion mode 2: 40000h to BFFFFh
52
5 Setup the Debugger
5.5 Setup the Debugger for 740
5.5.1 Map Command
The memory map information must be altered to suit the target microcomputer's memory space by
Map command.
Area
SFR
RAM
Internal ROM
External ROM
Mapping
External
External
Internal
External
Note
Memory Expansion Mode, Microprocessor Mode
•
Internal
Enables the emulator's internal resources. The internal ROM area must be set for Internal
because it is always emulated with the emulator's internal resources. If an external area is not
allocated memory, you can use the emulator's internal memory by setting that area for Internal.
•
External
Enables resources external to the emulator (including the internal SFR and RAM areas). The
internal SFR and internal RAM areas must always be set for External. To enable the memory
allocated for an external area, set that area for External.
The memory map attributes immediately after the emulator has started up are External for
0h-3FFFh and Internal for 4000h-FFFFh. Use the MAP command to look up or alter the memory map
information. Execute the MAP command from the script window.
ATTENTION
•
•
[the case that the internal ROM area is located to the address before 4000h]
If the internal ROM area of the target mcu is located to the address before 4000h, please change
the mapping of this area to INTERNAL.
Example)
when the internal ROM area is located from 1080h:
1080 to 3FFF -> Internal
[About special settings when using the M38000TL2-FPD]
Always set the internal SFR and internal RAM areas for External. However, if the target MCU's
RAM area is larger than the RAM included in the emulator MCU, set that area for Internal.
Example)
When the RAM area included in the emulator MCU is 40-1FF and the target MCU's internal
RAM area is 40-2FF
40 to 1FF -> External
200 to 2FF -> Internal
53
5.6 Method of making MCU file
5.6.1 Method of making MCU file (the M16C/R8C Debugger)
The following content is sequentially described in the MCU file.
Specify the MCU name to the file name, and specify "mcu" to the file extension.
1. Start address of SFR area
2. End address of SFR area
3. Start address of internal RAM area
4. End address of internal RAM area
5. Start address of ROM area
6. End address of ROM area
7.
File name of the Firmware *1
8. MCU type (whether memory space extension mode has to be specified or not)*2
Specify the addresses in hex format, and don't add any prefix which describe its radix.
*1 Specify the addresses in hex format, and don't add any prefix which describe its radix.
MCU
Firmware file name
M16C/60 group
M16C/61 group
M16C/62 group
M16C/20 series
M30600
M30600
M30620B
M30620B
There is a case that the emulation pod need the different firmware from the listed firmware, when the
emulation pod is re-modeled.
*2 Specify whether the MCU: supports the memory space extension function or not.
When the MCU supports the function (EX: M16C/62 group), specify "1" , the other case, specify "0".
Only when "1" is specified, the setting for memory space extension mode is available in Memory
Extension Mode tab of INIT Dialog
ATTENTION
•
•
The areas specified as the ROM in the MCU file are write-protected from the program.
Even if the write command is executed to the area, no value is written.
However, you can use the Dump command to write values to memory.
(This is enabled only when the Internal area is mapped by the MAP command.)
If the RAM is assigned to the same area, you must change the setting of the MCU file.
5.6.1.1 Example
0
3FF
400
2BFF
F0000
FFFFF
M30600
0
54
5 Setup the Debugger
5.6.2 Method of making MCU file (the 740 Debugger)
The following content is sequentially described in the MCU file.
Please describe information on 1-4 referring to the data book on MCU used.
1. Number of stack page selection bit
2. Address of CPU mode register
3. End address of stack*1
4. Address of reset vector
5.
POD number*2
6.
Firmware name
7. MCU Information No.*3
*1End address of stack
Specify the last address of the area to be used as the stack. Consider the initial value of the stack
page selection bit in the CPU mode register. (The initial value of the stack page selection bit depends
on the microcomputer.) For a microcomputer which sets the stack page selection bit initial value to
"0", the allowable designation range is a 0 page address range (0h to FFh). For a microcomputer
which sets the stack page selection bit initial value to "1", the allowable designation range is a 1 page
address range (100h to 1FFh).
*2POD
number
Pod Name
POD No.
Firmware File
Correspondence MCU
M38000T-FPD
M38000TL-FPD
M38000TL2-FPD
M37207T-RPD
M37515T-RPD
M37610T-RPD
M37640T-RPD
M37690T-RPD
M38749T-RPD
0
M38000
7200/7450/7470/38000/
7500Series(7507,7510,7515,7520 Group) *4
80
40
2
4
1
40
M38000
M38000
M37600
M37600
M37600
M38000
M37102,M37201,M37202,M37204,M37207
7515/3850/3851 Group
7610 Group
7640 Group
7690 Group
3874Group
*4MCU
where emulator MCU does not exist is excluded.
Target firmware name
Omit "u.s", "h.s", or "l.s", which mean types of emulators.
*3MCU
Information No.
Please describe the MCU information No. referring to the following tables.
MCU Name
M3753x,M3754x
M376xx
Others
MCU Information No.
01
02
00
55
ATTENTION
For a new MCU, new POD number, new firmware name and new MCU information number may be
used.
5.6.2.1 Example
2
3B
FF
FFFC
0
M38000
00
56
Tutorial
57
(Blank Page)
58
6 Tutorial
6.
Tutorial
6.1 Introduction
This section describes the main functions of this debugger by using a tutorial program. The tutorial
programs are installed to the directory ¥WorkSpace¥Tutorial of the drive you installed
High-performance Embedded Workshop. There are workspaces for each targets and each MCUs.
Please select the corresponding one to your system, and open the workspace file (*.hws) from the
menu [Open Workspace...].
The tutorial program is based on the C program that sorts ten random data items in ascending or
descending order.
The tutorial program performs the following actions:
•
The tutorial function generates random data to be sorted.
•
The sort function sorts the generated random data in ascending order.
•
The change function then sorts the data in descending order.
Note
After recompilation, the addresses may differ from those given in this section.
When using the assembler package for 740 family
The tutorial program for the assembler package for 740 family is prepared. If you use the assembler
package for 740 family, please use it.
•
•
•
•
Please read this tutorial with replacing function names with subroutine name. (e.g. replace
"function sort()" with "subroutine sort")
About the source file name, also please replace it with the corresponding one.
The diagrams in this tutorial are for C program. The displayed diagram for the assembler
program may different from them.
Step9 and Step12 are descriptions of C program.
59
6.2 Usage
Please follow these instructions:
6.2.1 Step1 : Starting the Debugger
6.2.1.1 Preparation before Use
To run the High-performance Embedded Workshop and connect the emulator, refer to "4 Preparation
before Use ".
6.2.1.2 Setup the Debugger
If it connects with an emulator, the dialog box for setting up a debugger will be displayed. Please set
up the debugger in this dialog box.
To setup the debugger in this dialog box, refer to "5 Setup the Debugger ".
After the setup of a debugger, it will function as a debugger.
60
6 Tutorial
6.2.2 Step2 : Checking the Operation of RAM
Check that RAM is operating correctly. Display and edit the contents of the memory in the [Memory]
window to check that the memory is operating correctly.
Note
The memory can be installed on the board in some microcomputers. In this case, however, the above
way of checking the operation of memory may be inadequate. It is recommended that a program for
checking the memory be created.
6.2.2.1 Checking the Operation of RAM
Select [Memory] from the [CPU] submenu of the [View] menu and enter the RAM address (Here,
enter H'400) in the [Display Address] edit boxes. The [Scroll Start Address] and [Scroll End Address]
editing box is left to a default setting. (By default, the scroll range is set to 0h to the maximum
address of MCU.)
Note
The settings of the RAM area differ depending on the product. For details, refer to the hardware
manual.
Click the [OK] button. The [Memory] window is displayed and shows the specified memory area.
Placing the mouse cursor on a point in the display of data in the [Memory] window and
double-clicking allows the values at that point to be changed.
61
6.2.3 Step3 : Downloading the Tutorial Program
6.2.3.1 Downloading the Tutorial Program
Download the object program to be debugged. The download file and the address to be downloaded
will depends on the target mcu you uses. Please replace the screen image and addresses with
corresponding one to your target mcu.
•
The Debugger for M16C/R8C or M32C
Select [Download module] from [Tutorial.x30] under [Download modules].
•
The Debugger for 740
If you use the C Compiler Package for 740 Family, select [Download module] from [Tutorial.695]
under [Download modules].
If you use the Assembler Package for 740 Family, select [Download module] from [Tutorial.hex]
under [Download modules].
62
6 Tutorial
6.2.3.2 Displaying the Source Program
This debugger allows the user to debug a user program at the source level.
Double-click [tutorial.c] under [C source file]. A [Editor(Source)] window opens and the contents of a
"Tutorial.c" file are displayed.
Select the [Format Views...] option from the [Setup] menu to set a font and size that are legible, if
necessary.
Initially the [Editor(Source)] window shows the start of the user program, but the user can use the
scroll bar to scroll through the user program and look at the other statements.
63
6.2.4 Step4 : Setting a Breakpoint
A software breakpoint is a basic debugging function.
The [Editor(Source)] window provides a very simple way of setting a software breakpoint at any point
in a program.
6.2.4.1 Setting a Software Breakpoint
For example, to set a software breakpoint at the sort function call:
Double-click the [S/W breakpoints] column on the line containing the sort function call.
The red symbol will appear on the line containing the sort function call. This shows that a
softwarebreak breakpoint has been set.
64
6 Tutorial
6.2.5 Step5 : Executing the Program
Execute the program as described in the following:
6.2.5.1 Resetting of CPU
By default, CPU is not reset after downloading a program.
To reset the CPU, select [Reset CPU] from the [Debug] menu, or click the [Reset CPU] button
on the toolbar.
6.2.5.2 Executing the Program
To execute the program, select [Go] from the [Debug] menu, or click the [Go] button
on the
toolbar.
The program will be executed up to the breakpoint that has been set, and an arrow will be displayed
in the [S/W Breakpoints] column to show the position that the program has halted.
Note
When the source file is displayed after a break, a path of the source file may be inquired. In this case,
please specify the location of a source file.
65
6.2.5.3 Reviewing Cause of the Break
The break factor is displayed in the [Output] window.
The user can also see the cause of the break that occurred last time in the [Status] window.
Select [Status] from the [CPU] submenu of the [View] menu. After the [Status] window is displayed,
open the [Platform] sheet, and check the Status of Cause of last break.
Please refer to "11 Display the Cause of the Program Stoppage " about the notation of a break factor.
66
6 Tutorial
6.2.6 Step6 : Reviewing Breakpoints
The user can see all the breakpoints set in the program in the [S/W Break Points] window.
6.2.6.1 Reviewing Breakpoints
Select [S/W Break Points] from the [Break] submenu of the [View] menu. The [S/W Break Points]
window is displayed.
This window allows the user to set or change breakpoints, define new breakpoints, and delete, enable,
or disable breakpoints.
67
6.2.7 Step7 : Viewing Register
The user can see all registers/flags value in the [Register] window.
6.2.7.1 Viewing Register
Select [Registers] from the [CPU] submenu of the [View] menu. The [Register] window is displayed.
The figure below shows a Register window of the debugger for M16C/R8C.
6.2.7.2 Setting the Register Value
You can change a register/flag value from this window.
Double-click the register line to be changed. The dialog is opened. Enter the value to be changed.
68
6 Tutorial
6.2.8 Step8 : Viewing Memory
When the label name is specified, the user can view the memory contents that the label has been
registered in the [ASM Watch] window.
6.2.8.1 Viewing Memory
For example, to view the memory contents corresponding to __msize in word size:
Select [ASM Watch] from the [Symbol] submenu of the [View] menu, open the [ASM Watch] window.
And click the [ASM Watch] window with the right-hand mouse button and select [Add...] from the
popup menu, enter __msize in the [Address] edit box, and set Word in the [Size] combo box.
Click the [OK] button. The [ASM Watch] window showing the specified area of memory is displayed.
69
6.2.9 Step9 : Watching Variables
As the user steps through a program, it is possible to watch that the values of variables used in the
user program are changed.
If the downloaded program is the program generated by the assembler package for 740 family, you
can not watch variables in C watch window.
6.2.9.1 Watching Variables
For example, set a watch on the long-type array a declared at the beginning of the program, by using
the following procedure:
Click the left of displayed array a in the [Editor(Source)] window to position the cursor, and select
[Add C Watch...] with the right-hand mouse button. The [Watch] tab of [C watch] window in which
the variable is displayed opens.
The user can click mark '+' at the left side of array a in the [C Watch] window to watch all the
elements.
70
6 Tutorial
6.2.9.2 Registering Variable
The user can also add a variable to the [C Watch] window by specifying its name.
Click the [C Watch] window with the right-hand mouse button and select [Add...] from the popup
menu.
The following dialog box will be displayed. Enter variable i.
Click the [OK] button. The [C Watch] window will now also show the int-type variable i.
71
6.2.10 Step10 : Stepping Through a Program
This debugger provides a range of step menu commands that allow efficient program debugging.
1. Step In
Executes each statement, including statements within functions(subroutines).
2.
Step Out
Steps out of a function(subroutine), and stops at the statement following the statement in the
program that called the function(subroutine).
3.
Step Over
Executes a function(subroutine) call in a single step.
4.
Step...
Steps the specified times repeatedly at a specified rate.
6.2.10.1 Executing [Step In] Command
The [Step In] command steps into the called function(subroutine) and stops at the first statement of
the called function(subroutine).
To step through the sort function, select [Step In] from the [Debug] menu, or click the [Step In] button
on the toolbar.
The PC cursor moves to the first statement of the sort function in the [Editor(Source)] window.
72
6 Tutorial
6.2.10.2 Executing [Step Out] Command
The [Step Out] command steps out of the called function(subroutine) and stops at the next statement
of the calling statement in the main function.
To step out of the sort function, select [Step Out] from the [Debug] menu, or click the [Step Out]
button
on the toolbar.
The PC cursor slips out of a sort function, and moves to the position before a change function.
Note
It takes time to execute this function. When the calling source is clarified, use [Go To Cursor].
73
6.2.10.3 Executing [Step Over] Command
The [Step Over] command executes a function(subroutine) call as a single step and stops at the next
statement of the main program.
To step through all statements in the change function at a single step, select [Step Over] from the
on the toolbar.
[Debug] menu, or click the [Step Over] button
The PC cursor moves to the next position of a change function.
74
6 Tutorial
6.2.11 Step11 : Forced Breaking of Program Executions
This debugger can force a break in the execution of a program.
6.2.11.1 Forced Breaking of Program Executions
Cancel all breaks.
To execute the remaining sections of the main function, select [Go] from the [Debug] menu or the [Go]
button
on the toolbar.
The program goes into an endless loop. To force a break in execution, select [Halt Program] from the
[Debug] menu or the [Halt] button
on the toolbar.
75
6.2.12 Step12 : Displaying Local Variables
The user can display local variables in a function using the [C Watch] window.
If the downloaded program is the program generated by the assembler package for 740 family, you
can not watch variables in C watch window.
6.2.12.1 Displaying Local Variables
For example, we will examine the local variables in the tutorial function, which declares four local
variables: a, j, i, and sam.
Select [C Watch] from the [Symbol] submenu of the [View] menu. The [C Watch] window is displayed.
By default, [C watch] window has four tabs as following:
•
[Watch] tab
Only the variable which the user registered is displayed.
•
[Local] tab
All the local variables that can be referred to by the scope in which the the PC exists are
displayed. If a scope is changed by program execution, the contents of the [Local] tab will also
change.
•
[File Local] tab
All the file local variables of the file scope in which the PC exists are displayed. If a file scope is
changed by program execution, the contents of the [File Local] tab will also change.
•
[Global] tab
All the global variables currently used by the downloaded program are displayed.
Please choose the [Local] tab, when you display a local variable.
Click mark '+' at the left side of array a in the [Locals] window to display the elements.
When the user refers to the elements of array a before and after the execution of the sort function, it
is clarified that random data is sorted in descending order.
76
6 Tutorial
6.2.13 Step13 : Stack Trace Function
The debugger uses the information on the stack to display the names of functions in the sequence of
calls that led to the function to which the program counter is currently pointing.
The debugger for 740 doesn't support the stack trace function.
6.2.13.1 Reference the function call status
Double-click the [S/W Breakpoints] column in the sort function and set a software breakpoint.
To executes the user program from the reset vector address, select [Reset Go] from the [Debug] menu,
on the toolbar.
or click the [Reset Go] button
After the break in program execution, select [Stack Trace] from the [Code] submenu of the [View]
menu to open the [Stack Trace] window.
The upper figure shows that the position of the program counter is currently at the selected line of the
sort() function, and that the sort() function is called from the tutorial() function.
77
6.2.14 What Next?
This tutorial has described the usage of this debugger.
Sophisticated debugging can be carried out by using the emulation functions that the emulator offers.
This provides for effective investigation of hardware and software problems by accurately isolating
and identifying the conditions under which such problems arise.
78
Reference
79
(Blank Page)
80
7 Windows/Dialogs
7.
Windows/Dialogs
The window of this debugger is shown below.
When the window name is clicked, the reference is displayed.
Window Name
View Menu
[View]->[CPU]->[RamMonitor]
[View]->[Symbol]->[ASMWatch]
[View]->[Symbol]->[CWatch]
[View]->[Code]->[Coverage]
[View]->[Script]
[View]->[Break]->[S/W Break Points]
[View]->[Break]->[H/W Break Points]
[View]->[Break]->[Protect]
[View]->[Trace]->[Trace Points]
[View]->[Trace]->[Time Measure]
[View]->[Trace]->[Trace]
[View]->[Trace]->[Data Trace]
[View]->[Graphic]->[GUI I/O]
[View]->[RTOS]->[MR]
[View]->[RTOS]->[MR Trace]
[View]->[RTOS]->[MR Analyze]
[View]->[RTOS]->[MR Task Pause]
[View]->[RTOS]->[Task Trace]
[View]->[RTOS]->[Task Analyze]
RAM Monitor Window
ASM Watch Window
C Watch Window
Coverage Window
Script Window
S/W Break Point Setting Window
H/W Break Point Setting Window
Protect Window
Trace Point Setting Window
Time Measurement Window
Trace Window
Data Trace Window
GUI I/O Window
MR Window *
MR Trace Window *
MR Analyze Window *
MR Task Pause Window *
Task Trace Window
Task Analyze Window
*: The 740 debuggers are not supported.
For the reference of the following windows, refer to the help attached to a High-performance
Embedded Workshop main part.
•
•
•
•
•
•
•
•
•
•
•
•
•
Differences Window
Map Window
Command Line Window
Workspace Window
Output Window
Disassembly Window
Memory Window
IO Window
Status Window
Register Window
Image Window
Waveform Window
Stack Trace Window
81
7.1 RAM Monitor Window
The RAM monitor window is a window in which changes of memory contents are displayed while
running the target program.
The relevant memory contents are displayed in dump form in the RAM monitor area by using the
realtime RAM monitor function. The displayed contents are updated at given intervals (by default,
every 100 ms) while running the target program.
•
•
•
•
This system provides a 1Kbytes of RAM monitor area, which can be placed at any continuous
addresses.
The RAM monitor area can be changed to any desired address range.
Refer to "7.1.2 Setting the RAM monitor area" for details on how to change the RAM monitor area.
The default RAM monitor area is mapped into a 1-Kbyte area beginning with the start address of
the internal RAM.
The display content updating interval can be set for each window individually.
The actual updating interval at which the display contents are actually updated while running
the target program is shown in the title field of the Address display area.
The background colors of the data display and code display areas are predetermined by access
attribute, as shown below.
Access attribute
Background color
Read accessed address
Write accessed address
Non-accessed address
Green
Red
White
The background colors can be changed.
82
7 Windows/Dialogs
ATTENTION
•
•
•
•
The RAM monitor window shows the data that have been accessed through the bus. Therefore,
changes are not reflected in the displayed data unless they have been accessed via the target
program as in the case where memory is rewritten directly from an external I/O.
If the data in the RAM monitor area are displayed in lengths other than the byte, it is possible
that the data will have different memory access attributes in byte units. If bytes in one data have
a different access attribute as in this case, those data are enclosed in parentheses when displayed
in the window. In that case, the background color shows the access attribute of the first byte of
the data.
The displayed access attributes are initialized by downloading the target program.
The interval time at which intervals the display is updated may be longer than the specified
interval depending on the operating condition (shown below).
- Host machine performance/load condition
- Communication interface
- Window size (memory display range) or the number of windows displayed
83
7.1.1 Extended Menus
This window has the following popup menus that can be brought up by right-clicking in the window.
Menu
Function
RAM Monitor Area...
Sampling Period...
Clear
Up
Set RAM monitor base address.
Set RAM monitor sampling period.
Clear access attribute.
Moves display position to the immediately preceding RAM
monitor area (smaller address)
Moves display position to the immediately following RAM
monitor area (larger address)
Display from specified address.
Specify scroll range.
Display in 1Byte unit.
Display in 2Byte unit.
Display in 4Byte unit.
Display in 8Byte unit.
Display in Hexadecimal.
Display in Decimal.
Display in Signed Decimal.
Display in Octdecimal.
Display in Binary.
Display as ASCII character.
Display as SJIS character.
Display as JIS character.
Display as UNICODE character.
Display as EUC character.
Display as Floating-point.
Display as Double Floating-point.
Switch display or non-display of Label area.
Switch display or non-display of Register area.
Switch display or non-display of Code area.
Set the number of columns displayed on one line.
Split window.
Display toolbar.
Open toolbar customize dialog box.
Allow window docking.
Hide window.
Down
Address...
Scroll Area...
Data Length
Radix
Code
Layout
Column...
Split
Toolbar display
Customize toolbar...
Allow Docking
Hide
1byte
2bytes
4bytes
8bytes
Hex
Dec
Single Dec
Oct
Bin
ASCII
SJIS
JIS
UNICODE
EUC
Float
Double
Label
Register
Code
84
7 Windows/Dialogs
7.1.2 Setting the RAM monitor area
Choose the popup menu [RAM Monitor Area...] in the RAM monitor window.
The Set RRAM Area dialog box shown below will appear.
The start address of the currently set RAM monitor area and the range of the RAM monitor area are
displayed in the Start and the Area fields of this dialog box. (No values can be entered in the Size
field.)
Use this dialog box to change the position of the RAM monitor area.
•
Specify the RAM monitor area by its start address. The size cannot be changed (fixed to 1 Kbyte).
•
The start address can be specified in 0x10 byte units.
If you specify a non-aligned address value, it is rounded off to the nearest address value in 0x10
byte units before being set.
7.1.2.1 Changing the RAM Monitor Area
The start address of the RAM monitor area can be changed.
Specify the start address of the RAM monitor area in the Start field of the Set RRAM Area dialog box.
(No values can be entered in the Size field.)
85
7.2 ASM Watch Window
The ASM watch window is a window in which you can register specific addresses as watchpoints and
inspect memory contents at those addresses.
If a registered address resides within the RAM monitor area, the memory content at that address is
updated at given intervals (by default, every 100 ms) during program execution.
•
•
•
•
•
•
The addresses to be registered are called the "watchpoints." One of the following can be
registered:
- Address (can be specified using a symbol)
- Address + Bit number
- Bit symbol
The registered watchpoints are saved in the debugger when the ASM watch window is closed and
are automatically registered when the window is reopened.
If symbols or bit symbols are specified for the watchpoints, the watchpoint addresses are
recalculated when downloading the target program.
The invalid watchpoints are marked by "-<not active>-" when displayed on the screen.
The order in which the watchpoints are listed can be changed by a drag-and-drop operation.
The watchpoint expressions, sizes, radixes and datas can be changed by in-place editing.
ATTENTION
•
•
The RAM monitor obtains the data accessed through the bus. Any change other than the access
from the target program will not be reflected.
If the display data length of the RAM monitor area is not 1 byte, the data's access attribute to the
memory may varies in units of 1 byte. In such a case that the access attribute is not unified
within a set of data, the data's access attribute cannot be displayed correctly. In this case, the
background colors the access attribute color of the first byte of the data.
86
7 Windows/Dialogs
7.2.1 Extended Menus
This window has the following popup menus that can be brought up by right-clicking in the window.
Menu
Add...
Add Bit...
Remove
Remove All
Set...
Radix
Refresh
Layout
RAM Monitor
Function
Add watchpoint.
Add bit-lebel watchpoint.
Remove the selected watchpoint.
Remove all watchpoints.
Set new data to selected watchpoint.
Display in Binary.
Display in Decimal.
Display in Hexadecimal.
Refresh memory data.
Switch display or non-display of Address area.
Switch display or non-display of Size area.
Switch enable or disable RAM moniter function.
Set RAM monitor sampling period.
Display toolbar.
Open toolbar customize dialog box.
Allow window docking.
Hide window.
Bin
Dec
Hex
Address Area
Size Area
Enable RAM Monitor
Sampling Period...
Toolbar display
Customize toolbar...
Allow Docking
Hide
87
7.3 C Watch Window
The C Watch Window displays C/C++ expressions and their values (results of calculations).
The C/C++ expressions displayed in the C Watch Window are known as C watchpoints. The displays
of the results of calculating the C watchpoints are updated each time a command is executed.
When RAM monitor function is effective and the C watch points are within the RAM monitor area,
the displayed values are updated during execution of the target program.
•
•
•
•
•
•
•
•
•
Variables can be inspected by scope (local, file local or global).
The display is automatically updated at the same time the PC value changes.
Variable values can be changed.
The display radix can be changed for each variable individually.
Any variable can be registered to the Watch tab, so that it will be displayed at all times:
- The registered content is saved for each project separately.
- If two or more of the C watch window are opened at the same time, the registered
The C watchpoints can be registered to separate destinations by adding Watch tabs.
Variables can be registered from another window or editor by a drag-and-drop operation.
The C watchpoints can be sorted by name or by address.
Values can be inspected in real time during program execution by using the RAM monitor
function.
ATTENTION
•
•
•
•
•
•
You cannot change the values of the C watch points listed below:
- Bit field variables
- Register variables
- C watch point which does not indicate an address(invalid C watch point)
If a C/C++ language expression cannot be calculated correctly (for example, when a C/C++ symbol
has not been defined), it is registered as invalid C watch point.
It is displayed as "--<not active>--". If that C/C++ language expression can be calculated correctly
at the second time, it becomes an effective C watch point.
The display settings of the Local, File Local and Global tabs are not saved. The contents of the
Watch tab and those of newly added tabs are saved.
The RAM monitor obtains the data accessed through the bus. Any change other than the access
from the target program will not be reflected.
The variables, which are changed in real-time, are global variables and file local variables only.
If the display data length of the RAM monitor area is not 1 byte, the data's access attribute to the
memory may varies in units of 1 byte. In such a case that the access attribute is not unified
within a set of data, the data's access attribute cannot be displayed correctly. In this case, the
background colors the access attribute color of the first byte of the data.
88
7 Windows/Dialogs
7.3.1 Extended Menus
This window has the following popup menus that can be brought up by right-clicking in the window.
Menu
Add...
Remove
Remove All
Initialize
Set New Value...
Radix
Refresh
Hide type name
Show char* as string
Sort
RAM Monitor
Function
Add C watchpoint.
Remove the selected C watchpoint.
Remove all C watchpoints.
Reevaluates the selected C watchpoint.
Set new data to selected C watchpoint.
Display in Hexadecimal.
Display in Binary.
Display in Default Radix.
Change radix (toggle).
Refresh memory data.
Hide type names from variables.
Selects whether to display char* type as a string.
Sort variables by its name.
Sort variables by its address.
Switch enable or disable RAM moniter function.
Set RAM monitor sampling period.
Add new tab.
Remove the selected tab.
Display toolbar.
Open toolbar customize dialog box.
Allow window docking.
Hide window.
Hex
Bin
Default
Toggle(All Variables)
Sort by Name
Sort by Address
Enable RAM Monitor
Sampling Period...
Add New Tab...
Remove Tab
Toolbar display
Customize toolbar...
Allow Docking
Hide
89
7.4 Coverage Window
The Coverage window allows you to reference the coverage measurement result of the functions of the
target program downloaded. The coverage which can be measured is C0 coverage.
Two types of windows are provided: the Coverage window in which you can check the start
address/end address of the functions and coverage measurement results; and the Editor window in
which you can check execution/non-execution by source line.
•
•
•
•
The coverage measurement area is an any 256 KB area starting from the 64 KB boundary. (The
top address of the coverage measurement area is called coverage base address. By default, the
coverage base address is set to 0h.)
By double-clicking any function line, the corresponding function appears in the Editor(Source)
window.
During coverage measurement, "-%" appears in the coverage display area.
You can change the display ratio between the function name display area and the function range
display area, using the mouse.
90
7 Windows/Dialogs
7.4.1 Extended Menus
This window has the following popup menus that can be brought up by right-clicking in the window.
Menu
Select source file...
Auto Refresh
Refresh
Clear
Base...
File
Layout
Toolbar display
Customize toolbar...
Allow Docking
Hide
Save...
Load...
Address
Function
Select a source file for checking the coverage.
Refresh coverage measurement result automatically.
Refresh coverage measurement result.
Clear coverage measurement result .
Change coverage base address.
Save coverage measurement result to file.
Load coverage measurement result from file.
Switch display or non-display of Address area.
Display toolbar.
Open toolbar customize dialog box.
Allow window docking.
Hide window.
*:The debugger for 740 doesn't support, because the entire memory area is coverage area.
91
7.4.2 Refer to the Source Line/the Executed Address
It is possible to refer in the Editor(Source) Window or Memory Window.
7.4.2.1 Refer in the Editor(Source) Window
In the Editor(Source) window, a display of Coverage Measurement is set to "Disable" by default.
To enable the display, check the [Coverage] check box in the dialog box opened by choosing the main
menu - [Edit] -> [Define Column Format]. The column for a coverage measurement display is
displayed on all Editor (Source) windows.
And select popup menu - [Columns] -> [Coverage] in the Editor (Source) window, A column can be set
up for each Editor (Source) windows.
7.4.2.2 Refer in the Memory Window
In the Memory window, a display of Coverage Measurement is set to "Disable" by default.
To enable the display, select popup menu - [Coverage] -> [On/Off] in the Memory window.
92
7 Windows/Dialogs
7.5 Script Window
The Script Window displays the execution of text -format script commands and the results of that
execution.
Script commands can be executed using a script file or interactively. You can also write script
commands in the script file so that they are automatically executed. The results of script command
execution can also be stored in a previously specified log file.
•
•
•
•
The Script Window has a view buffer that stores the results of executing the last 1000 lines. The
results of execution can therefore be stored in a file (view file) without specifying a log file.
When a script file is opened, the command history area changes to become the script file display
area and displays the contents of the script file. When script files are nested, the contents of the
last opened script file are displayed. The script file display area shows the line currently being
executed in inverse vide.
When a script file is open, you can invoke script commands from the command input area
provided the script file is not being executed.
The Script Window can record the history of the executed commands to a file. This function is not
the same as the log function. This function records not the result but only the executed
commands, so the saved files can be used as the script files.
93
7.5.1 Extended Menus
This window has the following popup menus that can be brought up by right-clicking in the window.
Menu
Script
View
Log
Record
Copy
Paste
Cut
Delete
Undo
Toolbar display
Customize toolbar...
Allow Docking
Hide
Function
Open...
Run
Step
Close
Save...
Clear
On...
Off
On...
Off
Open script file.
Run script file.
One step execution of script file.
Close script file.
Save view buffer to file.
Clear view buffer.
Open log file and start recording (start output to file).
Close log file and end recording (stop output to file).
Record the executed commands to a file.
Stop recording the executed commands.
Copy the selection and put it on the Clipboard.
Insert Clipboard contents.
Cut the selection and put it on the Clipboard.
Erase the selection.
Undo the last action.
Display toolbar.
Open toolbar customize dialog box.
Allow window docking.
Hide window.
94
7 Windows/Dialogs
7.6 S/W Break Point Setting Window
The S/W Break Point Setting window allows you to set software break points.
Software breaks stop the execution of instructions immediately before the specified break point.
•
•
•
•
If you have set multiple software breakpoints, program execution stops when any one software
break address is encountered (OR conditions).
You can continue to set software breakpoints until you click the "Close" button to close the S/W
Break Point Setting Window.
You can clear, enable or disable software breakpoints selected by clicking in the software
breakpoint display area. You can also enable and disable software breakpoints by double-clicking
on them.
Click on the "Save" button to save the software break points in the file. To reload software break
point settings from the saved file, click the "Load" button. If you load software break points from
a file, they are added to any existing break points.
95
7.6.1 Command Button
The buttons on this window has the following meanings.
Button
Function
Load...
Save...
Help
Add
Refer...
Close
Delete
Delete All
Enable
All Enable
Disable
All Disable
View
Load setting information from a file in which it was saved.
Save the contents set in the window to a file.
Display the help of this window.
Add the break point.
Open file selection dialog box.
Close the window.
Remove the selected break point.
Remove all break points.
Enable the selected break points.
Enable all break points.
Disable the selected break point.
Disable all break points.
Shows the selected breakpoint positions in the Editor(Source) window.
96
7 Windows/Dialogs
7.6.2 Setting and Deleting a Break Points from Editor(Source) Window
The area which can be set in the software breakpoint is different according to the product. Please
refer to "12.1.2Area where software breakpoint can be set" for details.
You can set break points in the Editor(Source) Window. To do so, double-click the break point setting
area ("S/W breakpoints" column) for the line in which you want to set the break. (A red marker is
displayed on the line to which the break point was set.)
You can delete the break point by double-clicking again in the break point setting area ("S/W
breakpoints" column).
In the Editor(Source) window, a display of "S/W breakpoints" column is set to "Enable" by default. To
erase this column, deselect the [S/W breakpoints] check box in the dialog box opened by choosing the
main menu - [Edit] -> [Define Column Format]. The "S/W breakpoints" column is erased from all
Editor (Source) windows. And select popup menu - [Columns] -> [S/W breakpoints] in the Editor
(Source) window, A column can be set up for each Editor (Source) windows.
97
7.7 H/W Break Point Setting Window
The H/W Breakpoint Setting window is used to set hardware breakpoints for the Emulators.
•
•
•
•
The events listed below can be specified as break events. If the contents of events are altered,
they are marked by an asterisk (*) on the title bar. The asterisks (*) are not displayed after
setting up the emulator.
- The debugger for M32C
Memory Access, Bit Access, External Trigger
(* Can be substituted by memory access. (Access type = Read))
- The debugger for M16C/R8C
Fetch, Memory Access, Bit Access, Interrupt, External Trigger
- The debugger for 740
Fetch, Memory Access, Bit Access, Interrupt, External Trigger
Events at up to six points can be used.
These events can be combined in one of the following ways:
- Break when all of the valid events are established (AND condition)
- Break when all of the valid events are established at the same time (simultaneous AND
condition)
- Break when one of the valid events is established (OR condition)
- Break upon entering a break state during state transition (State Transition condition)
At the time the debugger starts up, the hardware breaks have no effect.
98
7 Windows/Dialogs
7.7.1.1 Specify the Break Event
To set events, double-click to select the event you want to set from the event setting area of the H/W
Break Point Setting Window. This opens the dialog box shown below.
Following events can be set by specifying Event Type in this dialog box.
99
•
When FETCH is selected
Breaks for the instruction fetch.
(The debugger for M32C not support. When using these products, use memory access instead.)
•
When DATA ACCESS is selected
Breaks for the memory access.
100
7 Windows/Dialogs
•
When BIT SYMBOL is selected
Breaks for the bit access.
•
When INTERRUPT is selected
Breaks for the interrupt occurrence or termination.
(The debugger for M32C not support.)
101
•
When TRIGGER is selected
Breaks for the status of signal input from external trace cable.
102
7 Windows/Dialogs
7.7.2 Specify the Combinatorial Condition
To specify a combinatorial condition, specify the desired condition from the combinatorial condition
specification area.
•
When AND or OR is selected
In the event specification area, the event used and a pass count for that event can be specified. To
alter the pass count, while the event to alter is being selected, click the pass count value of that event.
•
When AND (Same Time) is selected
In the event specification area, the event used can be specified. No pass counts can be specified.
•
When State Transition is selected
Click the Details... button, and the dialog box shown below appears. Specification by a state
transition diagram or sequential specification can be used. If the content of any event is altered,
it is marked with an asterisk (*) on the title bar. Once conditions are set in the emulator,
asterisks are not displayed. A time-out time in each state can also be specified.
103
7.7.3 Specify the Process ID
By specifying a process ID, it is possible to detect only event establishment under specific conditions.
Example: Enable only the event that occurs in a specific task when using the realtime OS.
7.7.4 Command Button
The buttons on this window has the following meanings.
Button
Reset
Save...
Load...
Set
Close
Function
Discards the contents being displayed in the window and loads contents from the
emulator in which they were set.
Saves the contents set in the window to a file.
Loads event information from a file in which it was saved.
Sends the contents set in the window to the emulator.
Closes the window.
104
7 Windows/Dialogs
7.7.5 Specify the Events (Instruction Fetch)
To specify an instruction fetch event, change the event select dialog box's Event Type to "FETCH".
The event is established when instruction is fetched from the specified address or any address in the
specified address range.
7.7.5.1 Instruction Fetch of Specified Address
Set as below.
Example) Instruction fetch at address 80000h
105
7.7.5.2 Instruction Fetch of Specified Address Area(In)
Set as below.
Example) Instruction fetch at address 80000h to 80FFFh
106
7 Windows/Dialogs
7.7.5.3 Instruction Fetch of Specified Address Area(Out)
Set as below.
Example) Instruction fetch at any address other than the range 80000h to 80FFFh
107
7.7.5.4 Entering/exiting to specified function
Set as below.
Example) Entering a break to function name "wait"
Example) Exiting from function name "wait"
108
7 Windows/Dialogs
7.7.6 Specify the Events (Memory Access)
To specify a memory access event, change the event select dialog box's Event Type to "DATA
ACCESS". The event is established when memory is accessed at the specified address or under
conditions set for the specified address range.
7.7.6.1 Memory Access(The debugger for M32C)
ATTENTION
It is not detected that data access to the odd addresses in word-size access.
109
7.7.6.1.1.
Writing/Reading a Specified Address
Set as below.
Example) Writing to even address 400h
110
7 Windows/Dialogs
Example) Writing byte length data 32h to even address 400h
111
Example) Writing byte length data 32h to odd address 401h
Contents of settings vary with each product and bus width.
(8 bits bus width)
112
7 Windows/Dialogs
(16 bits bus width)
113
Example) Writing word length data 1234h to even address 400h
Contents of settings vary with each product and bus width.
(8 bits bus width)
Please specify "And" of the 1st point and the 2nd point for a combination condition.
1st point
114
7 Windows/Dialogs
2nd point
115
(16 bits bus width)
116
7 Windows/Dialogs
Example) Writing data 10h - 3Fh to even address 400h
117
7.7.6.1.2.
Reading/writing data to the specified address range
Set as below.
Example) Writing data to addresses ranging from 400h to 40Fh
118
7 Windows/Dialogs
7.7.6.1.3.
Reading/writing data to addresses outside the specified range
Set as below.
Example) Writing data to addresses below 7FFh
119
7.7.6.2 Memory Access(The debugger for M16C/R8C)
7.7.6.2.1.
Writing/Reading a Specified Address
Set as below.
Example) Writing to even address 400h
120
7 Windows/Dialogs
Example) Writing byte length data 32h to even address 400h
121
Example) Writing byte length data 32h to odd address 401h
Contents of settings vary with each product and bus width.
(8 bits bus width)
122
7 Windows/Dialogs
(16 bits bus width)
123
Example) Writing word length data 1234h to even address 400h
124
7 Windows/Dialogs
Example) Writing data 10h - 3Fh to even address 400h
125
7.7.6.2.2.
Reading/writing data to the specified address range
Set as below.
Example) Writing data to addresses ranging from 400h to 40Fh
126
7 Windows/Dialogs
7.7.6.2.3.
Reading/writing data to addresses outside the specified range
Set as below.
Example) Writing data to addresses below 7FFh
127
7.7.6.3 Memory Access(The debugger for 740)
The debugger For 740, a write of word length data to the even address cannot be detected, either.
7.7.6.3.1.
Writing/Reading a Specified Address
Set as below.
Example) Writing to even address 400h
128
7 Windows/Dialogs
Example) Writing byte length data 32h to even address 400h
129
Example) Writing data 10h - 3Fh to even address 400h
130
7 Windows/Dialogs
7.7.6.3.2.
Reading/writing data to the specified address range
Set as below.
Example) Writing data to addresses ranging from 400h to 40Fh
131
7.7.6.3.3.
Reading/writing data to addresses outside the specified range
Set as below.
Example) Writing data to addresses below 7FFh
132
7 Windows/Dialogs
7.7.7 Specify the Events (Bit Access)
To specify a bit access event, change the event select dialog box's Event Type to "BIT SYMBOL". The
event is established when the specified bit at the specified address or specified bit symbol is accessed
under specified conditions.
7.7.7.1 Writing/Reading a Specified Bit
Set as below.
Example) Writing "0" to bit 2 at address 400h
133
7.7.7.1.1.
Writing/Reading a Specified Bit Symbol
Set as below.
Example) Writing "1" to bit symbol "bitsym"
134
7 Windows/Dialogs
7.7.8 Specify the Events (Interrupt)
To specify an interrupt event, change Event Type in the event select dialog box to "INTERRUPT".
When an interrupt is generated or finished, the event is established.
7.7.8.1 Interrupt Occurrence
Set as below.
135
7.7.8.2 Interrupt Termination
Set as below.
136
7 Windows/Dialogs
7.7.9 Specify the Events (External Trigger Signal)
To specify an event for external trigger signal, change Event Type in the event select dialog box to
"TRIGGER". When the signal from the external trace signal input cable is in a specified state, the
event is established. Rising/falling edges are detected from the signal on the external trace signal
input cable included with the emulator (A combination of eight signals is possible.).
The following shows the names of signals from the external trace signal input cable and their cable
colors.
Signal Name
Cable Color
White
Brown
Red
Orange
Yellow
Green
Blue
Purple
Black
EXT0
EXT1
EXT2
EXT3
EXT4
EXT5
EXT6
EXT7
GND
7.7.9.1 Detection of Rising/Falling Edge
Set as below. By clicking each trigger button, its trigger setting changes in the order of "H" -> "L" -> "
".
Example) Rise of EXT0 (white) signal
137
Example) Fall of EXT1(brown) signal
7.7.9.2 Combination of rise/fall edges
Set as below.
Example) Rise of EXT0 (white)/EXT7 (purple) signal, fall of EXT1 (brown) signal
138
7 Windows/Dialogs
7.7.10 Specify the Event Combination Condition
Use the Combination group of the event setting windows to specify the combinatorial conditions of
events.
The combination of two or more events can be used.
One of the following combinatorial conditions can be selected.
AND
AND(Same Time)
OR
STATE TRANSITION
All of the specified events are established
The specified events are established at the same time
One of the specified events is established
Established upon entering a break state in the state transition diagram
Pass counts (number of times passed) can be specified for each event (1-255). If the specified
combinatorial condition is AND (Same Time), no pass counts can be set (fixed to 1).
7.7.10.1 Select AND, OR
Change the Combination group to "AND" to specify AND for the combinatorial condition, or "OR" to
specify OR for the combinatorial condition. Next, check (turn on) an event in the event specification
area that you want to use, and specify a pass count for that event. To alter the pass count, while the
event to alter is being selected, click the pass count value of that event.
139
7.7.10.2 Select AND(Same Time)
Change the Combination group to "AND (Same Time)". Next, check (turn on) an event in the event
specification area that you want to use. No pass counts can be specified (fixed to 1).
7.7.10.3 Select State Transition
Change the Combination group to "State Transition". The Detail... button included in the
Combination group becomes useful, so click that button. This opens the State Setting window. In this
window, State Transition can be specified using a state transition diagram or sequentially. A state
time-out time can also be specified.
Specification by a state transition diagram Use the state transition diagram of the State Transition
group. Click any button here to select the event you want to use. For the button above the arrow,
specify the event necessary to go to the state indicated by the arrow. For the button above the state
(elliptical display part), specify the event necessary to reset the pass count of each state and reset the
time count of that state. Pass counts can be specified from the popup menu that appears when
selecting an event.
Example: After conditions are met in order of events A1 and A2, event A3 is not established and event
A4 is established
140
7 Windows/Dialogs
Sequential specification
Use the buttons included in the Sequential group. Pass counts can be specified from the popup menu
that appears when selecting an event. The contents set here are reflected in the state transition
diagram.
Example: Events A1, A2, and A3 that occur successively in that order are established
141
7.7.11 Specify the Process ID
By specifying a task name (task number), it is possible to enable only the events that occurred in the
specified task.
7.7.11.1 Specify the Task
Only the events from a specified task can be detected. Events from other than a specified task can
also be detected.
Check the Enable check box included in the PID group of the event setting window. When this check
box is checked, the Detail... button to the right of it is enabled.
Click the Detail... button included in the PID group. This opens the Process ID Setting dialog box.
In the PID Setting area, specify the memory address in which to store the execution task, the data
size, and the task number (or task name). Mask can also be specified for the task number. In the
Condition group, click the radio button "==".
To enable events in other than a specified task, click the radio button "!=".
ATTENTION
In PID settings, always be sure to specify an even address for the Address area.
In the PID Event area, check the check box for the event you want to enable. Only the checked events
become the target to be debugged.
142
7 Windows/Dialogs
7.8 Protect Window
The Protect window sets the protect break (memory protect) function of the emulator.
•
•
•
•
The protect break function is disabled at start of the debugger.
Three types of protect break attributes are provided as below:
- Access Disable (read/write disabled, display in red)
- Read Only (write disabled, display in yellow)
- R/W Enable (read/write enabled, display in sky blue)
The protect break area is a 256 KB continuous area starting from the 64 KB boundary.
You can use the following two methods to set protect break.
- Specify from the target program session information.
- Specify the memory attribute of the desired address range.
7.8.1 Extended Menus
This window has the following popup menus that can be brought up by right-clicking in the window.
Menu
Section
Base Address...*
Attribute...
Mode
Toolbar display
Customize toolbar...
Allow Docking
Hide
Function
Set protect break attribute by the section information.
Change protect base address.
Set protect break attribute.
Switch enable or disable protect break function.
Display toolbar.
Open toolbar customize dialog box.
Allow window docking.
Hide window.
*:The debugger for 740 doesn't support, because the entire memory area is protection area.
143
7.9 Trace Point Setting Window
The Trace Point Setting window is used to set trace points.
•
•
•
The events listed below can be specified as trace events. If the contents of events are altered, they
are marked by an asterisk (*) on the title bar. The asterisks (*) are not displayed after setting up
the emulator.
- The debugger for M32C
Memory Access, Bit Access, Trigger
(* Can be substituted by memory access. (Access type = Read))
- The debugger for M16C/R8C
Fetch, Memory Access, Bit Access, Interrupt, Trigger
- The debugger for 740
Fetch, Memory Access, Bit Access, Interrupt, Trigger
Events at up to six points can be used.
These events can be combined in one of the following ways:
- Trace when all of the valid events are established (AND condition)
- Trace when all of the valid events are established at the same time (simultaneous AND
condition)
- Trace when one of the valid events is established (OR condition)
- Trace upon entering a break state during state transition (State Transition condition)
144
7 Windows/Dialogs
7.9.1 Specify the Trace Event
To set events, double-click to select the event you want to set from the event setting area of the Trace
Point Setting Window. This opens the dialog box shown below.
Following events can be set by specifying Event Type in this dialog box.
•
When FETCH is selected
Traces for the instruction fetch.
(The debugger for M32C not support. When using these products, use memory access instead.)
145
•
When DATA ACCESS is selected
Traces for the memory access.
•
When BIT SYMBOL is selected
Traces for the bit access.
146
7 Windows/Dialogs
•
When INTERRUPT is selected
Traces for the interrupt occurrence or termination.
(The debugger for M32C not support.)
•
When TRIGGER is selected
Traces for the status of signal input from external trace cable.
147
7.9.2 Specify the Combinatorial Condition
To specify a combinatorial condition, specify the desired condition from the combinatorial condition
specification area.
•
When AND or OR is selected
In the event specification area, the event used and a pass count for that event can be specified. To
lter the pass count, while the event to alter is being selected, click the pass count value of that
event.
•
When AND (Same Time) is selected
In the event specification area, the event used can be specified. No pass counts can be specified.
148
7 Windows/Dialogs
•
When State Transition is selected
Click the Details... button, and the dialog box shown below appears. Specification by a state
transition diagram or Sequential specification can be used. If the content of any event is altered,
it is marked with an asterisk (*) on the title bar. Once conditions are set in the emulator,
asterisks are not displayed. A time-out time in each state can also be specified.
7.9.3 Specify the Process ID
By specifying a process ID, it is possible to detect only event establishment under specific conditions.
Example: Enable only the event that occurs in a specific task when using the realtime OS.
7.9.4 Specify the Trace Range
For the PC4701 emulator debugger, 32K cycles equivalent of data can be recorded.
Break
Before
About
After
Full
Stores the 32K cycles (-32K to 0 cycles) to the point at which the target program stops.
Stores the 32K cycles (-32K to 1 cycles) to the point at which the trace point is passed.
Stores the 32K cycles (-16K to 16K cycles) either side of the trace point.
Stores the 32K cycles (0 to 32K cycles) of trace data after the trace point.
Stores the 32K cycles (-32K to 0 cycles) of trace data after the trace starts.
149
7.9.5 Specify the Trace Write Condition
Conditions for cycles to be written to trace memory can be specified.
Total
Pick up
Exclude
Writes all cycles.
Writes only the cycles where specified condition holds true.
Writes only the cycles where specified condition does not hold true.
Also, following three write modes are supported.
Only cycles where specified event is established
Cycles from where specified event is established
to where specified event is not established
Cycles from where start event is established to
where end event is established
7.9.6 Command Button
The buttons on this window has the following meanings.
Button
Reset
Save...
Load...
Set
Close
Function
Discards the contents being displayed in the
window and loads contents from the simulator in
which they were set.
Saves the contents set in the window to a file.
Loads event information from a file in which it
was saved.
Sends the contents set in the window to the
simulator.
Closes the window.
150
7 Windows/Dialogs
7.9.7 Specify the Events (Instruction Fetch)
How to set events for fetch is same as the way for H/W Break Point Setting Window.
For detail about the setting, refer to "7.7.5 Specify the Events (Instruction Fetch) "
7.9.8 Specify the Events (Memory Access)
How to set events for memory access is same as the way for H/W Break Point Setting Window.
For detail about the setting, refer to "7.7.6 Specify the Events (Memory Access) "
7.9.9 Specify the Events (Bit Access)
How to set events for bit access is same as the way for H/W Break Point Setting Window.
For detail about the setting, refer to "7.7.7 Specify the Events (Bit Access) "
7.9.10 Specify the Events (Interrupt)
How to set events for bit access is same as the way for H/W Break Point Setting Window.
For detail about the setting, refer to "7.7.8 Specify the Events (Interrupt) "
7.9.11 Specify the Events (External Trigger Signal)
How to set events for bit access is same as the way for H/W Break Point Setting Window.
For detail about the setting, refer to "7.7.9 Specify the Events (External Trigger Signal) "
7.9.12 Specify the Event Combination Condition
How to set combination of events is same as the way for H/W Break Point Setting Window.
For detail about the setting, refer to "7.7.10 Specify the Event Combination Condition”
7.9.13 Specify the Process ID
How to set combination of events is same as the way for H/W Break Point Setting Window.
For detail about the setting, refer to "7.7.11 Specify the Process ID”
151
7.9.14 Specify the write condition
Trace data write conditions can be specified.
You can specify the following write conditions:
1. Write conditions unlimited (default)
2. Cycles from the start event established to the end event established
3.
Only cycles where the start event is established
4. Cycles from the start event established to the start event unestablished
5.
Other than cycles from the start event established to the end event established
6.
Other than cycles where the start event is established
7.
Other than cycles from the start event established to the start event unestablished
To specify condition 1, choose "Total" from the list box of the window's "Write Condition" item.
To specify conditions 2 to 4, choose "Pick Up" and click the "Detail..." button to open the
"Realtime-trace Write Condition" dialog box.
•
For condition 2, choose the Mode shown below and set the Start and End events.
152
7 Windows/Dialogs
•
For condition 3, choose the Mode shown below and set the Start event.
•
For condition 4, choose the Mode shown below and set the Start event.
153
Similarly, when specifying conditions 5 to 7, choose "Exclude" and click the "Detail..." button to open
the Realtime-trace Write Condition dialog box.
•
For condition 5, choose the Mode shown below and set the Start and End events.
•
For condition 6, choose the Mode shown below and set the Start event.
154
7 Windows/Dialogs
•
For condition 7, choose the Mode shown below and set the Start event.
155
7.10 Time Measurement Window
The Time Measurement window displays the minimum/maximum/average execution time and
measurement count at any measurement point. The execution time of up to 4 measurement points
can be measured simultaneously.
You can specify the event for the measurement condition in the same manner as when specifying
events in the Trace Point Setting Window.
•
If the contents of events are altered, they are marked by an asterisk (*) on the title bar. The
asterisks (*) are not displayed after setting up the emulator.
ATTENTION
•
•
The Trace Point Setting Window and the Time Measure Windows use the same resource of the
emulator. If the event settings are modified in Time Measure Window, settings of the Trace Point
Setting Window are modified, too.
As the count resource for time measurement, specify the MCU cycle (operation clock of the target
mcu) instead of the emulator clock (16MHz), in the init dialog. If you specify the emulator clock,
the measurement result will be incorrect.
156
7 Windows/Dialogs
7.10.1 Specify the Time Measurement Event
The events listed below can be specified as measurement events.
•
The debugger for M32C
Memory Access, Bit Access, External Trigger (* Can be substituted by memory access. (Access
type = Read))
•
The debugger for M16C/R8C
Fetch, Memory Access, Bit Access, Interrupt, External Trigger
•
The debugger for 740
Fetch, Memory Access, Bit Access, Interrupt, External Trigger
To set events, double-click to select the event you want to set from the event setting area of the Time
Measurement Window. This opens the dialog box shown below.
Following events can be set by specifying Event Type in this dialog box.
157
•
When FETCH is selected
Measures for the instruction fetch.
(The debugger for M32C not support. When using these products, use memory access instead.)
•
When DATA ACCESS is selected
Measures for the memory access.
158
7 Windows/Dialogs
•
When BIT SYMBOL is selected
Measures for the bit access.
•
When INTERRUPT is selected
Measures for the interrupt occurrence or termination.
(The debugger for M32C not support.)
159
•
When TRIGGER is selected
Measures for the status of signal input from external trace cable.
160
7 Windows/Dialogs
7.10.2 Time Measurement Condition
For the time measurement conditions, the following can be specified for each measurement interval.
Measures the time in an interval from where the start event is
established till where the end event is established.
Measures the time from where an event is established till where
the next event is established.
Measures the time from where an event is established till where
the event is not established.
Measures the execution time of functions. The start address and
the end address of the function are automatically registered for
the start event and the end event, respectively.
The measurement result includes the execution time of other
functions that have been called from within the specified
function.
Measures the execution time of functions. The start address and
the end address of the function are automatically registered for
the start event and the end event, respectively. The
measurement result does not include the execution time of other
functions that have been called from within the specified
function.
7.10.3 Command Button
The buttons on this window has the following meanings.
Button
Reset
Save...
Load...
Set
Close
Function
Discards the contents being displayed in the window and loads contents from the
emulator in which they were set.
Saves the contents set in the window to a file.
Loads event information from a file in which it was saved.
Sends the contents set in the window to the emulator.
Closes the window.
161
7.10.4 Specify the Events (Instruction Fetch)
How to set events for fetch is same as the way for H/W Break Point Setting Window.
For detail about the setting, refer to "7.7.5 Specify the Events (Instruction Fetch) "
7.10.5 Specify the Events (Memory Access)
How to set events for memory access is same as the way for H/W Break Point Setting Window.
For detail about the setting, refer to "7.7.6 Specify the Events (Memory Access) "
7.10.6 Specify the Events (Bit Access)
How to set events for bit access is same as the way for H/W Break Point Setting Window.
For detail about the setting, refer to "7.7.7 Specify the Events (Bit Access) "
7.10.7 Specify the Events (Interrupt)
How to set events for bit access is same as the way for H/W Break Point Setting Window.
For detail about the setting, refer to "7.7.8 Specify the Events (Interrupt) "
7.10.8 Specify the Events (External Trigger Signal)
How to set events for bit access is same as the way for H/W Break Point Setting Window.
For detail about the setting, refer to "7.7.9 Specify the Events (External Trigger Signal) "
162
7 Windows/Dialogs
7.10.9 Set the Measurement Condition
For the debugger, the following measurement conditions can be specified.
•
Measure the execution time between the events.
•
Measure a period at which intervals events occur.
•
Measure the time at which events are established.
By specifying a function name, it is possible to measure the execution time of that function. Up to four
measurement intervals can be specified. To specify measurement intervals, click any line (MP1-MP4)
in the Measurement Point group of the Interval Time Measure Window. This opens a dialog box for
specifying measurement conditions.
7.10.9.1 Measure the execution time between the events
1.
2.
Set the measurement events (measurement start event and measurement end event).
Specify the following in the Measurement Condition Designation dialog.
163
7.10.9.2 Measure the event occurrence cycle
1.
2.
Set the measurement event (measurement start event only).
Specify the following in the Measurement Condition Designation dialog.
7.10.9.3 Measure the event establishment time
1.
2.
Set the measurement event (measurement start event only).
Specify the following in the Measurement Condition Designation dialog.
164
7 Windows/Dialogs
7.10.9.4 Measure the execution time of the specified function (1)
Measure the execution time of the specified function.
In this mode, the function top address is automatically registered to the measurement start event,
and the function end address to the measurement end address.
The measurement result contains the execution time of other function called within the specified
function.
Specify the following in the Measurement Condition Designation dialog.
165
7.10.9.5 Measure the execution time of the specified function (2)
Measure the execution time of the specified function.
In this mode, the function address range is automatically registered to the measurement start event.
The measurement result does not contain the execution time of other function called within the
specified function.
Specify the following in the Measurement Condition Designation dialog.
ATTENTION
When the target function calls the other functions, the first measurement finishes at the first calling
the other function, and the second measurement begins at the returning to the target function from
the first one.
166
7 Windows/Dialogs
7.11 Trace Window
The Trace Window is used to display the results of real-time trace measurement.
•
Bus mode
This mode allows you to inspect cycle-by-cycle bus information. The display content depends on
the MCU and simulator system used. In addition to bus information, this mode allows
disassemble, source line or data access information to be displayed in combination.
•
Disassemble mode
This mode allows you to inspect the executed instructions. In addition to disassemble information,
this mode allows source line or data access information to be displayed in combination.
•
Data access mode
This mode allows you to inspect the data read/write cycles. In addition to data access information,
this mode allows source line information to be displayed in combination.
•
Source mode
This mode allows you to inspect the program execution path in the source program.
The measurement result is displayed when a trace measurement has finished. When a trace
measurement restarts, the window display is cleared.
The range of a trace measurement can be altered in the Trace Point Setting Window. For details
about this window, refer to "7.9 Trace Point Setting Window." With default settings, the trace
information immediately before the program has stopped is recorded.
7.11.1 Configuration of Bus Mode
When bus mode is selected, trace information is displayed in bus mode. Bus mode is configured as
shown below.
The display content in bus mode differs depending on the MCU or simulator system used.
167
1.
Cycle display area: Shows trace cycles. Double-click here to bring up a dialog box to change the
displayed cycle.
2. Label display area: Shows labels corresponding to address bus information. Double-click here to
bring up a dialog box to search for addresses.
3. Bus information display area: The content displayed here differs depending on the MCU or
simulator system used.
- Refer to "7.11.6 Display of bus information on the M32C Debugger"
- Refer to "7.11.7 Display of bus information on the M16C/R8C Debugger"
- Refer to "7.11.8 Display of bus information on the 740 Debugger"
4. Time information display area: Shows time information of trace measurement result. One of the
following three modes can be selected from the menu.
- Absolute Time:Shows an elapsed time from the time the program started running up to now in
terms of absolute time (default).
- Differences:Shows a differential time from the immediately preceding cycle.
- Relative Time:Shows a relative time from the selected cycle. Note, however, that this mode
changes to the absolute time display mode when the trace measurement result is updated.
5. Acquired range of trace measurement result: Shows the currently acquired range of trace
measurement result.
6.
Trace measurement range: Shows the currently set range of trace measurement.
7.
First line cycle: Shows the cycle of the first line displayed.
8. First line address: Shows the address of the first line displayed.
9. First line time: First line time: Shows the time information of the first line displayed.
10. Window splitting box: Double-clicking this box splits the window into parts.
In addition to bus information, the window can display disassemble, source line or data access
information in combination. In this case, the display will be similar to the one shown below.
168
7 Windows/Dialogs
7.11.2 Configuration of Disassemble Mode
When disassemble mode is selected while bus mode is unselected, trace information is displayed in
disassemble mode. Disassemble mode is configured as shown below.
1.
2.
3.
4.
Address display area: Shows addresses corresponding to instructions. Double-click here to bring
up a dialog box to search for addresses.
Object code display area: Shows the object codes of instructions.
Label display area: Shows labels corresponding to instruction addresses. Double-click here to
bring up a dialog box to search for addresses.
Mnemonic display area: Shows the mnemonics of instructions.
Other display areas are the same as in bus mode.
In addition to disassemble information, the window can display source line or data access information
in combination. In this case, the display will be similar to the one shown below.
169
7.11.3 Configuration of Data Access Mode
When data access mode is selected while bus mode and disassemble mode are unselected, trace
information is displayed in data access mode. Data access mode is configured as shown below.
1.
Data access display area: Shows data access information. If the information displayed here is
"000400 1234 W," for example, it means that data "1234H" was written to the address 000400H
in 2-byte width.
Other display areas are the same as in bus mode.
In addition to data access information, the window can display source line information in combination.
In this case, the display will be similar to the one shown below.
170
7 Windows/Dialogs
7.11.4 Configuration of Source Mode
When only source mode is selected, trace information is displayed in source mode. Source mode is
configured as shown below.
1.
2.
3.
4.
5.
6.
7.
8.
Line number display area: Shows the line number information of the displayed file. Double-click
here to bring up a dialog box to change the displayed file.
Address display area: Shows addresses corresponding to source lines. Double-click here to bring
up a dialog box to search for addresses.
Referenced cycle display area: Shows the currently referenced cycle that is marked by ">>."
Furthermore, the addresses corresponding to source lines, if any, are marked by "-."
Source display area: Shows the content of the source file.
File name: Shows the file name of the currently displayed source file.
Referenced cycle: Shows the currently referenced cycle.
Referenced address: Shows the address corresponding to the currently referenced cycle.
Referenced time: Shows the time information corresponding to the currently referenced cycle.
Other display areas are the same as in bus mode.
171
7.11.5 Extended Menus
This window has the following popup menus that can be brought up by right-clicking in the window.
Menu
Function
BUS
DIS
SRC
DATA
View
Display the information of BUS mode.
Display the information of Disassemble mode.
Display the information of Source mode.
Display the information of Data access mode.
Changes the displayed position by specifying a cycle.
Changes the displayed position by searching an address.
Display a selected source file.
Shows elapsed time from the time the program started
running up to now in terms of absolute time.
Shows a differential time from the immediately preceding
displayed cycle.
Shows a relative time from the currently selected cycle.
Changes the direction of search to forward direction.
Changes the direction of search to reverse direction.
Searches in Step mode in the specified direction of search.
Searches in Come mode in the specified direction of search.
Stops trace measurement in the middle and displays the
measured content at the present point of time.
Restarts trace measurement.
Change layout of the corrent view.
Copy selected lines.
Save trace data to file.
Load trace data from file.
Display toolbar.
Open toolbar customize dialog box.
Allow window docking.
Hide window.
Time
Cycle...
Address...
Source...
Absolute Time
Differences
Trace
Relative Time
Forward
Backward
Step
Come
Stop
Restart
Layout...
Copy
Save...
Load...
Toolbar display
Customize toolbar...
Allow Docking
Hide
172
7 Windows/Dialogs
7.11.6 Display of bus information on the M32C Debugger
From left to right, the contents are as follows:
•
Address
•
The status of the address bus
•
Data
The status of the data bus
•
BUS
The width of the external data bus ("8b" for an 8-bit data bus, and "16b" for a 16-bit data bus)
•
BIU
This shows the status between the BIU (bus interface unit) and memory, and BIU and I/O.
Representation
WAIT
RBML
F
QC
RWML
INT
RB
WB
DRB
DWB
RW
WW
DRW
DWW
•
•
•
BIU status
No access
Executing wait instruction
Read access (bytes, ML on)
Fetch access
Discontinuous Fetch access (queue buffer)
Read access (words, ML on)
Interrupt acknowledge
Read access (bytes)
Write access (bytes)
Read access by DMA (bytes)
Write access by DMA (bytes)
Read access (words)
Write access (words)
Read access by DMA (words)
Write access by DMA (words)
R/W
Shows the status of the data bus ("R" for r ead, "W" for wr it e, "-" for no access).
RWT
This signal shows the effective position in the bus cycle ("0" when effective. Address, Data, and
BIU signals are valid when RWT is "0".
CPU, OPC, OPR
This shows the signal between CPU and BIU. In the column "CPU", the data shows whether CPU
accesses BIU or not . In the Column "OPC", the data shows the byte size of read operat ion code.
In the Column "OPR", the data shows the byte size of read operand.
173
•
•
•
•
Representation
CPU
OPC
OPR
Status
Operation code size
CPU
CPU
CPU
CPU
CPU
CPU
CPU
CPU
CPU
CPU
CPU
CPU
DMA
DMAT
1
2
3
0
1
2
3
0
1
2
0
1
-
No accessing
0byte
1byte
0byte
2bytes
0byte
3bytes
1byte
0byte
1byte
1byte
1byte
2bytes
1byte
3bytes
2bytes
0byte
2bytes
1byte
2bytes
2bytes
3bytes
0byte
3bytes
1byte
DMA accessing
DMA accessing(terminal count)
0
0
0
1
1
1
1
2
2
2
3
3
-
Operand size
B-T
Shows the level of the external break trigger (the EXTIN7 pin of the external trace signal input
cable). High level = "1", Low level = "0".
Q-T
Shows the level of the external trace trigger (the EXTIN6 pin of the external trace signal input
cable). High level = "1", Low level = "0".
76543210
Shows the status of the 8-bit external signal (pins EXTIN0 to EXTIN7 of the external trace signal
input cable). High level = "1", Low level = "0".
h" m' s: ms.us
Show the elapsed time from the target program beginning.
174
7 Windows/Dialogs
7.11.7 Display of bus information on the M16C/R8C Debugger
From left to right, the contents are as follows:
•
Address
The status of the address bus
•
Data
The status of the data bus
•
BUS
The width of the external data bus ("8b" for an 8-bit data bus, and "16b" for a 16-bit data bus)
•
BIU
This shows the status between the BIU (bus interface unit) and memory, and BIU and I/O.
Display format
DMA
INT
IB
DB
IW
DW
•
•
•
Status
No change
Data access other than a CPU cause such as DMA
Start of INTACK sequence
Instruction code read due to CPU cause (bytes)
Data access due to CPU cause (bytes)
Instruction code read due to CPU cause (words)
Data access due to CPU cause (words)
R/W
Shows the status of the data bus ("R" for read, "W" for write, "-" for no access).
RWT
This signal shows the effective position in the bus cycle ("0" when effective. Address, Data, and
BIU signals are valid when RWT is "0".
CPU
Shows the status between CPU and BIU (bus interface unit )
175
Display format
CB
RB
QC
CW
RW
•
•
•
•
•
Status
No change
Operation code read (bytes)
Operand read (bytes)
Instruction queue buffer clear
Operation code read (words)
Operand read (words)
QN
Shows the number of bytes stored in the instruction queue buffer in the range 0 to 4.
B-T
Shows the level of the external break trigger (the EXTIN7 pin of the external trace signal input
cable). High level = "1", Low level = "0".
Q-T
Shows the level of the external trace trigger (the EXTIN6 pin of the external trace signal input
cable). High level = "1", Low level = "0".
76543210
Shows the status of the 8-bit external signal (pins EXTIN0 to EXTIN7 of the external trace signal
input cable). High level = "1", Low level = "0".
h" m' s: ms.us
Show the elapsed time from the target program beginning.
176
7 Windows/Dialogs
7.11.8 Display of bus information on the 740 Debugger
From left to right, the contents are as follows:
•
Address
The status of the address bus
•
Data
The status of the data bus
•
Sync
This signal is output when fetching an instruction op-code. When an op-code is being fetched, this
signal indicates a logic 1.This Sync value is sometimes displayed as '(1)'.In this case, it denotes a
dummy Sync meaning that the instruction on the line is not actually executed.
•
Read
This signal determines the direct ion of the data bus. When data is to be read, this signal
indicates a logic 0.
•
Write
This signal determines the direct ion of the data bus. When data is to be written, this signal
indicates a logic 0.
•
B-T
Shows the level of the external break trigger (the EXTIN7 pin of the external trace signal input
cable). High level = "1", Low level = "0".
•
Q-T
Shows the level of the external trace trigger (the EXTIN6 pin of the external trace signal input
cable). High level = "1", Low level = "0".
•
76543210
Shows the status of the 8-bit external signal (pins EXTIN0 to EXTIN7 of the external trace signal
input cable). High level = "1", Low level = "0".
•
h" m' s: ms.us
Show the elapsed time from the target program beginning.
177
7.12 Data Trace Window
The Data Trace Window is used to analyze the results of real-time trace measurements and
graphically show data access information.
•
•
•
In the data reference area, you can inspect memory values at the point of a cycle currently in
interest or the values of registered C variables.
In the access history reference area, you can see the history of accesses to registered addresses in
chart form.
In conjunction with the Trace Window, you can inspect memory values at the point of a cycle you
are watching in the Trace Window. Conversely, you can show the cycle in the Trace Window
which you are watching in the Data Trace Window.
178
7 Windows/Dialogs
7.12.1 Extended Menus
This window has the following popup menus that can be brought up by right-clicking in the window.
Menu
Analyze Trace Data
Set Cycle...
Sync with Trace Window
Data Length
1byte
2bytes
4bytes
Radix
Hex
Dec
Address...
Add C Watch
Remove C Watch
Hide Type Name
Add...
Remove
Zoom
Zoom In
Zoom Out
Zoom...
Marker
Start Marker
End Marker
Indicator
Adjust
Change Grid Interval...
Change Row Setting...
Color...
Toolbar display
Customize toolbar...
Allow Docking
Hide
Function
Analyze the realtime-trace data.
Specify the display cycle.
Synchronize with Trace Window.
Display in 1Byte unit.
Display in 2Byte unit.
Display in 4Byte unit.
Display in Hexadecimal.
Display in Decimal.
Display from specified address.
Add C watchpoint.
Remove the selected C watchpoint.
Hide type names from variables.
Adds new watch item into Access History Reference Area.
Removes the selected watch item from Access History
Reference Area.
Increase the display scale.
Decrease the display sacle.
Specify the display scale.
Move the start marker in the display area.
Move the end marker in the display area.
Move the indicator in the display area.
Set cycle range between markers.
Change the grid interval.
Change setting of the selected row.
Change the display color.
Display toolbar.
Open toolbar customize dialog box.
Allow window docking.
Hide window.
179
7.13 GUI I/O Window
The GUI I/O window allows you for port input by creating a user target system key input panel
(button) in the window and clicking the created button. And this window also allows you to implement
the user target system output panel in the window.
•
•
•
You can arrange the following parts on the window.
- Label (character string)
Displays/erases a character string specified by the user when any value is written to the
specified address (bit).
- LED
Changes the display color of any area when any value is written to the specified address (bit).
(Substitution for LED ON)
- Button
A virtual port input can be executed at the time the button is pressed.
- Text
Display the text string.
You can also save the created panel in a file and reload it.
You can set up to 200 address points to the created part. If different addresses are set to the
individual parts, you can arrange up to 200 parts.
180
7 Windows/Dialogs
7.13.1 Extended Menus
This window has the following popup menus that can be brought up by right-clicking in the window.
Menu
Select Item
Delete
Copy
Paste
Create Button
Create Label
Create LED
Create Text
Display grid
Save...
Load...
Sampling Period...
Toolbar display
Customize toolbar...
Allow Docking
Hide
Function
Select an I/O item.
Delete the selected I/O item.
Copy the selected I/O item.
Paste the copied I/O item.
Create a new button item.
Create a new label item.
Create a new LED item.
Create a new text item.
Display the grid line.
Save I/O panel file.
Load I/O panel file.
Set RAM monitor sampling period.
Display toolbar.
Open toolbar customize dialog box.
Allow window docking.
Hide window.
181
7.14 MR Window
Use the MR Window to display the status of the realtime OS.
The debugger for 740 doesn't support this function.
You can only use the MR Window when you have downloaded a program that uses the realtime OS (if
the downloaded program does not use the MR, nothing is displayed in the MR Window when it is
opened.)
•
•
•
•
•
•
You can open the MR window as many as the number of display modes .
By clicking the desired button, the MR window display mode changes and the display data also
changes.
By double-clicking the desired task line, you can display the context data of the task.
You can drag the cursor to change the width of the display area in each mode.
If the downloaded program does not use MR, you cannot select all the menu which will select the
display mode.
The supported display mode is as follows.
If a target program created by MR30 or MR308 conformed to uITRON4 is downloaded, this window
supports the displays listed below.
-
Task status
Ready queue status
Timeout queue status
Event flag status
Semaphore status
Mailbox status
Data queue status
Cyclic handler status
Alarm handler status
Memory pool status
182
7 Windows/Dialogs
If a target program created by MR30 or MR308 conformed to uITRON3 is downloaded, this window
supports the displays listed below.
If a target program created on MR30 V.1.00 is downloaded, the MPL mode cannot be used on MR30.
(You cannot select the menu which changes the current mode to the MPL mode.)
-
Task status
Ready queue status
Timeout queue status
Event flag status
Semaphore status
Mailbox status
Cyclic handler status
Alarm handler status
Memory pool status
ATTENTION
Please use the startup file (crt0mr.axx/start.axx) whoes contents matches with the version of MRxx,
when you make downloaded program. The MR Window and MR command will not run properly if the
startup file you uses don't match with the version of MRxx.
7.14.1.1 Extended Menus
This window has the following popup menus that can be brought up by right-clicking in the window.
Menu
Mode
Context...
Layout
Refresh
RAM Monitor
Function
Task
Ready Queue
Timeout Queue
Event Flag
Semaphore
Mailbox
Data Queue
Cyclic Handler
Alarm Handler
Memory Pool
Message Buffer
Port
Mailbox(with Priority)
Displays Task status.
Displays Ready status.
Displays Timeout status.
Displays Event Flag status.
Displays Semaphore status.
Displays Mailbox status.
Displays Data Queue status.
Displays Cyclic Handler status.
Displays Alarm Handler status.
Displays Memory Pool status.
Displays Message Buffer status.
Displays Port status.
Displays Mailbox(with Priority) status.
Displays Context.
Switch display or non-display of status bar.
Refresh memory data.
Switch enable or disable RAM Monitor function.
Set RAM Monitor sampling period.
Display toolbar.
Open toolbar customize dialog box.
Allow window docking.
Hide window.
Status Bar
Enable RAM Monitor
Sampling Period...
Toolbar display
Customize toolbar...
Allow Docking
Hide
183
7.14.2 Display the Task Status
In the MR window, select Popup Menu - [Mode] -> [Task].
By double-clicking any line, the information on the task context is displayed in the Context dialog.
For details on the Context dialog, see "7.14.12 Display the Task Context"
The following data is displayed in the status bar.
7.14.2.1 Display the Task Status(When the realtime OS is MRxx conformed to uITRON specifications
V.3.0.)
All the tasks defined in the configuration are listed in the order of ID number. The function of each
item is as described below. (When the realtime OS is MRxx conformed to uITRON specifications
V.3.0.)
Items
Contents
ID
StaAddr
(name)
Pri
Status*1
wup_count
timeout
flg_ptn
flg_mode*2
Task ID
Starting address of task
Task name
Priority
Task status
Wake-up count
Timeout value
Wait bit pattern of event flag
Wait cancellation condition of event flag
184
7 Windows/Dialogs
•
•
*1Task Status
Display
Status
RUN
RDY
SUS
DMT
WAI(SLP)
WAI(SLP)-SUS
WAI(DLY)
WAI(DLY)-SUS
WAI(FLG)
WAI(FLG)-SUS
WAI(SEM)
WAI(SEM)-SUS
WAI(MBX)
WAI(MBX)-SUS
WAI(SLP-TMO)
WAI(SLP-TMO)-SUS
WAI(FLG-TMO)
WAI(FLG-TMO)-SUS
WAI(SEM-TMO)
WAI(SEM-TMO)-SUS
WAI(MBX-TMO)
WAI(MBX-TMO)-SUS
Run status
Ready Status
Suspend status
Dormant status
Sleep state
Sleep state(double wait)
Time wait state duw to dly_tsk
Time wait state duw to dly_tsk(double wait)
Event flagwait status
Event flagwait status(double wait)
Semaphore wait status
Semaphore wait status(double wait)
Message wait status
Message wait status(double wait)
Sleep state with time-out
Sleep state with time-out(double wait)
Event flag wait state with time-out
Event flag wait state with time-out(double wait)
Semaphore wait state with time-out
Semaphore wait state with time-out(double wait)
Message wait state with time-out
Message wait state with time-out(double wait)
*2Display the Wait Cancellation Condition of Event Flag
flg_mode
Status
TWF_ANDW
Waits for all bits set in the wait bit pattern to be set (AND
wait)
Clears the event flag to 0 when an AND wait has occurred
and the task wait status has been cancelled
Waits for any one bit set in the wait bit pattern to be set
(OR wait)
Clears the event flag to 0 when an OR wait has occurred
and the task wait status has been cancelled
TWF_ANDW+TWF_CLR
TWF_ORW
TWF_ORW+TWF_CLR
185
7.14.2.2 Display the Task Status(When the realtime OS is MRxx conformed to uITRON specifications
V.4.0.)
All the tasks defined in the configuration are listed in the order of ID number. The function of each
item is as described below. (When the realtime OS is MRxx conformed to uITRON specifications
V.4.0.)
Items
Contents
ID
Name
Pri
Status*1
Wupcnt
Actcnt
Tmout
Flgptn
Wfmode*2
Task ID
Task name
Priority
Task status
Wake-up count
Activated count
Timeout value
Wait bit pattern of event flag
Wait cancellation condition of event flag
186
7 Windows/Dialogs
•
*1Task Status
Display
Status
RUN
RDY
SUS
DMT
WAI(SLP)
WAI(SLP)-SUS
WAI(DLY)
WAI(DLY)-SUS
WAI(FLG)
WAI(FLG)-SUS
WAI(SEM)
WAI(SEM)-SUS
WAI(MBX)
WAI(MBX)-SUS
WAI(SDTQ)
WAI(SDTQ)-SUS
WAI(RDTQ)
WAI(RDTQ)-SUS
WAI(VSDTQ)
WAI(VSDTQ)-SUS
WAI(VRDTQ)
WAI(VRDTQ)-SUS
WAI(MPF)
WAI(MPF)-SUS
WAI(SLP-TMO)
WAI(SLP-TMO)-SUS
WAI(FLG-TMO)
WAI(FLG-TMO)-SUS
WAI(SEM-TMO)
WAI(SEM-TMO)-SUS
WAI(MBX-TMO)
WAI(MBX-TMO)-SUS
WAI(SDTQ-TMO)
WAI(SDTQ-TMO)-SUS
WAI(RDTQ-TMO)
WAI(RDTQ-TMO)-SUS
WAI(VSDTQ-TMO)
WAI(VSDTQ-TMO)-SUS
WAI(VRDTQ-TMO)
WAI(VRDTQ-TMO)-SUS
WAI(MPF-TMO)
WAI(MPF-TMO)-SUS
Run status
Ready Status
Suspend status
Dormant status
Sleep state
Sleep state(double wait)
Time wait state due to dly_tsk
Time wait state due to dly_tsk(double wait)
Event flagwait status
Event flagwait status(double wait)
Semaphore wait status
Semaphore wait status(double wait)
Message wait status
Message wait status(double wait)
Transmission data wait status
Transmission data wait status(double wait)
Reception data wait status
Reception data wait status(double wait)
Transmission extended data wait status
Transmission extended data wait status(double wait)
Reception extended data wait status
Reception extended data wait status(double wait)
Fixed length memory pool wait
Fixed length memory pool wait(double wait)
Sleep state with timeout
Sleep state with timeout(double wait)
Event flag wait state with timeout
Event flag wait state with timeout(double wait)
Semaphore wait state with timeout
Semaphore wait state with timeout(double wait)
Message wait state with time-out
Message wait state with timeout(double wait)
Transmission data with timeout wait status
Transmission data with timeout wait status(double wait)
Reception data with timeout wait status
Reception data with timeout wait status(double wait)
Transmission extended data with timeout wait status
Transmission extended data with timeout wait status(double wait)
Reception extended data with timeout wait status
Reception extended data with timeout wait status(double wait)
Fixed length memory pool with timeout wait
Fixed length memory pool with timeout wait(double wait)
187
•
*2Display the Wait Cancellation Condition of Event Flag
Wfmode
Status
TWF_ANDW
TWF_ORW
Waits for all bits set in the wait bit pattern to be set (AND wait)
Waits for any one bit set in the wait bit pattern to be set (OR wait)
7.14.3 Display the Ready Queue Status
In the MR window, select Popup Menu - [Mode] -> [Ready Queue].
The following data is displayed in the status bar.
7.14.3.1 Display the Ready Queue Status(When the realtime OS is MRxx conformed to uITRON
specifications V.3.0.)
The function of each item is as described below. (When the realtime OS is MRxx conformed to
uITRON specifications V.3.0.)
Item
Contents
Pri
RdyQ
Displays priority
Shows the ID Nos. and task names of tasks in the ready queue
•
Up to 8 characters of the task name is displayed in the RdyQ field. When the task name exceeds 8
characters, the extra characters are omitted.
7.14.3.2 Display the Ready Queue Status(When the realtime OS is MRxx conformed to uITRON
specifications V.4.0.)
The function of each item is as described below. (When the realtime OS is MRxx conformed to
uITRON specifications V.4.0.)
Item
Contents
Pri
Ready Queue
Displays priority
Shows the ID Nos. and task names of tasks in the ready queue
•
Up to 8 characters of the task name is displayed in the Ready Queue field. When the task name
exceeds 8 characters, the extra characters are omitted.
188
7 Windows/Dialogs
7.14.4 Display the Timeout Queue Status
In the MR window, select Popup Menu - [Mode] -> [Timeout Queue].
7.14.4.1 Display the Timeout Queue Status(When the realtime OS is MRxx conformed to uITRON
specifications V.3.0.)
The function of each item is as described below.
Tasks waiting at present are displayed in the descending order of timeout value. (When the realtime
OS is MRxx conformed to uITRON specifications V.3.0.)
Item
Contents
Value
ID(name)
Shows the timeout value of each task
Shows the ID No. and task name of the tasks in the timeout queue
•
Following character strings are used to indicate the type of wait state.
Character string
Wait state
[slp]
[dly]
[flg]
[sem]
[mbx]
Wait due to tslp_tsk
Wait due to dly_tsk
Wait due to twai_flg
Wait due to twai_sem
Wait due to trcv_msg
•
When a task connected to the timeout queue is in the state of forced waiting (double waiting), a
string "[s]", which indicates double waiting, is appended to a string displayed in the ID (name)
field.
Normal display
Display when in WAIT-SUSPEND
26(_task26)
26(_task26)[s]
189
7.14.4.2 Display the Timeout Queue Status(When the realtime OS is MRxx conformed to uITRON
specifications V.4.0.)
The function of each item is as described below.
Tasks waiting at present are displayed in the descending order of timeout value. (When the realtime
OS is MRxx conformed to uITRON specifications V.4.0.)
Item
Contents
Tmout
ID(Name)
Shows the timeout value (ms) of each task
Shows the ID No. and task name of the tasks in the timeout queue
•
Following character strings are used to indicate the type of wait state.
Character string
Wait state
[slp]
[dly]
[flg]
[sem]
[mbx]
[mpf]
[sdtq]
[rdtq]
[vsdtq]
[vrdtq]
Wait due to tslp_tsk
Wait due to dly_tsk
Wait due to twai_flg
Wait due to twai_sem
Wait due to trcv_mbx
Wait due to tget_mpf
Wait due to tsnd_dtq
Wait due to trcv_dtq
Wait due to vtsnd_dtq
Wait due to vtrcv_dtq
•
When a task connected to the timeout queue is in the state of forced waiting (double waiting), a
string "[s]", which indicates double waiting, is appended to a string displayed in the ID(Name)
field.
Normal display
Display when in WAIT-SUSPEND
26(_task26)
26(_task26)[s]
190
7 Windows/Dialogs
7.14.5 Display the Event Flag Status
In the MR window, select Popup Menu - [Mode] -> [Event Flag].
7.14.5.1 Display the Event Flag Status(When the realtime OS is MRxx conformed to uITRON
specifications V.3.0.)
All the event flags defined in the configuration are listed in the order of ID number. The function of
each item is listed below. (When the realtime OS is MRxx conformed to uITRON specifications V.3.0.)
Item
Contents
ID
flg_ptn
flagQ
ID No. of event flag
Bit pattern of each event flag
Task ID Nos. and task names in the event flag queue
•
When a task connected to the event flag queue is in the state of waiting with timeout enabled
(waiting in twai_flg), a string "[tmo]", which indicates a state of waiting with timeout enabled, is
appended to a string displayed in the flag Q field.
When a task connected to the event flag queue is in the state of forced waiting (double waiting), a
string "[s]", which indicates double waiting, is appended to a string displayed in the flag Q field.
Normal Display
Display when in WAIT-SUSPEND
Display when in WAIT-SUSPEND with time out
•
26(_task26)
26(_task26)[s]
26(_task26)[tmo][s]
Up to 8 characters can be displayed in the task name in the flag Q field.If a task name exceeds 8
characters, the extra characters are omitted.
7.14.5.2 Display the Event Flag Status(When the realtime OS is MRxx conformed to uITRON
specifications V.4.0.)
All the event flags defined in the configuration are listed in the order of ID number. The function of
each item is listed below. (When the realtime OS is MRxx conformed to uITRON specifications V.4.0.)
Item
Contents
ID
Flgatr
Flgptn
Flag Queue
ID No. of event flag
Attribute of each event flag
Bit pattern of each event flag
Task ID Nos. and task names in the event flag queue
191
•
The following are displayed in the Flgatr area:
TA_TFIFO
TA_TPRI
TA_WSGL
TA_WMUL
TA_CLR
•
Task wait queue is in FIFO order
Task wait queue is in task priority order
Only one task is allowed to be in the waiting state for the eventflag
Multiple tasks are allowed to be in the waiting state for the eventflag
Eventflag's bit pattern is cleared when a task is released from the
waiting state for that eventflag
When a task connected to the event flag queue is in the state of waiting with timeout enabled
(waiting in twai_flg), a string "[tmo]", which indicates a state of waiting with timeout enabled, is
appended to a string displayed in the Flag Queue field.
When a task connected to the event flag queue is in the state of forced waiting (double waiting), a
string "[s]", which indicates double waiting, is appended to a string displayed in the Flag Queue
field.
Normal Display
Display when in WAIT-SUSPEND
Display when in WAIT-SUSPEND with time out
•
26(_task26)
26(_task26)[s]
26(_task26)[tmo][s]
Up to 8 characters can be displayed in the task name in the Flag Queue field.
If a task name exceeds 8 characters, the extra characters are omitted.
192
7 Windows/Dialogs
7.14.6 Display the Semaphore Status
In the MR window, select Popup Menu - [Mode] -> [Semaphore].
7.14.6.1 Display the Semaphore Status(When the realtime OS is MRxx conformed to uITRON
specifications V.3.0.)
All the SEMs defined in the configuration are listed in the order of ID number. The function of each
item is listed below. (When the realtime OS is MRxx conformed to uITRON specifications V.3.0.)
Item
Contents
ID
Def_cnt
Count
semQ
ID No. of semaphore
Default value of semaphore counter
Semaphore count
Task ID Nos. and task names in the semaphore queue
•
When a task connected to the SEM queue is in the state of waiting with timeout enabled (waiting
in twai_sem), a string "[tmo]", which indicates a state of waiting with timeout enabled, is
appended to a string displayed in the semQ field.
When a task connected to the SEM queue is in the state of forced waiting (double waiting), a
string "[s]", which indicates double waiting, is appended to a string displayed in the semQ field.
Normal Display
Display when in WAIT-SUSPEND
Display when in WAIT-SUSPEND with time out
•
26(_task26)
26(_task26)[s]
26(_task26)[tmo][s]
Up to 8 characters can be displayed in the task name in the semQ field. If a task name exceeds 8
characters, the extra characters are omitted.
7.14.6.2 Display the Semaphore Status (When the realtime OS is MRxx conformed to uITRON
specifications V.4.0.)
All the SEMs defined in the configuration are listed in the order of ID number. The function of each
item is listed below. (When the realtime OS is MRxx conformed to uITRON specifications V.4.0.)
Item
Contents
ID
Sematr
Semcnt
Semaphore Queue
ID No. of semaphore
Attribute of each semaphore
Semaphore count
Task ID Nos. and task names in the semaphore queue
193
•
The following are displayed in the Sematr area:
TA_TFIFO
TA_TPRI
•
Task wait queue is in FIFO order
Task wait queue is in task priority order
When a task connected to the SEM queue is in the state of waiting with timeout enabled (waiting
in twai_sem), a string "[tmo]", which indicates a state of waiting with timeout enabled, is
appended to a string displayed in the Semaphore Queue field.
When a task connected to the SEM queue is in the state of forced waiting (double waiting), a
string "[s]", which indicates double waiting, is appended to a string displayed in the Semaphore
Queue field.
Normal Display
Display when in WAIT-SUSPEND
Display when in WAIT-SUSPEND with time out
•
26(_task26)
26(_task26)[s]
26(_task26)[tmo][s]
Up to 8 characters can be displayed in the task name in the Semaphore Queue field.If a task
name exceeds 8 characters, the extra characters are omitted.
194
7 Windows/Dialogs
7.14.7 Display the Mailbox Status
In the MR window, select Popup Menu - [Mode] -> [Mailbox].
7.14.7.1 Display the Mailbox Status (When the realtime OS is MRxx conformed to uITRON
specifications V.3.0.)
All the mail boxes defined in the configuration are listed in the order of ID number. The function of
each item is listed below. (When the realtime OS is MRxx conformed to uITRON specifications V.3.0.)
Item
Contents
ID
Msg_cnt
MAXmsg
Wait Queue(Message)
ID No. of mailbox
Number of messages in each mailbox
Maximum number of messages that can be contained in each mailbox
The messages stored in the mailbox or ID No. and task name of tasks
waiting for messages
•
•
The WaitQueue (Message) field shows a string "Msg" when a message is stored (when Msg_cont
as described above is non-zero), and then displays the stored message.
When no message is stored (when Msg_cont is zero), the WaitQueue field displays a string "Task"
if a task waiting for a message exists, and then displays the ID number and name of the task
waiting for a message.
When a task connected to the mail box queue is in the state of waiting with timeout enabled
(waiting in trcv_msg), a string "[tmo]", which indicates the state of timeout enabled, is appended
to a string displayed in the WaitQueue (Message) field.
When a task connected to the mail box queue is in the state of forced waiting (Double waiting), a
string "[s]", which indicates the state of double waiting, is appended to a string displayed in the
WaitQueue (Message) field.
Normal Display
Display when in WAIT-SUSPEND
Display when in WAIT-SUSPEND with time out
•
26(_task26)
26(_task26)[s]
26(_task26)[tmo][s]
Up to 8 characters can be displayed in the task name in the WaitQueue (Message) field. If a task
name exceeds 8 characters, the extra characters are omitted.
195
7.14.7.2 Display the Mailbox Status (When the realtime OS is MRxx conformed to uITRON
specifications V.4.0.)
All the mail boxes defined in the configuration are listed in the order of ID number. The function of
each item is listed below. (When the realtime OS is MRxx conformed to uITRON specifications V.4.0.)
Item
Contents
ID
Mbxatr
Mailbox Queue (Wait)
Mailbox Queue (Message)
ID No. of mailbox
Attribute of each mailbox
ID No. and task name of tasks waiting for messages
The messages stored in the mailbox
•
The following are displayed in the Mbxatr area:
TA_TFIFO
TA_TPRI
TA_MFIFO
TA_MPRI
•
Task wait queue is in FIFO order
Task wait queue is in task priority order
Message queue is in FIFO order
Message queue is in message priority order
When a task connected to the mail box queue is in the state of waiting with timeout enabled
(waiting in trcv_mbx), a string "[tmo]", which indicates the state of timeout enabled, is appended
to a string displayed in the Mailbox Queue (Wait) field.
When a task connected to the mail box queue is in the state of forced waiting (Double waiting), a
string "[s]", which indicates the state of double waiting, is appended to a string displayed in the
Mailbox Queue (Wait) field.
Normal Display
Display when in WAIT-SUSPEND
Display when in WAIT-SUSPEND with time out
•
26(_task26)
26(_task26)[s]
26(_task26)[tmo][s]
Up to 8 characters can be displayed in the task name in the Mailbox Queue (Wait) field. If a task
name exceeds 8 characters, the extra characters are omitted.
196
7 Windows/Dialogs
7.14.8 Display the Data Queue Status
In the MR window, select Popup Menu - [Mode] -> [Data Queue].
7.14.8.1 Display the Data Queue Status(When the realtime OS is MRxx conformed to uITRON
specifications V.4.0.)
All the data queues defined in the configuration are listed in the order of ID number. The function of
each item is listed below. (When the realtime OS is MRxx conformed to uITRON specifications V.4.0.)
Item
Contents
ID
Dtqatr
Dtcnt
Dtqsz
Data Queue (Wait)
ID No. of data queue
Attribute of each date queue
Number of messages in each data queue
Maximum number of messages that can be contained in each data queue
ID No. and task name of tasks waiting for message transmission waiting
or message reception waiting
The messages stored in the data queue
Data Queue (Data)
•
The display of the ID field varies depending on which one is specified, the standard data(32 bits)
or the extended data(16 bits).
MR308/4
- If the standard data(32 bits), the ID field displays a string "[32]" and data queue ID number.
- If the extended data(16 bits), the ID field displays a string "[16]" and data queue ID number.
MR30/4
- If the standard data(16 bits), the ID field displays a string "[16]" and data queue ID number.
- If the extended data(32 bits), the ID field displays a string "[32]" and data queue ID number.
•
The following are displayed in the Dtqatr area:
TA_TFIFO
TA_TPRI
Task wait queue is in FIFO order
Task wait queue is in task priority order
197
•
•
The Data Queue (Wait) field displays a string "Send" if a task waiting for a message sending, and
then displays the ID number and name of the task waiting for a message sending. Also, if a task
waiting for a message receiving, displays a string "Receive" and then displays the ID number and
name of the task waiting for a message receiving.
When a task connected to the date queue is in the state of waiting with timeout enabled , a string
"[tmo]", which indicates the state of timeout enabled, is appended to a string displayed in the
Data Queue (Wait) field.
When a task connected to the data queue is in the state of forced waiting (Double waiting), a
string "[s]", which indicates the state of double waiting, is appended to a string displayed in the
Data Queue (Wait) field.
Normal Display
Display when in WAIT-SUSPEND
Display when in WAIT-SUSPEND with time out
•
26(_task26)
26(_task26)[s]
26(_task26)[tmo][s]
Up to 8 characters can be displayed in the task name in the Data Queue (Wait) field.If a task
name exceeds 8 characters, the extra characters are omitted.
198
7 Windows/Dialogs
7.14.9 Display the Cycle Handler Status
In the MR window, select Popup Menu - [Mode] -> [Cyclic Handler].
7.14.9.1 Display the Cycle Handler Status(When the realtime OS is MRxx conformed to uITRON
specifications V.3.0.)
All the cycle handlers defined in the configuration are listed in the order of ID number. The function
of each item is listed below. (When the realtime OS is MRxx conformed to uITRON specifications
V.3.0.)
Item
Contents
ID
StaAddr
(name)
interval
count
Status
ID No. of cycle handler
Starting address of cycle handler
Name of cycle handler
Interrupt interval
Interrupt count
Activity status of cycle start handler
•
The following are displayed in the Status area:
TCY_ON
TCY_OFF
Cycle handler enabled
Cycle handler disabled
199
7.14.9.2 Display the Cycle Handler Status(When the realtime OS is MRxx conformed to uITRON
specifications V.4.0.)
All the cycle handlers defined in the configuration are listed in the order of ID number. The function
of each item is listed below. (When the realtime OS is MRxx conformed to uITRON specifications
V.4.0.)
Item
Contents
ID
Name
Cycphs
Cyctim
Tmout
ID No. of cycle handler
Name of cycle handler
The activation phase (by the millisecond)
The activation cycle time (by the millisecond)
The amount of time by the millisecond remaining before the cyclic
handler's next activation time
Activity status of cycle start handler
Status
•
The following are displayed in the Status area:
TCYC_STA
TCYC_STP
Cycle handler is in an operational state
Cycle handler is in a non-operational state
200
7 Windows/Dialogs
7.14.10 Display the Alarm Handler Status
In the MR window, select Popup Menu - [Mode] -> [Alarm Handler].
When the realtime OS is MRxx conformed to uITRON specifications V.3.0, the following data is
displayed in the status bar.
7.14.10.1 Display the Alarm Handler Status(When the realtime OS is MRxx conformed to uITRON
specifications V.3.0.)
Of all the cycle start handlers defined in the configuration, only those which are not started yet at
present are listed in the ascending order of start time. The function of each item is listed below.
(When the realtime OS is MRxx conformed to uITRON specifications V.3.0.)
Item
Contents
ID
StaAddr
(name)
AlarmTime
ID No. of alarm handler
Starting address of alarm handler
Name of alarm handler
Starting time of alarm handler
7.14.10.2 Display the Alarm Handler Status(When the realtime OS is MRxx conformed to uITRON
specifications V.4.0.)
Of all the cycle start handlers defined in the configuration, only those which are not started yet at
present are listed in the ascending order of start time. The function of each item is listed below.
(When the realtime OS is MRxx conformed to uITRON specifications V.4.0.)
Item
Contents
ID
Name
Almtim
ID No. of alarm handler
Name of alarm handler
The amount of time by the millisecond remaining before the alarm
handler's activation time
Activity status of alarm handler
Status
•
The following are displayed in the Status area:
TALM_STA
TALM_STP
Alarm handler is in an operational state
Alarm handler is in a non-operational state
201
7.14.11 Display the Memory Pool Status
In the MR window, select Popup Menu - [Mode] -> [Memory Pool].
7.14.11.1 Display the Memory Pool Status(When the realtime OS is MRxx conformed to uITRON
specifications V.3.0.)
All the memory pools defined in the configuration are listed in the order of ID number. (The fixed
length data comes first, and the optional length data comes after the fixed length data.) The function
of each item is listed below. (When the realtime OS is MRxx conformed to uITRON specifications
V.3.0.)
Item
Contents
ID
BaseAddr
Blk_Size
Total Blk_cnt
Free Blk_cnt(map)
ID No. of memory pool
Base address of memory pool
Block size of memory pool
Tot a l block count of memory pool
Number of unused blocks and information on unused memory blocks
(bit information)
•
•
•
The display of the ID field varies depending on which one is specified, fixed length or optional
length.
- If the data is of fixed length, the ID field displays a string "[F]" and memory pool ID number.
- For an arbitrary length, the contents displayed on the first line are the character string "[V]," a
memory pool ID number, and a block ID number. Displayed on the second to fourth lines are
the memory pool ID and block ID numbers. The block ID numbers are enclosed in parentheses.
When specifying the optional length memory pool, "--" is displayed in the Total Mlk_cut field.
No bit information is displayed in the Free Blk_cnt (map) field.
When specifying the fixed-length memory pool, the display format of each bit in the memory block
information in Free Blk_cnt (map) is as shown below:
item
Contents
'0'
'1'
'-'
Memory block in use (busy)
Memory block not in use (ready)
No memory block
202
7 Windows/Dialogs
7.14.11.2 Display the Memory Pool Status(When the realtime OS is MRxx conformed to uITRON
specifications V.4.0.)
All the memory pools are listed in the order of ID number. The function of each item is listed below.
(When the realtime OS is MRxx conformed to uITRON specifications V.4.0.)
Item
Contents
ID
Mplatr
Mpladr
Mplsz
Blkcnt
Fblkcnt
Memory Pool Queue
ID No. of memory pool
Attribute of each memory pool
Base address of memory pool
Size of memory pool
Total block count of fixed length memory pool
Number of unused blocks and information on unused memory blocks
Displays the ID number and name of tasks waiting in the memory
pool.
•
The following are displayed in the Mplatr area:
TA_TFIFO
TA_TPRI
•
Task wait queue is in FIFO order
Task wait queue is in task priority order
The display of the ID field varies depending on which one is specified, fixed length or optional
length.
- If the data is of fixed length, the ID field displays a string "[F]" and memory pool ID number.
- For an arbitrary length, the contents displayed on the first line are the character string "[V]," a
memory pool ID number, and a block ID number. Displayed on the second to fourth lines are
the memory pool ID and block ID numbers. The block ID numbers are enclosed in parentheses.
203
7.14.12 Display the Task Context
7.14.12.1 Display the Task Context
In the MR window, select Popup Menu - [Context...].
The Context dialog box is opened. The Context dialog box is used to reference/specify the context
information of the specified task.
You can also open the Context dialog box by double-clicking the data display area in the task state
display mode .
Enter the task ID number in the Task ID field and click the View button (or press the Enter key).
The context of the specified task appears in the Context field.
If the task entered in the Task ID field is "RUN" or "DMT" when clicking the View button, the context
is not displayed. (In the Context field, only the task ID and task state are displayed.)
•
If a task ID number which does not exist is entered in the Task ID field when clicking the View
button, an error occurs.
204
7 Windows/Dialogs
7.14.12.2 Change the task context
Enter the task ID number in the Task ID field in the Context dialog and click the Set button. The Set
Context dialog is opened.
The Set Context dialog is used to set the specified context register value of the specified task.
Specify the register to be changed in the Register field list box and enter the value to be set in the
"Value:" field.
If an expression description set in the "Value:" field is wrong, or if the specified value is outside the
allowable range set for the specified register, an error occurs.
205
7.15 MR Trace Window
The MR Trace window measures the task execution history of a program using the real time OS and
displays the result graphically.
The debugger for 740 doesn't support this function.
In addition to the task execution history, a history of various other operations each are traced and
displayed, including interrupt processing, task state transition, and system call issuance.
This window is available only when a target program which uses our real time OS (MRxx) is
downloaded.
For MR30
•
For MR30, this window is available for V. 2.00 or later version. If a target program crated on
MR30 V. 1.00 is downloaded, the MR Trace window will not function and not display any data.
For MR308
•
The history of the high-speed interrupt can not record and display.
The content of each item is as follows.
Items
VEC*1
table
ID
(name)
Contents
Indicates a software interrupt number.
Indicates the interrupt vector table number.
Indicates a task ID number.
Indicates an interrupt routine name, task name, idle processing
(display "idle"), and unknown name(displayed "unknown").
206
7 Windows/Dialogs
When moving the mouse to the information displayed in the window, the pop up window as below is
opened, showing the detailed information.
Interrupt handling or task execution history
System call issue history
Task state transition history
Following information is displayed in the status bar.
•
Time value at which start marker is positioned
•
Time value at which end marker is positioned
•
Time width of a range indicated by start and end markers
•
Time value at which indicator is positioned
•
Scale factor of display
•
Time width of grid line interval
•
Range of measurement (trace) result
The grid lines are displayed using the start marker as the radix point.
The grid lines are displayed using the start marker as the radix point. The scale is displayed, using
the time at which the start marker is positioned as 0, with the left (forward in time) set to "minus"
and the right (backward in time) set to "plus".
The grid lines allow you to roughly understand the interrupt occurrence cycle and process time.
The interval time width of the displayed grid lines appears in the "Grid" area of the status bar.
The time value in the MR Trace window means the execution elapsed time using the program
execution start time as 0 in all the cases. On the contrary, the numeric value above the grid lines
(scale) in the MR Trace window is a relative value using the start marker as 0 (the grid interval is
specified in the Value dialog).
It has nothing to do with the time value. (This is provided so that you can see the window easily.)
Note
The software interrupt number*1 is different according to product. For details about which interrupt
number is assigned to which system call, refer to the MRxx Reference Manual, "Assemble Language
Interface."
207
7.15.1 Extended Menus
This window has the following popup menus that can be brought up by right-clicking in the window.
Menu
Function
Start Marker
End Marker
Indicator
Adjust
Move the start marker in the display area.
Move the end marker in the display area.
Move the indicator in the display area.
Adjust range of start and end marker to full width of display
area Adjust.
Expand scale factor of display.
Reduce scale factor of display.
Stop measuring.
Restarts measuring.
Search for history of system calls.
Set measurement range condition to After.
Set measurement range condition to Break.
Set value.
Change display color.
Reset the task order on the display.
Display toolbar.
Open toolbar customize dialog box.
Allow window docking.
Hide window.
Expand
Reduce
Trace Stop
Trace Restart
Search...
Trace Range
Value...
Color...
Init Order...
Toolbar display
Customize toolbar...
Allow Docking
Hide
After
Break
208
7 Windows/Dialogs
7.15.2 Refer the Execution History of Task(MRxx Window)
You can reference the task execution history in the MR Trace window. You can reference the
execution history statistical processing result in the MR Analyze window. These windows are
available for a target program using our real time OS (MRxx).
7.15.2.1 Select the Trace Range
To measure the task execution history, the real time trace function is used. Click the "After" button
(or, select Menu - [Trace Range] ->[After]) or "Break" button (or, select Menu - [Trace Range] ->
[Break]) in the MR Trace window.
After
Break
Stores the cycles of trace data after the trace point.
Stores the cycles to the point at which the trace point is passed.
Execute the target program. Record the information required to know the task execution history in
the trace memory.
ATTENTION
A trace point set in the Trace Point Setting dialog is disabled.
7.15.2.2 Stop the Task Execution History Measurement
Click the "Stop" button in the Task Trace window. (Or, select Menu - [Trace Stop].) The measurement
results so far are displayed in the MR Trace window.
7.15.2.3 Restart the Task Execution History Measurement
Click the "Restart" button in the Task Trace window. (Or, select Menu - [Trace Restart].) When
restarting the trace measurement, all the measurement results so far are deleted.
209
7.15.2.4 Refer the Execution History of Task
You can reference the task execution transition in the MR Trace window.
By moving the mouse to any information displayed in the window, the following window is opened,
showing the detailed information.
Interrupt handling or task execution history
System call issue history
Task state transition history
210
7 Windows/Dialogs
7.15.2.4.1.
Search the History of System Call Issue
Click the "Search" button in the tool bar. The Search dialog is opened. (Or, select Menu - [Search ...].)
Specify the search condition.
With the function code (R0: Function Code) and error code (R0: Error Code), you can specify multiple
values (OR condition). Other items are searched based on the AND condition.
Then, specify the search direction. The debugger searches the items in the direction specified in the
dialog, using the position pointed by the indicator as the radix point.
When the debugger does not check all the search items, the subsequent system call issuance history
in the search direction will be a search result. Click the Find Next button. The debugger searches the
system call issuance history corresponding to the specified condition. The specified items are searched
using the AND condition.
If the search condition is met, the indicator is moved to that point.
211
7.15.2.4.2.
Change the display magnification
Click the "Expand" button or "Reduce" button in the tool bar. (Or, select Menu - [Expand] or
[Reduce].)
The display is expanded or reduced using the left corner of the graph area as the radix point. By
default, the display is expanded or reduced with display scale of 1.5.
The display scale appears in the "Scale:*" field in the status bar.
The default expansion/reduction scale is 1.5. To change the scale, select Menu - [Value ...].
The Value dialog is opened. Specify the display expansion/reduction scale.
7.15.2.4.3.
Change the grid line display interval
Select Menu - [Value ...]. The Value dialog is opened. Specify the display time interval.
212
7 Windows/Dialogs
7.15.2.4.4.
Change the task display order
Drag the task/interrupt routine to be moved (the left portion of the graph) to the destination.
To initialize the display order, select Menu - [Init Order].
7.15.2.4.5.
Display the specific task only
Click the task/interrupt routine to be hidden (the left portion of the graph). Every time you click, the
setting is switched between "Display" and "Hide".
7.15.2.4.6.
Change the display color
Select Menu - [Color...]. The Color dialog is opened.
Click the button corresponding to the desired item. The Color Setting dialog is opened. Change the
display color in the dialog.
213
7.15.2.5 Measure the Execution Time of Task
You can measure the execution time between the markers by changing the positions of start marker
and end marker in the MR Trace window.
Drag the start marker position and end marker position.
The time interval between the markers is displayed in the status bar.
Note
[Definition of time value in the MR Trace window]
The time value in the MR Trace window indicates the execution elapsed time which sets the program
execution start point to 0 in all the cases.
On the contrary, a numeric value above the grid line (scale) in the MR Trace window is a relative
value which sets the start marker to 0 (the grid interval is specified in the Value dialog), which has
nothing to do with the time value. (It is provided so that you can see the window easily.)
7.15.2.5.1.
Move the Marker
Each marker can be moved by dragging. When moving the mouse on the marker, the cursor shape
changes. Then, start dragging.
The start marker moves into the window (left portion) by clicking the "Start Marker" button in the
tool bar. (Or, select Menu - [Start Marker].)
The end marker moves into the window (right portion) by clicking the "End Marker" button. (Or,
select Menu - [End Marker].)
The indicator moves into the window (center) by clicking the "Indicator" button. (Or, select Menu [Indicator].)
The other markers can move only to the specified positions listed below.
•
•
•
Position to which the interrupt processing or task execution transits
Position to which the task state transits
Position where the system call issuance history is displayed
214
7 Windows/Dialogs
7.16 MR Analyze Window
The MR Analyze window displays the result of the measurement data statistically analyzed within
the range specified by the start marker and the end marker in the MR Trace window.
The debugger for 740 doesn't support this function.
The MR Analyze window supports three display mode as below:
•
CPU occupation state by interrupt/task
•
Ready time by task
•
List of system call issuance histories (You can extract and display the history based on the
specific condition.)
The MR Analyze window functions together with the MR Trace window.
This window is available only when a target program using our real time OS (MRxx) is downloaded.
7.16.1 Configuration of CPU Occupancy Status Display Mode
The CPU occupation state display mode is used to display the CPU occupation time and ratio by
interrupt/task.
The MR Trace window shows the statistical results within the range specified by the start marker
and end marker.
By clicking the maximum execution time/minimum execution time display area of each line, you can
search interrupt to the clicked line or process history at the maximum/minimum execution time of the
task.
The search result is pointed by the indicator which moves to the target position in the MR Trace
window.
215
7.16.2 Configuration of Ready State Duration Display Mode
The ready state time display mode by task is used to display the results generated from statistical
process of the time required from execution ready to transition to execution by task.
The statistical result is displayed within the range specified by the start marker and end marker in
the MR Trace window.
By clicking the maximum ready time/minimum ready time display area of the desired line, you can
search the process history of the maximum ready time/minimum ready time of the task corresponding
to the clicked line.
The search result is pointed by the indicator which moves to the target position in the MR Trace
window.
7.16.3 Configuration of System Call History Display Mode
The system call issuance history list mode is used to list the system calls issued.
The system call issuance history is listed within the range specified by the start marker and end
marker in the MR Trace window.
The number indicates a numeric value counted from the top system call within the measurable range.
By clicking the desired line, you can search the system call issuance history to the clicked line.
The search result is pointed by the indicator which moves to the target position in the MR Trace
window.
216
7 Windows/Dialogs
7.16.4 Extended Menus
This window has the following popup menus that can be brought up by right-clicking in the window.
Menu
Run Time
Rdy->Run
System Call
Pick Up System Call...
Toolbar display
Customize toolbar...
Allow Docking
Hide
Function
CPU occupancy status display mode.
Ready state duration display mode.
System call history display mode.
Extract specified system calls display mode.
Display toolbar.
Open toolbar customize dialog box.
Allow window docking.
Hide window.
7.16.5 Analyze the Execution History of Task
You can reference the execution history statistical processing in the MR Analyze window. The MR
Analyze window functions together with the MR Trace window. If the MR Trace window is not open,
or the MR Trace window does not show any data, the MR Analyze window will not function.
The execution history statistical processing function allows you to reference the following topics.
7.16.5.1.1.
Refer the CPU Occupation State
Click the Run Time button in the tool bar. (Or, select Menu - [Run Time].) The MR Analyze window
changes to the CPU occupation state display mode.
The window shows the CPU occupation time and ratio by interrupt processing and by task.
The data displayed is the statistical results for the range specified with the start marker and end
marker in the MR Trace window.
By clicking the maximum execution time/minimum execution time display field of each line, you can
search the processing history at the maximum execution time/minimum execution time of the task
corresponding to the clicked line.
The search result is pointed by the indicator in the MR Trace window after the indicator moves to the
destination position.
217
7.16.5.2 Refer the Ready Queue Time
Click the Ready->Run button in the tool bar. (Or, select Menu - [Rdy -> Run].)
The time required from execution ready state to transition to execution state by task is processed
statistically and displayed.
The data displayed is the statistical results of the range specified with the start marker and end
marker in the MR Trace window.
By clicking the maximum ready time/minimum ready time display field of each line, you can search
the processing history at the maximum ready time/minimum ready time of the task corresponding to
the clicked line.
The search result is pointed by the indicator in the MR Trace window after the indicator moves to the
destination position.
7.16.5.3 Refer the System Call Issuance History
Click the "System Call" button in the tool bar. (Or, select Menu - [System Call].)
The issued system calls are listed in chronological order of system call.
The data displayed is the statistical results for the range specified with the start marker and end
marker in the MR Trace window.
By clicking each line, you can search the system call issuance history corresponding to the clicked line.
The search result is pointed by the indicator in the MR Trace window after the indicator moves to the
destination position.
218
7 Windows/Dialogs
7.16.5.3.1.
Extract the Issuance History
Click the "Pick Up" button in the tool bar. (Or, select Menu - [Pick Up System Call...].)
The dialog shown below is opened. Specify the search condition of the system call to be extracted and
displayed.
Extract the issuance history of the system call which meets the specified condition and display it.
219
7.17 MR Task Pause Window
The MR Task Pause Window realizes the task pause function of the real time OS (MR308/MR30).
The debugger for 740 doesn't support this function.
You can pause and unpause the specified task from this window.
The window can be used only when the program containing the system of the MR308/MR30 for the
task pause functions and system clock timer is downloaded.
The MR30 task pause function is supported with MR30 V.3.00 or later. Previously installed target
programs cannot be used with this window.
•
•
The information (ID number, name, context PC value during "Pause") on all the tasks defined in
the configuration file when creating the target program is displayed in the task pause display
area. Select the target task for task pause from this display area.
The specified program content is displayed in the task source display area. When performing
"Come-pause", specify the stop position using the cursor in this display area.
7.17.1 About Task Pause Function
The task pause function is to pause/unpause only the specific task while executing the target system.
When using the task pause function, you can specify the specific task while executing all the other
tasks and interrupts.
Also, as debugging is available, such as "Come-pause" (pause at the location you specified), effective
debugging is provided without affection to peripheral devices controlled by tasks or interrupts.
The following lists terminology definitions used in this section.
•
PAUSE state
Indicates a state of the tasks that are stopped by the task pause function during execution of the
target program.
•
Pause
Indicates a process to make the specific task in the PAUSE state.
•
Unpause
Indicates a process to make the specific task out of the PAUSE state.
•
Come-pause
Indicates a process to pause the specific task at the specified address.
220
7 Windows/Dialogs
ATTENTION
Task pause function uses the address match interrupt of the MCU.
Don't use this function when the target program uses the address match interrupt.
If you use PC7501 emulator, this function is not available when you use address match inturrpt break
function.
7.17.2 Extended Menus
This window has the following popup menus that can be brought up by right-clicking in the window.
Menu
Task
Display
Mode
Layout
Function
Pause
Come-pause
Unpause
Source/Function...
Address...
Program Counter *
Source
Mixed
Disassembly
Line
Address
Code
Tab...
Toolbar display
Customize toolbar...
Allow Docking
Hide
Make the selected task in the PAUSE state.
Make the selected task in the PAUSE state just before executing
the code at the cursor in the program display view.
Make the selected task out of the PAUSE state.
Displays the begining of the specified file/function.
Displays the program from the specified address.
Displays the program from the current program counter value.
Switches the view to the source mode.
Switches the view to the mixed mode.
Switches the view to the disassembly mode.
Shows/Hides the line number column.
Shows/Hides the address number column.
Shows/Hides the line code column.
Changes Tab number.
Displays the toolbar.
Opens the toolbar customize dialog box.
Allows the window docking.
Hides the window.
*Operation in the MR task pause window is as follows when the program display location is changed
by PC position specification.
•
When the target task selected in the task pause display area is paused
-> Its display position is changed to the context PC position of the task.
•
When the target task selected in the task pause display area is in a state other than "pause"
-> The display position is not changed.
•
When the target task is selected from the task pause display area
-> The display position is changed to the position from the current program counter (in the same
manner as the operation in the Source window).
221
7.17.3 Pause the Specified Task
Use the MR Task Pause window.
To open the MR Task Pause window, select Menu - [View] -> [RTOS] -> [MR Task Pause].
1.
2.
Click the ID field or (name) field in the task pause display field of the task line to be paused.
After the target task is selected, the task ID number is displayed in the status bar.
If the selected task is in a state other than "Pause", the Pause button is enabled.
Click the Pause button. The task selected at this timing is paused. (This is enabled only when
the selected task is in the execution state.)
ATTENTION
You can pause the target task which is in the execution state only. If target task is in a state other
than execution, the pause process is terminated while the target task is not being paused. (If this
happens, an error dialog appears.)
If the timing at which the target task enters the execution state is hard to judge, use the task
Come-pause (a function to pause only the specific task at specified position).
222
7 Windows/Dialogs
7.17.3.1 Pause Task Being Executed at a Specified Position
1.
2.
3.
Click the ID field or (name) field of the task pause display field of the task line to be paused.
After the target task is selected the task ID number appears in the status bar.
In the task source display area, the program starting from the task start address is displayed (if
the program is in a state other than Pause).
Click the line to be paused in the task source display area. The Come-pause button and Pause
button are enabled.
Click the Come button. The selected task is paused at the position where the task is executed
immediately before the cursor position.
223
7.17.3.2 Pause After a Paused Task is Executed up to Specified Position
1.
2.
3.
Click the ID field or (name)field of the task pause display area of the target task.
After the target task is selected, the task ID number is displayed in the status bar.
In the task source display area, the program starting from the task's Pause position (context PC
position) is displayed (if the program is in a state other than Pause).
Click the line to be paused in the task source display area. The Come-pause button and the
Pause button are enabled.
Click the Come button. The selected task is released from the PAUSE state temporarily. The
task is executed immediately before the cursor and then it gets paused again.
ATTENTION
When executing Come-pause, be sure to specify the cursor position at a position where the target task
is passing during execution.
If the cursor is set not at the position described above but at an inappropriate position, the system
does not operate normally, and, in some cases, the command process may never terminate. (Because
the debugger has no means to judge whether the cursor position is correct or not, and it merely
continues waiting until the target task executes the cursor position.)
If this happens, click the Stop button in the following dialog which appears during execution of
Come-pause to stop the command processing.
224
7 Windows/Dialogs
7.17.3.3 Turn Pause of Certain Task Off
1.
2.
Click the ID field or (name) field in the task pause display area of the ask line to be released
from the PAUSE state. After the target task is selected, the task ID number is displayed in the
status bar. The Unpause button is enabled (if the task is paused).
Click the Unpause button. The selected task is released from the PAUSE state.
225
7.17.3.4 Display Program Contents of Certain Task in Task Source Display Area
Click the ID field of (name) field in the task pause display area of the ask line to be displayed.
If the target task is paused, the task Pause position (context PC position) is displayed.
If the target task is in a state other than Pause, the task start address is displayed.
You can also use the View button and View menu to display any position.
226
7 Windows/Dialogs
7.18 Task Trace Window
The Task Trace window measures the task execution history of a program using the real time OS and
display it graphically.
This window is available even when a target program using an OS other than our real time OS
(MRxx) is downloaded.
The content of each item is as follows.
Items
Contents
ID
(name)
Indicates a task ID number.
Indicates an interrupt routine name, task name, idle processing (display "idle"),
and unknown name(displayed "unknown").
When moving the mouse to the information displayed in the window, the pop up window as below is
opened, showing the detailed information.
The following information is displayed in the status bar.
•
•
•
•
•
•
•
Time value at the start marker position
Time value at the end marker position
Time interval between the start marker and the end marker
Time value at the indicator position
Display scale
Time width at grid line interval
Measurement (trace) range
227
The grid lines are displayed using the start marker as the radix point.
The scale is displayed, using the time at which the start marker is positioned as 0, with the left
(forward in time) set to "minus" and the right (backward in time) set to "plus".
The grid lines allow you to roughly understand the interrupt occurrence cycle and process time.
The interval time width of the displayed grid lines appears in the "Grid" area of the status bar.
The time value in the Task Trace window means the execution elapsed time using the program
execution start time as 0 in all the cases.
On the contrary, the numeric value above the grid lines (scale) in the Task Trace window is a relative
value using the start marker as 0 (the grid interval is specified in the Value dialog). It has nothing to
do with the time value. (This is provided so that you can see the window easily.)
7.18.1 Extended Menus
This window has the following popup menus that can be brought up by right-clicking in the window.
Menu
Function
Start Marker
End Marker
Indicator
Adjust
Move the start marker in the display area.
Move the end marker in the display area.
Move the indicator in the display area.
Adjust range of start and end marker to full width of display area
Adjust.
Increase scale factor of display.
Decrease scale factor of display.
Stop measuring.
Restarts measuring.
Set measurement range condition to After.
Set measurement range condition to Break.
Set value.
Change display color.
Set target RTOS information.
Displays the toolbar.
Opens the toolbar customize dialog box.
Allows the window docking.
Hides the window.
Expand
Reduce
Trace Stop
Trace Restart
Trace Range
Value...
Color...
RTOS...
Toolbar display
Customize toolbar...
Allow Docking
Hide
After
Break
228
7 Windows/Dialogs
7.18.2 Refer the Execution History of Task(Taskxx Window)
You can reference the task execution history in the Task Trace window.
You can reference the execution history statistical processing result in the Task Analyze window.
These windows are also available for a target program using an OS other than our real time OS
(MRxx).
7.18.2.1 Prepare the Measurement
To measure the task execution history of the program using the real time OS, you must select the
trace range in the Task Trace window and then execute the target program.
7.18.2.1.1.
Set the Information of Realtime OS.
To use the Task Trace window, you must set the following information concerning the real time OS
(the target real time OS) which are used by the downloaded program.
•
•
Label name (address value) of the execution task ID storage area and its size
Task start address expression
Open the Task Trace window. Select Menu - [View] -> [RTOS] -> [Task Trace].
When you select this menu at first time after starting PDxx, the RTOS Information dialog is opened
before the Task Trace window is opened.
•
1.
2.
When using our real time OS (MRxx)
Click the "default" button. The MRxx information is set.
Click the OK button. The Task Trace window is opened.
•
1.
When using a real time OS other than MRxx
Specify the label (address is also available) of the execution task ID storage area in the PID
Address field ; specify the size of the execution task ID storage area in the Size list box.
If this information is not set correctly, you cannot use the Task Trace window.
Specify the task start address expression in the Task Entry field.
Describe the expression in the format in accordance with the description rules.
Use a macro variable [% TaskID] in the address where the task ID number is supposed to assign.
If this information is not set correctly, the task name is not displayed in the Task Trace window.
Click the OK button. The Task Trace window is opened.
2.
3.
On debuger for 740, simply by clicking the default button, the OSEK OS information is set.
Once the real time OS information is set in this dialog, the information becomes effective from the
next time.
To change the setting data, select [RTOS...] from popup menu by right-clicking on the window. The
RTOS Information dialog is re-opened.
229
ATTENTION
When specifying WORD in the access size when performing PID setting in the RTOS Information
dialog, you must observe the following limits. (If these conditions are not met, the system does not
operate normally.)
•
The PID information storage area is allocated to an even address.
•
The PID information storage area is allocated to an area accessed with 16-bit bus width.
7.18.2.1.2.
Select the Trace Range
The real time trace function is used for task execution history measurement.
Click the After button (or select [After] from popup menu by right-clicking on the window) or Break
button (or or select [Break] from popup menu) in the Task Trace window.
After
Break
Records a task execution history until the trace memory is filled with recorded data.
Records a task execution history (as much as trace memory available) until before
the target program stops.
Only an specific cycle required to know the task execution history is recorded in the trace memory.
ATTENTION
A trace point set in the Trace Point Setting dialog is disabled.
7.18.2.1.3.
Start the Target Program
Execute the target program. Record the information required to know the task execution history in
the trace memory.
When you select After for the trace range, the execution history is displayed in the Task Trace
window immediately after the trace memory is filled or immediately after the target program stops.
When you select Break for the trace range, the execution history is displayed in the Task Trace
window immediately after the target program stops.
You can stop task execution history measurement.
To do this, click the Stop button in the Task Trace window. (Or, select [Trace Stop] from popup menu
by right-clicking on the window.)
To restart task execution history measurement, click the Restart button in the Task Trace window.
(Or, select [Trace Restart] from popup menu by right-clicking on the window.)
230
7 Windows/Dialogs
7.18.2.2 Refer the Execution History of Task
You can reference task trace transition in the Task Trace window.
By moving the mouse to the information displayed in the window, a window of the following example
is opened, showing the detailed information.
7.18.2.2.1.
Change the display magnification
Click the Expand button or Reduce button in the tool bar. (Or, select [Expand] or [Reduce] from popup
menu by right-clicking on the window.)
The display is expanded or reduced using the left corner of the graph area as the radix point. By
default, the display is expanded or reduced with display scale of 1.5.
The display scale appears in the "Scale:*" field in the status bar.
The default expansion/reduction scale is 1.5. To change the scale, select [Value ...] from popup menu
by right-clicking on the window. The Value dialog is opened. Specify the display expansion/reduction
scale.
231
7.18.2.2.2.
Change the grid line display interval
Select [Value ...] from popup menu by right-clicking on the window. The Value dialog is opened.
Specify the time interval in the display.
7.18.2.2.3.
Change the task display order
Select [Color ...] from popup menu by right-clicking on the window. The Color dialog is opened.
Click the button corresponding to the desired item. The Color Setting dialog is opened. Change the
display color in the dialog.
232
7 Windows/Dialogs
7.18.2.3 Measure the Execution Time of Task
By changing the start marker position and end marker position in the Task Trace window, you can
measure the execution time between the markers.
Drag the start marker position and end marker position.
The time interval between the markers is displayed in the status bar.
Note
Definition of time value in the Task Trace window
The time value in the Task Trace window indicates the execution elapsed time which sets the
program execution start point to 0 in all the cases.
On the contrary, a numeric value above the grid line (scale) in the Task Trace window is a relative
value which sets the start marker to 0 (the grid interval is specified in the Value dialog), which has
nothing to do with the time value. (It is provided so that you can see the window easily.)
7.18.2.3.1.
Move the Marker
Each marker can be moved by dragging. When moving the mouse on the marker, the cursor shape
changes. Then, start dragging.
The start marker moves into the window (left portion) by clicking the Start Marker button in the tool
bar. (Or, select [Start Marker] from popup menu by right-clicking on the window.)
The end marker moves into the window (right portion) by clicking the End Marker button. (Or, select
[End Marker] from popup menu.)
The indicator moves into the window (center) by clicking the "Indicator" button. (Or, select [Indicator]
from popup menu.)
Note that each marker can move only to the point where an event is established.
233
7.19 Task Analyze Window
The Task Analyze window displays the result of the measurement data statistically analyzed within
the range specified by the start marker and the end marker in the Task Trace window.
The Task Analyze window displays the CPU occupation state.
The Task Analyze window functions together with the Task Trace window.
This window is available even when a target program using an OS other than our real time OS
(MRxx) is downloaded.
The CPU occupation state display mode is used to display the CPU occupation time and ratio by task.
This mode shows the statistical result within the range specified by the start marker and end marker
in the Task Trace window.
By clicking the maximum execution time/minimum execution time display area of each line, you can
search process history of the task for the clicked line at the maximum/minimum execution time.
The search result is pointed by the indicator which moves to the target position in the Task Trace
window.
7.19.1 Extended Menus
This window has the following popup menus that can be brought up by right-clicking in the window.
Menu
Allow Docking
Hide
Function
Allows the window docking.
Hides the window.
234
7 Windows/Dialogs
7.19.2 Analyze the Execution History of Task
You can reference the execution history statistical processing in the Task Analyze window. This
window shows the CPU occupation time and ratio by task.
The Task Analyze window functions together with the Task Trace window. If the Task Trace window
is not open, or the Task Trace window does not show any data, the Task Analyze window will not
function.
The displayed data is the statistical results of the range specified by the start marker and the end
marker in the Task Trace window.
By clicking the maximum ready time/minimum ready time display field of each line, you can search
the processing history at the maximum ready time/minimum ready time of the task corresponding to
the clicked line.
The search result is pointed by the indicator in the Task Trace window after the indicator moves to
the destination position.
235
8.
Table of Script Commands
The following script commands are prepared.
The commands with yellow color displaying can be executed at run time.
The command to which "*" adheres behind is not supported according to the product.
8.1 Table of Script Commands (classified by function)
8.1.1 Execution Commands
Command Name
Short Name
Contents
Go
GoFree
GoProgramBreak*
GoBreakAt*
Stop
Status
Step
StepInstruction
OverStep
OverStepInstruaction
Return
ReturnInstruction
Reset
Time
G
GF
GPB
GBA
S
SI
O
OI
RET
RETI
-
Program execution with breakpoints
Free run program execution
Run target program with software break point
Run target program with software break point
Stops program execution
Checks the operating status of the MCU
Halts for user input until the specified time has elapsed
Step execution of instructions
Overstep execution of source lines
Overstep execution of instructions
Executes a source line return
Executes an instruction return
Resets the target MCU
Sets the run time display and checks the current setting
8.1.2 File Operation Commands
Command Name
Load
LoadHex
LoadMot*
LoadSymbol
LoadIeee*
Reload
UploadHex
UploadMot*
Short Name
L
LH
LM
LS
LI
UH
UM
Contents
Downloads the target program
Downloads an Intel HEX-format file
Downloads a Motorola S-format file
Loads source line/ASM symbol information
Downloads IEEE-695 absolute-format files
Re-downloads the target program
Outputs data to an Intel HEX-format file
Outputs data to a Motorola S-format file
236
8 Table of Script Commands
8.1.3 Register Operation Commands
Command Name
Short Name
Contents
Register
R
Checks and sets a register value
8.1.4 Memory Operation Commands
Command Name
Short Name
Contents
DumpByte
DumpWord*
DumpLword*
SetMemoryByte
SetMemoryWord*
SetMemoryLword*
FillByte
FillWord*
FillLword*
Move
MoveWord*
DB
DW
DL
MB
MW
ML
FB
FW
FL
MOVEW
Displays the contents of memory (in 1-byte units)
Displays the contents of memory (in 2-byte units)
Displays the contents of memory (in 4-byte units)
Checks and changes memory contents (in 1-byte units)
Checks and changes memory contents (in 2-byte units)
Checks and changes memory contents (in 4-byte units)
Fills a memory block with the specified data (in 1-byte units)
Fills a memory block with the specified data (in 2-byte units)
Fills a memory block with the specified data (in 4-byte units)
Moves memory blocks
Moves memory blocks(in 2-byte units)
8.1.5 Assemble/Disassemble Commands
Command Name
Assemble
DisAssemble
Module
Scope
Section
Bit*
Symbol
Label
Express
Short Name
A
DA
MOD
SEC
SYM
EXP
Contents
Line-by-line assembly
Disassembles memory contents line by line
Displays modules names
Sets and checks the effective local symbol scope
Checks section information
Checks and sets bit symbols
Checks assembler symbols
Checks assembler labels
Displays an assembler expression
8.1.6 Software Break Setting Commands
Command Name
Short Name
Contents
SoftwareBreak
SoftwareBreakClear
SoftwareBreakClearAll
SoftwareBreakDisable
SoftwareBreakDisableAll
SoftwareBreakEnable
SoftwareBreakEnableAll
BreakAt
BreakIn
SB
SBC
SBCA
SBD
SBDA
SBE
SBEA
-
Sets and checks software breaks
Clears software breaks
Clears all software breaks
Disables software breakpoints
Disables all software breaks
Enables software breakpoints
Enables all software breaks
Sets a software breakpoint by specifying a line No.
Sets a software breakpoint by specifying a function
237
8.1.7 Hardware Break Setting Commands
Command Name
Short Name
Contents
HardwareBreak
Protect
BreakMode
HB
PT
BM
Sets and checks a hardware break
Sets and checks protect breaks
Sets and checks hardware break mode
8.1.8 Real-time Trace Commands
Command Name
TracePoint
TraceData*
TraceList*
Short Name
TP
TD
TL
Contents
Sets and checks a trace points
Realtime trace data display
Displays disassembled realtime trace data
8.1.9 Coverage Measurement Commands
Command Name
Coverage
Short Name
CV
Contents
Specifies and displays coverage measurement
8.1.10 Script/Log File Commands
Command Name
Script
Exit
Wait
Pause
Sleep
Logon
Logoff
Exec
Short Name
-
Contents
Opens and executes a script file
Exits the script file
Waits for an event to occur before command input
Waits for user input
Halts for user input until the specified time has elapsed
Outputs the screen display to a log file
Stops the output of the screen display to a log file
Executes external application
8.1.11 Program Display Commands
Command Name
Func
Up*
Down*
Where*
Path
AddPath
File
Short Name
-
Contents
Checks function names and displays the contents of functions
Displays the calling function
Displays a called function
Displays a function call status
Sets and checks the search path
Adds the search path
Checks a filename and displays the contents of that file
238
8 Table of Script Commands
8.1.12 Map Commands
Command Name
Short Name
Contents
Map*
-
Checks and sets mapping data
8.1.13 Clock Command
Command Name
Short Name
Contents
Clock
CLK
Checks and changes the clock
8.1.14 WatchDog Timer Commands
Command Name
Short Name
Contents
WatchDogTimer*
WDT
Sets and checks the usage condition of the watchdog timer
8.1.15 C Language Debugging Commands
Command Name
Short Name
Contents
Print
Set
-
Check value of specified C variable expression
Set specified data in specified C variable expression
8.1.16 Real-time OS Command
Command Name
MR*
Short Name
-
Contents
Displays status of realtime OS (MRxx)
8.1.17 Utility Commands
Command Name
Radix
Alias
UnAlias
UnAliasAll
Version
Date
Echo
CD
Short Name
VER
-
Contents
Sets and checks the radix for numerical input
Specifies and checks command alias definitions
Cancels the alias defined for a command
Cancels all aliases defined for commands
Displays the version No.
Displays the date
Displays messages
Window open
239
8.2 Table of Script Commands (alphabetical order)
Command Name
Short Name
Contents
AddPath
Alias
Assemble
Bit*
BreakAt
BreakIn
BreakMode
CD
Clock
Coverage
Date
DisAssemble
Down*
DumpByte
DumpLword*
DumpWord*
Echo
Exec
Exit
Express
File
FillByte
A
BM
CLK
CV
DA
DB
DL
DW
EXP
FB
FillLword*
FL
FillWord*
FW
Func
-
Go
GoBreakAt*
GoFree
GoProgramBreak*
HardwareBreak
Label
Load
LoadHex
LoadIeee*
LoadMot*
LoadSymbol
Logoff
Logon
Map*
Module
Move
MoveWord*
MR*
OverStep
OverStepInstruaction
G
GBA
GF
GPB
HB
L
LH
LI
LM
LS
MOD
MOVEW
O
OI
Adds the search path
Specifies and checks command alias definitions
Line-by-line assembly
Checks and sets bit symbols
Sets a software breakpoint by specifying a line No.
Sets a software breakpoint by specifying a function
Sets and checks hardware break mode
Specifies and checks the current directory
Checks and changes the clock
Specifies and displays coverage measurement
Displays the date
Disassembles memory contents line by line
Displays a called function
Displays the contents of memory (in 1-byte units)
Displays the contents of memory (in 4-byte units)
Displays the contents of memory (in 2-byte units)
Displays messages
Executes external application
Exits the script file
Displays an assembler expression
Checks a filename and displays the contents of that file
Fills a memory block with the specified data (in 1-byte
units)
Fills a memory block with the specified data (in 4-byte
units)
Fills a memory block with the specified data (in 2-byte
units)
Checks function names and displays the contents of
functions
Program execution with breakpoints
Run target program with software break point
Free run program execution
Run target program with software break point
Sets and checks a hardware break
Checks assembler labels
Downloads the target program
Downloads an Intel HEX-format file
Downloads IEEE-695 absolute-format files
Downloads a Motorola S-format file
Loads source line/ASM symbol information
Stops the output of the screen display to a log file
Outputs the screen display to a log file
Checks and sets mapping data
Displays modules names
Moves memory blocks
Moves memory blocks(in 2-byte units)
Displays status of realtime OS (MRxx)
Overstep execution of source lines
Overstep execution of instructions
240
8 Table of Script Commands
Path
Pause
Print
Protect
Radix
Register
Reload
Reset
Return
ReturnInstruction
Scope
Script
Section
Set
SetMemoryByte
SetMemoryLword*
SetMemoryWord*
Sleep
SoftwareBreak
SoftwareBreakClear
SoftwareBreakClearAll
SoftwareBreakDisable
SoftwareBreakDisableAll
SoftwareBreakEnable
SoftwareBreakEnableAll
Status
Step
StepInstruction
Stop
Symbol
Time
TraceData*
TraceList*
TracePoint
UnAlias
UnAliasAll
Up*
UploadHex
UploadMot*
Version
Wait
WatchDogTimer*
Where*
PT
R
RET
RETI
SEC
MB
ML
MW
SB
SBC
SBCA
SBD
SBDA
SBE
SBEA
S
SI
SYM
TD
TL
TP
UH
UM
VER
WDT
-
Sets and checks the search path
Waits for user input
Check value of specified C variable expression.
Sets and checks protect breaks
Sets and checks the radix for numerical input
Checks and sets a register value
Re-downloads the target program
Resets the target MCU
Executes a source line return
Executes an instruction return
Sets and checks the effective local symbol scope
Opens and executes a script file
Checks section information
Set specified data in specified C variable expression
Checks and changes memory contents (in 1-byte units)
Checks and changes memory contents (in 4-byte units)
Checks and changes memory contents (in 2-byte units)
Halts for user input until the specified time has elapsed
Sets and checks software breaks
Clears software breaks
Clears software breaks
Disables software breakpoints
Disables all software breaks
Enables software breakpoints
Enables all software breaks
Checks the operating status of the MCU
Step execution of source line
Step execution of instructions
Stops program execution
Checks assembler symbols
Sets the run time display and checks the current setting
Realtime trace data display
Displays disassembled realtime trace data
Sets and checks a trace points
Cancels the alias defined for a command
Cancels all aliases defined for commands
Displays the calling function
Outputs data to an Intel HEX-format file
Outputs data to a Motorola S-format file
Displays the version No.
Waits for an event to occur before command input
Sets and checks the usage condition of the watchdog timer
Displays a function call status
241
9.
Writing Script Files
This debugger allows you to run script files in a Script Window. The script file contains the controls
necessary for automatically executing the script commands.
9.1 Structural Elements of a Script File
You can include the following in script files:
•
Script commands
•
Assign statements
•
Conditional statements (if, else, endi)
Program execution branches to the statement(s) to be executed according to the result of the
conditional expression.
•
Loop statements (while, endw)
A block of one or more statements is repeatedly executed according to the expression.
•
break statement
Exits from the innermost loop.
•
Comment statements
You can include comments in a script file. The comment statements are ignored when the script
commands are executed.
Specify only one statement on each line of the script file. You cannot specify more than one statement
on a line, or write statements that span two or more lines.
Notes
•
•
•
•
•
•
•
You cannot include comments on the same lines as script commands.
You can nest script files up to five levels.
You can nest if statements and while statements up to 32 levels.
If statements must be paired with endi statements, and while statements with endw statements
in each script file.
Expressions included in script files are evaluated as unsigned types. Therefore, operation cannot
be guaranteed if you use negative values for comparison in if or while statements.
You can specify up to 4096 characters per line. An error occurs if a line exceeds this number of
characters.
When a script file containing illegal commands is automatically executed (when you select
[ Option ] -> [Script]-> [ Run ] from the Script Window menu after opening a script file, or click
the button in the Script Window), execution of the script file continues even after the error is
detected, except when the script line itself cannot be read. If an error is detected and the script
file continues to be executed, operation after detection of the error cannot be guaranteed.
Reliability cannot therefore be placed on the results of execution after an error has been detected.
242
9 Writing Script Files
9.1.1 Script Command
You can use the same script commands that you enter in the Script Window. You can also call script
files from within other script files (nesting up to 10 levels).
9.1.2 Assign Statement
Assign statement s define and initialize macro variables and assign values. The following shows the
format to be used.
%macro-variable = expression
•
•
•
•
You can use alphanumerics and the underscore (_) in macro variable names. However , you
cannot use a numeric to start a macro variable name.
You can specify any expression of which the value is an integer between 0h and FFFFFFFFh to
be assigned in a macro variable. If you specify a negative number, it is processed as twos
complement.
You can use macro variables within the expression.
Always precede macro variables with the "%" sign.
9.1.3 Conditional Statement
In a conditional statement, different statements are executed according to whether the condition is
true or false. The following shows the format to be used.
if ( expression )
statement 1
else
statement 2
endi
•
•
•
If the expression is t rue (other than 0), statement 1 is executed. If false, (0), statement 2 is
executed.
You can omit the else statement. If omitted and the expression is false, execution jumps to the
line after the endi statement.
if statements can be nested (up to 32 levels).
243
9.1.4 Loop Statement(while,endw) and Break Statement
In loop statements, execution of a group of statements is repeated while the expression is true. The
following shows the format to be used.
while ( expression )
statement
endw
•
•
•
If the expression is t rue, the group of statements is repeated. If false, the loop is exited (and the
statement following the endw statement is executed).
You can nest while statements up to 32 levels.
Use the break statement to forcibly exit a while loop. If while statements are nested, break exits
from the inner most loop.
9.1.5 Comment statements
You can include comments in a script file. Use the following format.
;character string
•
•
Write the statement after a semicolon (;). You can include only spaces and tabs in front of the
semicolon
Lines with comment statements are ignored when the script file is executed.
244
9 Writing Script Files
9.2 Writing Expressions
This debugger allows you to use expressions for specifying addresses, data, and number of passes, etc.
The following shows example commands using expressions.
>DumpByte TABLE1
>DumpByte TABLE1+20
You can use the following elements in expressions:
•
Constants
•
Symbols and labels
•
Macro variables
•
Register variables
•
Memory variables
•
Line Nos.
•
Character constants
•
Operators
9.2.1 Constants
You can use binary, octal, decimal, or hexadecimals. The prefix or suffix symbol attached to the
numerical value indicates which radix is used.
The debugger for M32C and M16C/R8C and 740
Prefix
Suffix
Examples
Hexadecimal
Decimal
Octal
Binary *
0x,0X
h,H
0xAB24
AB24h
@
None
@1234
None
o,O
1234o
%
b,B
%10010
10010b
*You can only specify % when the predetermined radix is hexadecimal.
•
If you are inputting a radix that matches the predetermined radix, you can omit the symbol that
indicates the radix (excluding binary).
•
Use the RADIX command to set the predetermined value of a radix. However, in the cases shown
below, the radix is fixed regardless of what you specify in a RADIX command.
Type
Address
Line No.
No. of executions
No. of passes
245
Radix
Hex
Dec
9.2.2 Symbols and labels
You can include symbols and labels defined in your target program, or symbols and labels defined
using the Assemble command.
•
You can include alphanumerics, the underscore (_), period (.), and question mark (?) in symbols
and labels. However, do not start with a numeric.
•
Symbols and labels can consist of up to 255 characters.
•
Uppercase and lowercase letters are unique.
Product Name
Notes
The debugger for M32R,
The debugger for M32C,
The debugger for M16C/R8C,
•
•
The debugger for 740
•
•
•
You cannot include the assembler structured instructions,
pseudo instructions, macro instructions, operation code, or
reserved words (.SECTION, .BYTE, switch, if, etc.).
You cannot use strings that start with two periods (..) for
symbols or labels.
You cannot use the register name.(A,X,Y,S,PC,PS,P)
You cannot include the assembler structured instructions,
pseudo instructions, macro instructions, operation code, or
reserved words (.SECTION, .BYTE, switch, if, etc.).
You cannot use strings that start with two periods (..) for
symbols or labels.
.D0 to .D65535, .F0 to .F65535, .I0 to .I56635, .S0
to .S65535, ..0 to ..65535, ??0 to ??65535
9.2.2.1 Local label symbol and scope
This debugger supports both global label symbols, which can be referenced from the whole program
area, and local label symbols, which can only be referenced within the file in which they are declared.
The effective range of local label symbols is known as the scope, which is measured in units of object
files. The scope is switched in this debugger in the following circumstances:
•
When a command is entered
The object file that includes the address indicated by the program counter becomes the current
scope. When the SCOPE command is used to set the scope, the specified scope is the active scope.
•
During command execution
The current scope automatically switches depending on the program address being handled by
the command.
246
9 Writing Script Files
9.2.2.2 Priority levels of labels and symbols
The conversion of values to labels or symbols, and vice versa, is subject to the following levels of
priority:
•
Conversion of address values
1. Local labels
2. Global labels
3.
Local symbols
4. Global symbols
5. Local labels outside scope
6. Local symbols outside scope
•
1.
2.
3.
4.
5.
6.
Conversion of data values
Local symbols
Global symbols
Local labels
Global labels
Local symbols outside scope
Local labels outside scope
•
1.
2.
3.
Conversion of bit values
Local bit symbols
Global bit symbols
Local bit symbols outside scope
9.2.3 Macro Variables
Macro variables are defined by assign statements in the script file. See Section "9.1.2 Assign
Statement" in the Reference part for details. Precede variables with '%' for use as macro variables.
•
You can specify alphanumerics and/or the underbar (_) in the variable name following the percent
sign (%). However , do not star t the names with a numeric.
•
You cannot use the names of registers as variable names.
•
Uppercase and lowercase letters are differentiated in variable names.
•
You can define a maximum of 32 macro variables. Once defined, a macro variable remains valid
until you quit the debugger.
Macro variables are useful for specifying the number of iterations of the while statement.
247
9.2.4 Register variables
Register variables are used for using the values of registers in an expression. Precede the name of the
register with '%' to use it as a register variable. Use the following format. (The debugger for 740 can
use '_' instead of '%'. )
Product Name
Register name
The debugger for M32C
PC, USP, ISP, INTB, FLB, SVF, SVP, VCT,
DMD0,DMD1, DCT0, DCT1, DRC0, DRC1,
DMA0,DMA1, DCA0, DCA1, DRA0, DRA1,
0R0, 0R1, 0R2, 0R3, 0A0, 0A1, 0FB, 0SB <- Bank 0 Register
1R0, 1R1, 1R2, 1R3, 1A0, 1A1, 1FB, 1SB <- Bank 1 Register
PC, USP, ISP, SB, INTB, FLG
0R0, 0R1, 0R2, 0R3, 0A0, 0A1, 0FB <- Bank 0 Register
1R0, 1R1, 1R2, 1R3, 1A0, 1A1, 1FB <- Bank 1 Register
PC, A, X, Y, S, PS
The debugger for M16C/R8C
The debugger for 740
Uppercase and lowercase letters are not unique in register names. You can specify either.
9.2.5 Memory variables
Use memory variables to use memory values in expressions. The format is as follows:
[Address].data-size
•
You can specify expressions in addresses (you can also specify memory variables).
•
The data size is specified as shown in the following table. (The debugger for 740 doesn't support
four byte length.)
data Length
Debugger
Specification
1 Byte
2 Bytes
All
The debugger for M32R
Other
The debugger for M32R
The debugger for M32R, M16C/R8C
B or b
H or h
W or w
W or w
L or l
4 bytes
Example: Referencing the contents of memory at address 8000h in 2 bytes
[0x8000].W
•
The default data size is word, if not specified.
9.2.6 Line Nos.
These are source file line Nos. The format for line Nos. is as follows:
#line_no
#line_no."source file name"
•
•
•
•
•
Specify line Nos. in decimal.
You can only specify line Nos. in which software breaks can be set. You cannot specify lines in
which no assembler instructions have been generated, including comment lines and blank lines.
If you omit the name of the source file, the line Nos. apply to the source file displayed in active
Editor(Source) Window.
Include the file attribute in the name of the source file.
Do not include any spaces between the line No. and name of the source file.
248
9 Writing Script Files
9.2.7 Character constants
The specified character or character string is converted into ASCII code and processed as a constant.
•
Enclose characters in single quote marks.
•
Enclose character strings in double quote marks.
•
The character string must consist of one or two characters (16 bits max.). If more than two
characters are specified, the last two characters of the string are processed. For example, "ABCD"
would be processed as "CD", or value 4344h.
9.2.8 Operators
The table below lists the operators that you can use in expressions.
•
The priority of operators is indicated by the level, level 1 being the highest and level 8 the lowest.
If two or more operators have the same level of priority, they are evaluated in order from the left
of the expression.
Operator
Function
Priority level
()
+, -, ~
Brackets
Monadic
positive,
monadic
negative, monadic logical NOT
Dyadic multiply, dyadic divide
Dyadic add, dyadic subtract
Right shift, left shift
Dyadic logical AND
Dyadic logical OR, dyadic
exclusive OR
Dyadic comparison
level 1
level 2
*, /
+, >>,
&
|, ^
<, <=, >, >=, ==, !=
249
level 3
level 4
level 5
level 6
level 7
level 8
10. C/C++ Expressions
10.1 Writing C/C++ Expressions
You can use C/C++ expressions consisting of the tokens shown below for registering C watchpoints
and for specifying the values to be assigned to C watchpoints.
Token
Example
Immediate values
Scope
Mathematical operators
Pointers
Reference
Sign inversion
Member reference using dot operator
Member reference using arrow
Pointers to Members
Parentheses
Arrays
Casting to basic types
Casting to typedef types
Variable names and function names
Character constants
Character string literals
10, 0x0a, 012, 1.12, 1.0E+3
::name, classname::member
+, -, *, /
*, **, ...
&
Object.Member
Pointer->Member, this->Member
Object.*var, Pointer->*var
(, )
Array[2], DArray[2] [3] , ...
(int), (char*), (unsigned long *), ...
(DWORD), (ENUM), ...
var, i, j, func, ...
'A', 'b', ...
"abcdef", "I am a boy.", ...
10.1.1 Immediate Values
You can use hexadecimals, decimals, octals as immediate values. Values starting with 0x are
processed as hexadecimals, those with 0 as octals, and those without either prefix as decimals.
Floating-point numbers can also be used to assign values to variables.
Notes
•
•
You cannot register only immediate values as C watchpoints.
The immediate value is effective only when it is used in C/C++ language expressions that specify
C/C++ watchpoints or when it is used to specify the value to be assigned to those expressions.
When using floating-point numbers, operation cannot be performed on an expression like 1.0+2.0.
250
10 C/C++ Expressions
10.1.2 Scope Resolution
The scope resolution operator :: is available as following.
Global scope: ::valiable name
::x, ::val
Class scope: class name::member name, class name::class name::member name, e.g.
T::member, A::B::member
10.1.3 Mathematical Operators
You can use the addition (+), subtraction (-), multiplication (*), and division (/) mathematical
operators. The following shows the order of priority in which they are evaluated.
(*), (/), (+), (-)
Notes
•
There is no support currently for mathematical operators for floating point numbers.
10.1.4 Pointers
Pointers are indicated by the asterisk (*). You can use pointer to pointers **, and pointer to pointer to
pointers ***, etc.
Examples: "*variable_name", "**variable_name", etc.
Notes
•
Immediate values cannot be processed as pointers. That is, you cannot specify *0xE000, for
example.
10.1.5 Reference
References are indicated by the ampersand (&). You can only specify "&variable_name".
251
10.1.6 Sign Inversion
Sign inversion is indicated by the minus sign (-). You can only specify "-immediate_value" or
"-variable_name". No sign inversion is performed if you specify 2 (or any even number of) minus signs.
Notes
•
There is no support currently for sign inversion of floating point numbers.
10.1.7 Member Reference Using Dot Operator
You can only use "variable_name.member_name" for checking the members of structures and unions
using the dot operator.
Example:
class T {
public:
int member1;
char member2;
};
class T t_cls;
class T *pt_cls = &t_cls;
In this case, t_cls.member1, (*pt_cls).member2 correctly checks the members.
10.1.8 Member Reference Using Arrow
You can only use "variable_name->member_name" for checking the members of structures and unions
using the arrow.
Example:
class T {
public:
int member1;
char member2;
};
class T t_cls;
class T *pt_cls = &t_cls;
In this case, (&t_cls)->member1, pt_cls->member2 correctly checks the members.
252
10 C/C++ Expressions
10.1.9 Pointers to Members
Pointers to members using the ".*" or "->*" operator can be refered only in the forms of variable
name .* member name or variable name ->* member name.
Example:
class T {
public:
int member;
};
class T t_cls;
class T *pt_cls = &t_cls;
int T::*mp = &T::member;
In this case, t_cls.*mp and tp_cls->*mp can correctly reference the variable of pointer-to-member type.
Note
•
Note that the expression *mp cannot considered as the variable of pointer-to-member type.
10.1.10 Parentheses
Use the '(' and ')' to specify priority of calculation within an expression.
10.1.11 Arrays
You can use the ' [ ' and ' ] ' to specify the elements of an array. You can code arrays as follows:
"variable_name [ (element_No or variable) ] ", "variable_name [ (element_No or variable) ]
[ (element_No or variable) ] ", etc.
10.1.12 Casting to Basic Types
You can cast to C basic types char, short, int, and long, and cast to the pointer types to these basic
types. When casting to a pointer type, you can also use pointers to pointers and pointers to pointers to
pointers, etc.
Note that if signed or unsigned is not specified, the default values are as follows:
Basic type
char
short
int
long
Default
unsigned
signed
signed
signed
Notes
•
•
Of the basic types of C++, casts to bool type, wchar_t type, and floating-point type (float or
double) cannot be used.
Casts to register variables cannot be used.
253
10.1.13 Casting to typedef Types
You can use casting to typedef types (types other than the C basic types) and the pointer types to
them. When casting to a pointer type, you can also use pointers to pointers and pointers to pointers to
pointers, etc.
Notes
•
You cannot cast to struct or union types or the pointers to those types.
10.1.14 Variable Name
Variable names that begin with English alphabets as required
under C/C++ conventions can be used.
The maximum number of characters for variable name is 255.
And 'this' pointer is available.
10.1.15 Function Name
Function names that begin with English alphabets as required
under C conventions can be used.
In the case of C++, no function names can be used.
10.1.16 Character Constants
You can use characters enclosed in single quote marks (') as character constants. For example, 'A', 'b' ,
etc. These character constants are converted to ASCII code and used as 1-byte immediate values.
Notes
•
•
You cannot register character constants only as C watchpoints.
Character constants are valid only when used in a C/C++ expression that specifies a C
watchpoint, and when specifying a value to be assigned (character constants are processed in the
same manner as immediate values).
10.1.17 Character String Literals
You can use character strings enclosed in double quote marks (") as character string literals.
Examples are "abcde", "I am a boy.", etc.
Notes
•
Character string literals can only be placed on the right side of an assignment operator in an
expression. They can only be used when the left side of the assignment operator is a char array or
a char pointer type. In all other cases, a syntax error results.
254
10 C/C++ Expressions
10.2 Display Format of C/C++ Expressions
C/C++ expressions in the data display areas of the C Watch Windows are displayed as their type
name, C/C++ expression (variable name), and result of calculation (value), as shown below.
The following describes the display formats of the respective types.
10.2.1 Enumeration Types
•
•
When the result (value) of calculation has been defined, its name is displayed.
(DATE) date = Sunday(all Radices)_
If the result (value) of calculation has not been defined, it is displayed as follows:
(DATE) date = 16 (when Radix is in initial state)
(DATE) date = 0x10(when Radix is hex)
(DATE) date = 0000000000010000B(when Radix is binary)
10.2.2 Basic Types
•
•
•
When the result of calculation is a basic type other than a char type or floating point type, it is
displayed as follows:
(unsigned int) i = 65280(when Radix is in initial state)
(unsigned int) i = 0xFF00(when Radix is hex)
(unsigned int) i = 1111111100000000B(when Radix is binary)
When the result of calculation is a char type, it is displayed as follows:
(unsigned char) c = 'J'(when Radix is in initial state)
(unsigned char) c = 0x4A(when Radix is hex)
(unsigned char) c = 10100100B(when Radix is binary)
When the result of calculation is a floating point, it is displayed as follows:
(double) d = 8.207880399131839E-304(when Radix is in initial state)
(double) d = 0x10203045060708(when Radix is hex)
(double) d = 0000000010.....1000B(when Radix is binary)
(..... indicates abbreviation)
255
10.2.3 Pointer Types
•
•
When the result of calculation is a pointer type to other than a char* type, it is displayed in
hexadecimal as follows:
(unsigned int *) p = 0x1234(all Radices)
When the result of calculation is a char* type, you can select the display format of the string or a
character in the C Watch window's menu [Display String].
- string types
(unsigned char *) str = 0x1234 "Japan"(all Radices)
- character types
(unsigned char *) str = 0x1234 (74 'J')(all Radices)
l When the result of calculation is a char* type, it is displayed as follows:
(unsigned char *) str = 0x1234 "Jap(all Radices)
If the string contains a non-printing code prior to the code to show the end of the string (0), it is
displayed up to the non-printing character and the closing quote mark is not displayed.
You can double-click on lines indicated by a '+' to see the members of that structure or union. The '+'
changes to a '-' while the members are displayed. To return to the original display, double click the
line, now indicated by the '-'.
256
10 C/C++ Expressions
10.2.4 Array Types
•
•
When the result of calculation is an array type other than a char [ ] type, the starting address is
displayed in hex as follows:
(signed int [10]) z = 0x1234(all Radices)_
When the result of calculation is a char [ ] type, it is displayed as follows:
(unsigned char [10]) str = 0x1234 "Japan"(all Radices)
If the string contains a non-printing code prior to the code to show the end of the string (0), it is
displayed up to the non-printing character and the closing quote mark is not displayed.
(unsigned char [10]) str = 0x1234 "Jap(all Radices)
Also if the string contains more than 80 characters, the closing quote mark is not displayed. When the
C/C++ expression is an array type as same as pointer type, a '+' is display to the left of the type name.
You can see the elements of the array by using this indicating. (for the details, refer"10.2.3 Pointer
Types") When the number of the array elements is more than 100, the following dialog box open.
Specify the number of the elements in the dialog box.
The elements from the index specified in "Start" to the index specified in "End" are displayed. If you
specify the value more than the max index of the array, the value is regarded as max index of the
array. When you click the "Cancel" button, the elements are not displayed.
10.2.5 Function Types
•
When the result of calculation is a function type, the starting address is displayed in hex as
follows:
(void()) main = 0xF000(all Radices)
10.2.6 Reference Types
•
When the result of calculation is a reference type, the reference address is displayed in hex as
follows:
(signed int &) ref = 0xD038(all Radices)
10.2.7 Bit Field Types
•
When the result of calculation is a bit field type, it is displayed as follows:
(unsigned int :13) s.f = 8191(when Radix is in initial state)
(unsigned int :13) s.f = 0x1FFF(when Radix is hex)
(unsigned int :13) s.f = 1111111111111B(when Radix is binary)
257
10.2.8 When No C Symbol is Found
If the calculated expression contained a C symbol that could not be found, it is displayed as follows:
() x = <not active>(all Radices)
10.2.9 Syntax Errors
•
When the calculated expression contains a syntax error, it is displayed as follows:
() str*(p = <syntax error>(all Radices)
(where str*(p is the syntax error)
10.2.10 Structure and Union Types
•
When the result of calculation is a structure or union type, the address is displayed in hex as
follows:
(Data) v = 0x1234 (all Radices)
If, as in structures and unions, the C/C++ expression consists of members, a '+' is displayed to the left
of the type name (tag name).
You can double-click on lines indicated by a '+' to see the members of that structure or union. The '+'
changes to a '-' while the members are displayed. To return to the original display, double click the
line, now indicated by the '-'. This function allows you to check the members of structures and unions.
Attention
If a variable is declared with the same name as the type definition name declared by typedef, you
cannot reference that variable.
•
Register Variables
When the result of calculation is a register variable, "register" is displayed to the left of the type name
as follows:
(register signed int) j = 100
258
11 Display the Cause of the Program Stoppage
11. Display the Cause of the Program Stoppage
If the program is stoped by the debug function, the cause of the stoppage is displayed in the Output
window or Status window ([Platform] sheet).
The contents of a display and the meaning of "the cause of the stoppage" are as follows.
Display
Halt
S/W break
Address match interrupt break
H/W event, Combination
H/W event, Combination, Ax
H/W event, State transition, from xx
H/W event, State transition, Timeout
H/W event, Access protect error
The cause of the stoppage
The stop by the [Halt Program] button/menu
Software break
Address interrupt break
Hardware break, logical combination AND or AND(same
time)condition was met
Hardware break, logical combination OR condition was
met
(Ax: The event number of which condition was met.)
Hardware break, State Transition condition was met
(from xx: previous state (start, state1, state2))
Hardware break, State Transition, Time Out condition was
met
Protect break
Note
To be able to show the cause of break or not depends on the connected target. Some targets may
always show "Halt" or show "---".
259
12. Attention
12.1 Common Attention
12.1.1 File operation on Windows
1.
2.
File Name and Directory Name
- Do not use directory names or filenames that include blanks.
- Operation is not guaranteed if your directory names and filenames include kanji.
- Use only one period in a filename.
Specify the File and Directory
- You cannot use "..." to specify two levels upper directories.
- You cannot use a network pathname. You must allocate a drive.
260
12 Attention
12.1.2 Area where software breakpoint can be set
The area which can be set for software breakpoint varies depending on the type of MCU.
12.1.2.1 The debugger for M32C
The area which can be set for software breakpoint varies depending on the processor mode.
Processor Mode
Can be set area
Single Chip
Memory Extension
Internal RAM, Internal ROM
Internal RAM, Internal ROM
Emulation memory (Only the Internal area)
Internal RAM
Emulation memory (Only the Internal area)
Micro Processor
To stop the target program outside the emulation memory area, use the Come execution.
12.1.2.2 The debugger for M16C/R8C
The RAM / ROM area memory-mapped in the area set as Internal can be designated for software
breakpoint.
12.1.2.3 The debugger for 740
Only the ROM area memory-mapped in the area set as Internal can be designated for software
breakpoint.
You cannot set software breakpoint in ROM areas memory-mapped in the SFR area, RAM area or
other areas set as External.
12.1.3 Get or set C variables
•
•
•
•
•
•
•
•
•
•
•
•
If a variable is declared with the same name as the type definition name declared by typedef, you
cannot reference that variable.
Values cannot be changed for register variables and bit fields.
Values cannot be changed for 64 bit width variables (long long, double, and so on).
Values cannot be changed for C/C++ expressions that do not indicate the memory address and
size.
For the sake of optimization, the C compiler may place different variables at the same address. In
this case, values of the C variable may not be displayed correctly.
Literal character strings can only be substituted for char array and char pointer type variables.
No arithmetic operations can be performed on floating point types.
No sign inversion can be performed on floating point types.
Casting cannot be performed on floating point types.
Casting cannot be performed on register variables.
Casting cannot be performed on structure types, union types, or pointer types to structure or
union types.
Character constants and literal character strings cannot contain escape sequences.
261
12.1.4 Function name in C++
•
•
•
•
When you input the address using the function name in setting display address, setting break
points, and so on, you can not specify the member function, operator function, and overloaded
function, of a class.
You can not use function names for C/C++ expression
No script commands (e.g., breakin and func) can be used in which function names are specified
for arguments.
In address value specifying columns of dialog boxes, no addresses can be specified using function
names.
12.1.5 Debugging multi modules
If you register two or more absolute module file in one session, you can download only one file in same
time.
If you register one absolute module file and one or more machine language file in one session, you can
download all file in same time.
12.1.6 Syncronized debugging
Syncronized debugging function is not available.
12.1.7 Down-load of Firmware
To start the debugger, a firmware corresponding to the connected emulation pod or emulation probe
must be downloaded to the emulator.
•
The emulation pod or emulation probe has been changed.
•
A unknown firmware is downloaded to the emulator.
•
The debugger is used for the first time.
•
The debugger has been upgraded.
In one of the above cases, you must perform the following operation before starting the debugger.
Press the emulator system reset switch within 2 seconds after turning ON the emulator power switch.
Then, the emulator enters a mode in which the firmware is forced to be downloaded.
262
12 Attention
12.1.8 Ristriction of LPT port
1.
2.
The emulator uses a printer (parallel) port during LPT communications with personal computer.
The IAR C compiler also uses this printer (parallel) port.
When using the personal computer and the emulator during LPT communications, a problem
arises that you cannot compile a program using the IAR C compiler.
If this happens, you must take either of the countermeasures listed below:
- Connect the personal computer to the emulator in any mode other than the ECP mode.
- Start compiling the program after the debugger is terminated.
When you debug programs using the LPT parallel interface on the host PC running Windows XP,
the following symptoms may appear:
- The debugger becomes frozen.
- The debugger's operation gets extraordinarily slower.
- Communication errors arise and the emulator debugger stops operating.
- Various types of errors other than communication errors also take place successively. In this
case, the emulator debugger continues operating however.
The cause of this problem is that if the debugger is invoked while the standard driver Parport.sys of
Windows XP is communicating with the LPT port, the debugger is unable to communicate with the
emulator. Then, this problem can be circumvented in either of the following methods; however, you
need to take no measures if you have not experienced it in your PC under the above-mentioned
conditions:
- Execute the utilty program to fix (LptFix.exe).
LptFix.exe disables the Parport.sys driver. Then, if any device other than the emulator is
connected to the LPT port after LptFix.exe is executed, the device may not operate properly. In
such a case you are encouraged to adopt method shown below.
- If you launch the emulator for the first time after starting the PC, invoke the debugger one or
more minutes after the emulator starts operating. Otherwise, you can invoke the debugger
immediately after the emulator has started.
Here is the usage of LptFix.exe:
1. Invoke the command prompt and move to the folder where the LptFix.exe file resides.
2.
Enter the following command on the command line:
---------------------->LptFix
----------------------3. Restart the PC.
If LptFix.exe is executed, be sure to make it ineffective to enable the Parport.sys driver as explained
below, every time after ending debugging operations and disconnecting the emulator. To make
LptFix.exe ineffective to enable Parport.sys, execute following command line:
---------------------->LptFix /U
-----------------------
263
12.1.9 Notes for coverage function
Coverage Measurement is a function to record the addresses accessed by the target program.
These accessed addresses will flow to the microcomputer address bus.
This may cause unexecuted addresses to be treated as executed addresses when calculating coverage.
12.1.10 Emulator reset switch
If system reset of the emulator does not function normally, terminate the debugger, turn ON the
emulator again, and restart the debugger.
Then re-download the program.
12.1.11 Debugging Resource on Emulator
The debugging resource on the emulator is shared the window/between the dialogs plurals.
Therefore, either of the window/the dialog which can be used at the same time is only one.
Trace Event
•
•
•
•
Trace Point Setting Window(TracePoint Command)
MR Trace Window/MR Analyze Window
Task Trace Window/Task Analyze Window
Time Measurement Window
264
12 Attention
12.2 Attention of the M32C Debugger
12.2.1 Stack area used by the emulator
The emulator uses the interrupt stack area as a work area (20 bytes).
Before starting debugging, be sure to reserve the user stack area + 20-byte area.
12.2.2 Interrupt stack pointer when resetting the target program
The emulator sets the interrupt stack pointer (ISP) to 0500h when resetting the target program.
Remember that the interrupt stack pointer (ISP) is set to 0000h on a unit at the production stage.
12.2.3 Option of C Compiler/Assembler/Linker
The information may not be downloaded/debugged normally depending on the option designation of
the compiler, assembler, and linker.
Please refer to the following for the option specification.
Refer to "12.5 Option of C Compiler/Assembler/Linker"
The compiler that can be used by M32C debugger:
•
NCxx
•
the IAR EC++ Compiler
•
the IAR C Compiler
12.2.4 Target MCU HOLD terminal
When the target MCU HOLD terminal is set to LOW, you cannot stop execution of the target program.
Set the HOLD terminal to High and try to stop the target program again.
Even if the HOLD terminal is set to LOW for a short period of time, you may stop the target program
with the HOLD terminal set to LOW.
If this happens, try to stop the target program again.
12.2.5 Hardware Event
•
•
•
The debugger does not support a command fetch (Fetch) or an interrupt as a hardware event.
If you specify word-length (2-byte length) data from an odd address as an event in the following
data accesses, the event is not detected. Also, even when any other bit of the address that
contains a specified bit is accessed during bit access, the event may become effective.
- Hardware Break Event
- Real-time Trace Event
- Time Measurement Event
In the PID setting, you can specify the access size (BYTE/WORD). However, if you specify an odd
address in the "Address:" field, you cannot specify the WORD size.
265
12.2.6 Time Measurement Resource
You need to specify the operating frequency of mcu for debugger to calculate the time for Trace
window, Time measurement window, or other functions.
You can set it in MCU tab of INIT dialog box. If you use the mcu at 10MHz div 8, please enter 10 and
8 to edit boxes.
12.2.7 CPU rewrite
You can not debug the program using CPU rewrite.
12.2.8 MR STK script command
•
The MR STK BASE command automatically sets the area where the stack consumption can be
measured. The area set by this command is range of 256KB including the start address of the
system stack. If you want to set other area, please use not the MR STK BASE script command
but the CoVerage BASE script command.
266
12 Attention
12.3 Attention of the M16C/R8C Debugger
12.3.1 Map of stack area used by the emulator
The M16C/60,M16C/20 series emulators use a stack area of 4 bytes from 0FFFCh to 0FFFFh that is
accessed at power-on reset.
The emulator cannot start up normally unless these 4 bytes of memory can be accessed for read/write.
Therefore, if one of the following two conditions hold true, use the four bytes of 0FFFCh to 0FFFFh in
INTERNAL setting until the emulator finishes setting the interrupt stack pointer (ISP) after a reset.
•
When in systems that go from the single-chip mode to the memory extension or the
microprocessor mode after a reset, you are using the four bytes of 0FFFCh to 0FFFFh in
EXTERNAL setting.
•
When in systems that start up in microprocessor mode after a reset, you are using the four bytes
of 0FFFCh to 0FFFFh in EXTERNAL setting and do not have any external read/writable
memory.
12.3.2 Options for compiler, assembler, and linker
The information may not be downloaded/debugged normally depending on the option designation of
the compiler, assembler, and linker.
Please refer to the following for the option specification.
Refer to "12.5 Option of C Compiler/Assembler/Linker"
The compiler that can be used by M16C/R8C debugger:
•
NCxx
•
the IAR EC++ Compiler
•
the IAR C Compiler
•
the TASKING C Compiler
12.3.3 TASKING C Compiler
When you debug programs compiled by the TASKING C Compiler "CCM16", the type of bit field is
fixed on "unsigned short int". Because CCM16 outputs the debug information for the type of bit field
as "unsigned short int."
12.3.4 Target MCU HOLD terminal
When the target MCU HOLD terminal is set to LOW, you cannot stop execution of the target program.
Set the HOLD terminal to High and try to stop the target program again. Even if the HOLD terminal
is set to LOW for a short period of time, you may stop the target program with the HOLD terminal set
to LOW. If this happens, try to stop the target program again.
267
12.3.5 Hardware Event
•
•
•
If you specify word-length (2-byte length) data from an odd address as an event in the following
data accesses, the event is not detected. Also, even when any other bit of the address that
contains a specified bit is accessed during bit access, the event may become effective.
- Hardware Break Event
- Real-time Trace Event
- Time Measurement Event
To detect a byte access to an odd address in 8 bit bus width, specify the compare data to
HI-BYTE.
You cannot specify a PID data in word-length, when the specified PID address is an odd address.
12.3.6 Operating frequency of MCU
You need to specify the operating frequency of mcu for debugger to calculate the time for Trace
window, Time measurement window, or other functions.
You can set it in MCU tab of INIT dialog box. If you use the mcu at 10MHz div 8, please enter 10 and
8 to edit boxes.
12.3.7 The correspondence OS version of task pause function
The task pause function is available when downloading a target program in which the system for the
task pause function, supported by MR30 V.3.00 or later version, is installed.
If the MR30 version is V.3.00 Release 1, the following phenomenon may occur.
•
If a program issues a system call such as rel_wai or irel_wai to a task which is changed to
"Pause" using the task pause function, the "Pause" state of the task is reset.
In this case, the MR Task Pause window shows the task information different from the real task
state.
This phenomenon will not occur on a target program in which MR30 V3.10 Release 1 or later is
installed.
12.3.8 Memory Space Expansion
•
•
C watch window, Memory window, and other debugging windows can not show correct values,
when it shows the expanded area of the memory space expansion fuction. Debugging windows
does not consider the bank register.
In MODE2 of memory space expansion, the area bank7 is always set the map as EXTERNAL.
Please refer to the "5.1.4 Memory Extension Mode Tab".
12.3.9 Watch dog timer
You can not debug the program using Watch dog timer. While debugging, please do not start WDT.
268
12 Attention
12.3.10 CPU rewrite
You can not debug the program using CPU rewrite.
12.3.11 MR STK script command
•
The MR STK BASE command automatically sets the area where the stack consumption can be
measured. The area set by this command is range of 256KB including the start address of the
system stack. If you want to set other area, please use not the MR STK BASE script command
but the CoVerage BASE script command.
269
12.4 Attention of the 740 Debugger
12.4.1 Setting of Memory Map
The map attributes immediately after the emulator has started up are External for 0h-3FFFh and
Internal for 4000h-FFFFh. The memory map information must be altered to suit the target
microcomputer's memory space. It is similar in the case of the microcomputer that inside ROM area
begins from the 4000h past.
Please refer to "5.5 Setup the Debugger for 740" for details.
12.4.2 Emulation Pod M37515T-RPD
When you use emulation pod M37515T-RPD, you must be specify "40" to the fifth line (POD number
specification line) of the MCU file. MCU which becomes an object is as follows.
•
7515 Group
•
3850 Group
•
3851 Group
12.4.3 Stack area used by the emulator
The emulator uses the user stack area as a work area (3 bytes).
Before starting debugging, be sure to reserve the user stack area + 3 byte area.
12.4.4 Specify the Clock
When following Emulation Pod is used, the target clock becomes external clock fixation (The specified
clock is invalid).
•
M38000T-FPD
•
M38000TL-FPD
•
M38000TL2-FPD
12.4.5 Watch dog timer
When the watch dog timer is enabled, operations other than free-run of the target program are
inhibited. Before starting debugging, disable the watch dog timer.
12.4.6 Option of C Compiler/Assembler/Linker
The information may not be downloaded/debugged normally depending on the option designation of
the compiler, assembler, and linker.
Please refer to the following for the option specification.
Refer to "12.5 Option of C Compiler/Assembler/Linker"
The compiler that can be used by 740 debugger:
•
the Assembler Package for 740 Family SRA74
•
the IAR C Compiler
270
12 Attention
12.4.7 About the single-step execution and the program break function in
the internal RAM area of the mcu
When debugging with the emulation pod M38000L2-FPD, single-step execution and program break
function in the internal RAM area are not available.
When debugging the program transferred to the internal RAM area, please use the free-run execution
and the trace function.
12.4.8 Debugging in the 16-Timer functions
The microcomputer (38B5 group etc.) which supports 16 bit timer has undermentioned limitations.
•
[Precaution 1]
Outputs for the 16-bit timer may be invalid in the Memory Window etc. when the program
execution is suspended by breaking or single-stepping during writing to the higher/lower order
byte of the 16-bit timer.
For example:
[TIMER_LOW] = [DATA1]
[TIMER_HIGH] = [DATA2] <- when a break occurs here
•
[Precaution 2]
Writing a value (with the Memory Window) into the 16-bit timer will be fail when the program
execution is suspended by breaking or single-stepping during writing to the higher/lower order
byte of the 16-bit timer.
For example:
[DATA1] = [TIMER_LOW]
[DATA2] = [TIMER_HIGH] <- when a break occurs here
These problems caused by the microcomputer's specifications. In a microcomputer with the 16-bit
timer, the timer is written in the order of the lower byte and the higher byte. And reading from the
timer in reverse order.
Therefore, if a break occurs as shown in the Precaution 1 or 2, an incorrect value will be read or
written by displaying or setting a value of the 16-bit timer in the Memory Window.
12.4.9 Hardware Event
If you specify any other bit of the address that contains a specified bit is accessed during bit access,
the event may become effective in the following data accesses.
•
Hardware Break Event
•
Real-time Trace Event
•
Time Measurement Event
12.4.10 Operating frequency of MCU
You need to specify the operating frequency of mcu for debugger to calculate the time for Trace
window, Time measurement window, or other functions.
You can set it in MCU tab of INIT dialog box. If you use the mcu at 10MHz div 8, please enter 10 and
8 to edit boxes.
271
12.5 Option of C Compiler/Assembler/Linker
We do not evaluate other settings, so we can not recommend to append other options.
12.5.1 When Using NCxx
When -O, -OR or -OS option is specified at compilation, the source line information may not be
generated normally due to optimization, causing step execution to be operated abnormally.
To avoid this problem, specify -ONBSD (or -Ono_Break_source_debug) option together with -O, -OR or
OS option.
12.5.2 When Using the Assembler Package for 740 Family
Please assemble according to the following procedures and link.
At assemble
•
"-c" option
outputs debugging information concerned with source line to a relocatable file.
•
Note
When the directive comand .FUNC is specified to a function in a source file, if "-c" option is used,
the name of the function will be not available. Please do not use the option to make the name
available.
"-s" option
outputs local labels, local .equ symbols and local .bequ symbols to a relocatable file.
At link
•
"-s" option
generates a symbol file.
We do not evaluate other settings, so we can not recommend to append other options.
12.5.2.1 Command Execution Examples
The following shows examples of entering commands depending on the product
•
The Debugger for 740
>sra74 -c -s main.a74<Enter>
>sra74 -c -s sub.a74<Enter>
>link74 main sub ,,,-s<Enter>
272
12 Attention
12.5.3 When Using the IAR C Compiler (EW)
Please specify the project setting by following process.
1.
The Setting in the IAR Embedded Workbench
When you select the menu [Project] -> [Options...], the dialog for "Options For Target " target""
will open. In this dialog, please select the "XLINK" as category, and set the project setting.
- Output Tab
In the "Format" area, check the "Other" option, and select the "ieee-695" as "Output Format".
- Include Tab
In the "XCL File Name" area, specify your XCL file (ex: lnkm16c.xcl).
2. Edit the XCL file
Add the command line option "-y" to your XCL file. The designation of "-y" option varies
depending on the product.
Product Name
-y Option
The debugger for M32C
The debugger for M16C/R8C
The debugger for 740
-ylmb
-ylmb
-ylmba
3.
Build your program after the setting above.
We do not evaluate other settings, so we can not recommend to append other options.
273
12.5.4 When Using the IAR C Compiler (ICC)
12.5.4.1 Specify the Option
Please compile according to the following procedures and link.
•
At compilation
Specify the "-r" option.
•
Before linking
Open the linker's option definition file (extension .xcl) to be read when linking and add
"-FIEEE695" and "-y" options. The designation of "-y" option varies depending on the product.
Product Name
-y Option
The debugger for M32C
The debugger for M16C/R8C
The debugger for 740
-ylmb
-ylmb
-ylmba
At link
Specify the linker's option definition file name using "-f" option.
We do not evaluate other settings, so we can not recommend to append other options.
12.5.4.2 Command Execution Examples
The following shows examples of entering commands depending on the product
•
The debugger for M32C
>ICCMC80 -r file1.c<Enter>
>ICCMC80 -r file2.c<Enter>
>XLINK -o filename.695 -f lnkm80.xcl file1 file2<Enter>
•
The debugger for M16C/R8C
>ICCM16C -r file1.c<Enter>
>ICCM16C -r file2.c<Enter>
>XLINK -o filename.695 -f lnkm16c.xcl file1 file2<Enter>
•
The debugger for 740
>ICC740 -r file1.c<Enter>
>ICC740 -r file2.c<Enter>
>XLINK -o filename.695 -f lnk7400t.xcl file1 file2<Enter>
The XCL file name varies depending on the product and memory model. For details, see the ICCxxxx
manual.
274
12 Attention
12.5.5 When Using the TASKING C Compiler (EDE)
Please specify the project setting by following process.
1.
2.
3.
Select menu - [EDE]->[C Compiler Option]->[Project Options...]. The "M16C C Compiler Options
[Project Name]" dialog opens.
Please set as follows by this dialog.
- Optimeze Tab
Please specify "No optimization" by Optimization level.
- Debug Tab
Please check only ""Enable generation of any debug information(including type checkeing)""
and "Genarate symbolic debug information".
Select menu - [EDE]->[Linker/Locator Options...]. The "M16C Linker/Locator Options [Project
Name]" dialog opens.
Please set as follows by this dialog.
- Format Tab
Please specify "IEEE 695 for debuggers(abs)" by Output Format.
Build your program after the setting above.
We do not evaluate other settings, so we can not recommend to append other options.
12.5.6 When Using the TASKING C Compiler (CM)
12.5.6.1 Specify the Option
Please specify "-g" and "- O0" options when compiling.
In the options other than the above-mentioned, the operation check is not done. Please acknowledge
that the options other than the above-mentioned cannot be recommended.
12.5.6.2 Command Execution Examples
The following shows examples of entering commands.
>CM16 -g -O0 file1.c<Enter>
275
12.5.7 When Using the IAR EC++ Compiler (EW)
Please specify the project setting by following process.
1.
The Setting in the IAR Embedded Workbench
When you select the menu [Project] -> [Options...], the dialog for "Options For Target " target""
will open. In this dialog, please select the "XLINK" as category, and set the project setting.
- Output Tab
In the "Format" area, check the "Other" option, and select the "elf/dwarf" as "Output Format".
- Include Tab
In the "XCL File Name" area, specify your XCL file (ex: lnkm32cf.xcl).
2. Edit the XCL file
Add the command line option "-y" to your XCL file. The designation of "-y" option varies
depending on the product.
Product Name
-y Option
The debugger for M32C
The debugger for M16C/R8C
-yspc
-yspc
3.
Build your program after the setting above.
We do not evaluate other settings, so we can not recommend to append other options.
276
740 PC4701 Emulator Debugger V.1.02
User's Manual
Publication Date:
Aug. 01, 2006
Rev.1.00
Published by:
Sales Strategic Planning Div.
Renesas Technology Corp.
Edited by:
Microcomputer Tool Development Department
Renesas Solutions Corp.
© 2006. Renesas Technology Corp. and Renesas Solutions Corp., All rights reserved. Printed in Japan.
740 PC4701 Emulator Debugger V.1.02
User’s Manual
1753, Shimonumabe, Nakahara-ku, Kawasaki-shi, Kanagawa 211-8668 Japan
REJ10J1384-0100