1
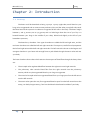
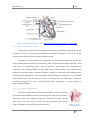
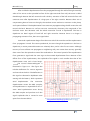
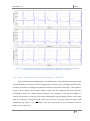
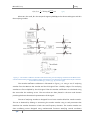
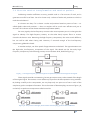
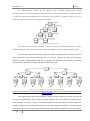
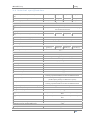
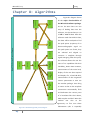
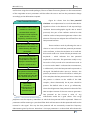
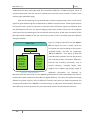
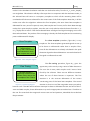
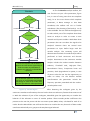
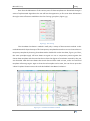
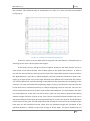
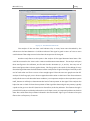
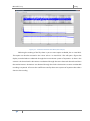
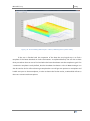
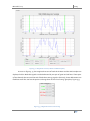
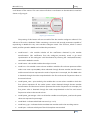
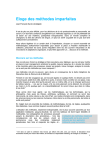
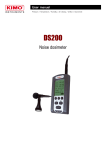
MicroECG v2.4
2009
Chapter 8: Algorithms
all the major functionalities of
Wavelets
Fine Tunning
Figure 8.1 diagram shows
the MicroECG software package.
As can be seen there are two
ways of loading data into the
software; via the simulator or via
a .bdf or .mat file data. After the
MicroECG’s General Process Diagram
this data will be analyzed to find
Magnitude
Vectors
Show Template
software reads the HR-ECG data,
the peak points (R points) of an
electrocardiographic signal. As
12-Lead ECG
this peak points are found, they
are selected and aligned to
construct a template through
Raw Data From
Electrodes
Peak Detect
Read File
Open File
signal averaging. After this point,
the software allows the user the
most of its capabilities like ECG
Variability, Heart Rate Variation,
Noise Level
Between Heart
Beats
measurement of the noise level,
display of the raw data acquired
and display of a 12 lead HR-ECG,
measurement of the magnitude
Heart Variation
Rate
vectors’ parameters or even use
the wavelet package. One thing
to notice is that as the template
ECG Variability
Late Potential
Simulator
construction automatically finds
and delineates the various parts
of a heartbeat like the P-Wave,
QRS complex and the T-Wave the
medical
user
also
as
the
opportunity to fine tune these
Figure 8.1 –MicroECG’s general process diagram
64
delineations (this is especially