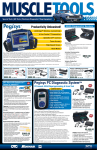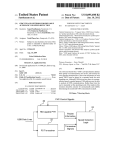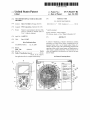
1
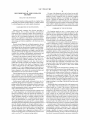
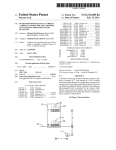
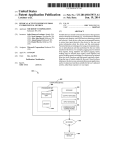
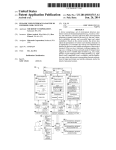
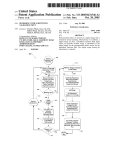
US007702437B2
(12) Ulllted States Patent
(10) Patent N0.:
Gilbert
(54)
(45) Date of Patent:
MULTIDIMENSIONAL VEHICLE HEALTH
(56)
GRAPHICS
(75)
Inventor:
US 7,702,437 B2
Apr. 20, 2010
References Cited
U.S. PATENT DOCUMENTS
Harry M. Gilbert, Portage, MI (US)
2006/0210141 A1*
9/2006 Kojitani et a1. ............ .. 382/141
(73) Assignee: SPX Corporation, Charlotte, NC (US)
(*)
Notice:
Subject to any disclaimer, the term of this
t
t '
' '
'
t
d d
d'
y
y '
t d
d
51 Se1g 11552251; e 10%;; L115 e un er
35
(21) Appl. No.: 11/955,723
(22) Filed:
(65)
* cited by examiner
Primary ExamineriKim T Nguyen
(74) Attorney, Agent, or FirmiBaker & Hostetler LLP
(57)
ABSTRACT
Dec. 13, 2007
Prior Publication Data
Us 2009/0157248 A1
11111- 18, 2009
A method of displaying a Vehicle’s information, includes
measuring a set Values of the Vehicle, comparing the set of
measured Values With a set of related normal Values of a
Vehicle of the same type as the Vehicle being measured, and
operating Within a preset normal range, and displaying on a
(51)
Int- Cl-
(2006-01)
Video image a graphical depiction of the measured set of
(52)
(58)
US. Cl. ...................................................... .. 701/29
Field of Classi?cation Search ................. .. 701/29,
Values in comparison to the normal set of Values of the same
tWe Of vehicle
701/31, 33*36; 382/141
See application ?le for complete search history.
20 Claims, 8 Drawing Sheets
G06F 7/00
—Settlngs
I] Zone Border /\ /302
El PleBorder
’-\ /304
IE Show Zone Colored Pies ’ '-\_/305
I2 Show loan Caption /_ \_/3OB
El Stretch
/_\_ I310
El LlneTo Icon /_\ /312
EI Show Pies /\ /314
E| Gradient nu /\ _,316
U Black And White Zones I x318
E Show Zone Names / ‘ \/320
El Full Slze Pie /\ /32z
ElAnimale m 324
US. Patent
Apr. 20, 2010
Sheet 1 of8
(/1
v)’
MWAQWv
@®
000%
@@
@
FIG. 1
US 7,702,437 B2
US. Patent
Apr. 20, 2010
Sheet 3 of8
US 7,702,437 B2
52
9
PC
VEHICLE
A
DIAGNOSTIC \Jio
TOOL
FIG. 3
US. Patent
Apr. 20, 2010
Sheet 4 of8
US 7,702,437 B2
NETWORK
INTERFACE
808
“
s12
MODEM
\/
802
y
COMPUTER
PROCESSOR
READABLE
M EM ORY UNIT
804
SYSTEM
\J
M EM ORY
COM PUTER
820
DISPLAY
“J
FIG. 4
Q3106
US. Patent
WE
Sheet 5 of8
US 7,702,437 B2
E
v
35%?
m:
m:
i
Apr. 20, 2010
JE_
U2\mE(<
.9"m
US. Patent
@QU
Apr. 20, 2010
Sheet 7 of8
US 7,702,437 B2
@
mac w?
U962M5
E628 .»
E3935@260%M E3=:203w28
mQ;\5%/\
U
B25:02
Ea:325 E.E2 86
E2252$Em>M E32mw6EmMz
U:6ma36
.67.h
E
i
US. Patent
Apr. 20, 2010
Sheet 8 of8
2
m
N
o
N
mm
@QU
=@
52$586 wM0
$50?
596260Mm
_H_E Qm E
U52 5 U8E226 EE20626
US 7,702,437 B2
US 7,702,437 B2
1
2
MULTIDIMENSIONAL VEHICLE HEALTH
GRAPHICS
tional devices in order to supplement the limitations of output
FIELD OF THE INVENTION
methods of today’s diagnostic tools or personal computers
used for diagnostic purposes. Accordingly, it is desirable to
The user of the diagnostic tool can be forced to use addi
provide a method and apparatus that Will alloW enhanced
display capabilities to a user or technician to use a diagnostic
The present invention relates generally to a display. More
particularly, the present invention relates to a display related
to vehicle diagnostics and vehicle health information.
tool or diagnostic personal computer to determine the output
of the vehicle’s health information in a manner that is easy
and quick to ascertain Whether it is Within normal constraints.
BACKGROUND OF THE INVENTION
SUMMARY OF THE INVENTION
Onboard control computers have become prevalent in
The foregoing needs are met, to a great extent, by the
present invention, Wherein in one aspect an apparatus is pro
vided that in some embodiments enhanced display capabili
ties to a technician through a diagnostic tool or diagnostic
motor vehicles, but as safety, economy, and emissions
requirements have continued to tighten, friction braking sys
tems, and traction control devices have not met the require
ments set out in government regulations and the implicit
demands of competitors’ achievements. Successive genera
personal computer to determine the output of the vehicle’s
health information in a manner that is easy and quick to
tions of onboard control computers have acquired increasing
data sensing and retention capability as the electronics have
advanced.
20
Present external diagnostic and display apparatus, knoWn
as diagnostic tools, are commonly limited to reporting the
data acquired by the onboard control computer itself. Increas
ingly, subtle subsystem failures in vehicles overload the abil
ity of maintenance technicians, not simply to read the faults
detected and stored by the diagnostic tools themselves, but to
combine those readings With peripheral measurements and
deduce corrective actions With both speed and accuracy.
Currently in the automotive industry, there are both stand
alone and hand-held diagnostic testers or tools used in con
sured values With a set of related normal values of a vehicle of
the same type as the vehicle being measured, and operating
30
nection With motor vehicle maintenance and repair. For
example, hand-held diagnostic tools have been used to
trouble-shoot faults associated With vehicular control units.
Diagnostic tools detect faults based on Diagnostic Trouble
computer. A DTC can be triggered and stored When there is a
problem With the vehicle. A technician then retrieves the DTC
using a diagnostic tool, repairs the associated problem and
Vehicle diagnostics have also been performed through per
sonal computers. HoWever, the display of such diagnostic
40
Furthermore, technicians have also needed extensive learning
testing. Certain sensors are attached to the vehicle to make
certain measurements related to environmental emissions or
45
dependency on a predetermined variable. The video image
can include coloring or shading the different regions of video
image according to a deviation from the normal set of values.
There can also be a dividing of different regions of the video
image according to a set range of deviations from the normal
set of values.
50
safety related information of the vehicle.
The current diagnostic tools and personal computers used
Additionally, there is an altering of the video image accord
ing to the display of the measured values as compared to the
related normal set of values. The location of the measured
values can be dependent on a third variable in addition to the
comparison to the normal set of values. The video image can
include a plurality of icons representing the particular mea
sured variables of the vehicle and measured values being
for vehicle diagnostics and vehicle health information are
limited in the display output, thus limiting the usefulness of
the diagnostic tool for a user. The limits on the current tools
centric circles With the measured values being located accord
ing to the comparison to the normal set of values, and the
concentric circles being sectioned further into a plurality of
pied subdivisions, With each pie representing an additional
information has alWays been dif?cult to read for technicians.
in order to read such diagnostic information.
Further general vehicle health information have also be
monitored through personal computers, or standalone com
puting modules that measure information related to emission
Within a preset normal range, and displaying on a video image
a graphical depiction of the measured set of values in com
parison to the normal set of values of the same type of vehicle.
The video image can also include icons With values indi
cating the measured set of values of a health of the vehicle.
The video image can further include a video depiction of the
values having a dependency on the location Within a display
screen to indicate the comparison to the normal set of values.
The video image can be a plurality of concentric circles, With
measured values of the vehicle being located closer to center
as the measured values are closer to value of the related
normal set of values.
The video image can be sectioned into a plurality of con
Codes or DTCs that are set in the vehicle’s onboard control
then deletes the DTC from the vehicle’s computer.
ascertain Whether it is Within normal constraints.
In accordance With one aspect of the present invention, a
method of displaying a vehicle’s information, includes mea
suring a set values of the vehicle, comparing the set of mea
55
output capabilities include, for example, problems With the
displayed adjacent to the respective icons, and the icons and
method of indicating the DTC, or vehicle health information
measured values being moved around a concentric circle at a
same distance from the center of the concentric circle in order
such as the measurement of a certain sensors in the vehicle.
to not overlap the displayed image of the icon and related
The current diagnostic tools shoW the DTC on a basic display
that displays the basic information and such information, then
must be checked manually or through additional steps to
ascertain Whether the information is Within the normal limits.
The user must be in close proximity and in vieWing distance
from the diagnostic tool as the information is usually text
based. For example, When a diagnostic tool detects a DTC or
an emission testing result, a user must directly vieW the tool in
order to see the DTC or emission testing readout.
60
measured value. The method can also be a set of computer
executable instructions stored on a computer readable media.
In another aspect of the invention, there can be an apparatus
for displaying a vehicle’s measured information, including a
communication interface connecting to the vehicle and
accommodating the measuring of the vehicle’s information
65
through a plurality of sensors, a memory connected to the
communication interface, storing a softWare for displaying of
the vehicle’s measured information, a processor connected to
US 7,702,437 B2
3
4
the memory and controlling the software, the software includ
ing instructions for measuring a set values of the vehicle, and
present invention provides an e?icient means of displaying
and ascertaining from the display the relative health of a
vehicle in relation to normal outputs. This invention proposes
a visual health display Which permits the technician to see at
a glance the relative health of a vehicle system, and Where the
comparing the set of measured values With a set of related
normal values of a vehicle of the same type as the vehicle
being measured, and operating Within a preset normal range,
and a display displaying on a video image a graphical depic
tion of the measured set of values in comparison to the normal
set of values of the same type of vehicle.
In another aspect of the invention, a system for displaying
most serious problems are.
Manufacturers have programmed their vehicle onboard
computers With complicated methods of detecting a variety of
problems. Further, the United States Environmental Protec
a vehicle’s information, includes a means for measuring a set
values of the vehicle, a means for comparing the set of mea
sured values With a set of related normal values of a vehicle of
tion Agency has mandated that DTCs be set Where there are
the same type as the vehicle being measured, and operating
system.
emissions related problems With the vehicle using the
Onboard Diagnostic II System, also knoWn as the OBD II
Within a preset normal range, and a means for displaying on a
HoWever, there are still problems of using the diagnostic
video image a graphical depiction of the measured set of
tool since there are limitations in the output methods of the
values in comparison to the normal set of values of the same
type of vehicle.
There has thus been outlined, rather broadly, certain
embodiments of the invention in order that the detailed
description thereof herein may be better understood, and in
diagnostic tool or personal computer or other computing
20
order that the present contribution to the art may be better
appreciated. There are, of course, additional embodiments of
the invention that Will be described beloW and Which Will
form the subject matter of the claims appended hereto.
In this respect, before explaining at least one embodiment
of the invention in detail, it is to be understood that the
invention is not limited in its application to the details of
construction and to the arrangements of the components set
forth in the folloWing description or illustrated in the draW
ings. The invention is capable of embodiments in addition to
those described and of being practiced and carried out in
25
of acceptable operation of a vehicle under certain predeter
mined circumstances. The range of normal values can be a set
of values, for example, for the same type vehicle When it is
functioning under universally acceptable standards, or under
30
various Ways. Also, it is to be understood that the phraseology
and terminology employed herein, as Well as the abstract, are
for the purpose of description and should not be regarded as
limiting.
device used to display the vehicle’s health output. A user is
forced to look at the display With the current vehicle health
information and then go through addition steps such as look
ing through manuals or checking through another menu on
the display to ascertain the normal outputs of the vehicle and
then have to ascertain Whether the current outputs are Within
the normal constraints.
Normal constraints can be de?ned for example With a range
35
a certain set of standards that are preset by, for example, by a
board. For example, normal constraints for the values can be
set by a vehicle’s emission board or according to state laW to
What are acceptable measured values.
In an embodiment of the present invention, the diagnostic
tool or computer Will run an application that accommodates a
The rapidly increasing amount of data related to the health
of a vehicle make the job of diagnosing problems by revieW
display of images that Will relay to the technician in an e?i
ing lists of real-time vehicle data more and more dif?cult for
base set of data that is considered the normal for a healthy
vehicle.
An embodiment of the present inventive apparatus is illus
trated in FIG. 1. In particular, FIG. 1 is a front vieW illustrat
ing a diagnostic tool 10 according to an embodiment of the
invention. The diagnostic tool 10 can be any computing
cient manner the vehicles health information in relation to a
a human technician.
As such, those skilled in the art Will appreciate that the
conception upon Which this disclosure is based may readily
be utiliZed as a basis for the designing of other structures,
methods and systems for carrying out the several purposes of
the present invention. It is important, therefore, that the
claims be regarded as including such equivalent constructions
insofar as they do not depart from the spirit and scope of the
present invention.
device, for example, the NEMISYS diagnostic tool from
SERVICE SOLUTIONS (part of the SPX Corporation). The
diagnostic tool 10 includes a housing 12 to encase the various
components of the diagnostic tool 10, such as a display 14, a
user interface 16, a poWer button 18, a memory card reader 20
and a connector interface 22. The display 14 can be any type
BRIEF DESCRIPTION OF THE DRAWINGS
50
display, including for example but not limited to, a liquid
FIG. 1 is a front vieW of a diagnostic tool With a display.
crystal display (LCD), organic light emitting diode (OLED),
FIG. 2 is a schematic diagram of the diagnostic tool of FIG.
?eld emission display (FED), electroluminescent display
1.
(ELD), etc. In addition, the LCD, for example, can be touch
screen that both displays and performs the additional task of
interfacing betWeen the user and the diagnostic tool 10. The
FIG. 3 is a block diagram of a diagnostic tool or personal
computer connected to a vehicle for checking the health of a
vehicle.
FIG. 4 illustrates the schematics of an exemplary computer
user interface 16 alloWs the user to interact With the diagnos
tic tool 10, in order to operate the diagnostic tool as the user
prefers. The user interface 16 can include function keys,
that is capable of displaying the vehicle health graphics.
FIGS. 5-8 shoW the vehicle health graphics on a display of
a computing device such as personal computer or diagnostic
tool depending on the selected options.
arroW keys or any other type of keys that can manipulate the
diagnostic tool 10 in order to operate the diagnostic tool
through the softWare. The user interface or input device 16
can also be a mouse or any other suitable input device for the
DETAILED DESCRIPTION
The invention Will noW be described With reference to the
draWing ?gures, in Which like reference numerals refer to like
parts throughout. An embodiment in accordance With the
user interface 16, including a keypad, touchpad, etc. The user
interface 16 can also include keys correlating to numbers or
65
alphanumeric characters. Moreover, as mentioned above,
When the display 14 is touch sensitive, the display 14 can
supplement or even substitute for the user interface 16. The
US 7,702,437 B2
5
6
power key or button 18 allows the user to turn the power to the
interface 16 via the CPLD 30. The CPLD 30 provides logic
for decoding various inputs from the user of diagnostic tool
10 and also provides the glue-logic for various other interfac
diagnostic tool 10 on and off, as required.
A memory card reader 20 can be a single type card reader,
such as, but not limited to, a compact ?ash card, ?oppy disk,
memory stick, secure digital, ?ash memory or other type of
ing tasks.
Memory subsystem 32 and internal non-volatile memory
memory. The memory card reader 20 can be a reader that
34 are coupled to the second system bus 38, Which alloWs for
communication With the processor 24 and FPGA 26. Memory
subsystem 32 can include an application dependent amount
of dynamic random access memory (DRAM), a hard drive,
and/or read only memory (ROM). SoftWare to run the diag
nostic tool 10 can be stored in the memory subsystem 32. The
reads more than one of the aforementioned memory such as a
combination memory card reader. Additionally, the card
reader 20 can also read any other computer readable medium,
such as CD (compact disc), DVD (digital video or versatile
disc), etc.
The connector interface 22 alloWs the diagnostic tool 10 to
internal non-volatile memory 34 can be, but not limited to, an
connect to an external device, such as, but not limited to, an
electrically erasable programmable read-only memory (EE
ECU (electronic control unit) of a vehicle, a computing
PROM), ?ash ROM, or other similar memory. The internal
non-volatile memory 34 can provide, for example, storage for
boot code, self-diagnostics, various drivers and space for
FPGA images, if desired. If less than all of the modules are
implemented in FPGA 26, the non-volatile memory 34 can
device, an external communication device (such as a
modem), a netWork, etc. through a Wired or Wireless connec
tion. Connector interface 22 can also include connections
such as a USB (universal serial bus), FIREWIRE (Institute of
Electrical and Electronics Engineers (IEEE) 1394), modem,
contain doWnloadable images so that FPGA 26 can be recon
RS232, RS481, and other connections to communicate With
external devices, such as a hard drive, USB drive, CD player,
DVD player, or other computer readable medium devices.
FIG. 2 is a block diagram of the components of a diagnostic
tool 10. In FIG. 2, the diagnostic tool 10, according to an
20
embodiment of the invention, includes a processor 24, a ?eld
25
can scan information of a vehicle 60. Vehicle diagnostic and
health information can be ascertained through not only a
computing device such as a diagnostic tool 60, but also a
programmable gate array (FPGA) 26, a ?rst system bus 28,
the display 14, a complex programmable logic device
(CPLD) 30, the user interface 16 in the form of a keypad, a
memory subsystem 32, an internal non-volatile memory
(NVM) 34, a card reader 36, a second system bus 38, the
connector interface 22, and a selectable signal translator 42.A
vehicle communication interface 40 is in communication
With the diagnostic tool 10 through connector interface 22 via
an external cable. The connection betWeen the vehicle com
munication interface 40 and the connector interface 22 can
also be a Wireless connection such as BLUETOOTH, infrared
IEEE 802.1 1 protocol or BLUETOOTH can be used to trans
tion or through a local area netWork.
30
35
such as the Internet. The system bus may also include an input
40
45
100, Would be displayed as a background, With an icon 102a
50
The circuitry to translate a particular communication pro
The “bull’s-eye” target 100 can also be described as a set of
concentric circles.
The icons 10211-11211 With the corresponding readings
tocol can be selected by the FPGA 26 (e.g., by tri-stating
unused transceivers) or by providing a keying device that
plugs into the connector interface 22 that is provided by
55
102b-112b can be superimposed on the bulls-eye target 100
image. Further, the icons are located in a position that indi
cates the health of the vehicle 60.
For, example, if an engine temperature Was in normal
range, an icon for it Would be displayed near or at the center
of the “bull’s-eye” image 100. As readings of these data
approach the limits of failure, an icon representing the data
FPGA 26 transmits to and receives signals (i.e., messages)
60
Will appear on a graphic display in a position to indicate that
65
ture reading might shoW the temperature icon near the upper
boundary of the “bull’s-eye”. The location of the icon Within
the “bull’ s eye” therefore is indicative of the relative health of
the vehicle 60.
the value is sub -optimal. For example, a high engine tempera
in order to output the desired information to the user. The
processor 24 communicates With the CPLD 30 through the
second system bus 38. Additionally, the processor 24 is pro
grammed to receive input from the user through the user
Referring to FIG. 5, for each vehicle there is a set of knoWn
good, or in-range, data values, such as engine coolant tem
perature, oxygen sensor, etc. In the present invention, a
graphic image as seen in FIG. 5, such as a “bull’s-eye” target
11211 for each reading of interest 102b-112b, respectively.
area netWork (CAN), or other communication protocols that
from the motor vehicle control unit through the translator 42.
FPGA 26 is coupled to the processor 24 through various
address, data and control lines by the second system bus 38.
FPGA 26 is also coupled to the card reader 36 through the ?rst
system bus 28. Processor 24 is also coupled to the display 14
and output (I/O) interface 810 that accommodate connection
to a variety of other devices. Furthermore, the computer 52
can output through, for example, the I/O 810, data for display
on a display device 820.
communication links (DCL), serial communication interface
(SCI), S/F codes, a solenoid drive, 11708, RS232, controller
diagnostic tool 10 to connect diagnostic tool 10 to vehicle
communication interface 40. Translator 42 is also coupled to
FPGA 26 and the card reader 36 via the ?rst system bus 28.
instructions. The computer 52 includes a processor 802 that
uses the system memory 804 and a computer readable
memory device 806 that includes certain computer readable
recording media. A system bus connects the processor 802 to
a netWork interface 808, modern 812 or other interface that
accommodates a connection to another computer or netWork
detection (CCD) (e.g., Chrysler collision detection), data
are implemented in a vehicle.
Referring to FIG. 4, an example of a computer, but not
limited to this example of the computer 52, that can read
computer readable media that includes computer-executable
received from a motor vehicle control unit through the vehicle
communication interface 40 to a conditioned signal compat
ible With the diagnostic tool 10. The translator 42 can com
municate With, for example, the communication protocols of
11850 signal, ISO 9141-2 signal, communication collision
personal computer 52. If the distance is not too great, the
fer information directly to the PC in a point-to-point connec
device, Wireless ?delity (WiFi, e.g. 802.11), etc.
The selectable signal translator 42 communicates With the
vehicle communication interface 40 through the connector
interface 22. The signal translator 42 conditions signals
?gured for a different group of communication protocols.
As seen in the block diagram of FIG. 3, diagnostic tool 10
Additionally, the icons for sensors can themselves be
replaced by icons for systems, groups of sensors, etc. The
US 7,702,437 B2
7
8
technician, or end-user can select items to track in this man
ner, or the selection can be done automatically.
example, the radius of the pie can be time dependent With
readings taken at time:0, can be shoWn at the top of the pie or
readings taken at time:6 can be taken at the bottom of the pie.
Other signi?cance can be attached to the pie borders 210, and
these Were only shoWn as examples.
The example in FIG. 5 shoWs readings from a vehicle, as
might be seen during an emissions test. The icons are seen for
gasses NO (10a), 02 (108a), HC (104a), CO (106a) and CO2
(102a), and the vehicle’s speed (MPH) 112a While running a
Referring to FIG. 5, the shoWing of the color the pies as
seen in reference 210 being selected through the “Show Zone
Colored Pies” 306 different than the color of the other pies,
shoW to the color of the Zone that the reading is in. Each color
test on a dynamometer. The actual values shoWn are not
representative of actual values for a vehicle. The reading
(102b-112b) is the measurement being displayed, such as 02
(Oxygen sensor) or MPH (Dynamometer velocity).
can have certain signi?cance, such as certain colors for cer
As seen in FIG. 5, there are different Zones 120-150. Zones
are used to describe the circular bands, or ranges, of values
tain time dependent readings or other de?nitions can be
attached to the color of the pie.
related to the Ideal range for a given reading. There may be as
Referring to FIG. 5, “shoW icon caption” 308 illustrates the
display of the value for the reading in a caption adjacent to the
many Zones as needed, or only a single one. The Ideal Zone is
in the center or concentric circle 150, While Zone 120 at the
icon, as seen for example by 10411 for HC as 25.0. The units
for the measurements can also be displayed if requested or
periphery represent the opposite extreme, such as Worst Case,
With surrounding Zones 130-140 shoWing relationships to the
pre-programmed. The caption is moved for visibility pur
central Zone 150.
poses When it might be obscured or beyond the vieWing area.
Such a movement of the caption can be automatically
A Zone does not necessarily represent an exact linear pro
portion to the Whole circle, but is for visual effect. That is to
say, the Ideal Zone may represent a single value, say 0, While
the Safe Zone may represent values from 1 to 100, the Atten
tion Zone may represent values from 101 to 1 l0, and the Fail
Zone may represent any value above 110.
Each reading can have its oWn set of ranges (minimum,
20
display area being distorted horiZontally or vertically With no
loss of content or visual features. This maybe necessary for a
plurality of reasons, including having to display more than
25
maximum, ideal). In the case Where the center range (e.g.,
Ideal) is not the minimum or maximum value possible, the
meter Would display the value drifting back into the outer
Zones. That is to say, if the Ideal range for a reading is 100,
readings of 90 and 110 might both appear in the same outer
Zones or might even appear in quite different Zones, depend
ing on the qualitative assessment of the value related to the
ideal.
Zones may have colors associated With them to differenti
screen, or to compensate for the screen siZe in order to maxi
30
can, for example, help in the reading or folloWing the different
readings for a technician.
40
45
50
indicates if names are given to the Zones, then they are dis
played in the appropriate Zone.
A full siZe pie option 322 is shoWn in FIG. 8. The pie is
draWn to the edge of the display area instead of only to the
border 204, for example, depending on the user or the dis
played icons Will aid in the technician ascertaining on Which
60
reach of the value. This is done as a preference of the techni
cian on seeing the Whole pie or only to Where the reach of the
value is shoWn. ShoWing the Whole pie, for example, can give
As seen in FIG. 6, a pie border 210 option 304 selects
Whether a pie has a bordering line or not. A signi?cance canbe
attached to the pie border. For example, the pie border can
have the signi?cance of a measurement being taken, or a
cal value shoWn, such as a reading of 3.0, but that such a
reading shoWed a large change over a space of time. For
certain gray scale accommodating for an optimal vieWing by
Referring to FIG. 8, the “shoW Zone names” option 320
55
selects Whether a Zone has a bordering line or not. The Zone
region having secondary characteristics beyond the numeri
With ‘shading’ from light to dark as seen for example in FIG.
6. This again, alloWs for an easier reading of the information,
especially if a technician is located a certain distance from the
display screen.
The black and White Zones option 318, as seen in FIG. 8,
has the Zones being shoWn as black and White, as an example
the technician. This scheme can accommodate for certain
technicians a better reading from a distance as they can better
differentiate the changes in Zones.
“Health Meter” of the invention as shoWn in FIG. 5, are seen
speci?c border the speci?c icon is displayed on.
pie may have different signi?cances.
The gradient ?ll option 316 is Where the display is shoWn
of an alternative color scheme for the Zones. Therefore, as
seen from Zones 120 to 150, the Zones alternate from White to
black to White and back to black. The black portion can be a
the reading is currently in. Pies can be transparent (as in the
on the right-hand side, and should clarify the options seen in
the example of FIG. 5.
Referring to FIG. 6, the option 302 of the Zone border 204
The shoW pies option 314 as shoWn by the pie 216 FIG. 6,
has the pies for the readings. The shoWing of the pies 216
accommodates for a technician, for example, a greater differ
entiation betWeen different pie areas, or pie Zones, Where each
cance to a technician Without having to use a user’s manual to
attached examples) or opaque.
There are certain displayed options that can be available.
The options of the test program Which demonstrate the
The line to icon option 312 as illustrated by line 214,
displays a single line is draWn from the center of the display
area to the reading’s position, such as 10611. The line to icon
the normal output. For example, White can be used for Ideal,
Green for Safe, YelloW for Attention and Red for Fail corre
spond to common color schemes that have a universal signi?
Zone’s color might not be used to color the Zone band, but
instead used to color the pie for a reading.
A pie is used to describe the triangular shapes Which ema
nate from the center of the Health Meter to shoW the extent of
the reading, or the Zone that the reading is in, or both. Pies also
demarcate the portion of the visual area occupied by a par
ticular reading. Pies can be colored With a separate color for
each reading, or can be colored depending upon the Zone that
one image on a screen, and therefore, being able to stretch the
vieW in any direction in order to accommodate the second
miZe the displayed fonts, While alloWing for the entire vieW.
ate one Zone from another or to shoW signi?cance relative to 35
?gure out the signi?cance of each color. Alternatively, the
obtained With the display.
Referring to FIG. 7, the stretch option 310, illustrates the
65
a better perspective to the technician of the value depicted on
the chart in relation to the norm. HoWever, for certain reasons,
the technician may not Want to see the Whole pie, and only up
to the value shoWn. This can be necessary, for example, if the
display is limited, or the values shoWn need to be shoWn With
a greater magni?cation for the technician to see.
US 7,702,437 B2
9
10
The animation option 324 permits the sample shown, for
indicating varying levels of relative health of the vehicle
example, FIGS. 5-8, to be animated With random values or the
animation can shoW other changes in the chart in real -time or
the graphical depiction of the measured set of values;
according the placement of an icon relative to areas of
delayed time.
The invention can be realiZed as computer-executable
instructions in computer-readable media as shoWn in FIG. 4.
and
Wherein the video image is a plurality of concentric circles,
With measured values of the vehicle being located closer
The computer-readable media includes all possible kinds of
to center as the measured values are closer to the values
media in Which computer-readable data is stored or included
of the related normal set of values.
2. The method of claim 1, Wherein the icon includes a value
indicating the measured set of values of the health of the
vehicle.
or can include any type of data that can be read by a computer
or a processing unit. The computer-readable media include
for example and not limited to storing media, such as mag
netic storing media (e.g., ROMs, ?oppy disks, hard disk, and
the like), optical reading media (e.g., CD-ROMs (compact
disc-read-only memory), DVDs (digital versatile discs), re
Writable versions of the optical discs, and the like), hybrid
3. The method of claim 1, Wherein the video image further
comprises the graphical depiction of the values having a
dependency on a location Within the display to indicate the
comparison to the normal set of values.
4. The method of claim 1, Wherein the video image is
sectioned into a plurality of concentric circles With the mea
magnetic optical disks, organic disks, system memory (read
only memory, random access memory), non-volatile memory
such as ?ash memory or any other volatile or non-volatile
sured values being located according to the comparison to the
memory, other semiconductor media, electronic media, elec
tromagnetic media, infrared, and other communication media
normal set of values, and the concentric circles being sec
tioned further into a plurality of subdivisions, With each sub
division representing an additional dependency on a prede
termined variable.
5. The method of claim 1, further comprising of coloring or
20
such as carrier Waves (e.g., transmission via the Internet or
another computer). Communication media generally embod
ies computer-readable instructions, data structures, program
modules or other data in a modulated signal such as the carrier
Waves or other transportable mechanism including any infor
shading the regions of the video image according to a devia
25
tion from the normal set of values.
mation delivery media. Computer-readable media such as
6. The method of claim 1, further comprising of dividing
communication media may include Wireless media such as
different regions of the video image according to a set range
of deviations from the normal set of values.
radio frequency, infrared microWaves, and Wired media such
as a Wired netWork. Also, the computer-readable media can
store and execute computer-readable codes that are distrib
30
uted in computers connected via a netWork. The computer
readable medium also includes cooperating or interconnected
computer readable media that are in the processing system or
are distributed among multiple processing systems that may
be local or remote to the processing system. The invention can
as compared to the related normal set of values.
35
include the computer-readable medium having stored thereon
representing the techniques of the invention.
overlap the displayed image of the icon and related measured
The many features and advantages of the invention are
intended by the appended claims to cover all such features
and advantages of the invention Which fall Within the true
spirit and scope of the invention. Further, since numerous
modi?cations and variations Will readily occur to those
skilled in the art, it is not desired to limit the invention to the
exact construction and operation illustrated and described,
40
45
may be resorted to, falling Within the scope of the invention.
mation, comprising:
a communication interface connecting to the vehicle and
a memory connected to the communication interface, stor
50
What is claimed is:
1. A method of displaying a vehicle’s information, com
ing a softWare for displaying of the vehicle’s measured
information;
a processor connected to the memory and controlling the
softWare, the softWare including instructions for mea
suring a set values of the vehicle, and comparing the set
prising:
sured values being displayed on the video image in
relation to the certain region of the normal values;
value.
9. The method of claim 1, Wherein the steps of the method
comprise a set of computer executable instructions stored on
a computer readable media.
10.An apparatus for displaying a vehicle’ s measured infor
accommodating measuring of the vehicle’ s information
through a plurality of sensors;
and accordingly, all suitable modi?cations and equivalents
measuring via a computing device a set of diagnostic and
state values of the vehicle;
comparing via a processor of the computing device the set
of measured values With a set of related normal values,
the normal values being Within a preset range for opera
tion of the vehicle;
displaying on a display a video image having a graphical
depiction of the measured set of values in comparison to
the related normal set of values, With the related set of
normal values being predetermined and displayed at a
certain region of the video image, and the set of mea
8. The method of claim 1, Wherein the video image
includes a plurality of icons representing particular measured
variables of the vehicle and measured values being displayed
adjacent to the respective icons, and the icons and measured
values being moved around a concentric circle at a same
distance from a center of the concentric circle in order to not
a data structure including a plurality of ?elds containing data
apparent from the detailed speci?cation, and thus, it is
7. The method of claim 1, further comprising altering the
video image according to the display of the measured values
55
of measured values With a set of related normal values of
a vehicle of the same type as the vehicle being measured,
and operating Within a preset normal range;
a display displaying a video image having a graphical
depiction of the measured set of values in comparison to
60
65
the normal set of values of the same type of vehicle;
an icon con?gured to indicate varying levels of relative
health of the vehicle and positioned on the graphical
depiction of the measured set values; and
Wherein the video image is a plurality of concentric circles,
With measured values of the vehicle being located closer
to center as the measured values are closer to values of
the related normal set of values.
US 7,702,437 B2
11
12
11. The apparatus of claim 10, wherein the icon includes a
value indicating the measured set of values of the health of the
vehicle.
distance from a center of the concentric circle in order to not
overlap the displayed image of the icon and related measured
value.
18. A system for displaying a vehicle’s information, com
12. The apparatus of claim 10, Wherein the video image
further comprises a video depiction of the values having a
dependency on a location Within the display to indicate the
comparison to the normal set of values.
13. The apparatus of claim 10, Wherein the video image is
prising:
a means for measuring a set values of the vehicle;
a means for comparing the set of measured values With a set
of related normal values of a vehicle of the same type as
the vehicle being measured, and operating Within a pre
sectioned into a plurality of concentric circles With the mea
set normal range;
a means for displaying a video image having a graphical
depiction of the measured set of values in comparison to
the normal set of values of the same type of vehicle;
an icon con?gured to indicate varying levels of relative
health of the vehicle and positioned on the graphical
sured values being located according to the comparison to the
normal set of values, and the concentric circles being sec
tioned further into a plurality of subdivisions, With each sub
divisions representing an additional dependency on a prede
termined variable.
14. The apparatus of claim 10, further comprising of col
oring or shading different regions of video image according to
depiction of the measured set values; and
Wherein the video image is a plurality of concentric circles,
With measured values of the vehicle being located closer
a deviation from the normal set of values.
15. The apparatus of claim 10, further comprising of divid
ing different regions of the video image according to a set
to center as the measured values are closer to value of the
related normal set of values.
19. The system of claim 18, Wherein the icon includes a
value indicating the measured set of values of health of the
vehicle.
range of deviations from the normal set of values.
16. The apparatus of claim 10, further comprising altering
the video image according to the display of the measured
values as compared to the related normal set of values.
17. The apparatus of claim 10, Wherein the video image
includes a plurality of icons representing particular measured
variables of the vehicle and measured values being displayed
adjacent to the respective icons, and the icons and measured
values being moved around a concentric circle at a same
25
20. The system of claim 18, Wherein the video image
further comprises a video depiction of the values having a
dependency on a location Within the means for displaying to
indicate the comparison to the normal set of values.
*
*
*
*
*