1
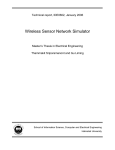
RPI Graph and Statistics Package for ns
User Manual and Tutorial
David Harrison
RPI CS Department∗
June 18, 2003
Abstract
This user manual contains an installation guide and a short tutorial for the RPI graphing
tools for ns.
1
Introduction
The RPI graph and statistics package provides a set of classes for generating commonly used plots
and gathering commonly important statistics. The graph package abstracts data collection from
rendering. Each graph object instantiates a set of data collection objects which are attached to
components in a network topology, as the simulation runs the data collection objects collect data
often outputting the data to an intermediate file. After simulation, the graph object conforms the
data to a canonical format and then sends it to a PlotDevice for rendering. By substituting plot
devices, the user can cause the same graph to be output to a window or a file using gnuplot, fig,
xgraph, xdvi, ghostview, or acroread. In Figure 1 we show a utilization graph that collects data
from a link in an ns simulation and then outputs to a gnuplot plot device. The gnuplot plot device
translates the data and commands from the utilization graph into gnuplot commands. The gnuplot
application then generates an encapsulated postscript file. Other scenarios include rendering a
graph with multiple plot devices for example to generate a postscript file while simultaneously
displaying the data in an X window using xgraph. Or multiple graphs may be output to the same
acroread plot device so that the graphs appear in a single acroread window in the given order.
2
Installation
Presumably you already have the distribution and have installed ns-2. The graph package has
been tested with ns-2.1.b5, ns-2.1b9a, and ns-2.26. There may be incompatibilities with other ns
versions. If you have not downloaded the graph package then get it from
http://www.ecse.rpi.edu/~harrisod/graph-v6.1.1.tar.gz.
In order for the statistics and graphing packages to function, you must define two environment
variables: the NS environment variable must point to the root of the ns source code tree, and
the NSVER environment variable must contain the ns version number (e.g., ns-2.1b5 has version
∗
I am now in the EECS department at UC Berkeley and can be reached at [email protected].
1
1
2
ByteCounter
Simulation
byte arrivals in last
interval
(x,y) values,
plot title,
axes labels
postscript
PlotDevice
(x,y) values
gnuplot
commands
gnuplot
application
Bottleneck Utilization vs Time
1
0.8
utilization
UtilizationVersusTime
encapsulated
postscript
=
0.6
0.4
sample interval=0.1s
0.2
0
0
0.5
1
1.5
2
2.5
3
time (seconds)
3.5
4
4.5
5
Figure 1: UtilizationVersusTime Graph outputting via gnuplot PlotDevice
“2.1b5”). The following directions apply to ns version 2.1b5 and ns 2.1b7. Make a backup of your
ns source code tree before attempting this installation.
Before continuing make sure the following are in your search path:
• nam,
• acroread,
• ghostview,
• gnuplot,
• latex,
• pdflatex,
• xdvi,
• and xgraph.
nam is necessary to run network animations. The remaining applications are used in the process
of creating graphs. Not all of the applications are necessary to use the graph package though
some PlotDevice classes will not function. See Table 2 for the list of PlotDevice classes and the
dependencies between these classes and the applications.
1. If you have an earlier version of the graph package then remove it as follows, but only after
backing up your ns source code tree.
> cd $NS
> rm -r rpi
> rm -r tcl/rpi
2. Change to a temporary directory and then untar graph as follows:
2
> gunzip graph-v6.1.1.tar.gz
> tar -xf graph-v6.1.1.tar
> cd graph-v6.1.1
3. Move directories from the distribution into your $NS distribution.
> cp -r rpi $NS
> cp -r tcl/rpi $NS/tcl/rpi
> cd $NS
4. Insert the following lines in your ns Makefile
[...]
INCLUDES= \
-I. -Irpi \
[...]
OBJ_CC= \
[...]
rpi/byte-counter.o rpi/delay-monitor.o rpi/file-tools.o \
rpi/rate-monitor.o rpi/rpi-flowmon.o rpi/rpi-queue-monitor.o \
[...]
Here “INCLUDES= \” and “OBJ_CC= \” should already appear in your Makefile. “[...]”
refers to an omission of lines already appearing in your Makefile.
5. Rebuild ns
>
>
>
>
cd $NS
rm gen/*
make depend
make
6. Test ns
Change to the directory $NS/tcl/rpi/tests. Type
run-test-suite.sh
This will test the RPI Graphing and Statistics package. You should see the following output:
ByteCounter Test:
DelayMonitor Test:
file-tools.tcl test:
link-stats Tests:
...
PASSED
PASSED
PASSED
PASSED all 59 tests on the link-stats.tcl file.
3
After the text above, the test suite calls graph test/graph-test.tcl, which generates a set of
graphs and displays them using a variety of plot devices. The suite first employs the “xdvi”
PlotDevice that uses the postscript and latex PlotDevices to create graphs and descriptive text
respectively. The “xdvi” PlotDevice then displays the generated DVI file using the “xdvi” application.
Carefully inspect the generated plots for correctness against the plots bearing the label “Comparison Graph.” Because of the visual nature of the graphing tools and slight differences between
versions of the various graphing applications, we found that the only reliable way to test the PlotDevice classes was through visual inspection. NOTE: That your output may not look exactly
the same as the provided comparison graphs. Look for differences in content rather than small
differences in presentation (e.g., ignore font differences).
4
3
Tutorial
All of these examples assume a working knowledge of ns. If you have not created ns scripts before
then consult the ns documentation and write a few test scripts before proceeding from here.
Currently the graph package provides the graphs shown in table 1.
Except for the XY class, an instance of any of these classes gathers statistics directly from an
ns simulation and renders a plot when the instance’s plot member function (i.e., TCL instproc) is
called. The XY class simply allows script writers to generate a plot from an arbitrary set of (x, y)
coordinates. The XY class represents a way for a script writer to use the PlotDevice classes as a
generic interface to a variety of output devices.
CWndVersusTime
FlowQLenVersusTime
PointToPointDelayVersusTime
QDelayVersusTime
QLenVersusTime
RateVersusTime
REDQueueVersusTime
RTTVarianceVersusTime
RTTVersusTime
Sequence
SRTTVersusTime
UtilizationVersusTime
XY
TCP congestion window size versus time
sampled per-flow queue contribution versus time
delay between two points on the network
sampled queuing delay versus time
sampled queue length versus time
arrival rate versus time over constant interval length
avg queue, instant queue versus time
TCP variance in round-trip-time versus time
TCP round-trip time versus time
TCP sequence number versus time
TCP smoothed round-trip time versus time
utilization versus time over constant interval length
plot (x, y) coordinates from an input file
Table 1: Provided Graph classes
3.1
Example 1: Graphing link statistics
To include the graph package we preface every experiment script with the following:
source $env(NS)/tcl/rpi/graph.tcl
The graph package contains several graphs for gathering statistics about traffic passing through
a link including queue length versus time, utilization versus time, rate versus time, and queue delay
versus time. In this example we will show how to graph utilization over given fixed intervals versus
time.
Assume we have created a topology with a known bottleneck spanning ns nodes n0 and n1. Next
we add the lines shown in figure 2 to our script. To collect statistics for our graph we instantiate
a Graph/UtilizationVersusTime object. The arguments $n0 and $n1 tell the graph object to
collect statistics for the link spanning between nodes n0 and n1. The 0.1 argument tells the graph
object that it should measure utilization over 0.1 second intervals. When the simulation finishes,
we call $util_graph display to tell the graph object to show a window containing our utilization
versus time plot generated using gnuplot. We show the complete source code for this script in
graph-v6.1.1/examples/ex1.tcl, and the generated graph in figure 3.
5
'
$
[...]
proc finish {} {
global util_graph
[...]
$util_graph display
exit 0
}
[...] ;# define nodes n0 and n1 and link spanning them.
# create graph of utilization vs time for link [n0,n1].
set util_graph [new Graph/UtilizationVersusTime $n0 $n1 0.1]
&
%
Figure 2: Utilization versus time script: ex1.tcl
Bottleneck Utilization vs Time
1
utilization
0.8
0.6
0.4
sample interval=0.1s
0.2
0
0
0.5
1
1.5
2
2.5
3
time (seconds)
3.5
4
4.5
5
Figure 3: Graph generated by ex1.tcl
3.2
Example 2: Outputting to Various Plot Devices
The graph package can output graphs to windows or files using various applications or formats for
displaying/saving graphs. We show the current set of supported “plot devices” in table 2.
In graph-v6.1.1/examples/ex2.tcl we provide an example script that uses an xdvi plot
device to display multiple graphs in the same window in the designated order. One of the first
things we do in this script is to create a plot device:
Graph set plot_device_ [new xdvi]
Here we create an instance of the xdvi class and assign it to the Graph plot_device_ class
member. Whenever a graph object is instantiated it by default uses the plot device defined in the
6
acroread
fig
ghostview
gnuplot
gnuplot35
latex
pdf
postscript
postscript35
xdvi
xgraph
When closed, display all graphs plotted with this device using acroread. Uses postscript PlotDevice and the pdflatex
application.
Output to fig file via gnuplot.
Output eps via gnuplot then display using ghostview
Show plot in X window using gnuplot.
Show plot in X window using gnuplot 3.5 (no comments).
Output to eps file using the postscript PlotDevice and run
latex to create a latex file that includes the graphs.
Output to pdf file from eps using epstopdf.
Output to encapsulated postscript via gnuplot.
Output to eps via gnuplot 3.5 (no comments).
When closed, display all graphs plotted with this device using
xdvi.
Show plot in X window using xgraph.
Table 2: Supported plot devices
Graph plot_device_ class member. All of the classes can be instantiated by passing a plot device
object to their respective init instprocs. This allows you to use a different plot device for each
graph object if you so wish.
We show the relevant snippets from the ex2.tcl script in figure 4. Not shown in figure 4 we
create a topology containing a bottleneck between nodes $n0 and $n1. We then define two TCP
connections that pass through the bottleneck. The first of these two connections has the TCP
agent object $tcp0. Shown in figure 4, we create three graph objects of which the first two install
statistics gathering objects into the bottleneck link from n0 to n1. The last graph object traces
the congestion window of tcp0. When the simulation completes we output each of the graphs to
encapsulated postscript by calling each object’s display instproc. Next we close the plot device
causing the plot device to compile a latex file that references the eps files generated by each graph
object. The latex compiler outputs an dvi file which the plot device then opens using xdvi.
3.3
Example 3: Outputting Graphs as Files
Often we want to generate graphs as files for inclusion in a report or paper. In the previous example
we showed how to output into xdvi. In this example we consider outputting to a fig file for later
annotation using xfig. With this example we also take into consideration where generated files are
placed in the file system.
We show code snippets for Example 3 in Figure 5. Example 3 differs from Example 2 only in
that we use a different plot device, in this case fig, and we explicitly tell util_graph to output to
the file named
bneck_util_vs_time
in the current working directory. Note that this is not the exact filename of the output file. The
plot device appends an id unique to the plot device and then appends a file type extension. The
actual output file’s name is
bneck_util_vs_time_0.fig .
Note that setting output_filename_ does not affect the location of any trace or other temporary
7
'
$
[...]
Graph set plot_device_ [new xdvi]
[...]
proc finish {} {
global util_graph qlen_graph cwnd0_graph
$util_graph display
$qlen_graph display
$cwnd0_graph display
[Graph set plot_device_] close
run-nam
exit 0
}
[...]
;# define a bottleneck between n0 and n1.
set util_graph [new Graph/UtilizationVersusTime $n0 $n1 0.1]
$util_graph set title_ "Bottleneck Utilization vs Time"
set qlen_graph [new Graph/QLenVersusTime $n0 $n1]
$qlen_graph set title_ "Bottleneck Queue Length Versus Time"
set cwnd0_graph [new Graph/CWndVersusTime $tcp0]
$cwnd0_graph set title_ "cwnd of flow 0 versus Time"
[...]
&
%
Figure 4: Example 2: Display multiple graphs using xdvi
files. All temporary files are by default written to a temporary directory located in /tmp/expx where
x is replaced with smallest integer that has not already been used in the naming of another exp
directory in /tmp. The user can change the default directory by setting tmp_directory_ global
variable before instantiating any Graph objects. However, this is only advisable if the user is sure
that the directory used to store temporary files resides on the same machine that is executing the
script, since writing across a network will not only slow down the simulation but may adversely
affect other users sharing the network.
If the user does not set the output_filename_ data member then the output file is placed in
tmp_directory_ with a default name specific to the Graph class.
3.4
Example 4: Multiple Plot Devices
Note that the caller can output the same graph object to both a file and a window by using two plot
devices. In ex4.tcl we use xfig and postscript to generate encapsulated postscript while displaying
the graph using xfig. We show the relevant code snippet in Figure 6. Notice that we do not call
8
$
'
[...]
Graph set plot_device_ [new fig]
[...]
set util_graph [new Graph/UtilizationVersusTime $n0 $n1 0.1]
$util_graph set title_ "Bottleneck Utilization vs Time"
$util_graph set output_filename_ "bneck_util_vs_time"
[...]
&
%
Figure 5: Example 3: Outputting Graphs to Files
the “display” instance procedure on the graph object. The “display” method plot using the default
PlotDevice. We have not defined a default plot device in this script. Instead we pass the graph
directly to two different plot devices.
Note that often times there is little need for more than one plot device since plot devices create
intermediate files of the desired type (e.g., xdvi creates encapsulated postscript files for each graph).
Multiple plot devices is more useful when the desired file type is not generated as an intermediate
file when displaying the graph in a window as in ex4.tcl.
'
$
[...]
proc finish {} {
[...]
set xgraph_plotter [new xgraph]
set eps_plotter [new postscript]
$xgraph_plotter plot $util_graph
$eps_plotter plot $util_graph
$xgraph_plotter close
$eps_plotter close
[...]
}
[...]
set util_graph [new Graph/UtilizationVersusTime $n0 $n1 0.1]
$util_graph set title_ "Bottleneck Utilization vs Time"
$util_graph set output_filename_ "bneck_util_vs_time"
[...]
&
%
Figure 6: Example 4: Output to a file and to an X window using xgraph
3.5
Example 5: Bottleneck link statistics
We now move on to demonstrating how to collect statistics using the statistics functions included
with the graph package. The objective of these statistics gathering tools is to simplify statistics
9
gathering over the standard methods provided by ns.
To include the link statistics gathering functions do the following:
source $env(NS)/tcl/rpi/link-stats.tcl
To begin gathering statistics on a link spanning from nodes n0 to n1, do the following:
set stats [new LinkStats $n0 $n1]
We show code snippets from examples/ex5.tcl in figure 7. The calls to get-utilization,
get-mean-queue-delay, and get-packet-arrivals returns the link statistics gathered from the
moment the link-stats object was instantiated. In this case, that means reporting statistics gathered
from the beginning of the simulation. There are many more statistics we could report by simply
calling any of the instance procedures in table 4.
'
$
[...]
proc finish {} {
global n0 n1 tcp0 tcp1 stats
# output link statistics
puts "Bottleneck statistics: "
puts "Utilization: [$stats get-utilization]"
puts "Number of drops: [$stats get-packet-drops]"
puts "Mean queue delay [$stats get-mean-queue-delay]"
puts "Number of arrivals [$stats get-packet-arrivals]"
[...]
}
[...]
;# create topology w/ bottleneck between n0 and n1.
set stats [new LinkStats $n0 $n1]
[...]
&
%
Figure 7: Example 5: Gathering link statistics
If you wish to gather statistics starting from some time into the simulation then simply instantiate the LinkStats object at that time. If you want to gather statistics over consecutive
time intervals then you can reset the link statistics at the end of each time interval by calling
the LinkStats reset instance procedure. If you want to collect a link’s statistics for overlapping
intervals then create two LinkStats objects each at a time when you want to begin collecting statistics then retrieve the statistics at the end of their respective intervals. Installing more than one
LinkStats object on a link is particularly useful when you want to record statistics for the whole
simulation as well as for the steady-state (i.e., skipping some time to eliminate initial transients).
We provide the code for this complete example in graph-v6.1.1/examples/ex4.tcl.
10
init n0 n1 [qmon]
Instantiates a LinkStats object spanning between n0 and n1.
You must have previously created these two nodes and a link
spanning these nodes. More than one LinkStats object can
span between n0 and n1. By default the LinkStats object uses
an instance of the RPIQueueMonitor class to collect statistics.
You can install your own queue monitor using the optional
third argument.
reset
resets all statistics to the initial state.
Table 3: Special instance procedures for LinkStats
11
get-utilization
Returns the link utilization as the number of bytes
departing the queue as the number of bytes that could
have departed the queue.
get-packet-utilization avgpktsz
Returns the link utilization as the number of packets
that departed the bottleneck link times the average
packet size over the number of average sized packets that could have departed the link. The argument
specifies the average packet size.
get-throughput
Returns the number of byte arrivals at the tail of the
queue * 8 over time.
get-packet-arrivals
Returns the number of packet arrivals at the tail of
the queue.
get-byte-arrivals
Returns the number of byte arrivals at the tail of the
queue.
get-packet-drops
Returns the number of packets dropped.
get-byte-drops
Returns the number of bytes dropped.
get-packet-departures
Returns the number of packets that departed the
queue.
get-byte-departures
Returns the number of bytes that departed the queue.
get-mean-queue-delay
Returns the mean delay experienced by packets transiting the queue.
get-queue-delay-variance
Returns the variance in delay experienced by packets
transiting the queue.
get-queue-delay-stddev
Returns the standard deviation in delay experienced
by packets transiting the queue.
get-mean-packet-queue-length
get-mean-byte-queue-length
Returns the mean packet queue length. This is not
the same as the mean queue length seen by an arriving
packet which would not take into account idle times
in the mean.
Same as get-mean-packet-queue-length except the
result is returned in units of bytes.
get-max-packet-queue-length
Returns the maximum queue length in packets.
get-max-byte-queue-length
Returns the maximum queue length in bytes.
get-min-packet-queue-length
get-min-byte-queue-length
Returns the minimum queue length in bytes. Typically this would be zero except when measured over
some small interval.
Same as get-min-byte-queue-length except the result is returned in units of bytes.
Table 4: LinkStats statistics instance procedures
12
3.6
Example 5: TCP statistics
The most direct way to obtain TCP statistics is to simply query the bound variables defined for
the Agent/TCP class. For example, if we define a TCP agent $tcp0 then we can do the following
without extending ns-2:
puts "Number of data packets transmitted by flow 0: \
[$tcp0 set ndatapack_]"
puts "Number of data packets transmitted by flow 1: \
[$tcp1 set ndatapack_]"
puts "Retransmission timeouts for flow 0: \
[$tcp0 set nrexmit_]"
puts "Retransmission timeout for flow 1: \
[$tcp1 set nrexmit_]"
When using our TCP statistics gathering functions it is necessary to include the tcp-stats.tcl
package. This loads the definitions shown in tables 5 and 6:
source $env(NS)/tcl/rpi/tcp-stats.tcl
Then initialize various counters by calling init-stats. init-stats can also be called to simply
reset the the statistics for both our extensions and the statistics gathered by ns-2.1b5.
[...]
$tcp init-stats
[...]
At some later time, such as when finish is called, you can output tcp-statistics as follows:
puts "Goodput Variance: \
[get-goodput-stddev "$tcp0 $tcp1"]"
puts "Total TCP packets: \
[get-total-data-packets "$tcp0 $tcp1"]"
In the example above, get-goodput-stddev and get-total-data-packets operate on a list
of tcp agents. In this case returning the standard deviation in goodput and the sum of the data
packets sent respectively across the passed list of agents. The above examples can be found in
examples/ex6.tcl.
4
Performance Issues
When one is running large or long simulations, there are various considerations to take into account
with respect to the tools used for gathering statistics or generating statistics. Our tools have been
defined to introduce reasonable overhead, though in some cases simulation performance constraints
may drive one to design task-specific tools. We outline some of the performance considerations in
this section.
13
get-useful-packets
get-useful-bytes
Returns the number of packets transmitted containing new
data.
Returns the number of bytes transmitted containing new
data. The number of useful bytes in each useful packet
is the packet size minus the TCP and IP headers.
The header size is determined by tcpip_base_hdr_size_
defined in $NS/tcl/lib/ns-default.tcl.
In ns-2.1b5,
tcpip_base_hdr_size_ is set to 40.
get-goodput-bps
Returns the rate of useful bits transmitted by the network.
Uses get-useful-bytes to determine the total number of useful
bits. Packets that have been lost but not yet detected by the
source are counted as useful because our measure is based on
state maintained by the TCP source. In a long simulation
this should have negligible impact on the goodput measure.
get-goodput
Returns goodput in bps over the bottleneck capacity.
Table 5: TCP statistics gathering instance procs
4.1
When to Use NAM, Graph, and Stats
nam tracing is best used to generate animations. For any simulation containing more than a handful
of nodes, containing bottlenecks with large bandwidths (> 10 Mbps), and/or running more than a
couple of seconds, nam tracing will probably be too slow. nam is slow because in order to generate
network animations ns outputs to a trace file every time a packet enters, departs, or is dropped from
any queue in the simulated network. Simply turning nam tracing off often reduces simulation run
times by an order of magnitude. In particular, if you are parsing nam traces to generate statistics
then perhaps you should consider using some other tool.
Graph objects sit on a single link or deal with a single TCP agent. Unless the user wants to
generate graphs for every link in the simulated network, installing Graph objects will probably
yield significantly less overhead in terms of simulation run time and disk space consumption than
generating graphs by post-processing nam traces. Of course, the Graph objects are best used
for generating graphs, any other use of the Graph classes or their respective intermediate files is
suspect. The Graph objects generate trace files (though substantially smaller than nam traces),
and useful statistics might be derived from these traces. However, if you only want to determine
a single statistic across the length of a simulation then the functions found in link-stats.tcl or
tcp-stats.tcl are probably better for the job.
The link-stats.tcl and tcp-stats.tcl functions generate far less overhead than either nam
or the Graph classes, simply because none of the link-stats.tcl or tcp-stats.tcl generate
trace or other intermediate files. Instead the LinkStats object installs counters in the link being
monitored. Incrementing a counter introduces far less overhead than outputting to a file. When
the user later requests the statistic, the corresponding components are then queried. However,
the LinkStats object installs objects for measuring a large array of link statistics. Sometimes
this means installing unnecessary counters or similar objects into the links being monitored. For
example, the LinkStats object installs objects at the tail and head of the link’s queue. Placing an
object at the queue’s head is unnecessary if the script writer only wants to know the number of
14
get-mean-goodput tcplist
Calculates mean goodput in bps across the
passed TCP agents (i.e., connections).
get-goodput-variance tcplist
Calculates variance in goodput (bps) across
the passed TCP agents (i.e., connections).
get-goodput-stddev tcplist
Calculates the standard deviation in goodput
in bps across the passed TCP agents (i.e., connections).
Calculates the Coefficient of Variation
(C.O.V.) across the passed TCP agents.
C.O.V. is standard deviation over the mean.
Calculates the sum of the packets sent across
the passed TCP agents (i.e., connections).
get-goodput-cov tcplist
get-total-data-packets tcplist
get-total-retransmitted-packets tcplist
Calculates the sum of the packet retransmissions across the passed TCP agents (i.e., connections).
get-total-retransmission-timeouts tcplist
Calculates the sum of the retransmission timeouts across the passed TCP agents (i.e., connections).
Table 6: TCP statistics functions operating on lists
bytes that arrived at the head of the queue. Usually the few extra objects represents negligible
overhead. However, if the script writer has particularly tight performance constraints then the
script writer will have to write his or her own objects designed specifically to gather the desired
statistics.
5
Other Performance Issues with Graphs
There are two other important performance issues with regard to the graph classes: 1) where to
output files, and 2) using averaging intervals.
The cost of outputting to one file is not necessarily the same as the cost of outputting to another
file. The disparity is particularly large between local and remotely mounted files. A trace file should
probably never be placed on a volume mounted across a network, because each write may generate
a packet. Consider for nam that this would mean generating a packet on the real network for every
packet arrival, departure, or drop in the simulated network. A single NAM simulation can easily
swamp a file server while simultaneously drastically slowing down simulation run times.
Instead, trace and other intermediate files are usually output to a temporary directory. In
UNIX, /tmp resides on a workstation’s local hard drive; therefore, that is why the Graph package
by default places all intermediate as well as output files in /tmp (see Example 3).
Now this brings us to the second important performance issue: averaging. Several of the
Graph classes allow the user to specify whether to output instantaneous or time averaged values. For example, QLenVersusTime’s third argument to its init instproc (i.e., its constructor)
is sample_interval. By default, the sample interval is set to -1 denoting that QLenVersusTime
15
should record the queue length at every arrival and departure of a packet. This results in particularly large generated files and slow run times, but it also allows the user to easily see transient
queuing behavior. If the user wishes to improve simulation run times or reduce the size of trace
files, the user can set sample_interval to a positive value denoting the time interval over which
the queue length is averaged. At the end of each interval, the average is output to the graph’s trace
file. Larger averaging intervals result in shorter run times at the expense of generating graphs with
smoother output (i.e., less transient behavior is revealed).
6
LinkStats and TCP Stats and Long Run Times
When simulations are run for long times or when bottleneck bandwidths are high, it is quite possible
that certain signed long integers (32-bit) will overrun causing erroneous results from LinkStats
objects. To fix this problem the user should perform some worst-case analysis of the number
of bytes or packets that will pass through a link before running a simulation. We specifically
mention “bytes” because byte counters tend to increment much faster than any other counters in
a simulation. To avoid overruns, the simulation script must periodically reset the corresponding
counters by calling LinkStats’ reset member function (i.e., TCL instproc) or TCP’s init-stats
member function depending on the statistic that is in danger of an overrun. The simulation script
can then either store the intermediate values of the statistic for later post-processing or only rely
on the final value.
16