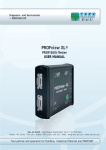
Download PROFIBUS-Tester 3
Transcript
PROFIBUS-Tester 3 User Manual Softing AG • Richard-Reitzner-Allee 6 • D-85540 Haar Telefon: +49 (89) 456 56 – 0 • Telefax: +49 (89) 456 56 – 399 E-Mail: [email protected] • W eb: www.softing.com User Manual Version: 1.2 Date: 4/7/2005 Softing AG Richard-Reitzner-Allee 6 8550 Haar Deutschland Telefon: Telefax: E-Mail: W eb: +49 (89) 456 56 – 0 +49 (89) 456 56 – 399 [email protected] http://www.softing.com Revision Overview User Manual PROFIBUS-Tester 3 Revision Overview Date Revision Change(s) 11/9/2004 0 First version 3/10/2005 1 Update and documentation of the function extensions 4/7/2005 2 Corrections © Copyright 2005 Softing AG Subject to change without prior notice. Our policy is one of continuous improvement, and consequently the equipment may vary from the description and specification in this publication. The specifications, illustrations and descriptions provided in this documentation are not binding in detail. No part of this publication may be reproduced in any form, or by any means, without the prior written permission of Softing AG. All rights according to the copyright law expressly reserved to Softing AG. Note: To use the PROFIBUS Tester 3 and to understand this Manual, general knowledge of the PROFIBUS field bus system and of the RS485 transmission technology is required. II PROFIBUS-Tester 3 User Manual PROFIBUS-Tester 3 Table of Contents Table of Contents 1 Introduction.....................................................................................................................................................1 2 Start-up............................................................................................................................................................3 2.1 Receiving inspection and testing..............................................................................................................3 2.2 Acclimatizing the device ..........................................................................................................................3 2.3 Connecting the device..............................................................................................................................3 2.3.1 Design..............................................................................................................................................3 2.3.2 Mains connection.............................................................................................................................4 2.3.3 PROFIBUS connection....................................................................................................................4 2.3.4 Connecting the PROFIBUS Tester to a storage oscilloscope.........................................................4 2.3.5 Connecting the device to the PC......................................................................................................4 2.4 Prevention of accidents............................................................................................................................4 3 Description of Functions and Measuring Principle....................................................................................5 3.1 The most important measuring functions.................................................................................................5 3.2 Measuring the physical bus characteristics..............................................................................................5 3.2.1 General quality level (incl. glitch, edge and level errors)..................................................................5 3.2.2 Disturbance-free voltage range........................................................................................................6 3.2.3 Edge steepness...............................................................................................................................7 3.2.4 Signal waveform (oscilloscope display)...........................................................................................7 3.2.5 Measuring cycles and measuring time.............................................................................................7 3.2.6 Triggering to a station address.........................................................................................................8 3.3 Online monitoring functions......................................................................................................................8 3.3.1 Bus status........................................................................................................................................8 3.3.2 Bus cycle time .................................................................................................................................8 3.3.3 Illegal frames....................................................................................................................................8 3.4 Help functions...........................................................................................................................................9 3.4.1 Master simulator...............................................................................................................................9 3.4.2 Station scan....................................................................................................................................10 3.4.3 Detection of duplicated addressing................................................................................................10 3.4.4 Topology scan................................................................................................................................10 3.5 Working with measuring points..............................................................................................................11 4 The PBT3 Application Software..................................................................................................................12 4.1 System requirements.............................................................................................................................12 4.2 Installing the software.............................................................................................................................12 4.3 General notes on operation....................................................................................................................13 4.3.1 Help................................................................................................................................................13 4.3.2 Data saving....................................................................................................................................13 4.4 Program structure..................................................................................................................................13 4.4.1 Menu bar........................................................................................................................................14 4.4.2 Toolbar...........................................................................................................................................14 4.4.3 Message bar..................................................................................................................................15 4.4.3.1 Bus status..............................................................................................................................15 PROFIBUS-Tester 3 III Table of Contents User Manual PROFIBUS-Tester 3 4.4.3.2 Illegal frames..........................................................................................................................16 4.4.3.3 Bus cycle time........................................................................................................................16 4.4.3.4 Master simulator....................................................................................................................17 4.4.4 Status bar.......................................................................................................................................17 4.5 "Configure segment" view......................................................................................................................17 4.5.1 Segment.........................................................................................................................................17 4.5.1.1 Baud rate scan.......................................................................................................................18 4.5.1.2 Station scan (and detection of duplicated addressing)..........................................................18 4.5.1.3 Topology scan........................................................................................................................18 4.5.2 Recording the online monitoring....................................................................................................19 4.5.3 Evaluation.......................................................................................................................................19 4.5.4 Station list.......................................................................................................................................19 4.5.5 List of measuring points.................................................................................................................20 4.5.6 Topology display............................................................................................................................21 4.6 "Measure All Stations" view....................................................................................................................21 4.6.1 How to use.....................................................................................................................................21 4.6.2 Setting and measuring...................................................................................................................21 4.6.3 Evaluation.......................................................................................................................................22 4.7 "Measure One Station" view...................................................................................................................23 4.7.1 How to use.....................................................................................................................................23 4.7.2 Setting and measuring...................................................................................................................23 4.7.3 Evaluation.......................................................................................................................................25 4.8 "Measure Logger" view...........................................................................................................................25 4.8.1 How to use.....................................................................................................................................25 4.8.2 Setting and measuring...................................................................................................................25 4.8.3 Evaluation.......................................................................................................................................27 4.9 "Statistics of measuring points"..............................................................................................................27 4.10 Printing a test record............................................................................................................................27 4.11 Exporting measurement data...............................................................................................................28 4.11.1 CSV file........................................................................................................................................28 4.11.2 Graphics.......................................................................................................................................29 4.12 Settings.................................................................................................................................................29 4.12.1 General settings...........................................................................................................................29 4.12.2 Tester contact data......................................................................................................................29 4.13 DMF information...................................................................................................................................29 4.14 The "PROFIBUS Tester Scan" program..............................................................................................30 5 Technical Specifications.............................................................................................................................31 6 Scope of Supply...........................................................................................................................................33 7 Maintenance and Customer Service..........................................................................................................34 7.1 Maintenance...........................................................................................................................................34 7.2 Customer service...................................................................................................................................34 7.2.1 Shipping.........................................................................................................................................34 7.2.2 Support...........................................................................................................................................34 IV PROFIBUS-Tester 3 User Manual PROFIBUS-Tester 3 Table of Contents 7.2.3 Warranty and limitation of liability...................................................................................................34 8 Ordering Information...................................................................................................................................35 9 Problem Recovery........................................................................................................................................36 9.1 Problems with the PBT3 device setup...................................................................................................36 9.2 Problems when measuring.....................................................................................................................36 10 Notes............................................................................................................................................................38 PROFIBUS-Tester 3 V List of Tables User Manual PROFIBUS-Tester 3 List of Tables Table 1: Description of the measuring cycles ................................................................................................... 7 Table 2: Device types with their styling in the station list ................................................................................. 20 Table 3: Technical specifications .................................................................................................................... 31 Table 4: Technical specifications (cont'd) ....................................................................................................... 32 Table 5: Ordering information .......................................................................................................................... 35 VI PROFIBUS-Tester 3 User Manual PROFIBUS-Tester 3 List of Figures List of Figures Fig. 1: Connections of the PBT3 ....................................................................................................................... 3 Fig. 2: Measuring principle for disturbance-free voltage range and signal level ............................................... 6 Fig. 3: Structure of the PBT3 application software .......................................................................................... 13 Fig. 4: Toolbar ................................................................................................................................................. 14 Fig. 5: Elements of the message bar .............................................................................................................. 15 Fig. 6: Status bar ............................................................................................................................................. 17 Fig. 7: Elements of the "Configure segment" view .......................................................................................... 18 Fig. 8: "Measure All Stations" view .................................................................................................................. 22 Fig. 9: "Measure One Station" view ................................................................................................................. 24 Fig. 10: "Measure Logger" view ....................................................................................................................... 26 Fig. 11: Test record settings ............................................................................................................................ 28 Fig. 12: DMF information ................................................................................................................................. 30 Fig. 13: "PROFIBUS Tester Scan" .................................................................................................................. 30 PROFIBUS-Tester 3 VII Terms, Definitions and Abbreviations Used in This Manual User Manual PROFIBUS-Tester 3 Terms, Definitions and Abbreviations Used in this Manual Baud rate Data transfer rate (1 baud = 1 bit/s) Differential voltage is the voltage between the RS485 signal lines A (pin 8) and B (pin 3) UD = UB - UA Disturbance-free voltage range The term 'disturbance-free voltage range' is used to denote a voltage range of the differential voltage for a selected station over the whole frame, whose limits are not violated - not even momentarily - over the evaluation period. DMF Device master file; description of the technical data of a PROFIBUS device DSO Digital storage oscilloscope Evaluation period 10/16th of the bit width around the bit center (RS485 transceiver-sample point), within which the disturbance-free voltage range is measured Firmware Software for a microprocessor FPGA Field Programmable Gate Array – programmable logic array for real-time functions Idle Bus condition or transmission break between two successive frames ID number Device code of a PROFIBUS device used for assignment to the device master file (DMF). Illegal frames Frames which do not conform to IEC 61158-3 (with protocol errors) Master Active bus station (usually the PLC) coordinating the access to the bus Relevant frame The term 'relevant frame' is used if a frame contains the source address of the bus station to be measured (or the short acknowledgment following a request frame issued to this station) Segment PROFIBUS section terminated on both line ends using a powered resistor combination. A repeater which is either inserted between line ends or else connected to one line end also constitutes a segment termination. Slave Bus station which as a rule only sends to the bus upon request by the master (e.g. digital I/O) Token Frame (SD4) which is exchanged between the active stations (masters) to control the access to the PROFIBUS VIII PROFIBUS-Tester 3 User Manual PROFIBUS-Tester 3 1 Introduction 1 Introduction Thank you for purchasing PROFIBUS Tester 3 (PBT3)! You have acquired a tool which will support you in the start-up, monitoring and servicing/maintenance of your PROFIBUS plant. Thanks to its wide range of applications, its high data transfer rates and above all its high tolerance against interference in the field of plant automation, PROFIBUS has become well established over the last few years. Nonetheless, particularly when starting up new plants, though also during operation, a wide diversity of problems may occur, quickly resulting in undesirable and often expensive failures. Errors in the application software of the plant are often assumed to be the causes. Experience, however, has shown that the most of the problems occurring are attributable to the use of inappropriate cable types, improper installation of the bus cables or disturbed driver functions at individual PROFIBUS stations. Typical error causes for a disturbed communication on the PROFIBUS are: missing, unpowered or surplus bus terminations overlong bus lines and/or dead-end branches, wrong cable types predamaged/defective bus drivers excessive transfer resistances due to aging/corrosion cable routing in environments subject to strong interference Frames with a bad signal quality can only by detected via an analysis of the physical bus characteristics, permitting errors and their causes to be detected specifically. Early and regular checks, beginning already at start-up, help locate fault sources before they lead to failures. Such checks increase the signal quality, the bus works reliably and is more resistant in terms of EMC. The PROFIBUS Tester 3 will help you efficiently in checking your PROFIBUS system and in finding faults and their causes. To this end, it provides the following scope of functions: passive bus coupling during operation automatic detection of the baud rate used automatic determination of all stations in the plant (LiveList) bus-station and measuring-point-related display of the signal conditions: general quality level (incl. glitch, edge and level errors) disturbance-free voltage range and edges oscilloscope display (at least one rising edge) long-term monitoring (logger) for all stations continuous display and recording of the current, minimum and maximum bus cycle time real-time monitoring of the whole data traffic and checking for frame errors PROFIBUS-Tester 3 1 1 Introduction User Manual PROFIBUS-Tester 3 integrated master simulator for checking plants even without master (start-up phase) determination of the order and distances (line lengths) of the individual stations real-time-capable hardware trigger output for station-related analysis via DSO The PBT3 possesses a USB port for connection to a PC or notebook. The clearly structured PC software provides for straightforward operation of the device, the performing and evaluation of measurements, and support in locating error causes. Thanks to the integrated update option, you are already today well prepared for future extensions. 2 PROFIBUS-Tester 3 User Manual PROFIBUS-Tester 3 2 Start-up 2 Start-up 2.1 Receiving inspection and testing Carefully unpack the device immediately after receipt and check the consignment. If transport damage is suspected, inform the delivery agent within 72 hours and keep the packaging for inspection. The device must only be transported in its original or equivalent packaging. Check the completeness of the consignment against Chapter 6 "Scope of Supply". 2.2 Acclimatizing the device Before turning on the device, make sure that it has reached the same temperature as the room. This should take at most 60 minutes. 2.3 Connecting the device 2.3.1 Design Fig. 1 shows all connections of the PBT3. The power supply is provided by the supplied plug-in power adapter (24 V) via an extra-low voltage socket (to DIN 45323). The inner contact is the plus pole. The "Power On" LED lights when the correct operating voltage is provided. Fig. 1: Connections of the PBT3 The two SUB-D 9 sockets serve for connection to the PROFIBUS plant and for the sampling of the signal lines A and B (via the adapter board) for evaluation using a digital storage oscilloscope (DSO). The BNC socket can be connected to the DSO to use the station-related trigger signal. The connection to the PC or notebook is provided using a USB cable. During operation, the "Ready" LED indicates that the data transfer is running on the connected PROFIBUS. A trigger pulse at the BNC socket is signaled by the "Trigger" LED. PROFIBUS-Tester 3 3 2 Start-up 2.3.2 User Manual PROFIBUS-Tester 3 Mains connection The desktop power adapter included in the scope of supply possesses a wide-range input for connection to mains voltages from 100 V to 240 V 50/60 Hz; the output is a d.c. voltage of 24 V. The cable of the desktop power adapter is inserted into the PROFIBUS Tester 3 using the external voltage connector to DIN 45323. Once the mains power cable is inserted into the desk power adapter and the mains power plug into the mains socket-outlet, the PBT3 is ready for operation. This is indicated by the "Power On" LED on the device. 2.3.3 PROFIBUS connection Various adapter cables for connecting the PBT3 to a PROFIBUS plant are included in the scope of supply. These enable the device to be connected both via SUB-D 9 or M12 connector. 2.3.4 Connecting the PROFIBUS Tester to a storage oscilloscope To display the signal quality of individual PROFIBUS stations on a DSO, the PBT3 generates a station-related trigger pulse. Thus, it is merely necessary to connect the BNC socket of the device to the external trigger input of the oscilloscope. The adapter board included in the scope of supply can be connected to the second SUB-D 9 socket, for simple sampling of the signals from the data lines A and B and the shield potential with the oscilloscope probes. To sample the data transfer signal, a differential probe is recommended (signal line A against signal line B). If two simple probes are used (A against shield and B against shield), the storage oscilloscope must provide mathematics functions to be able to generate the difference (B minus A). 2.3.5 Connecting the device to the PC The PBT3 is connected to a PC or notebook via the "hot-plug-&-play-capable USB port. Before you connect the device to a PC or notebook, it is recommended to install the supplied software, as it includes the necessary USB driver (see Section 4.2 "Installing the software"). 2.4 Prevention of accidents When operating this test device, it is imperative to observe the general accident prevention regulations for the use of measuring instruments. The device must only be used in dry rooms. 4 PROFIBUS-Tester 3 User Manual PROFIBUS-Tester 3 3 Description of Functions and Measuring Principle 3 Description of Functions and Measuring Principle 3.1 The most important measuring functions The PBT3 can measure and display the signal conditions of every PROFIBUS station. Any problems with this station or with the bus cabling can be inferred from the results of the signal quality. The PBT3 displays the following physical properties separately for each PROFIBUS station: general quality level (incl. glitch, edge and level error counters) disturbance-free voltage range (minimum, interference-free differential voltage) edge steepness section of the signal waveform (oscilloscope display) In addition to the physical measurements, the PBT3 provides online monitoring functions, i.e. the entire bus traffic is monitored and checked continuously. This also includes the bus cycle time and a counter for illegal frames. One of the most important innovations offered by the PBT3 is the master simulator allowing measuring and checking already during the phase of installation, even if the master station (e.g. PLC) is not yet available. The distances (line lengths) to the individual PROFIBUS stations, as well as automatic sorting of the station and measuring point lists according to the distances, can be derived from the topology determination. The individual measuring functions are described in detail in the following subsections. 3.2 Measuring the physical bus characteristics PROFIBUS uses a differential signal, i.e. the actual data signal is transferred via two lines inverted to each other (A and B). The difference between the two generates the signal digitized by each PROFIBUS transceiver. Any faults occurring there can endanger the correct detection of the bit stream. The PBT3 provides an evaluation of the differential signal in the form of a general quality level, the disturbance-free voltage range and the edge steepness, as well as by way of the oscilloscope display. Contrary to the quality level, which provides a general evaluation of the signal quality for the bus, the determination of the disturbance-free voltage range and of the edges, as well as the oscilloscope display, are useful aids for targeted fault finding. 3.2.1 General quality level (incl. glitch, edge and level errors) The quality of the signal transmission is characterized by the level of the differential voltage (between A and B), the edge steepness, overshoots and undershoots, as well as level dips (as caused by reflections). All these features are summarized in the quality level value. A reference voltage is changed iteratively by the PBT3 such that max. 20 glitch, edge and level errors can occur per 1,000 bits. Subsequently, the PBT3 activates error counters for glitch, edge and level errors. These error counters display the accumulated number of bit errors per 1,000 bits. The following definitions apply: PROFIBUS-Tester 3 5 3 Description of Functions and Measuring Principle User Manual PROFIBUS-Tester 3 Glitch error: Bits for which the voltage has been fallen below the reference voltage for at least 1/8th of the bit time and has then recovered Edge errors: Bits for which the edge rise or fall time is more than 3/8th of the bit time Level errors: Bits for which the value of the reference voltage is not reached Sporadically occurring faults at the frames to be measured are indicated via the error counters for glitch, edge and level. Any permanent faults, however, will reduce the quality level. Note: The value of the quality level is equivalent to the "minimum signal level" of the PROFIBUS Tester 2 (PBT2). 3.2.2 Disturbance-free voltage range The term 'disturbance-free voltage range' is used to denote the interference-free range of the differential voltage, which is determined over a certain part of each bit of the frames for the station to be measured (relevant frames). This part is called evaluation period. Fig. 2: Measuring principle for disturbance-free voltage range and signal level Each bit is sampled 16 times. The disturbance-free voltage range is evaluated over 10/16th of the bit width (62.5 % of the evaluation period). At both the beginning and end of each bit, 3/16th of the bit width are excluded from the determination of the disturbance-free voltage range (see Fig. 2). Signal overshoot and settling processes are excluded from the interference voltage measurement, as long as they lie outside the evaluation period. A voltage drop of less than 1/16th of the bit time during the evaluation period cannot be detected reliably and thus also has no influence on the determination of the disturbance-free voltage range. 6 PROFIBUS-Tester 3 User Manual PROFIBUS-Tester 3 3.2.3 3 Description of Functions and Measuring Principle Edge steepness To fully evaluate the transmission properties of the bus cabling and of the individual PROFIBUS stations, the edges must also be studied, in addition to the disturbance-free voltage range; shallow edges can also prevent the correct decoding of the transmission signal. The PBT3 determines the edge steepness separately for rising and falling edges. To this end, two thresholds are set at 10 % and 90 % of the signal level determined (differential voltage determined at the bit center, see Fig. 2). The time required for the differential signal to change between these voltage threshold values is measured both for falling and rising edges. The rise and fall times are determined with a resolution of 1/16th of the baud rate used and displayed as a value between 0/16th and 16/16th. This value always specifies the slowest rising and falling edge of the relevant frames. A measured value of 0/16th means that the level change takes place in less than 1/16th of the bit width. 3.2.4 Signal waveform (oscilloscope display) To evaluate signal transitions and to measure reflections, the PBT3 records a characteristic section of the signal waveform of a relevant frame and displays it on the oscilloscope of the PBT3 application software. Based on the signal waveform, various cable problems, such as dead-end branches (transient signal dips), significantly different cable types (long reflections/level dips), short circuits, etc. can be revealed. The triggering point for recording lies at 50 % of the recording depth and is always to be found on the first rising edge of a relevant frame. Irrespective of the selected baud rate, the signals are always recorded at a sampling rate of 192 MSample/s and cover a time range of 12.5 µs with 2,400 points (time resolution: approx. 5.2 ns). The oscilloscope display facilitates the evaluation of signal dips/reflections. Based on the height of the dip, it is possible to infer the changes in the characteristic wave resistance of the cable. The length and the position of the reflections indicate the distance to the point of interference. Two cursors have been implemented in the oscilloscope display of the PBT3 application software for simple measurement of the reflection lengths and thus distances. The signal runtime is converted into a distance specification automatically. A mean runtime constant of 4.35 ns/m is used for calculation with PROFIBUS cables. 3.2.5 Measuring cycles and measuring time The above characteristic measured values for the signal quality are determined by the PBT3 for each PROFIBUS station in so-called measuring cycles (see Table 1). Measured Value Measuring Cycle Quality level (incl. glitch, edge and level errors) Eight iterations with at least 1,000 bits of the station to be measured (relevant frames) Disturbance-free voltage range, edge steepness and signal waveform Ten iterations with at least one frame of the station to be measured relevant frame) Table 1: Description of the measuring cycles Especially with low baud rates, PROFIBUS plants with many or unconfigured stations, or large amounts of data to be transferred, a measuring cycle can last longer. If it is not possible to determine all data during the measuring time, the measurement will end with a timeout. In this case, the timeout value can be increased via the PC program (menu "Tools" → "Settings"). PROFIBUS-Tester 3 7 3 Description of Functions and Measuring Principle 3.2.6 User Manual PROFIBUS-Tester 3 Triggering to a station address During a measuring cycle, the PBT3 must detect frames of the PROFIBUS station to be measured and evaluate its physical bus signal. The assignment of the signal sent to a station is provided via the source address (SA) contained in each PROFIBUS frame1. Once this address has been detected in the measurement "One station" and if this address is identical to the station to be measured, a trigger pulse is generated at the trigger output of the PBT3 (BNC socket). This can be used in conjunction with an oscilloscope to display and check the bus signal for any station. 3.3 Online monitoring functions 3.3.1 Bus status The bus status provides a quick overview of the status of your PROFIBUS plant. A cyclic measurement over one second indicates whether or not data traffic (level change) is present and whether or not the PBT3 is connected correctly to the bus. The so-called idle level of the bus is measured and displayed on an idle plant (without data traffic). Conclusions as to any errors in the bus cabling can be drawn from the value of this differential voltage. Such errors can be, for example, swapped lines, as well as missing, surplus or unpowered terminators. 3.3.2 Bus cycle time PROFIBUS functions on the basis of the master-slave communication hierarchy with token passing. A PROFIBUS master controls the access to the bus and polls its configured PROFIBUS stations (slaves). Once the master has executed its communication tasks, it passes the token (frame) to the next master (or back to itself - in plants with only one master). The bus cycle time (token rotation time of a master) specifies how long the token "travels" for a complete bus cycle. More precisely, the time measurement starts with passing on of the token by a master and ends after a bus cycle when the token is again passed on by the same master. The objective when configuring any PROFIBUS plant is to keep the bus cycle time and thus the refresh interval of the process data as short as possible. Not only configuration problems, but also diagnostic and alarm messages, as well as poor transmission properties resulting in sporadic frame repetitions can extend the bus cycle time. Problems of this kind can be avoided by measuring the cycle time at regular intervals and saving the recorded minimum and maximum times. For this measurement to function correctly, it is merely necessary to set the baud rate of the PROFIBUS segment via the PBT3 application software and to connect the PBT3 to the plant. Subsequently, the device will determine the address of a master automatically2 and starts measuring the bus cycle time. Each time the token is passed on, the time measurement is stopped and restarted at the same time. The resolution of the time measurement is approx. 100 µs. The longest bus cycle time which can be detected is one second. 3.3.3 Illegal frames The counter for illegal frames is - like the bus cycle time - a real-time monitoring function. The background to this measurement is to be able to perform a protocol check of all frames transferred on the bus3. If a logic error is found in a frame, this counter is incremented by one. 1 ...except in a short acknowledgment frame; there, the destination address of the immediately previous frame is stored and assigned. 2 If you have connected the PBT3 to a PROFIBUS plant with several master stations, the PBT3 will use the master address first detected on the bus for measuring the bus cycle time. 8 PROFIBUS-Tester 3 User Manual PROFIBUS-Tester 3 3 Description of Functions and Measuring Principle As a rule, the counter of this display should always show "0". If, on the other hand, errors occur occasionally or even frequently, this is due less to non-conforming PROFIBUS circuits of the PROFIBUS stations, but rather to problems with the physical bus characteristics and the resulting transmission errors. But station addresses assigned twice (duplicate addressing) can also cause errors of this kind. The illegal frame counter of the PBT3 counts max. 50,000 illegal frames. A frame is detected as illegal if at least one of the following protocol errors has occurred: unknown start delimiter (no SD1, SD2, SD3, SD4 or short acknowledgment) incorrect checksum (FCS) start, parity or stop-bit error invalid end delimiter invalid repeated SD2 (in SD2 frames only) invalid length information (LE unequal to LEr; in SD2 frames only) The error detection will only function correctly if the correct baud rate has been set for the PROFIBUS segments via the PBT3 application software. If this is not the case, the frame detection will not function correctly. Consequently, any data transfer on the bus will increment the illegal frame counter. Note: Repeated or diagnostic frames according to the definition above are not registered by the illegal frame counter. 3.4 Help functions 3.4.1 Master simulator The PBT3 can now also perform measurements on PROFIBUS plants which are still in the phase of construction or start-up, even if the actual master station is not yet ready for operation. This function can be especially useful if at first the correct realization of the bus cabling and of the installation of the individual stations is to be checked. The master simulator can be operated at all baud rates and can determine all PROFIBUS stations of the plant - and poll their ID numbers. These can be used to provide the assignment to the device master file (DMF) of the manufacturer and to display the most important information. While the master simulator is running, the physical bus properties (quality level, disturbance-free voltage range and edge steepness) can be measured and thus the signal quality of the entire PROFIBUS installation can be checked. Any stations which are not functioning and any duplicated address assignments can thus also be located. The master simulator continuously checks the whole possible address range (0 through 126) and will also find stations which are only connected to the PROFIBUS later. The master simulator must be operated exclusively on idle PROFIBUS plants, i.e. no other master station must be operating. To disconnect the master station (if present and ready for operation) from the bus for use of the PBT3 master simulator, the PBT3 accessories include a so-called bus disconnector. This is simply inserted between the master station and its SUB-D 9 bus connector. When doing so, however, it should be ob3 The PBT3 detects a frame as illegal if it does not comply with the protocol definition to IEC 61158-3. These illegal frames need not necessarily result in frame repetitions by the master station, since the main causes of such errors are to be found predominantly in the physical bus characteristics (e.g. signal reflections). Therefore, the signal waveform and the value of the illegal frame counter can differ from measuring point to measuring point. PROFIBUS-Tester 3 9 3 Description of Functions and Measuring Principle User Manual PROFIBUS-Tester 3 served that the connector of the master station should not simply be removed; otherwise, a defect in the cable will result4 and the terminator will not be powered at this point. The frames of the PBT3 master simulator are not visible to the PBT3. The address of the PBT3 changes dynamically between the PROFIBUS addresses still free to ensure that the whole address range is available for the stations during the start-up. 3.4.2 Station scan This function automatically determines all stations connected to a PROFIBUS plant and ready for communication. This so-called live list will include all addresses of devices from which at least one valid frame has been received. The completion of this measurement is the prerequisite both for measuring the physical bus characteristics and for determining the topology. The station scan can be performed both on a running and on an idle plant (in this case, with the PBT3 master simulator). When using the PBT3 master simulator, the ID numbers (device codes) of the PROFIBUS stations are also determined, providing an assignment to the device master files. 3.4.3 Detection of duplicated addressing The PBT3 can detect PROFIBUS addresses assigned twice or more. This is done by detecting bus collisions. This check for double addressing is performed during the station scan. 3.4.4 Topology scan The topology scan function can determine the lengths of the lines between the individual PROFIBUS stations and thus their topological order. This measurement must only be performed on an idle PROFIBUS plant, i.e. without active master station (to this end, disconnect the master from the bus, as described in Section 3.4.1 "Master simulator"). The distance to the PROFIBUS master stations can therefore not be determined automatically. To ensure that the topology determination of the PBT3 functions correctly, all cables in the PROFIBUS plant must be connected correctly. Bus terminators must be powered and connected on both bus ends. It is imperative to connect the PBT3 directly to a powered terminator at one of the two bus ends. Long dead-end branches, significant differences in the cable types, incorrect or missing bus terminations, as well as additional PROFIBUS connectors which are not connected influence the distance calculation and can lead to incorrect results. 4 10 In accordance with IEC 61158-2, each PROFIBUS connector should contain four inductivities in the signal lines A and B to compensate the connection capacity of a PROFIBUS station. A PROFIBUS connector which is not connected will not have this capacity, and its inductivities will lead to undesired signal reflections. PROFIBUS-Tester 3 User Manual PROFIBUS-Tester 3 3 Description of Functions and Measuring Principle The determined distances are specified in meters. The calculation by the PBT3 will take into account the runtime-extending properties of the PROFIBUS connectors by automatically deducting 0.8 m from the determined distance for each station detected 5. The distances of PROFIBUS stations connected after a repeater cannot be determined. In this case, the line length between the PBT3 and the repeater is measured. 3.5 Working with measuring points For start-up and fault-finding on a PROFIBUS plant, it is always recommended to perform measurements at different points of the bus cabling, at least, however, on both bus ends. To be able to compare these measurement data conveniently, the PBT3 application software permits the management of different measuring points. Measuring points can be created, named and sorted individually according to the topological order of the stations. The measuring data for quality level, disturbance-free voltage range, edges, oscilloscope display and logger are stored separately for each measuring point. The statistics of the measuring points serves for evaluation of these measurement data and provides a profile of the signal quality along the whole bus cabling. 5 Depending on the PROFIBUS connectors used, the runtime extension can be different. The global correction value of 0.8 m is an average value; the real distance can deviate from the distance determined. This deviation is multiplied with each terminator connected between the PBT3 and the PROFIBUS station measured. PROFIBUS-Tester 3 11 4 The PBT3 Application Software User Manual PROFIBUS-Tester 3 4 The PBT3 Application Software 4.1 System requirements To ensure the correct installation of the PBT3 application software, your PC or notebook should meet the following minimum requirements and possess one of the operating systems listed below: Hardware: Processor: Intel Pentium III, AMD Athlon or higher min. 128 MB main memory Graphics card with 16-bit color depth (24-bit recommended) Resolution: 1,024x768 pixels or higher CD/DVD ROM drive free USB port Supported operating systems: Microsoft® Windows® 98 Gold and Second Edition (SE) Microsoft® Windows® Millennium (ME) Microsoft® Windows® 2000 (Service Packs 1 through 4) Microsoft® Windows® XP (Service Packs 1 and 2) Microsoft® Windows® Server 2003 Note: Microsoft® Windows® NT 4.0 and Windows® 95 are not supported. 4.2 Installing the software The PC software is available in English and supplied on CD. The installation program will set up the PBT3 application software on your system and will install the USB driver required for your device. To this end, perform the following steps: 1. Insert the CD into the appropriate drive of your PC. Thereafter, a "Welcome" window is opened.6 2. Click on the "Install Software" menu item. 3. Follow the instructions of the setup program. 4. After the setup, your PC must be restarted. Note: To install the USB driver, you must possess administrator rights. 6 12 If the "Welcome" window does not open automatically, launch it via "START" → "Run..." → "{drive letter of your CD ROM drive}: \welcome.exe" → "OK" or start the setup program directly from "{drive letter of your CD ROM drive}:\Software\PROFIBUS Tester 3\setup.exe" PROFIBUS-Tester 3 User Manual PROFIBUS-Tester 3 4 The PBT3 Application Software 4.3 General notes on operation 4.3.1 Help When designing the PBT3 application software, special attention was devoted to a clear structure and a selfexplanatory graphical user interface. All elements of the user interface display detailed explanations when the mouse pointer is moved over a control element ("tool tip"). This document is also supplied in electronic form and can be called both via the help function and by pressing the F1 key. It contains a detailed description both of the measurements and of the program operation. 4.3.2 Data saving All measurement, protocol and export data set using the PBT3 application software and determined via the PBT3 device at the PROFIBUS plant, can be stored in a document with the file extension ".pbt". The document can be opened either by double-clicking on the file in the Windows® Explorer or by dragging the file to the program (drag & drop). 4.4 Program structure The graphical user interface of the PBT3 application software is divided into various areas (Fig. 3). Fig. 3: Structure of the PBT3 application software PROFIBUS-Tester 3 13 4 The PBT3 Application Software 4.4.1 User Manual PROFIBUS-Tester 3 Menu bar The menu bar contains the main menus "File", "Measure", "View", "Tools" and "?". Use the "File" menu to open, save, export and print PBT3 documents. The "Measure" menu provides the functions required to control measuring processes ("Start" and "Stop"). Use the "View" menu to switch between the individual measuring views and to hide/unhide the DMF information window. The Settings dialog can be found in the "Tools" menu; it can be used to configure the PBT3 application software and the PBT3 itself. The last menu item "?" contains the electronic manual, as well as program and device information. 4.4.2 Toolbar For user-friendly operation and switching between the measuring tasks, a toolbar has been implemented in the PBT3 application software; this can be found in the upper part of the program window (Fig. 4). The toolbar provides quick access to the most important menu functions. Fig. 4: Toolbar Opens a new document (shortcut: Ctrl + N) Opens an existing PBT3 document (shortcut: Ctrl + O) Saves the active PBT3 document either with its current name or - if the document has not been given a name - with a new name (shortcut: Ctrl + S) Shows how the active document will appear when printed (Print Preview) Prints the active document (shortcut: Ctrl + P) Switches to the view "Configure segment" (shortcut: Alt + 1) Switches to the view "Measure All Stations" (shortcut: Alt + 2) Switches to the view "Measure One Station" (shortcut: Alt + 3) Switches to the view "Measure Logger" (shortcut: Alt + 4) Switches to the view "Measuring point statistics" (shortcut: Alt + 5) Starts a single measurement (shortcut: F5) 14 PROFIBUS-Tester 3 User Manual PROFIBUS-Tester 3 4 The PBT3 Application Software Starts a continuous measurement (shortcut: F6) Green: Ends the measuring process after completion of a single measurement (shortcut: F7) Red: Ends the measuring process immediately (shortcut: F8) Opens a dialog box where you can select the PROFIBUS Tester 3 to be used (if more than one PROFIBUS Tester 3 is connected to your PC) Opens the electronic manual. Make sure that a PDF display program is installed on your system, e.g. Adobe® Reader® (shortcut: F1). Displays program and device information and can be used to update the PBT3 firmware and FPGA configuration. 4.4.3 Message bar The message bar can be found directly beneath the toolbar and is always visible. It informs you continuously on the current status of the bus and on continuously running monitoring functions. Fig. 5 provides a screenshot of the message bar and its elements. Fig. 5: Elements of the message bar 4.4.3.1 Bus status The bus status display consists of multicolor LED graphics and a description text. The LED changes its color depending on the bus status. For a detailed description of the bus status measurement, please refer to Section 3.3.1 "Bus status". The following states can occur: LED = gray: PROFIBUS Tester 3 not connected to the power supply and/or to the PC LED = yellow: Bus static (no level change detected on the bus during the measuring time of one second); differential voltage between 0.8 and 1.4 V (terminated correctly), bus not running LED = red: Bus static (no level change detected on the bus within the measuring time of one second); differential voltage less than 0.8 V or greater than 1.4 V) LED = green: Level change detected on the bus PROFIBUS-Tester 3 15 4 The PBT3 Application Software User Manual PROFIBUS-Tester 3 4.4.3.2 Illegal frames The counter for illegal frames represents an online bus monitoring function. The PBT3 monitors each frame transmitted on the connected PROFIBUS and checks it for protocol errors (for a detailed description of the illegal frames, see Section 3.3.3 "Illegal frames"). A maximum of 50,000 illegal frames is possible. If this number is exceeded, ">50,000" is displayed. Double-click on the illegal frames to reset their values to zero. The value of the illegal frame counter can be recorded in a PBT3 document, like all measurement data. The recording can be started and also be stopped by clicking with the left mouse button on the illegal frame icon or by activating the option "Record online monitoring - illegal frames" in the "Configure segment" view. Any incrementing of the illegal frame counter from the time of activation is thus saved in the document and can later be displayed and printed in the test log. The "REC" icon displays whether or not the recording is currently running ( )( ). It should be taken into account that the illegal frame counter is reset automatically after each change and after execution of the automatic baud rate detection. For correct frame detection and thus error analysis, it is imperative that the baud rate is set correctly; otherwise, all traffic on the bus is detected as an error. 4.4.3.3 Bus cycle time The determination of the bus cycle time – like the illegal frame counter – represents an online bus monitoring function. With the baud rate set correctly and the PBT3 connected to a running PROFIBUS plant, the graphics display the current, the minimum and the maximum bus cycle time since the start of the measurement, as well as the master address. The number displayed to the left of the bar corresponds to the minimum measured time, and the number to the right of the bar to the maximum measured time. The master address from which the token is currently being measured is specified in brackets after the current bus cycle time. During the operation of the PBT3 master simulator, no bus cycle time is measured (display: "No token"). As already described in detail in Section 3.3.2 "Bus cycle time ", the bus cycle time is measured with a time resolution of 100 µs and displayed as a value in microseconds. A value less than 100 µs results in "<0.1 ms" being displayed. The longest time which can be measured is one second. If no token has been received from the detected master for one second or if the PBT3 is connected to an idle plant, "No token" is displayed. In this state, the PBT3 will automatically search for the first available token of a master and - after detection will start the determination of the minimum and maximum bus cycle times7. Double-clicking with the mouse on the bus cycle time graphics will perform a reset resetting all memories ("Reset" is displayed). Subsequently, the PBT3 will wait again for the first available token from a master. The data of the bus cycle time detection can also be recorded in a PBT3 document. Clicking with the left mouse button on the bus cycle time icon or activating the "Record bus cycle time" option in the "Configure segment" view will start recording of the measurement data. The "REC" icon displays whether or not the recording is currently running ( )( ). It should be taken into account that - analogously to the illegal frame counter - changing the baud rate and execution of the automatic baud rate detection results in resetting of the bus cycle time. The correct detection of a token for displaying the bus cycle time requires the baud rate to be set correctly. 7 16 With multi-master systems, it is possible that, after a reset of the bus cycle time, a different master address is determined and displayed. PROFIBUS-Tester 3 User Manual PROFIBUS-Tester 3 4 The PBT3 Application Software 4.4.3.4 Master simulator The PBT3 master simulator serves for commissioning and measuring on idle PROFIBUS plants; it can be activated/deactivated by clicking on the master simulator button. The communication with all existing PROFIBUS stations starts immediately after activation, and all measurements can be carried out. A colored border around the current view symbolizes that the PBT3 master simulator is active. As already described in Section 3.4.1 "Master simulator", the master simulator can only be run on an idle plant, i.e. the master station must be disconnected from the bus, as described in that section. Only when the PBT3 no longer detects level changes (bus status LED = yellow/red, differential voltage > 0.1 V) can the master simulator be activated. 4.4.4 Status bar The status bar can be found at the bottom of the PBT3 application software window (Fig. 6). Fig. 6: Status bar When the mouse pointer or the direction keys are moved through the menus, the left area of the status bar describes the functions of the entries in the menu. This area also displays appropriate descriptions regarding the effects of the buttons on the toolbar if you move the mouse pointer over these buttons. The right-hand area comprises the trigger status icon, information regarding the PROFIBUS Tester 3 connected, and keyboard information. The trigger icon is lit whenever a trigger pulse is initiated at the hardware trigger output. If a PROFIBUS Tester 3 is connected and is in use, its serial number is displayed. 4.5 "Configure segment" view The "Configure segment" view is displayed directly after starting the PBT3 application software. Here you can make the basic settings for measuring. Fig. 7 shows a screenshot. 4.5.1 Segment If your PROFIBUS plant consists of several segments (bus segments separated by a repeater), you can optionally enter a name for the segment (max. 30 characters) in the field "Designation" to permit differentiation. The data transfer rate you wish to use for the PROFIBUS segment to be measured can be set under "Baud rate". You can also use the "Baud rate scan" function to let the PBT3 determine the baud rate automatically. PROFIBUS-Tester 3 17 4 The PBT3 Application Software User Manual PROFIBUS-Tester 3 Fig. 7: Elements of the "Configure segment" view 4.5.1.1 Baud rate scan The PBT3 can determine the baud rate for a segment automatically provided that the PROFIBUS plant functions correctly (data traffic existing, bus status LED = green). Click on "Baud rate scan"; a dialog box is opened, displaying the baud rate detected. This can be confirmed and accepted by clicking on the "OK" button. Note: Changing the baud rate will reset the illegal frame counter and the bus cycle time display to "0". 4.5.1.2 Station scan (and detection of duplicated addressing) The station scan automatically determines all stations transmitting on the bus and enters them in the station list. In addition, this function carries out a check for duplicated addresses. This function can also be used when the PBT3 master simulator is used on an idle plant. In this case, the PBT3 will determine the device codes (ID numbers) of the slaves, permitting assignment to the DMF files. 4.5.1.3 Topology scan The topology scan can be used on an idle PROFIBUS plant (without active master station) to determine the line lengths between the individual PROFIBUS stations and their topological order with reference to the PBT3 18 PROFIBUS-Tester 3 User Manual PROFIBUS-Tester 3 4 The PBT3 Application Software connection point. To ensure that this function works correctly, observe the supplementary conditions described in the Section 3.4.4 "Topology scan". After all stations connected to the bus have been included in the station list using the master simulator and the "Station scan" function, you can click on the "Topology scan" button to start the topology determination function. A dialog box opens to display the progress of the measurement. The distances for all stations included in the station list and marked as "to be measured" ( ) are now determined. The time required to de- termine the topology depends on the baud rate you are using and the bus configuration. Especially for plants with a large number of stations and a high baud rate, the topology determination can take several minutes. Once the measurement has been completed successfully, the dialog box is closed automatically, and the topology determined is displayed in the Topology display. 4.5.2 Recording the online monitoring The measured values "Illegal frames" and "Bus cycle time" displayed in the message bar can be recorded if necessary and also saved in the PBT3 document. To start recording, click with the left mouse button either on the option or on appropriate icon in the message bar. The current measurement values are displayed in the text fields. While the recording is running, the icon is displayed in the message bar. In contrast to the message bar, it is not the current value, but the average value since the start of recording which is calculated and displayed in the text field for the bus cycle time. The remaining fields correspond to those displayed in the message bar. When using the recording functions, please note that the stored values are lost when stopping and then restarting the recording process and are then overwritten by the new values. For this reason, when opening a PBT3 document, the recording is first always deactivated. If the illegal frame counter or the bus cycle time is reset when recording (double-click on "Illegal frames" or "Bus cycle time" in the message bar), this will also have an effect on the recording values; these values will be reset. The recording functions can be used independently of any other measurements performed on the PBT3. 4.5.3 Evaluation When evaluating the measurement data, you will be assisted by the PBT3 application software by way of an automatic evaluation of the results. This function is activated/deactivated via "Automatic evaluation". For the evaluation, the following limit values must be set; they will be stored in the current document: Critical quality level (500 ... 5,000; critical measured value if not reached) Critical disturbance-free voltage range (0.5 ... 5.0 V; critical measured value if not reached) Critical rising and falling edges (1/16 ... 16/16 V; critical measured value when exceeded) With the evaluation function activated, the measured values are evaluated on the basis of the set critical limit values and - if necessary - highlighted. If there any stations which cannot be measured (e.g. due to a logger interval which is too short) or if a timeout occurs, this information is also logged and displayed. 4.5.4 Station list The station list contains all PROFIBUS stations determined using the "Station scan" function. Each station can be assigned a customized designation, and various settings can be made. PROFIBUS-Tester 3 19 4 The PBT3 Application Software User Manual PROFIBUS-Tester 3 The checkbox to the left of each station designation displays whether or not the appropriate station is included in the measurements ( = "to be measured") or ( = "not to be measured"). For switching, either click with the mouse on the relevant icon, use the context-sensitive menu (right mouse button) or the keyboard (spacebar). To rename a station, either click on the "Rename" button, double-click on the cell, use the context-sensitive menu or the keyboard (F2 key). The text of each station is formatted differently depending on the device type detected (see Table 2). Device type Description Style Slave (passive station) Station only sends response frames regular Master (active station) Station only sends request frames bold Table 2: Device types with their styling in the station list The ID number is available automatically if the "Station scan" was carried out with the PBT3 master simulator activated, but it can also be entered manually, either by clicking on the "ID number" button, by double-clicking on the cell, via the context-sensitive menu or using the keyboard (F3 key). The ID number is used for assignment to the device master file (DMF) of the manufacturer. If the relevant file exists in the set DMF archive folder (see Section 4.12 "Settings"), any additional information on the station is displayed in a separate window (menu "View" → "Display DMF information" or F11 key). The absolute distances determined between the appropriate station and the PBT3 via the topology scan can be found in the column "Dist.". This value can also be entered manually, either by clicking on the "Distance" button, by double-clicking on the cell, via the context-sensitive menu or using the keyboard (F4 key). To be able to detect any faulty adaptation on the bus earlier, it is recommended to arrange the stations according to their physical order on the bus. Use the "Auto sort" function to sort the station list by the distances. Otherwise, the order can also be changed manually either using the 4.5.5 and buttons or via drag & drop. List of measuring points The measuring points list can be used to manage various measuring points (for use of the measuring points, please refer to Section 3.5 "Working with measuring points"). Each measuring point possesses a unique index ("#" column), a customized designation, and provides a quick overview of the measurements already performed. To rename a measuring point, either click on the "Rename" button, double-click on the cell, use the contextsensitive menu or the keyboard (F2 key). The "Measuring point" column contains the assignment of the measuring point to the address of a PROFIBUS station (in the station list) to which the PBT3 is connected for measuring. This information can be used for automatic sorting by the order of the stations (with the "Auto sort" option activated). The manual sorting of the measuring points is performed analogously to the sorting in the station list. The columns "QL" (quality level), "DFVR & ED" (disturbance-free voltage range and edges) and "LOG" (logger) display whether the appropriate measurement at the measuring point in question has already been performed for all stations marked "to be measured" (symbolized by "X"). 20 PROFIBUS-Tester 3 User Manual PROFIBUS-Tester 3 4.5.6 4 The PBT3 Application Software Topology display The total line length, the determined line lengths between the stations and their topological order, as well as the positions of the measuring points, are displayed here (circular icons with the number of the measuring point index). The length specifications in meters always specify the distances between two stations. If the DMF information is available for a station, the device designation is also displayed. 4.6 "Measure All Stations" view 4.6.1 How to use The "Measure All Stations" view provides an overview of the signal conditions of all stations. The measured quality level is displayed clearly in a bar diagram for each station. Any minimum and maximum values are also marked graphically so that any variations can be noticed easily. The following additional information is displayed: Glitch, edge and level error counters Minimum and maximum values of the quality level together with a time stamp The measurement can be carried out both as a single measurement (each station is measured only once) and as a continuous measurement. Fig. 8 shows a screenshot of this view. 4.6.2 Setting and measuring The requirements for this measurement are: The PBT3 must be connected both to a PC and to the PROFIBUS plant (bus status LED = green/yellow) The correct baud rate must be selected. The master simulator must be activated if necessary (only required when performing a measurement on an idle plant - bus status LED = yellow/red, differential voltage > 0.1 V) The correct measuring point must be selected. At least one station must exist in the station list and must be marked as "to be measured". PROFIBUS-Tester 3 21 4 The PBT3 Application Software User Manual PROFIBUS-Tester 3 Fig. 8: "Measure All Stations" view After switching to the "Measure All Stations" view ("View" menu or toolbar), you can control the measurement using the following icons or menu functions ("Measure" menu): Starts a single measurement (shortcut: F5) Each station marked in the station list as "to be measured" ( ) is measured once. The measure- ment ends automatically once the signal has been measured completely. Starts a continuous measurement (shortcut: F6) Each station marked in the station list as "to be measured" ( ) is measured cyclically. The meas- urement can be ended via "Stop". End measurement (shortcut: F7) The measurement is carried out up to the last station to be measured and then ended. Cancel measurement (shortcut: F8) Clicking on this button ends the measurement immediately. While the measurement is running, an arrow symbol is displayed beneath the station currently being measured. If it is not possible to determine all measured values for a station (see Section 3.2 "Measuring the physical bus characteristics") during the set timeout time (see Section 4.12 "Settings"), "Timeout" is displayed. In this case, check the status of the station in question or increase the timeout time. 4.6.3 Evaluation The measured stations are displayed in the diagram as a bar. If there are more than 32 stations, you can navigate using the scrollbar. Use this view to view the measured data for the station desired and to display a summary for all stations. To select a station, highlight the appropriate bar in the diagram. Its designation and measured data are displayed in a separate table. The measurement data record of a station consists of the last measured glitch, edge and level error counters, the quality level with its minimum and maximum values from the last continuous measurement and the appropriate time stamps. 22 PROFIBUS-Tester 3 User Manual PROFIBUS-Tester 3 4 The PBT3 Application Software If you activate the "All stations" field under "Selected station" or if you deselect a bar (click on a point outside the diagram), the measured-value display will switch from one station to a summary of all stations. The totals of the values of all stations are displayed by the error counters. The minimum (maximum) value specifies the smallest (largest) quality level for all stations. The central column ("Average") specifies the average value of all individual values measured. With the automatic evaluation activated ("Configure segment" view), a red line highlighting the critical quality level is to be seen in the bar diagram. This bar is yellow if the minimum value of a station is below this limit. If the value is above the limit, the bar is displayed in green. 4.7 "Measure One Station" view 4.7.1 How to use This measurement serves to study one single station more specifically. The view shows the disturbance-free voltage range, the worst rising and the worst falling edges, a section of the signal waveform and the last detected frame of the selected station. Fig. 9 shows a screenshot of this view. This measurement simplifies the station-related displaying and evaluation of the data sent along the PROFIBUS through the use of an oscilloscope, since triggering is only performed exactly to one station address. The Sections 2.3.4 "Connecting the PROFIBUS Tester to a storage oscilloscope" and 3.2.6 "Triggering to a station address" describe in detail how the PBT3 can be used in conjunction with an oscilloscope. 4.7.2 Setting and measuring The requirements for this measurement are: The PBT3 must be connected both to a PC and to the PROFIBUS plant (bus status LED = green/yellow) The correct baud rate must be selected. The master simulator must be activated if necessary (only required when performing a measurement on an idle plant - bus status LED = yellow/red, differential voltage > 0.1 V) The correct measuring point must be selected. At least one station must exist in the station list and must be marked as "to be measured". PROFIBUS-Tester 3 23 4 The PBT3 Application Software User Manual PROFIBUS-Tester 3 Fig. 9: "Measure One Station" view After switching to the "Measure One Station" view ("View" menu or toolbar), you can control the measurement using the following icons or menu functions ("Measure" menu): Starts a single measurement (shortcut: F5) The station to be measured is measured once. Starts a continuous measurement (shortcut: F6) The station to be measured is measured cyclically, and the measurement results are displayed immediately. The measurement can be ended via "Stop". Cancel measurement (shortcut: F8) Clicking on this button ends the measurement immediately. The current measurement data are displayed while the measurement is running. Whenever a frame from this station has been detected, the PBT3 issues a trigger pulse (trigger LED is lit) to its BNC socket. With this trigger signal, the sent frame can be displayed isochronically on an oscilloscope, as described in the Sections 2.3.4 "Connecting the PROFIBUS Tester to a storage oscilloscope" and 3.2.6 "Triggering to a station address". If it is not possible to determine all measured values for a station (see Section 3.2 "Measuring the physical bus characteristics") during the set timeout time (see Section 4.12 "Settings"), "Timeout" is displayed. In this case, check the status of the station in question or increase the timeout time. 24 PROFIBUS-Tester 3 User Manual PROFIBUS-Tester 3 4.7.3 4 The PBT3 Application Software Evaluation During and after the measurement, this view displays the current, maximum and minimum measured values of the disturbance-free voltage range with the appropriate time stamps. The slowest front and rear edges are displayed in multiples of 1/16 of the bit width. With the automatic evaluation activated ("Configure segment" view), the measuring instrument will indicate the critical disturbance-free voltage range with a red arrow symbol. The relevant numerical value is displayed in yellow, symbolizing that the smallest measured disturbance-free voltage range lies below the set limit value. If the critical edge value is exceeded, the edge diagram is displayed in yellow. If the value is below the limit, the edge diagram is displayed in green. It is possible to switch between the oscilloscope and the frame display both during and after the measurement. The frame display displays the last detected frame. The oscilloscope displays a section of the signal waveform for the measured station. Use the "Zoom" function ("+" and "-" buttons) to enlarge or reduce the time section. To navigate within a zoomed-out section, use the scrollbar. Two cursors (1 and 2) which can be positioned freely on the display can be used to measure reflections. To position the currently active cursor on the oscilloscope display, press the left mouse button. To switch between cursor 1 and 2, click on the toggle fields "1" or "2". The time difference between cursor 1 and 2 and the distance specification derived from the signal propagation delay are also displayed. 4.8 "Measure Logger" view 4.8.1 How to use The logger measurement serves for a long-term analysis of the bus system up to several days. Thus, cyclic impairments of the bus (external EMC interference) or a slowly worsening signal quality (e.g. by liquid penetrating into a connector) can be detected. The quality levels of all stations highlighted in the station list as "to be measured" are measured once at definable intervals. This provides an overview of the status of the signal quality over time for each station. A time stamp that refers to the beginning of a logger interval is recorded for each measured value. The evaluation function (if enabled) provides an overview of the whole measurement. It displays spots where the measured values have not reached the setpoints and how many measurements could not be carried out ("not measured" or "Timeout"). Fig. 10 shows a screenshot of this view. 4.8.2 Setting and measuring The requirements for this measurement are: The PBT3 must be connected both to a PC and to the PROFIBUS plant (bus status LED = green/yellow) The correct baud rate must be selected. The master simulator must be activated if necessary (only required when performing a measurement on an idle plant - bus status LED = yellow/red, differential voltage > 0.1 V) The correct measuring point must be selected. At least one station must exist in the station list and must be marked as "to be measured". The required logger interval must be selected. PROFIBUS-Tester 3 25 4 The PBT3 Application Software User Manual PROFIBUS-Tester 3 Fig. 10: "Measure Logger" view After switching to the "Measure Logger" view ("View" menu or toolbar), you can control the measurement using the following icons or menu functions ("Measure" menu): Starts a continuous measurement (shortcut: F6) Starts a continuous logger measurement for all stations highlighted as "to be measured". The measurement can be ended via "Stop". End measurement (shortcut: F7) The current logger interval is measured; thereafter, the measurement is ended. Cancel measurement (shortcut: F8) Clicking on this button ends the measurement immediately. The current measurement data are displayed while the measurement is running. These can already be evaluated during the measurement (to do so, select and zoom the relevant diagram section). Two progress bars are displayed during the measurement. The upper progress bar indicates the log time already passed. The lower progress bar displays which station of the segment is currently being measured. If the time set for the logger interval is too short, in case of station failure or in case of a large number of stations, it can occur that not all stations can be measured. If the logger interval passes prematurely, i.e. before all stations of a segment could be measured, the new logger interval starts nevertheless (with the first station again). The logger interval should be at least long enough for the whole segment to be measured completely. This time can be determined by experiment using the "Measure All Stations" view. If it is not possible to determine all measured values for a station (see Section 3.2 "Measuring the physical bus characteristics") during the set timeout time (see Section 4.12 "Settings"), "Timeout" is displayed. In this case, check the status of the station in question or increase the timeout time. 26 PROFIBUS-Tester 3 User Manual PROFIBUS-Tester 3 4.8.3 4 The PBT3 Application Software Evaluation The start time and the accumulated logging time are displayed in the upper part of the view. The measured values acquired up to this point can be evaluated even while the measurement is still running. It is also possible to switch between different stations. The left mouse button can be used to highlight measured values if necessary. The time stamp is displayed for this measured value at the bottom of the screen. All times indicated in this view are based on the time set in the PC. To maintain an overview with many measured values, use the zoom-out function. Holding down the right mouse button and moving the mouse pointer to the left or to the right will mark an area in blue, which is then zoomed out when you release the mouse button. In the zoomed-out area, you can navigate using the scrollbar. Double-clicking with the left mouse button will zoom-in the displayed section so that you can see all measured values. With the automatic evaluation activated, a red line symbolizing the critical quality level is displayed. A measured value that lies below this limit is displayed in yellow; otherwise, in green. The text fields beneath "Evaluation" provide an overview of the entire measurement and indicate how often a station could not be measured (e.g. due to logger intervals being too short), how often a timeout occurred (not all measured values of a station determined during the set timeout time) and whether and how often the value has fallen below the critical quality level. 4.9 "Statistics of measuring points" The "Statistics of measuring points" view serves for evaluation and comparison of the measured data of a station for all measuring points. The "Statistics" menu item can be used to switch the measured values between quality level, disturbance-free voltage range and edges. Use the list of stations to select the station from which you wish the measured values to be displayed. The selected values measured at the individual measuring points are displayed in the diagram. The order (from the left to the right) corresponds to the sorting order in the list of measuring points. To obtain an appropriate display of the measured-value profile along the bus cabling, this list of measuring points should always be sorted by the topological order of the connection points. 4.10 Printing a test record After all measurements have been completed, a comprehensive test record can be printed via the PBT3 application software to document the correct functioning of a PROFIBUS plant or to show detected problems. The test record consists of individual data areas. Each time before printing or displaying the print preview, you can adapt the compilation of the individual data areas for a selected measuring point and the appropriate station according to your requirements. To this end, the dialog box shown in Fig. 11 is displayed each time when you call a print preview or request printing so that you can adapt the test record accordingly. Use the "Print options" menu item to select the data areas to be displayed or omitted in the test record. All settings made in this dialog box are saved in the document currently active. PROFIBUS-Tester 3 27 4 The PBT3 Application Software User Manual PROFIBUS-Tester 3 The areas "Address field (customer data)", "Contact data of the tester" and "Signatures" are intended specifically for the service and maintenance companies. The customer address can be entered under "Change customer data". Access to the contact data of the tester (= service and maintenance company) can be obtained under "Change tester data". There are various data areas which can only be printed if the measurement data are also present for the selected measuring point (*) and/or station (**). If this is not the case, the relevant toggle field is disabled. Various graphics can be printed as an attachment to the test record. If graphics from different stations are needed, it is also possible to print them completely one after the other without a test record. Note: For reasons of formatting, the test record can only be printed in DIN A4 portrait format (or Fig. 11: Test record settings larger). 4.11 Exporting measurement data 4.11.1 CSV file In addition to the option to output the measurement data as a test record, the contents of a PBT3 document can also be specified as a CSV file. This can be read using any standard spreadsheet program to enable the measured data to be processed further. If all measurements are completed, the export function can be called using the "File" → "Export" → "CSV file" menu. Thereafter, a dialog box appears where you can specify the storage location and the name of the CSV file. Next, a settings dialog is opened to selected the measuring point and the required data areas to be exported to the CSV file. This dialog is handled similarly to the settings dialog for the test record (see Section 4.10 "Printing a test record"). When opening or importing the CSV file to a spreadsheet program, observe the following formatting settings to ensure that all columns, lines and data formats are read in correctly: Column delimiter: ; (semicolon) Line separation: Carriage Return + Line Feed (CRLF = 0x0D0A) Decimal delimiter: . , (the decimal delimiter set in the system, either a point or a comma) 28 PROFIBUS-Tester 3 User Manual PROFIBUS-Tester 3 4.11.2 4 The PBT3 Application Software Graphics Use the "File" → "Export" → "Graphics" menu to export various graphical representations of measurement data as bitmap graphics (.bmp). This is only possible if measurement data for the currently selected measuring point and/or the relevant station exist. If this is not the case, the relevant measuring item is disabled. 4.12 Settings The "Settings..." command in the "Tools" menu opens a dialog box where you can adapt the program to your specific requirements. Here you can influence the behavior of the application software and of the PBT3 device. The settings in this dialog box will not be saved in the current document, but instead in the Windows® registry for the program. 4.12.1 General settings Display tool tips When you move the mouse pointer over a window element (e.g. a button) and stop over it for a short time, the program will display tool tips. Display warning before If you select this option, a message is displayed warning you that the data of overwriting measurement previous measurements will be overwritten when you start a new individual/condata tinuous measurement, a station scan or a topology scan. Display all messages In certain situations, dialogs with tips and questions are displayed by the PBT3 application software. If the corresponding box in one of these dialogs is ticked, such messages can be skipped in the future (e.g. "Do not display this message again."). If you wish this message to be displayed again, reactivate the option here. DMF storage folder This path specifies the storage folder that contains the device master files (DMF) for displaying station information (see Section 4.13 "DMF information"). Measuring cycle timeout The time entered in this field (in seconds) determines how long the measurement of the quality level, of the disturbance-free voltage range (and of the edges) may last for each station. If it is not permissible to determine all measured values for a station within the set time, this time must be increased. 4.12.2 Tester contact data The PBT3 print function and the option of exporting the data to a CSV file can be used to display the contact data of the plant tester. Use this tab to enter your contact data (optional). 4.13 DMF information Each PROFIBUS device manufacturer delivers a device master file (DMF) together with the product, where technical data, manufacturer information and device data are stored. These data are required for configuring a PROFIBUS plant and for certifying the field device. PROFIBUS-Tester 3 29 4 The PBT3 Application Software User Manual PROFIBUS-Tester 3 The PBT3 application software can access already existing device master files and assign the information contained therein to the stations detected by the PBT3 master simulator. The storage folder for these files can be set using the "Tools" → "Settings..." menu (see Section 4.12 "Settings"). Both language-independent device master files (extension: .gsd) and country-specific device master files (extension: .gs?) are supported. The dialog box with the DMF information can be hidden/unhidden using the "View" → "Display DMF information" menu (F11 key). Fig. 12 shows a screenshot of this view. Once a station with determined ID number is selected in the main window of the PBT3 application software (e.g. in the station list) and if the relevant device master file exists, the DMF information window Fig. 12: DMF information will display the names of both the device and the manufacturer, the version information and supported functions. If several device master files exist for one ID number, these can be selected under "File name". 4.14 The "PROFIBUS Tester Scan" program The "PROFIBUS Tester Scan" program provides a quick overview of the type and the serial number of the PROFIBUS Tester connected. The program is entered in the Autostart folder and is called automatically with each program start. A symbolic icon is displayed in the information area of the task bar for each Fig. 13: "PROFIBUS Tester Scan" PROFIBUS tester detected. If you click on this icon, the menu shown in Fig. 13 is opened. Use this menu to call the PBT3 application software and the Manual directly. Note: If you do not need the program, you can remove the link from the Autostart folder. 30 PROFIBUS-Tester 3 User Manual PROFIBUS-Tester 3 5 Technical Specifications 5 Technical Specifications General parameters and overview of functions Field of application PROFIBUS DP and FMS to IEC 61158 (formerly EN 50170 or DIN 19245) Bit sampling • 8-fold (quality level and errors) • 16-fold (disturbance-free voltage range and edges) Signal sampling (oscilloscope display) 192 MSample/s, 2,400 sampling points Triggering to a station • to frames (SD1...SD4) with a certain source address • to a short acknowledgment (0xE5, target address of the request frame) Supported baud rates • 9.6; 19.2; 45.45; 93.75; 187.5; 500 kbit/s and 1.5; 3; 6; 12 Mbit/s • Automatic detection via baud rate scan Station list (live list) • Master /slave differentiation • Automatic detection via station scan • Specification of ID number and distance • Automatic sorting by topological order Topology determination • Active with integrated master simulator • All masters disconnected from the bus • Accuracy: ±2 m; maximum distance: 230 m Management of measuring points • Option of measuring at different measuring points • Automatic sorting by the station list Quality level and errors (one/all stations) • Value of the signal quality (typ. 200 ... 5,000) • Glitch, edge and level error counters • Minimum value and maximum value storage • Time stamp • Long-time measurement (logger) Disturbance-free voltage range and edges • Disturbance-free voltage range (typ. 0.4 ... 5 V, resolution 50 mV) • Edge steepness (falling and rising, specified in 1/16th of the bit width) • Minimum value and maximum value storage • Time stamp Oscilloscope display • Section of the signal waveform of a station • Two cursors for measuring the reflection (with taking into account the signal propagation delay) • Zoom (six stages) Frame display • Complete frame recording • Decoding to PROFIBUS DP (hexadecimal, decimal, ASCII representation) Statistics of measuring points Statistical evaluation of individual stations for all measuring points: quality level, disturbance-free voltage range and edges Automatic evaluation Limit value settings and measured-value evaluation according to: • critical quality level • critical disturbance-free voltage range • critical edge Bus status • Permanent display of the bus status • Measuring of the differential voltage in the idle state of the bus Bus cycle time (token rotation time) • Permanent display of the token rotation time for the/a master (0.1 ... 1,000 ms) • Minimum and maximum value storage • Address of the master detected Illegal frames Permanent display of detected frame errors (protocol errors, 0 ... >50,000) Test record Comprehensive, configurable measuring and test record on DIN A4: • Letterhead with tester and customer contact data • Tabular representation of the measured values • Graphical representation of the measured values Export function • Measuring data as a configurable CSV file • Graphical measured-data representation as a bitmap (.bmp) Firmware and FPGA configuration can be updated via USB Standards Equipment safety EN 60950-1: 2003-03 EMC • Low-frequency interference emission: • High-frequency interference emission: • Interference immunity: EN 61000-3-2: 1995, +A1: 1998, +A2: 1998, +A14: 2000 EN 55022: 1998 EN 55024: 1998 Table 3: Technical specifications PROFIBUS-Tester 3 31 5 Technical Specifications User Manual PROFIBUS-Tester 3 Electrical parameters Supply voltage 11 ... 36 V DC Current input 0.6 ... 0.15 A Measuring of the differential voltage between A and B typ. 0.4 V ... 5 V Potential difference between the connections PROFIBUS, USB and oscilloscope < 50 V DC (or < 71 V AC) Trigger output for the oscilloscope BNC socket, electrically isolated, H pulse, 10 bits wide, level approx. 5 V Mechanical parameters Supply voltage connection Extra-low voltage socket to DIN 45323 PROFIBUS connection 2 x 9-pin SUB-D socket PC connection Self-powered device to USB Specification 1.1; additionally, electrically isolated Trigger output for the oscilloscope BNC socket, electrically isolated Housing Aluminum extruded profile Temperature range • Operation: • Storage: 5 °C ... 40 °C -20 °C ... 60 °C Humidity • Operation: • Storage: 20 % ... 80 % (non-condensing) 20 % ... 80 % (non-condensing) Degree of protection of the housing IP20 to EN 60529 Dimensions 35 mm x 109 mm x 143 mm Weight approx. 320 g Table 4: Technical specifications (cont'd) Warning: The PBT3 is a Class A device. Such devices can cause interference in residential areas. In this case, the plant operator can be requested to take appropriate measures and to bear the costs for such measures. 32 PROFIBUS-Tester 3 User Manual PROFIBUS-Tester 3 6 Scope of Supply 6 Scope of Supply The scope of supply of the PROFIBUS Tester 3 comprises the following parts: PROFIBUS Tester PBT3 PROFIBUS accessories: SUB-D adapter cable M12 adapter cable SUB-D bus disconnector (for disconnecting the master station, keeping the powered terminators if any) PROFIBUS M12 T piece PROFIBUS M12 terminating resistors Adapter board (for simple connection of the oscilloscope probles) Power supply: AC/DC adapter: • Type: FW7400/24, company FRIWO • Input voltage: 100 ... 240 V, 50 Hz ... 60 Hz • Output direct voltage: 24 V, 500 mA, • Connection cable: 2 m long, with extra-low voltage connector to DIN 45323 Mains power cable (1.8 m): • Country variants: Europe, Great Britain, U.S.A. / Japan, Australia Product CD with USB driver and application software Manual USB cable (3 m) Suitcase PROFIBUS-Tester 3 33 7 Maintenance and Customer Service User Manual PROFIBUS-Tester 3 7 Maintenance and Customer Service 7.1 Maintenance The PROFIBUS Tester 3 is maintenance-free. Any repairs must always be entrusted to the manufacturer. 7.2 Customer service 7.2.1 Shipping If you send the PROFIBUS Tester 3 for repair, use only the original packaging or equivalent packaging. Please give a brief error description and your telephone number in case we have any questions. 7.2.2 Support If you have any technical questions, please specify the serial number of your device, its firmware and hardware configuration version and the version of the PBT3 application software. Please either send your questions either to your supplier or contact the PROFIBUS Tester 3 manufacturer hotline. Supplier: Softing AG Richard-Reitzner-Allee 6 D-85551 Haar Tel. +49 (89) 456 56 – 0 Fax +49 (89) 456 56 – 399 W eb: http://www.softing.com E-Mail: [email protected] 7.2.3 Warranty and limitation of liability We will assume a warranty of 24 months for the PROFIBUS Tester 3, which will commence from the date of delivery. Any repairs required during this time which fall under the manufacturer's obligation to give a warranty will be performed free of charge. Any damage resulting from improper use of the device or from exceeding the specified technical parameters are not covered by the manufacturer's obligation to give a warranty. Softing AG will only be liable for consequential dam age resulting from the use of the product in case of wilful intent or gross negligence. The General Terms and Conditions of Softing AG are to apply. 34 PROFIBUS-Tester 3 User Manual PROFIBUS-Tester 3 8 Ordering Information 8 Ordering Informationen Product Description Article number PROFIBUS Tester 3 Euro PROFIBUS-Tester 3 complete package with mains power cable for Europe PB-T3 PROFIBUS Tester 3 USA PROFIBUS-Tester 3 complete package with mains power cable for USA PB-T3/USA Table 5: Ordering information PROFIBUS-Tester 3 35 9 Problem Recovery User Manual PROFIBUS-Tester 3 9 Problem Recovery The following Chapter will help you if you have problems with your PROFIBUS Tester 3. This Chapter lists typical error sources and problem situations, indicates possible causes and offers possible solutions. If you encounter a problem with your PBT3 and/or the application software, which is not listed here or cannot be solved by the solution specified here, please contact the manufacturer (see Section 7.2.2 "Support"). 9.1 Problems with the PBT3 device setup Problem Questions, causes & problem recovery PROFIBUS Tester 3 is not detected: • Error in the Windows® setup for the device • Driver not found • "No PROFIBUS Tester 3 connected" Questions: • PBT3 connected to PC and power supply ("Power On" LED)? • Does the USB hardware of your PC function correctly? • Is "PROFIBUS Tester 3" displayed under "USB" in the device manager? • Is the correct operating system installed (see Section 4.2 "Installing the software")? How to solve this problem: • Disconnect the PROFIBUS Tester 3 from PC and from the mains. • If necessary uninstall the PBT3 application software (e.g. via the Control Panel) • Install the PBT3 application software (see Section 4.2 "Installing the software") • Reboot your PC. • Connect the PROFIBUS Tester 3 (AC/DC adapter) and your PC to the mains (USB cable). • Windows® should now detect a new device and install the appropriate drivers. • PBT3 is detected by the device manager and by PBT Scan, but the application software displays "No PROFIBUS Tester 3 connected" How to solve this problem: • Open the Select device dialog under "Tools" → select "PROFIBUS Tester 3" and choose one of the PBT3s from the list. 9.2 Problems when measuring Problem Questions, causes & problem recovery Baud rate scan • Button is disabled (grayed-out) Questions: • PBT3 connected to PC and power supply ("Power On" LED)? • PBT3 detected by application software (→ status bar)? • PBT3 connected correctly to the PROFIBUS plant? • Level change present on the bus (bus status LED = green)? • Master simulator deactivated? How to solve this problem: • Provide for transmission activity on the PROFIBUS line (e.g. start the master). • Set the baud rate manually and use the PBT3 master simulator • No baud rate found Possible causes: • Duplicated addresses may have assigned • Incorrect bus installation (→ large reflections) • Excessive interference affecting the lines • Defective PROFIBUS drivers • Line short-circuits • Non-conforming baud rate used How to solve this problem: • Correct the baud rate manually or try a different baud rate. Station scan • Button is disabled (grayed-out) Questions: • PBT3 connected to PC and power supply ("Power On" LED)? • PBT3 detected by application software (→ status bar)? • PBT3 connected correctly to the PROFIBUS plant? • Level change present on the bus (bus status LED = green)? How to solve this problem: • Provide for transmission activity on the PROFIBUS line (e.g. start the master simulator). 36 PROFIBUS-Tester 3 User Manual PROFIBUS-Tester 3 Problem 9 Problem Recovery Questions, causes & problem recovery Station scan • Stations missing Possible causes: • Duplicated addresses may have assigned • The master simulator is being used, and the baud rate has just been changed: - The stations have not yet been synchronized to the new baud rate. - The appropriate station does not support automatic baud rate change. - The appropriate station does not support the required baud rate. • The ID numbers are missing. How to solve this problem: • Use the master simulator. Topology scan • Button is disabled (grayed-out) Questions: • PBT3 connected to PC and power supply ("Power On" LED)? • PBT3 detected by application software (→ status bar)? • PBT3 connected correctly to the PROFIBUS plant? • Master station disconnected from bus via bus disconnector? • Bus static and differential voltage o.k. (bus status LED = yellow)? • Bus termination connected to both ends and powered? (bus status LED = yellow)? • At least one station highlighted in the station list as "to be measured"? • provides incorrect results Questions: • PBT3 connected directly to a powered termination resistor on one of the two segment ends? • Master station disconnected from bus via bus disconnector? Possible causes: • Different cable types (with different wave resistances) • There is an error in the physical bus characteristics and there are significant signal faults. • The distance cannot be determined for various stations. How to solve this problem: • Cancel the topology scan. • Highlight this/these station(s) in the station list as "Do not measure". Error counter • Counts continuously Possible causes: • An incorrect baud rate has been selected (→ Baud rate scan) • Duplicated addresses may have assigned • There is an error in the physical bus characteristics and there are significant signal faults. Master simulator • Button is disabled (grayed-out) Questions: • PBT3 connected to PC and power supply ("Power On" LED)? • PBT3 detected by application software (→ status bar)? • PBT3 connected correctly to the PROFIBUS plant? • All masters disconnected via bus disconnector (bus status LED = yellow or red)? • Bus static and differential voltage > 0.1 V (bus status LED = yellow or red)? • Bus termination connected to both ends and powered? The measurements "All stations", "One station" and "Logger" • cannot be started Questions: • PBT3 connected to PC and power supply ("Power On" LED)? • PBT3 detected by application software (→ status bar)? • PBT3 connected correctly to the PROFIBUS plant? • At least one station highlighted in the station list as "to be measured"? Additionally for the "One station" measurement: • One station selected? How to solve this problem: • Provide for transmission activity on the PROFIBUS line (e.g. start the master simulator). Printing and exporting • The relevant data field is disabled. PROFIBUS-Tester 3 How to solve this problem: • carry out the required measurement for the selected measuring point and the relevant station. 37 10 Notes User Manual PROFIBUS-Tester 3 10 Notes 38 PROFIBUS-Tester 3 User Manual PROFIBUS-Tester 3 PROFIBUS-Tester 3 10 Notes 39


