1
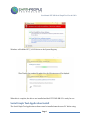
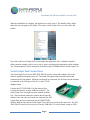
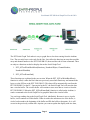
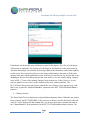
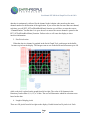
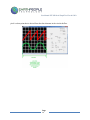
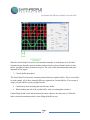
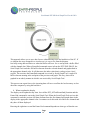
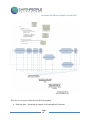
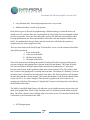
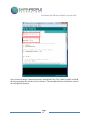
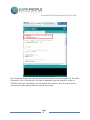
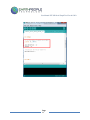
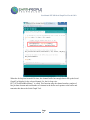
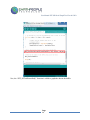
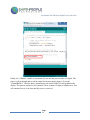
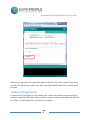
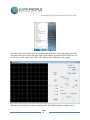
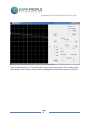
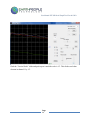
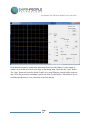
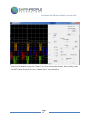
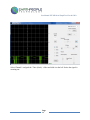
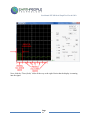
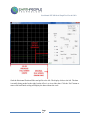
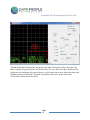
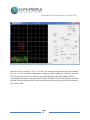
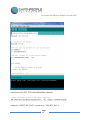
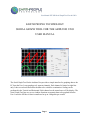
User Manual EPT SPI Serial Graph Tool For the UNO EARTH PEOPLE TECHNOLOGY SERIAL GRAPH TOOL FOR THE ARDUINO UNO USER MANUAL The Serial Graph Tool for the Arduino Uno provides a simple interface for graphing data to the PC from the Uno. It can graph up to 8 separate channels. Each channel is limited to eight bits only. It has several tools that allow the data to be scaled for examination. Scaling can be performed in the Vertical and Horizontal. Each channel can be turned on or off for display. The Serial Graph Tool has easy to use Arduino functions to transmit data to be graphed from the Uno. It uses the SPI bus so data is transferred at up to 4 Megabits per second. Page 1 User Manual EPT SPI Serial Graph Tool For the UNO Serial Graph Tool Getting Started Below is a list of the steps to take to get started using the Serial Graph Tool. 1. Install the Serial Graph Tool Driver 2. Install the Serial Graph Tool Application 3. Connect the EPT 220X-DB-U2 board to the Arduino Uno 4. Connect each board separately to two USB Ports on the PC 5. Locate the Arduino Examples folder under the Serial Graph Tool Install 6. Locate the Arduino_SGTool_Analog_Monitor_U2 folder, double click on the *.ino file 7. When the Arduino IDE comes up, Go to Tools->Board and select Arduino Uno 8. Go to Tools->Serial Port and select the correct port for the Uno. 9. Click on the Upload button of the Arduino IDE. 10. Click on the Serial Graph Tool Icon under “All Programs” 11. When the application opens up, click on the drop down box in the upper right corner. 12. Select the “Serial Graph Tool 0”. 13. Click on the “Open” button then click on the “Start” button. 14. All six analog channels should appear on the display. Serial Graph Tool Driver Connect the EPT 220X-DB-U2 board to a USB port on the PC. Load the driver located on the CD at /SPI_SERIAL_GRAPH_TOOL_PROJECT_CD/Drivers/EPT_2.08.24 The EPT 220X-DB-U2 uses the ftdibus.sys driver. This driver is loaded upon connection of the USB to Serial Cable to the PC by the ftdibus.inf file. To install these two files onto your PC, follow the instructions from the “Update Driver Software” utility. This utility will automatically Page 2 User Manual EPT SPI Serial Graph Tool For the UNO load when the board is connected to the PC. Click on the “Browse my computer for driver Software” icon. Next, click the “Browse” button and browse over to the cd and locate the above folder. Page 3 User Manual EPT SPI Serial Graph Tool For the UNO The next window is the Windows Security notice. The EPT driver is not signed by Windows. Click on the “Install this driver software anyway”. Page 4 User Manual EPT SPI Serial Graph Tool For the UNO Windows will add the EPT_2.08.24 driver to the System Registry. When this is complete, the drivers are installed and the EPT 220X-DB-U2 is ready for use. Serial Graph Tool Application Install The Serial Graph Tool application software must be installed onto the users PC before using. Page 5 User Manual EPT SPI Serial Graph Tool For the UNO This is an easy process as the application and all the supporting files such as Data Sheets, Arduino Examples and the application itself has been packed into Windows Installer files. This comes in the form of two files: Just double click on the setup icon to launch the installer. Click through all of the install screens by clicking “Next”. Page 6 User Manual EPT SPI Serial Graph Tool For the UNO When the installation is complete, the application is ready for use. The installer adds a folder under the users Programs (x86) folder. Go to Start->Serial Graph Tool to view the files and folders. Just click on the Serial Graph Tool icon to launch the application. The “Arduino Examples” folder contains example code for you to use to setup a working graph application on the Arduino. The “Documentation” folder contains the Data Sheet and User Manual for the Serial Graph Tool. Serial Graph Tool Connections The Serial Graph Tool uses the EPT 220X-DB-U2 board to connect the Arduino Uno to the software application running on the PC. The board is designed with stackable headers that connect into the Uno headers. When the two boards are connected, the SPI bus from the Arduino is connected to the USB port of the PC via the FT220X daughter board. Connect the EPT 220X-DB-U2 to the Arduino Uno. Connect the board to an open USB port on the PC. The Serial Graph Tool is designed to mate with the Arduino Uno. The four board connectors connect directly into the Arduino Uno. Once the two boards are connected, the SPI signals from the Uno are directed into the UMFT220XA module. Both the Uno and the Serial Graph Tool can be powered up at the same time. The EPT 220X-DB-U2 board receives its power from the USB cable. To use the board, connect a USB Page 7 User Manual EPT SPI Serial Graph Tool For the UNO Mini B cable into the board connector and an open USB port on the PC. When the board is connected the USB driver (described in the previous section) automatically loads. Connect the Uno to the PC using a USB Cable. Connect the Uno to the PC using a USB Cable. Next, add some code to the Arduino and use the Serial Graph Tool functions to plot out user data. Serial Graph Tool Data Flow The Serial Graph Tool is designed to graph any data. This data can be 8, 10, 12, or 16 bits. It can have up to eight individual channels displayed at any one time. This data can be the result of the AnalogRead() function, or Temperature from and I2C sensor, or it can be created from a mathematic equation. Once the data has been graphed to the display, it can be scaled in the horizontal or vertical directions. You can zoom in or out in the horizontal or move forwards or backwards in the data buffer. In the vertical direction, you can scale the data with an integer or fractional multiplier. You can also set the vertical position of each channel. The figure below shows the Data Flow for graphing data from the Arduino. The user will collect data, then format the data, transmit over SPI to the EPT 220X-DB-U2, then transmit over USB to the PC, and finally the Serial Graph Tool displays the data. Page 8 User Manual EPT SPI Serial Graph Tool For the UNO The EPT Serial Graph Tool makes it easy to graph fast or slow data coming from the Arduino Uno. The user only has to write code for the Uno. Just collect the data into an array then send the array and channel number to the EPT 220X-DB-U2, then send the end of frame command. There are only two functions needed to display data on the Serial Graph Tool. 1. EPT_SGToolWriteBlockData(DataArray, NumberOfBytes, ChannelNumber, NumberOfDataBits) 2. EPT_SGToolFrameEnd() These functions are explained in the next section. When the EPT_SGToolWriteBlockData() function is called, it takes the block that was previously stored into DataArray and transmits the bytes over the SPI bus to the EPT 220X-DB-U2. This data will be automatically sent from the EPT 220X-DB-U2 to the PC. Upon arrival at the PC, the Serial Graph Tool will store the data into a circular buffer. The circular buffer will continue to store new data as it arrives from the EPT 220X-DB-U2. When the EPT_SGToolFrameEnd() function is called on the Arduino, it sends a command to the Serial Graph Tool to graph the data in the circular buffer. You can keep sending data to the Serial Graph Tool, indefinitely. Because it uses a circular buffer, it will continue to fill this buffer. When it reaches the maximum size of the buffer, it circles back around to the beginning of the buffer and fills the buffer at that point. So, it will overwrite the previously written data. Anytime you want to update the display with new data, Page 9 User Manual EPT SPI Serial Graph Tool For the UNO just call the EPT_SGToolFrameEnd(). Serial Graph Tool Arduino Library 1. Write Block Function EPT_SGToolWriteBlockData((int *)DataArray, (int) NumberOfWords, (int)ChannelNumber, (int)NumberOfDataBits) This function is used to send a block of data to the Serial Graph Tool software which resides on the PC. The function does not return anything and takes four items as input parameters. a. DataArray – this is an integer array that can take up to 16 bit data. The array should be declared as an integer array with no more than 500 entries. The Uno has only 2KB of SRAM so the buffer should stay under that size. The array can be as small as one byte or it can be the entire 500 integers. You must pass the DataArray to the function EPT_SGToolWriteBlockData() as an integer pointer. This is simple to do, just add the (int *) in front of the name of your array. b. NumberOfWords – this is the number of items in the DataArray that you want to transfer to the Serial Graph Tool. Make sure that the total number of items in this value is available in the DataArray. If a null character is read from the buffer, it will not be transferred. c. ChannelNumber – this is the channel that you want to write the DataArray into in the Serial Graph Tool. The tool has separate data buffers for each channel. Channels are assigned 0 to 7 for a total of eight channels. When the Arduino writes data to a new channel, it is declared and becomes available for display. If no command is sent to write data to a particular channel, then that channel will not be available for display. d. NumberOfDataBits – this value is used to determine the bit size of each data element, 8, 10, 12, or 16. This value needs to be filled in correctly, otherwise the data will be incorrectly organized in the buffers in Serial Graph Tool. The correct values to use are: Page 10 User Manual EPT SPI Serial Graph Tool For the UNO i. EIGHT_BIT_DATA ii. TEN_BIT_DATA iii. TWELVE_BIT_DATA iv. SIXTEEN_BIT_DATA 2. Frame End Function EPT_SGToolFrameEnd() This function should be called anytime you want to graph the data that was written into the channel buffers in Serial Graph Tool. This function has no return and requires no parameters. It can be called at anytime. Serial Graph Tool Functionality 3. DataArray description The DataArray is the place in the Arduino memory where the data to be sent to the Serial Graph Tool is stored. This is declared as an integer array with a maximum size of 500 integers. Page 11 User Manual EPT SPI Serial Graph Tool For the UNO Each integer stored into this array will become a pixel in the display. The value of each integer will become its amplitude. The position of each integer in the DataArray is the point in time in which the data sample was collected. Each integer added to the DataArray can be either eight bit, ten bit, twelve bit or sixteen bit. However each integer added must be the same as all the other integers in the array. Mixing different bit sizes in the array is not allowed. So, the fact that we are changing the bit size of the data going into the array means we are not actually adding “integers” in the ANSI “C” sense of the meaning. Integers in the Arduino are 16 bits. However, we can store an eight bit (or ten, twelve) to the elements of the array with no problems. The EPT_SGTool Library just needs to know what the bit size of data we store into this array. And that is why we pass the “NumberOfDataBits” parameter to the EPT_SGToolWriteBlockData() function. 4. Channel selection The Serial Graph Tool can display up to eight individual channels of data. When the user sends a block of data to the EPT 220X-DB0-U2, they send it to a channel. And the data that is collected at the PC will be displayed in that channel only. So, the user must select a channel and enter in the “ChannelNumber” in the parameters for the EPT_SGToolWriteBlockData() function. The Page 12 User Manual EPT SPI Serial Graph Tool For the UNO data that is continuously collected for the channel in the Arduino code must keep the same channel number for the duration of the application. If you collect data for more than one channel, each time you call EPT_SGToolWriteBlockData() function you will have to enter the correct “ChannelNumber” for that data. It is up to the user to ensure the correct channel is passed to the EPT_SGToolWriteBlockData() function. Failure to do so will cause the display to show incorrect information. 5. Pixel bit selection When the data in a channel is graphed in the Serial Graph Tool, each integer in the buffer becomes a pixel on the display. The integers start at zero in the buffer and increment up to 450 while each pixel is placed on the graph from left to right. The value of all elements in the DataArray can be either 8, 10, 12, or 16 bits. The user will determine which bit selection to use based on the data. 6. Length of display pixels There are 450 pixels from left to right on the display. Each division has 50 pixels in it. Each Page 13 User Manual EPT SPI Serial Graph Tool For the UNO pixel is a data point that is derived from the data elements in the circular buffers. Page 14 User Manual EPT SPI Serial Graph Tool For the UNO When the Serial Graph Tool receives a FrameEnd command it reads the previous 450 data elements starting from the most recent data element from the selected channel in the circular buffer. It graphs each data element in one pixel. The value of the data element determines the amplitude of the signal. 7. Circular buffer description The Serial Graph Tool stores the incoming channel data into separate buffers. There is one buffer for each channel. All of these channel buffers are organized as Circular Buffers. The concept of using a Circular Buffer is pretty straight forward: Continuously store incoming data into the same buffer. When reaching the end of the circular buffer, start overwriting data at index 0. It starts filling at index zero and increments the index whenever new data arrives. When the index reaches the maximum point, it starts filling the buffer at zero. Page 15 User Manual EPT SPI Serial Graph Tool For the UNO This approach allows you to save data forever without having to use the hard drive of the PC. If we imagine the array arranged in a circular way it is easy to see from the diagram. Just keep saving data and start over when the buffer rolls over. So we end up with a buffer filled with the channel data. When a FrameEnd command comes in from the EPT-220X-DB-U2, the Serial Graph Tool reads the 450 buffer elements from the selected channel and graphs them in the appropriate channel color. It will then store the index value that it read up to into a local register. The next time the FrameEnd command is received by Serial Graph Tool, it reads 450 buffer elements starting at the end point of the previous read graph. This way, data will be graphed in an orderly manner in which it was received by Serial Graph Tool. This process can repeat forever, the incoming data will never overflow the local memory or slow down the computer by using the hard drive. 8. When to update the display The display can be updated at any time. Just call the EPT_SGToolFrameEnd() function and the Frame End command is sent to the Serial Graph Tool. When the Serial Graph Tool receives this command, it reads the previous 450 data elements from the first channel and graphs them in the display in the appropriate channel color. It continues to do this with all of the active channels and they have all been displayed. Knowing the right time to send the Frame End command depends on what type of data the user Page 16 User Manual EPT SPI Serial Graph Tool For the UNO is collecting and how often it is added to the “DataArray”. Because the data is stored into an array at the Arduino, the concept of time or any other measurement must be maintained by the user. The Serial Graph Tool does not know the exact timing of the elements in the data. For example, let’s graph four channels of data. In the loop() function of the Arduino, one data element from each channel is stored into a separate buffer. Each channel data must be collected, possibly from the analoagRead() function. Next, the data is processed by determining if it is greater than a threshold. Next, if it is greater than the threshold, store it. Repeat this process for each channel. When the end of the loop() function is reached, start the process over until the buffers reach the maximum index value. When the buffers are full, send each buffer to the EPT220X-DB-U2 using the function, EPT_SGToolWriteBlockData(). Then repeat this process until there are 450 data elements transmitted to each channel. At this point, there is enough data to fill up the entire display with graphs for all four channels. So, call the EPT_SGToolFrameEnd() function. Next, the display is updated with the collected data from the Arduino. Examining each of these processes, we can see that each process adds its own finite amount of time to execute these commands. So, the timing information cannot exist in the Serial Graph Tool. The user will have to note the amount of processing time for each of these tasks to know exactly when they occurred. Page 17 User Manual EPT SPI Serial Graph Tool For the UNO There are several types of data that benefit from graphing. Real time data – Streaming the outputs of the analogRead() functions Page 18 User Manual EPT SPI Serial Graph Tool For the UNO Long Duration data – Measuring temperature once every second Mathematical data – Result of an equation Each of these types of data will be graphed using a different strategy of when the frame end should occur. For real time data, the circular buffers in Serial Graph Tool are constantly written to as fast as possible. Every time the buffer index reaches 450, the frame end should be called. For long duration data, the frame end should be called after each data element is added to the buffer. For mathematical data, the frame end only needs to be called after the equation is complete and you want to graph the results. There are menu items on the Serial Graph Tool that allow you to view the contents of the buffer using different methods. i. Zoom in the buffer ii. Zoom out of the buffer iii. Shift left in the buffer iv. Shift right in the buffer These four menu items will change the method of reading 450 buffer elements starting at the previous end point, and graphing these elements in the selected channel. The Zoom in feature will read each element from the channel buffer and add a selected amount of “dead time” between each element. It then graphs this data in the selected channel. The effect of this “dead time” between each graph point is zooming into to the data. The amount of “dead time” between each data point is selectable by the Horizontal Scale slider. The Zoom out feature will decimate the data and graph the selected channel. This means that the data is read from the channel buffer at intervals of n+1. So, data is skipped. When the data is graphed, the effect is that we are zooming out of the data. The amount of “skipped data” between each data point is selectable by the Horizontal Scale slider. The Shift Left and Shift Right feature will add some user selectable amount to the previous end point of the graphed data. Serial Graph Tool then reads 450 elements from the buffer and plots them. The effect is that the data is shifting right or left on the screen. The amount of shifted data t is selectable by the Horizontal Scale slider. 9. SPI Timing diagram Page 19 User Manual EPT SPI Serial Graph Tool For the UNO The Arduino code transmits the channel data to the EPT-220X-DB-U2 over the SPI bus. This serial data has a protocol that it adheres to, to correctly send the formatted data to be graphed by Serial Graph Tool. The protocol is a command-data model. The Master sends a command to the Slave. Then it sends some data. The only command that is not followed by data is the “Frame End” command. Command Data Description Data Length Data Format Channel Data to be graphed No Restriction 8 Bit (Each data packet is 8 Bits, However each data element to be graphed can be up to 16 Bits) Frame End No Data 0 NA The Arduino will send the “Channel Command” with the selected channel before sending any data. See the figure below. It shows two channels being written to followed by a “Frame End” Command. The number of eight bit data packets that follows the “Channel Command” is dependent on user code. There are no restrictions on how many data packets follow the “Channel Page 20 User Manual EPT SPI Serial Graph Tool For the UNO Command”. Each 8 bit data packet in both the commands and data follow the SPI signaling convention. This means the Arduino SPI library is used to send commands and data over the SPI bus. Serial Graph Tool Arduino Coding This section will explain the example code and how to create your own Arduino Serial Graph. Open the Arduino IDE and locate the Arduino Example code. Load up the Arduino_SGTool_Analog_Monitor_U2 sketch. The first thing to add to the sketch is #include “EPT_SGTool.h" And #include <SPI.h> The first include is the EPT Serial Graph Tool library and the second is the Arduino SPI library. Page 21 User Manual EPT SPI Serial Graph Tool For the UNO Next, declare an integer Channel and integer AnalogReadValue. The Channel variable will hold the channel number that the data will be written to. The AnalogReadValue will hold the result of the analogRead() function. Page 22 User Manual EPT SPI Serial Graph Tool For the UNO Next, declare the buffer to hold the data that will transmitted to the Serial Graph Tool. The buffer is limited to a size of 500 integers. This limit is important because the Arduino Uno has an SRAM of 2048 bytes. 500 integers will take up half of the memory. The user code will need some amount for the program and some amount for the stack. Page 23 User Manual EPT SPI Serial Graph Tool For the UNO The setup() function is next. The code will set the analog I/O’s as inputs, define the variables, and initialize the Serial Graph Tool. Page 24 User Manual EPT SPI Serial Graph Tool For the UNO Page 25 User Manual EPT SPI Serial Graph Tool For the UNO Next, the code enters the main loop() function. First thing to do at the top of the loop is to check the channel number and make sure it has not incremented above the highest channel number. If so, roll the channel back to zero. This will allow each channel to fill up a data buffer and transmit it to the Serial Graph Tool. Page 26 User Manual EPT SPI Serial Graph Tool For the UNO Next, the code enters the buffer loop. A for loop is set up so that one data point is entered into each element of the 500 integer buffer. The channel number was set by the definition of the “Channel” variable. Page 27 User Manual EPT SPI Serial Graph Tool For the UNO Each time through the for loop, the analogRead() function is called with the Channel number providing the pin number for the analog input. The result of the analogRead () function is stored in the variable AnalogReadValue. This value in turn is stored into the buffer element selected by the for loop. Page 28 User Manual EPT SPI Serial Graph Tool For the UNO When the for loop has iterated 450 times, the channel buffer has enough data to fill up the Serial Graph Tool display for the selected channel. So, the for loop exits. EPT_SGToolWriteBlockData()” is called. This function takes the channel number, number of bits per data element and total number of elements in the buffer and a pointer to the buffer and transmits this data to the Serial Graph Tool. Page 29 User Manual EPT SPI Serial Graph Tool For the UNO Nex, the “EPT_SGToolFrameEnd()” function is called to graph the data in the buffer. Page 30 User Manual EPT SPI Serial Graph Tool For the UNO Finally, the “Channel” variable is incremented by one and the process starts over again. This process will go through and record the output for the next analog input (A1) into the “ChannelBuffer1”. Then the data is transmitted to the Serial Graph Tool and graphed to the display. This process repeats for all 6 channels. Then, it starts over again at channel zero. This will continue forever, or at least until the power is removed. Page 31 User Manual EPT SPI Serial Graph Tool For the UNO Make sure the appropriate board and serial port are selected. Click on the “Upload” button, and the code will load onto the Arduino Uno. Next, open up the Serial Graph Tool to actually graph your data. VisiPort 2 Using the GUI Connect the EPT-220X-DB-U2 to the Arduino Uno. Connect each board to an open serial port on the PC using both USB cables. Make sure that an example sketch is loaded into your Arduino. Go to Start->Serial Graph Tool to view the files and folders. Page 32 User Manual EPT SPI Serial Graph Tool For the UNO Just click on the Serial Graph Tool icon to launch the application. When the application loads, click on the drop down box at the upper right of the window. Select the Serial Graph Tool 0 in the list. Next, Click “Open” and “Start”. The Ardiuno data will display on the graph. When the Serial Graph Tool connects with the EPT-220X-DB-U2 and the Arduino Uno is Page 33 User Manual EPT SPI Serial Graph Tool For the UNO running the Analog Monitor code, the display will show all six analog inputs on the screen. All of the channels will be grouped at the same spot on the graph by default. To separate these channels, click on the drop down box underneath the “Channel Select” lable. Page 34 User Manual EPT SPI Serial Graph Tool For the UNO Select a channel and us the “Vertical Position” slider to adjust the position of the channel graph in the display. Notice that the channel indicator highlights in bold when the channel is selected. Page 35 User Manual EPT SPI Serial Graph Tool For the UNO Grab the “Vertical Scale” slider and push up on it until the scale is 1/3. This divides each data element in channel 1 by 1/3. Page 36 User Manual EPT SPI Serial Graph Tool For the UNO Repeat this process for all six signals. Leaving one division between each channel. Page 37 User Manual EPT SPI Serial Graph Tool For the UNO Each channel can also be scaled in the Horizontal Scale. Provide Channel 1 with a signal. A simple way to do this is to touch your finger to the analog input. Then click the “Stop” button. The “Stop” button will cause the Serial Graph Tool to stop filling the circular buffers with new data. All of the previously stored data is preserved in the circular buffers. This allows to you to scroll through the data to view events that occurred in the past. Page 38 User Manual EPT SPI Serial Graph Tool For the UNO Turn off each channel (except for Channel 1) by first selecting the channel, then clicking on the “On/Off” button directly below the “Channel Select” drop down box. Page 39 User Manual EPT SPI Serial Graph Tool For the UNO Select Channel 1 and grab the “Time (Scale) “ slider and slide it to the left. Notice the signal is zooming out. Page 40 User Manual EPT SPI Serial Graph Tool For the UNO Next, slide the “Time (Scale)’ slider all the way to the right. Notice that the display is zooming into the signal. Page 41 User Manual EPT SPI Serial Graph Tool For the UNO Grab the Horizontal Position Slider and pull it to the left. The display slides to the left. The data is actually being pushed to the right, but the effect is to view older data. Click the “Rst” button to remove the horizontal scaling and display the data without the scale. Page 42 User Manual EPT SPI Serial Graph Tool For the UNO Grab the Horizontal Position Slider and pull it to the right. The display slides to the right. The data is actually being pushed to the left, but the effect is to view the newest data. When the slide right gets to the beginning of the newest data, it cycles around and starts to display the data at the beginning of the circular buffer. This data is the oldest in the buffer, as the newest data overwrites the oldest data in the buffer. Page 43 User Manual EPT SPI Serial Graph Tool For the UNO Data can also be viewed as 8, 10, 12, or 16 bits. The Arduino code must store the collected data as 8, 10, 12, or 16 bits before selecting these settings in Serial Graph Tool. To do this, closes the EPT Serial Graph Tool 0 device and exit out of the application. Open the Arduino SGTool Analog Monitor example code in the Serial Graph Tool folder. Use the “Rst” button to reset the location of the horizontal position of the data to the start of the most recent 450 data elements of the circular buffer. Page 44 User Manual EPT SPI Serial Graph Tool For the UNO Scroll down to the EPT_SGToolWriteBlockData() function. Change the “EIGHT_BIT_DATA” parameter to “TEN_BIT_DATA”. Page 45 User Manual EPT SPI Serial Graph Tool For the UNO This will store each sample of the analogRead() function as a ten bit word instead of an eight bit byte. Then, go to Serial Graph Tool and re-open it. Notice that the data oscillates from zero to the top byte data. This is because the data is now being transmitted as to byte packets. In eight bit mode, the data is transmitted in single byte packets. To display this data correctly select the “10 Bit” radio button. Page 46 User Manual EPT SPI Serial Graph Tool For the UNO The Serial Graph Tool converts the upper byte and the lower byte of the data into the correct ten bit format. Each of the analog inputs are correctly displayed. The same directions hold true for twelve and sixteen bit data. Serial Graph Tool So, that is all there is to the Serial Graph Tool. It is up to the user to add it to their Arduino project. Page 47