1
PHI L I P S
PM 3 370 LA B O RA T O R Y P L U G-I N O S C I L L O S COP E
941 033 70011
MANUAL
OPERATING
11670101
2
IMPORTAI\IT
In correspondenceconcerning this apparatus, please
quote the type number and thc serial numberas given
on the type plate at the rear of the apparatus.
N.V. PHILIPS'GLOEILAMPENFABRIEKEN . EINDHOVEN . THE NETHERLANDS I97O
-
P H IL IPS
industrial
equipment
division
L7 -9-1 970
cd 667
GENERAL
TtrST AND MtrASURINGINSTRUMENTS
RE: TEST INSTRUMENTS FOR OSflLLOSCOPES
The importance
of using appropriate
vicing of equipment Ís now generally
ment and quality-control
specialists,
test and calibrating
recognised.
A. REAL-TIME
investing
in the following
for pre-sa1e testing and ser-
study, in co-operation
with develop-
we compÍled a recommanded list especially for oscilloscopes.
Depending on the local needs and availabilities,
consider
instruments
After careful
we advise the National Service Organizations
to
test instruments.
OSCILLOSCOPES
a. C.alibraUng deflecti
b. Checking the square-wave
response of probes and attenuators
For a) and b) use Oscilloscope Calibrator,
type 156, by G & E Bradley Ltd, Electrical
House, '
Neasden Lane, London NW10, England.
c. Checking bandwidthx)
For the new procedure. applicable to PM 3200, PM 3210, PM 3220/2L, PM 3230, PM 3231, PM 3250
and future oscilloscopes or units up to 10i MHz bandwidth, a constant amplitude generator,
cable and a 50 O termination
pad, ordering code PM 9585 (i.e.
a 50 O
type XE 101 96) are required.
The advised generator is Tektronix type 191.
In general, an oscilloscope may be rejected when the ggof
der test and the measuring
instrument
the tolerances of the oscilloscope un-
are exceeded.
d. Checking rise timesx)
square-wave generator Tektronix type 284. As under c) the generator
should be connected via a 50 g cable, terminated by a 50 O pad. The rise time of the generator
For this check we recommend
should be taken into account and preferably
PM 3400.
be checked with a samplÍng oscilloscope,
e. g. PHILIPS
e. Checking pulse response (overshoot, ringing etc. )*)
The generator mentioned under d), should be connected via a 50 0 cable and a General Radio power
divider,
type 874-TPD, terminated at the oscilloscope input by a 50 O termination
pad, General
Radio type 874-WM.
A sampling oscilloscope e.g.
PM 3400 must also be connected to the power divider in order to
check the pulse form to which the display on the oscilloscope under test should be refemed.
f. Checking trigger
functions
PHILIPS Sine-wave Generator type PM 5125 (or PM 5160) is recommended for this check.
g. To check the PM 3370 main frame. use the PHILIPS Test Unit PM 3363
B. SAMPLING OSCILLOSCOPES
a. Checking the triggering
and the time-base
For the checking of these circuits
circuitx)
we recommend the use of Tektronix
Pulse Generator
type 284.
PHILIPS Digital Multimeter
Pls.{242L, PHILIPS Timer/Counter PM 6630, a 10 dB attenuator e.g.
General Radio 874G10, a 50 O cable and a 50 g termination pad e.g. PM 9585.
b. Checking mÍxer and deflection
amplifier
For these checks we recommend the use of PHILIPS Digital Multimeter
PM242L and a 50 O e.g.
4822 320 10012.
c. Checking the stabilized
The recommended
supply voltages and the low-voltage
instrument
rectÍfier
for this check Ís the PHILIPS Digital
should be connected to the circuits
Multimeter
PM 2421 which
under test via a screened cable.
d. Checking the sampliag amplifierx)
For this check .ve recommend the use of Tektronix
Pulse Generator type 284, two 6 dB attenrr;rtors
e.g. General Radio 874G6, one 20 dB attenuator e.g. General Radio 874G20 and a 50 O cable with
a length of <30 cm e.g. 4822 320 10009.
For the tangential noise measurents we recommend PHILIPS Pulse Generator type PM 57?0, together with a 10Ox attenuator and a 50 O cable e.g.
e. Checking and adiusting after replacement
The recommended
instrument
4822 320 10012.
of the sampling satex)
is the Tektronix
Pulse Generator type 284 with two 50 O cables of
equal length and with a propagation delay of less than 2 ns, e.g.
e.g.
4822 320 l00LZ and a BNC T piece e.g. Amphenol UG-274U.
4822 320 10009, a 50 O cable
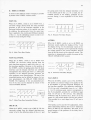
c. SURVEY
OF THE RECOMMENDED INSTRUMENTS
Oscilloscope
Calibrator
Constant -amplitude
generator
G&E BRADLEY type 156
TEKTRONIX type 191
tr
Square -wave generator
TEKTRONIX type 284
Sampling oscilloscope
PHILIPS type PM 3400
Sine -wave generator
PHILIPS type PM 5125 or P M 5 1 6 0
Digital
multimeter
PHILIPS type PM 242L
Test unit
PHILIPS type PM 3363
Counter/Timer
PHILIPS type PM 6630
Square -wave generator
PHILIPS type PM 5770
Termination
pad
PHILIPS type PM 9585
Termination
pad
GENERAL RADIO type 874-WM
Power divider
GENERAL RADIO type 874-TPD
6 dB attenuator
GENERAL RADIO type 874G6
10 dB attenuator
GENERAL RADIO type 874c10
20 dB attenuator
GENERAL RADIO type 874c20
50 O cable 20 cm
PHILIPS code 4822 320 10009
50 A cable 60 cm
PHILIPS code 4822 320 10012
BNC T piece
AMPHENOL type UG-274V
BNC-GR adapter
GENERAL RADIO type 874487A
x) BNC and General Radio plugs can be coupled vla General Radio Adapters type 874-QB?A
>
PH I L I PS
1{ . V . P H I I I P S '
G T OE I tA i I
PE IIF AB R IE TE i l .
E Il { D H OY E l {
-l
Í.-
Circular letter
Confidentia 1
.
T c l . Adr .: PH I!l PE
t_
- Bctr.
Tcl. Elndhovcn óOOOO - Ert.
- App.
H.F. oscilloscope PM 3370 and
Y plug-in unit PM 3372,
- Du dópt. - Von
Abt.
Service P. I. T.
BH/FS/9729.
-J
Conc.
El l l D H 0YEl l
to the T&M Service lvÍa
nag er
From dcpt.
Re.
IIE D E R tA l {D
I
Date
- Detum
4 -3 -t 9 7 |
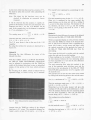
The current input (input f) of all PM 3370 main frames with serial
numbers ftom D772, has been nodified in order to obtain optimum
pulse response.
A series network (90.9O, 1.2 pF, 90.9 Q) has been connected betr,reen
the input terminals of unít 12. Consequently, all Y plug-in units
W,3372 from serial number D670 have been adjusted before Leavíng
the factory,
to suít the requirements of the modified PM 3370.
Wtren such a PM 3372 with a serial number fron D670 is used with a
pre-rnodification
PM 3370 nain frame (i.e. a naín frame with a
serial number prior Eo D772), an ovêrshoot of approxinately 8 Z
on Èhe pulse will be observed. For this reason, rre are currently
supplying all PM 3372lïl afi, -/O2 units complete with a package
(ordering number 5322 | l6 50799)
containíng tno 90.9 íl resístors
and one 1.2 pF capacitor (ordering number 5322 122 3OlO2) together
sheet Cd 690 which recomrends
with the enclosed service infornation
the PM 3370 nodification.
Those Wl 3372 units with serial numbers prior to D670 will give an
8 Z undershoot (rounding off) during the first
6 ns of the puLse
when used ín conjunction with a nodified PM 3370 main fra.me. In this
case, ne recoÍmend a h.f. readjustment or the return of the PVI 3372
to Eindhoven for this readjustment.
The readjustment wil-l be done free of charge, provided thaË the units
concernêd arê rêturned before December 3lr 1971. Each readjusted unit
returned by us will bear a sticker which states that the readjustment
has been made.
For fixed conbinations of unuodified main frames and Pl"l,3372 units with
serial numbers prior to D670 the above mentioned rnodification
and h.f.
readjustmenË arê not necessary.
2E22| 00 05002
Circular
Letter
to the T&lí Service
Manager.
'2'
4-3- 197| .
Confidential,
Tesr uni r PM 3363
The test unitp pupplied heve also becn edjusted to neet the requirenenrs
of the nodified PU 3370.
rf a PM 3363 unit ie used to chêck input r of a pt'Í 3370 naín frane
whlch has not been nodified, we rec@ênd that the rnain frane in questíon
is teryorariJ.y nodified for the duraÊÍon of rhe check.
Ng.te
Returne can only be aceeptêd if Bhc goods arê returned without charge
to us, and provided theÈ they have been allocated a reference number
which uay be obtained from Mr. Potter, PXT Service, Eindhoven.
p . p . N. V. PHILTPSI GIOEIIAI'íPENFABRTEKEN.
Enelosura:
cd 690.
P HI LIPS
industrial
equipment
division
1-3-19?1
PM ggtz/ o.
cd 690
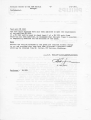
In the main frames PM 33?0 with serlal numbers from D7?2 onwards, a modification has been
incorporated in the current input (input I) which is used for h.f. units.
Your unit PM 3372 (and all units PM 33?2 with serial numbers from D670 onwards) has been
àdjusted in a modified frame PM 33?0.
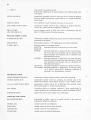
If your main frame carries a serial number below D772, the enclosed netrvork (2x90.9 0 and
1.2 pF) should be fitted on to the input terminals of unit.12 of your main frame (Fig. 1).
This will result in an optimumpulse response and obviates further recalibration orh,f.
readjustment of your PM 3370.
11BU-Y
7BU{
a
23BU-Y
Fig. l. Part of the printed circuit board at the rear of the Y plug-in compartment.
9499 448 03911
Contents
GENERAL INFORMATION
Page
8
f. Introduction
8
rr. Specification
9
A. Electrical
B. Physical
9
l1
rII. Principles of operation
A.
B.
C.
D.
E.
F.
Y Signal Path
Trigger Path
Delayed Time-BasePrinciples
Display Modes
MiscellaneousCircuits
Detailed Operation of the
Tirne-BaseGenerators
I}IRECTIONS FORUSE
Installation
A.
B.
C.
D.
v.
TJ
Mains Adjustmentsand Fuses
Earthing
Plug-in Units
SwitchingOn
15
15
15
r6
t7
18
18
2T
22
22
22
22
22
Operation instructions
23
A. Controls
B. Operating and Applications
Voltage Measurements
Time and Frequency Measruements
Comparisonof Methods
Time Ratio Measurements
Display Switching
Phase Measurements
PhotographingScreenTraces
Triggering
Y Output Signal
23
25
25
26
28
30
31
32
32
32
34
4
List of illustrations
Fig.
1
2
3
4
s
5
6
7
8
9
10
11
L2
13
l4
15
16
L7
18
T9
20
2L
22
23
24
25
26
27
Page
GeneralView
PM 3370- Block Diagram
Derivationof DelayedPulse
DelayedTime-BaseWaveforÍns
Gating WaveforÍnsof DelayedTime-Base
Main Time-BaseDisplay
Main Time-BaseIntensifiedDisplay
DelayedTime-BaseDisplay
AlternateTime-BaseDisplay
Time-BaseGenerators- Block Diagram
Saw-toothGenerator- Block Diagram
Saw-toothGeneratorWaveforms
MeasuringPeak-to-PeakVoltages
MeasuringInstantaneousVoltages
MeasuringTime Intervals
Definition of Rise-Time
MeasuringRise-Time
Time Measurements
using
Time Measurements
DelayedTime-Base
Time Ratio Measurements
Effective Use of Display Switching
Main Time-BaseTrigger Controls
Effect of Double Triggering
Double Triggeringon PulseTrains
Double Triggeringin ALTERN. Mode
Double Triggeringin CHOPP.Mode
Usingthe Y Output Signal
7
13
16
l6
L6
17
17
17
17
19
19
19
25
26
27
27
27
28
29
30
31
32
33
33
33
34
34
sf2 s!(3sK4
-t/tft
BUI
LA3
LA4
SK9
I
R3
R4
R5
Ró
sK13
sK14
sKl5
BU2
6
LA7
R r0
SKIó
nrr/srrz
nra/sKrB
BU3
LA8
SKI9 BU4 SK2O
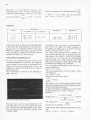
Fig. I. GenerctlView
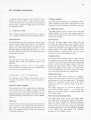
GENER A LI NF O RM A T I ON
This section of the instruction manual deals with introductory material and basic information of interest
to both operating and servicing personnel.
It includes specifications of physical and electrical
ciata and a description of the operating principles of
the instrument to block diagram level.
The three chaptersfound in this sectionare:
r.
INTRODUCTION
II.
SPECIFICATION
III.
PRINCIPLESOF OPERATION
l. Introduction
The PM 3370 oscilloscope, shown in Fig. l, is a
general-purposeinstrument designedfor a wide range
of laboratory applications. This versatility is achieved
by a series of modular plug-in units cach covering
one or more aspectsof the applications field.
All Y plug-in units of the PM 33 . . series can be
accommodated with the exception of the LF unit
PM 3351. Choise of a plug-in unit, for example, permits the display of multi-trace signals, up to four,
either separatelyor in combination. A dual-trace unit,
the PM 3372, provides for a deflection coefficient of
I mV/cm and a bandwidth of 150 MHz.
A signal delay line permits the leading edges of fast
signals to be displayed. Detailed observation of complex signals on an expanded time-base is facilitated
by means of a built-in delayed time-base generator.
For easeof operation, the delayed time-base generator
controls are arranged in conformity with those of the
main time-base generator. Each time-base has its
own trigger unit.
Further attention has been paid to the ergonomic
layout of 'other front-panel controls: the colour
matching of controls that are located in separate
groups but have interdependent functions also facilitates operation of the oscillcscope.
The PM 3370 incorporates a rectangular, flat-faced
cathode ray tube with an illuminated internal graticule
with obviatesmeasuring errors due to parrallax.
The use of silicon transistors throughout the oscilloscope results in a high degree of reliability.
Provision is made for mains operation over the range
I l0 V to 245 V by means of a seriesof primary connections on the mains transformer.
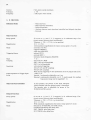
ll. Specification
v
Properties expressed in numerical values with stated
Iolerances are guqranteed lor nominal mains voltages.
Numerical values without tolerances serve as a guide
and represent the characteristics ol an average instrument,
A. ELECTRICAL
I.
t
vz
C.RT. CIRCUIT
c.RT.
Dl3-451 GH/45, rectangularwith internalgraticule.
6 cm r l0 cm
mediumlong (P3l)
15 kV
d.c. coupled
internalwith continuouscontrolof illumination.
5 V peak+o-peaksignal required at 500 Hz to 50 MHz for visible
intensitymodulation.
push-buttonfor reducingdeflection sensitivityfor locating the trace on
the screen.
Type
Effective screenarea
Phosphor
Total acceleratorvoltage
Unblanking
Graticule
External Z Modulation
Beamfinder
2. Y CHANNEL
Final Amplitier
Type
Delay
Rise-time
,
d.c. amplifier
by internal delayline (delay 80 ns), effectivedelay )20 ns.
input I: 1.7 ns (equivalentbandwith210 MHz)
input II: 5 ns (equivalentbandwith 70 MHz)
Plug-inunits PM 3332.PM 3334,PM 3342.PM 3344and
PM 3379automatically
useinput Il.
Y Output
Coupling
Volts out
Resistance out
If Y Output terminated with 50 Q
|
Volts out
,-
a.c. coupled, fra" low 1 kHz
1 Y / cm deflection of the trace;
9 V maximum.
200 Q
Bandwidth
200 mV / cm deflection of the trace;
1.8 V maximum.
100 kHz to 50 llu'.{Hz
Plug-in Unit
See the relevant specification of the plug-in unit in use.
Calibration Unit
Voltage
''ív
Tolerance
Frequency
for R1 : 50 Q: 40 mV, 80 mV. 200 mV, 400 mV peak-to-peak
for Rt : 500 Q: 4 V Peak-to-Peak
* lVo
2 kHz squarewave voltage
10
Current
Tolerance
Frequency
8 mA peak-to-peak maximum
'f lVo
?, kHz square wave current
3. X CHANNEL
DeflectionModes
-
Main time-base
Main time-baseintensified
Delayedtime-base
Alternate betweenmain time-baseintensified and delavedtime-base
External
Main Time-base
Sweepspeeds
Magnification
Mode
TriggeringSource
Slope
Coupling
Sensitivity
Input Impedanceof Trigger Input
Level
Main Timebase Intensified
50 ns/qn to 1 s/cm (1,2,5 sequence)
in 23 calibratedsteps.Continuous control betweensteps(uncalibrated)
Tolerance-l 3Vo 1+ 5Voin I s/cm position)
l0 X (+ 2Vo)
with maximum magnificationthe fastestsweepspeedis 5 ns/cm
automatic(AUTO)
triggered(TRIGG.)
singleshot (SINGLE)
internal (INT.)
external(EXT.)
internal at mainsfrequency(MAINS)
* or (LF) 3 Hz to 1 MHz
(HF) 2 kHz to full bandwidth
(DC) 0 to full bandwidth
with externaltriggering;
200 mV (LF and HF coupling)
400 mV @C coupling)
With internal triggeringseethe specificationof the Y plug-in unit in use.
I MQ, 15 pF
Internal: continuouslyadjustableover 6 cm
External: continuously adjustableover 3 V peak-to-peakfor medium
frequencies(rangecan be magnified5 X )
In this position, the portion of the main time-.base
which coincideswith the delayedsweepis intensified.
The intensity ratio is adjustable by means of the
INTENS. RATIO control.
Delayed Time-base
Sweepspeeds
Magnification
Mode
50 ns/cm to 1 s/cm (1,2,5 sequence)in 23 calibratedsteps.Continuous control betweensteps(uncalibrated).
position)
Tolerance * 3Vo (+ 5% in I r/
"10 X (+ 2Vo)
With maximum magnificationthe fastestsweepspeedis 5 ns/cm
Selectedby AFTER DELAY TIME switch;
STARTS immediately after delay time,
EXT. TRIGG. after delay time,
INT. TRIGG. after delaytime.
11
Slope
Coupling
Sensitivity
Input impedance
Level
Delay
Jitter
Alternate between
Main Time-base Intensified
and Delayed Time-base
as detailed for main time-base
adjustable up to 10 seconds. Incremental multiplier linearity, typically
O .Z V o.
<0.005Vo of the final value of the range
In the ALTERNATE position, the main time-base
intensified and the delayed time-base aÍe displayed
alternately. The vertical separation (TRACE SEPARATION) and intensity ratio are continuously adjustable.
External Deflection
Amplifier
Input
Impedance
Deflection coefficient
Bandwidth
Undistorted deflection
d.c. amplifier
asymmetrical; BNC connector
1 Me; t5 pf
10 mV/crn and 100 mV/cm switchable
continuously adjustable I : 10 (not callibrated)
0 to l M H z
l0 cm maximum
4. OUTPUT SIGNALS
Gate of main time-baseand delayed
time-base
Sweepof main time-base and
delayed time-base
Delayed trigger pulse
Calibration voltage
Y Output
0 V to 2 V; R' _ 1 kQ V; maximum output current is 2 mA
0 V to 8 V; R, _ 5 kQ; maximum output current is 1.6 mA
2 V i Ri - I kQ; maximum output current is 2 mA
As detailed in Calibration Unit specification in Section 2.
see Section 2.
5. POTVER SUPPLY
Voltage
Power consumption
8.. PHYSICAL
a d j u stabl eforl l 0 V , 125V ,145 V ,200 V ,220 V and 245 V at 46Hz
to 60 Hz. Effect of + l0% variations, negligible.
1 8 0 W maxi mum.
Height:
Width:
Depth:
Weight:
37 cm
28.5 cm
56 cm (overall)
25 kg
Plug-in units available:
PM
PM
PM
PM
PM
PH
PM
3332 3334 3342 3344 3363 3372 3379 -
50 MHz vertical amplifier (500 pVlcm)
60 MHz vertical amplifier (10 mV/cm)
50 MHz dual-tracevertical amplifier (10 mV/cm)
50 MHz four-trace vertical amplifier (10 mV/cm)
Test unit
150 NíHz dual-trace vertical amplifier (l mV/cm)
Spectrum analyserunit
r3
Y- PLUG
---'l
I
I
INPU T I
IN PU TII
DEL A Y - L I N E
DRIVER
Y- O UTPUÏ
AM PLI FI EF
D E LA Y -LIN E
F RO M
Y - P LUG - I N
UNI T
BEAM
FIN D E R
T R IG GE RIN
E X TE R N A L
Y -OU TP U T
A MP LIFIE R
I
__J
TRACESEF
Y- OUTPUT
. AUTC
OTRI G (
SET READY
OS INGL
TRI G G ER
AM P LIFIE R
SOURCE
TRI G G ER
COUPLING
O INT.
O EXT.
LEVEL
TR IGGE R
P U LS E
S H A P ER
OMAINS
SLOPE
D E L'D TRI 6(
AFTE R D E LA Y TIME
O STARTS
T R IGGE R
OEXT.
RIGGERABLE
O INT.
TRIGGE
RABLE
C O UP L I N G
LE V E L
TR IGGE R
P U LS E
SHAPER
SLOP E
x - tNPuroF-
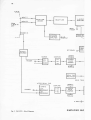
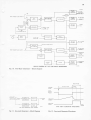
F'ig.2. PM 3370 - Block Diagram
SIM PL IF IEDB LO
E .H .TU
. NIT
Z.MOD @4-1
F O C U S ASTI GM
l
INTENS.
\
U N B L AN KIN G
C IR C U IT
--.
+GATE SWEEP
M A IN TIME B A S E
\y
T I ME /cm 0 R
DE LA Y TIME
o M AI N T. B
C OMPA RA T O R
.Y
} GATE
SWEEP
D ISP L AY
S WIT C H
.- MAIN T.B.
IN T E N S
OALTERN
TIME B A S E
A MP LIFIE R
X-IN PU T
P 0sl i l oN
DELAYEDTIM E B A S E
\l-l
T I ME /cm
P OW ER S U P P LY
PR E AM P .
C A LIB R A TION
U N IT
CK DIAGRAM
PM3370
MA5677
15
lll. Principlesof oPerotÍon
A simplified block diagram of the PM 3370 oscilloscope is shown in Fig. 2. The functions of the
various blocks can best be understood by considering
first of all the Y signal and trigger paths and secondly
the time-base circuits.
Y Output Amplifier
The signal from the delay line is amp,lified in the Y
output amplifier stage before being passed to the
segmentedY deflection plates of the cathode ray tube.
B. TRIGGER PATH
A.
Y SIGNAL PATH
The Y deflection signal, derived from the Y plug-in
unit, is applied symmetrically to the delay-line driver.
The trigger signal from the Y plug-in unit is fed to the
triggeramplifier.The output of the trigger amplifier is
passedto the trigger circuitsof the main time-baseand
the delayedtime-base.
Delay-line Driver
Source Selector
The delay-line driver has two inputs, a current input
(input I) and a voltage input (input II). The requisite
input is selectedautomatically on the insertion of a
plug-in unit. The units already available for the
60 }l.{Hz plug-in oscilloscope PM 3330, i.e., units
PM 3332, PM 3334, PM 3342 and PM 3344,usethe
voltage input (input II).
The main time-base trigger circuit accepts this signal when the three-position source selector switch
is in the INT position. The EXT TRIGG position
permits the time-base to be triggered by an external
signal applied at the EXT TRIGG socket. In the
MA IN S posi ti on a si gnal deri ved from th e m ains
transformerprovidesthe triggeringfacility.
Coupling Selector
Rise-time
The rise-time for the current input is | .7 ns. For
example, when using the dual-trace plug-in unit
P M 3372:
Total rise-time - V1.7, + 1.72 : 2.4 ns approx.
The rise-time for the voltage input is 5 ns. When using
o ne of t he unit s me n ti o n e da b o v e :
Total rise-time -
52 nanoseconds
l, u*
The delay-line driver provides two outputs, one for
the delay line and the other to feed an external Y
amplifier.
/t
Externat Y Output Amplifier
This amplifies one of the outputs from the delay-line
driver to provide an a.c. coupled Y output, available
at a socket on the rear of the instrument, e.9., for
triggering purposeswhen signals,not related in time,
are displayedusing a multi-trace unit in the ALTERN.
mode.
Delay Line
The delay line, fed from an output of the delay-line
driver, consists of two standard 75-ohm coaxial cables, each 18 m long, giving approximately 80 ns
delay. This standard cable has both ends terminated
to minimize reflections.
The three-position coupling solector switch permits
the frequency range of the trigger amplifiers to be
reduced to remove interfering frequency components
(hum or noise) from the trigger signal. In the LF
position the range is from 3 Hz to I MHz, in the HF
position the range is from 2 kHz to the upper limit
of the bandwidth and in the DC position the range
coversthe whole bandwidth (0 to upper limit).
Trigger Pulse Shaper
In the trigger pulse shaper circuit a d.c. voltage is
added to the trigger pulse, adjustableby the LEVEL
potentiometer, to shift the trigger point. The control
knob has a "pull-push" action which in the "pull"
position increases the external trigger range by a
factor
"f
The trigger signal can be reversed in polarity by
means of the SLOPE switch ( + -) to permit triggering by the positive-going or negative-going edge
of the trigger signal.
Main Time-base Operating Modes
The trigger pulse shaper converts the trigger signal
into sharp positive and negative pulses. The negative
pulses áre used to trigger the time-base generator,
while the positive pulses are used in the automatic
free-run circuit. The saw-tooth voltage from the main
time-base generator is fed to the time-base amplifier
in the MAIN T.B. and MAIN T.B. INTENS.
positions of the X DEFL. switch.
t6
Three modes of operation of the main time-base are
determined by the three-position switch AUTO/
TRIGG/SINGLE.
In the AUTO mode, the automatic free-run circuit is
operative when triggering pulses aÍe absent. Thus a
trace, though not necessarily a stationary one, is always displayed even though the trigger controls may
not be correctly adjusted. In this wêy, correct adjustment of the oscilloscopetrace is greatly facilitated.
However, when trigger pulses aÍe present the circuit
reverts to the normal triggered mode. If trigger pulses
disappear, the time-base free-runs after a lapse of
0.5 seconds.In the TRIGG. mode, a display is present
only when suitable trigger pulses are available.
In the SINGLE mode, eventsthat occur only once can
be observed and photographed if necessary.It is often
desirable to ensure that only one saw-tooth is generated, even though other trigger pulses might follow
the phenomenon of interest. In this mode, after the
trigger pulse has initiated the main time-babe to
produce a saw-too'th voltage, the circuit is unaffected
by further trigger pulses until it is either switched to
the TRIGG. mode or reset for the next event by
operating the SET READY push-button.
C. DELAYED
TIME.BASE
PRINCIPLES
The saw-tooth voltage derived from the main timebase generator is passed to a comparator where it is
compared with an accurately adjustable d.c. voltage.
The comparator output voltage is then pulse shaped
by a reset multivibrator to provide the required delayed pulse. As indicated in the relevant waveforms
of Fig. 3., the pulse shaper output voltage drops to
its original value at the end of the forward sweep of
the main saw-tooth voltage.
the c.r.t. The time relationship between these wave.forms is shown in Fig. 4.
SAWTOOTFI VOLTAGE
DEIÁYED
SAWIOOTH VOLTAGE OF
DEIÁYED TIME.BASE
UNBIÁNKING PULSE OF
D EIÁYED T IM E- BASE
Fig. 4. Delayed Time-Base Waveforms
With the AFTER DELAY TIME switch in the
START position, the delayed time-base starts immediately on receipt of a pulse from the reset multivibrator.
Gated Operation of the Delayed Time-Base
With the AFTER DELAY TIME switch in the INT.
TRIGG. or EXT. TRIGG. position, the delayed
trigger pulse prepares the time-base for the normal
triggered mode of operation. The next trigger pulse
from the internal trigger unit or from an external
source (dependent on switch setting) arriving after
the set delay time actuates the delayed time-base,
which is then locked to this trigger signal. The waveforms of Fig. 5. illustrate this $ating procedure. The
total delay is now the sum of the set delay time (i.e.,
the product of the values indicated by the DELAY
TIME and DELAY TIME MULTIPLIER controls)
and the extra delay indicated in Fig. 5.
DEIÁYED
SAWTOOTH VOLTAGE
DEIÁYED TRIGGER PUI-SE
AVAII,ABLE AT o/P SocKET
PULSE
TRIGGER PUI,SES FROIVI THE
DEIÁYED TRIGGER UNIT
OUTPUT OF COI\{PARATOR
DEI,AYED PULSE
PUI,SE
the dela.ved time-base
rll
lll
!
,l
SAWTOOT}I VOLTAGE OF
DEIÁYED TIME -BASE
PULSE OF
UNBIÁNKING
DEIÁYED TII\ÍE.BASE
Fig. 3. Derivation oÍ Delayed Pulse
Fig. 5. Gating WaveÍorms of Delayed Time-Base
The delayed pulse is fed to the delayed time-base
generator which then initiates a saw-tooth voltage
and an unblanking pulse, both of which are fed to
The remainder of the trigger circuit for the delayed
time-base generator is identical to that for the main
time-base generator.
r7
D.
DISPLAY MODES
A choise of five different modes of display is possible
by meansof the X DEFL. selectorswitch.
the gating pulse from the delayed tirne-base is fed
to the control grid of the c.r.t. As a result, the intensified portion of the display, produced by the
previous setting, is now expanded to fill the entire
screen.
MAIN T.B.
When the X DEFL. switch is set to MAIN T.8., a
saw-tooth voltage derived from the main time-base
generator is fed via the time-base amplifier to the
horizontal deflection plates of the cathode ray tube.
In addition, the gating pulse from the main timebase is applied to the control grid (Wehnelt cylinder)
of the c.r.t. via the unblanking circuit in order to intensify the trace during the sweep.
TR I G G E R
FJ L S E
C : L A Y : D ; I Mg
S À V J TO O TH
UNELANK
3
3J.SE
V O L TA : . :
ING
PULSE
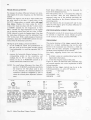
Fig. 8. Delayed Tíme-Base Dísplay
ALTERNI.
TRI G G ERPULSES
Èt AI I J TI M E EASE
SAW TO O THVO LTAG E
UNELANKI NGPULgE
Fig. 6. Main Time-Base Display
When the X DEFL. switch is set to ALTERN. an
electronic switch enables the display of Fig. 7 and
the display of Fig. 8 to be alternately traced on the
screen.The two displays can be separatedby varying
the voltage applied to the vertical amplifier, derived
from the driving circuits of the electronic switch. This
separation is symmetrically variable by means of the
TRACE SEPARATION control.
MAIN T.B. INTENS.
When the X DEFL. switch is set to MAIN T.B.
INTENS. the saw-tooth voltage derived from the
main time-basegenerator is again fed to the c.r.t. via
the time-base amplifier. However, in this position of
the X DEFL. switch, the gating pulsesfrom the main
time-base and the delayed time-base are combined
and applied to the control grid of the c.r.t. During the
operation of the delayed time-base generator the
trace undergoesextra intensification. The start of the
intensified portion can be shifted by means of a tenturn potentiometer, the DELAY TIME MULTIPLIER. The brightness of the non-intensified portion of the trace can be adjusted by means of the
control INTENS. RATIO.
Fig. 7. Main Time-Base Intensified Display
DEL'D T.B.
When the X DEFL. switch is set to DEL'D T.B. the
saw-tooth voltage from the delayed time-bêse, generator is fed to the deflection plates of the c.r.t. and
TR I6 GERPU L SES
SAVJÏOOTHVOL TAGE
U Ii SL AN KI:JGPU L SE
Fig. 9. Alternate Tíme-Base Display
VIA X INPUT
When the X DEFL. switch is set to VIA X INPUT,
this permits an external voltage to be applied to the
X pre-amplifier to provide horizontal deflection via
the time-base amplifier. The deflection coefficient is
l0 mV/cm with a bandwidth from d.c. to I MHz.
A I -to-l0 continuous gain control, incorporated in
the X pre-amplifier, provides for a deflection range
from l0 mV/cm to 100 mVlcm. The deflection
coefficient may be increased by a factor of ten by
means of a pull switch integral with the gain control.
This provides for a total range from 10 mV/cm to
I Y /cm.
This facility can be used for XY applications, where
phase relationships between the X and Y deflections
above 50 kHz are not important. This limit is imposed because of the presence of the delay line in
the Y amplifier.
18
E. MISCELLAIYEOUS CIRCUITS
Time-Base Amplifier
The main function of this amplifier is to amplify the
saw-tooth voltages produced by the time-base generators. In order to improve linearity and accuracy.
the circuit is designedso that the currents drawn by
output transistorsincreaseduring the linear part of
the sweep.The gain of the amplifier can be increased
by a factor of ten (MAGN. control) resulting in a
maximum sweep rate of 5 ns/cm. For a detailed
descriptionof this circuit seeChap. 6.
Unblantriry Circuit
The unblanking pulses from the two time-basegenerators are fed, via the unblanking circuit, to the
Wehnelt cylinder of the c.r.t. The d.c. coupling of
this circuit is rcalised by meansof a modulator and
a d.c. restorer. For a detailed description of this
circuit seeChap. 6.
Calibration Unit
This unit suppliesthe voltagesfor the calibration of
the deflection coefficient and for probe adjustments.
Voltages of 400 mV, 200 mV, 80 mV and 40 mV
are availablewith an internal resistanceof 50 ohms.
A voltage of 4 V is availablewith an internal resistance of 500 ohms. The squarewave deliveredhas a
frequencyof.2kIIz. Calibration surrentscan be made
available for current probes by short-circuiting the
output terminal. A detailed description is given in
Chap.6.
Power Supplies
The power supplies, which are electronically stabilised, are protected against overloads and shortcircuits. Automatic reset facilities are provided. For
a detailed description of these circuits see Chap. 6.
E.H.T. Power Supply
The e.h.t. voltage is obtained by transforming and
rectifying the output voltage of a 40 kHz push-pull
oscillator.This power supply delivers:
- + 13,000 V with respectto earth, for post-deflection acceleration.The rectifying circuit comprises
a voltage tripler.
- -2,000 V with respect to earth, (stabilised) the
cathodepotential of the cathoderay tube.
This power supply is also protectedagainstoverloads
and short-circuits. For a detailed description of the
polver supply seeChap. 6.
Beamfinder
To facilitate rapid location of an image, the oscilloscope is fitted with a beamfinder.
When the BEAMFINDER push-button is pressed,
the amplification factors of the X and the Y amplifiers are reduced so that the electron beam deflection is confined to the display area of the c.r.t. It is
then a simple matter to centre the image by means
of the position controls.
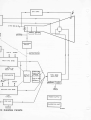
F. DETAILED OPERATION OF
THE TIME.BASE GENERATORS
This section gives a more detailed description of the
functional operation of the time-base generators with
the aid of the block diagram. Fig. 10. Details of the
individual units is given in the Circuit Description,
Chapter 6.
Main Time-Base
The timing of the main time-base is controlled by the
sweep gating multivibrators (SGM). The input signal
to the SGM is the sum of three signals:
the negativetrigger pulses,
the hold-off pulse,
a d.c. voltagefrom the AUTO circuit.
When the SGM is triggered by the trigger pulse, a
voltage step is applied to the integrator which results
in a voltage, increasing linearly with time, at the
output of the integrator; the forward sweep voltage.
This voltage is also passedvia the hold-off circuit to
the hold-off multivibrator, a Schmitt trigger. At a predetermined level, the hold-off multivibrator switches,
to produce a hold-off pulse, the leading edge of which
resetsthe SGM to its original state. This causesthe
integrator output voltage to fall exponentially to its
original value, relatively quickly: the flyback time
period. The hold-off pulse, of longer duration than
this period, keeps the SGM insensitive to further
trigger pulses until the flyback is complete. The output voltage of the hold-off circuit then decreasesby
an amount such that the hold-off multivibrator is
reset, thus allowing the SGM to be triggered again.
If the mode switch is in the AUTO position, positive
trigger pulsesfrom the pulse shaper produce a positive
voltage at the AUTO circuit output. As a positive
voltage does not affect the norÍnal functioning of the
time-base generator, as described above, normal triggered operation is obtained. However, when trigger
pulses ceaseto arrive at the AUTO circuit, its output
voltage decreases.At a certain moment, the SGM
input voltage becomes so low that the saw-tooth
generator commencesto free run.
t9
+ GATE
VOLTA6E
CURRENÏ
CONVERTER
T
FRO M TRI G G ER
PULSE
I
SHAPER
TO INTENSITY
CONTROLCIRCUIT
ïl M E/cm
OR D EL AY Tl M E
I
-A
SWEEP GATING
MULTIVIBRATOR
VOLTA6E
CURRENT
CONVERTER
TO TIME-BASE
EMITTER
FOLLOWER
SWEEP
AMPLIF IE R
AU TO
T R IGGE
S INGLE
tr
HOL D -OF F
CIRCUIT
ALTERNATE PULSE
FOR
Y - PLUG- IN UNIT
TO INPUT
OF ELECTRONIC
SWITCH
RESET
CIRCUIT
COMPARATOR
DELAY TIME
MULTIPLIER
RESET
MULTIVIERATOR
EMITTER
FOLLOWER
DEL'D SWEEP
DELAYEDTRIGGERPULSE
HOLD -OFF
MULTIVIBRATOR
TO TIME-BASE
FRO M
TRI G G ER PULSE
SWEEP GATING
MULTIVIBRATOR
SHAPER
AMPLIFIER
TO UNELANKING
CIRCUlT
T l M E/cm
VOLTAGE
CURRENT
CONVERTER
A F T ER D EL AY
TIM E
C L IPPER
VOLTAGE
CURRENT
CONVERTE R
DEL'O GATE
TO UNBLANKING
CIRCUIT
BLO CK OI A G R A MO F I H E I I M E - B A S E G E N E R A T O R S
Fig. 10. Time-BaseGenerators- Block Diagram
Hotd-otf
time
TRIGGER
PULSE
SGM
OUT PUT
PULSE
ÏIM E.8 ASE
SI6 N AL
TIME- BASE
SIGNAL
HOLD-OFF
PULSE
MA5683
SAW-TOOTH GENERATOR BLOCK OIAGRAM
F ig. I I . Saw-tooth Generator - Block Diagram
SAW-TOOÏHGENERATOR
WAVEFORMS
Fig. 12. Saw-tooth Generator Wavelorms
20
If the mode switch is in the TRIGG. position, the
output of the AUTO circuit is disconnectedfrom the
SGM and the main time-base operates in its normal
triggered mode. In the SINGLE position of the mode
switch, the input d.c. level of the hold-off circuit is
such that the hold-off multivibrator is switched to
the hold-off position. When the SET READY pushbutton is pressed,the hold-off multivibrator is switched back so that the SGM responds to trigger pulses
again. A pilot lamp indicates the state of the holdoff multivibrator.
Delay Circuit
The delay time multiplier supplies an adjustable d.c.
voltage to the comparator to provide a reference
level with which the saw-tooth voltage of the main
time-base is compared.
Immediately the saw-tooth voltage approximates this
level, the comparator delivers a square wave signal
which persists until the end of the flyback. This signal
is applied via the reset multivibrator to the hold-off
multivibrator of the delayed time-base to activate
the delayed sweep.
Delayed Time-Base
The delayed time-base is similar to the main timebase but lacks the AUTO and hold-off circuits. Its
operation is identical to that described for the main
time-base in the single-sweepmode except that the
hold-off circuit is not operated by the SET READY
push-button but by pulses from the reset multivibrator.
The d.c. level applied to the SGM input is determined
by the position of the AFTER DELAY TIME
switch. The various positions of this switch influence
the delayed time-base as follows:
STARTS
- the delayed time-base starts immediately on receipt of a pulse from
the reset multivibrator;
INT. TRIGG. - the delayed time-base is set ready
)
to start on receipt of the next internal trigger pulse;
EXT. TRIGG. - the delayed time-base is set ready
to start on receipt of the next external trigger pulse.
2t
\-/
DIRECTIONSFOR USE
This sectionof the instruction manual is essentially
of interest to operating personnel.It deals with the
information necess
ary for installing and operatingthe
v
equipmentcorrectly,outlines its capabilities,reviews
basic measuringprinciples and suggeststechniques
for obtainingthe best resultsin various applications.
22
lV. fnsto llation
The PM 3370 oscilloscope is despatched complete
with the following accessorieswhich are stowed, for
transit, in the packing space above the instrument.
Thes,eitems are:
1. a mains lead with connector,
2. a shorting link for calibrating current probes,
3. a viewing hood,
4. a green filter,
5. an instruction manual,
6. a BNC 4 mm adaptor,
7. a BNC-BNC cable.
On receipt, remove these accessoriesand the instrument from the carton and examine them to ascertain
whether any damagehas been sustainedin transit.
Remove each of the side covers by means of the two
quick-release fasteners located near the top corners.
Check that all printed circuit cards are fully inserted
and visually inspect the interior. Replace the side
covers by first inserting the lower edges in the appropriate recessesat the baseof the instrument.
A.
MAINS ADJUSTMENTS
& FUSES
Before switching otr, the instrument should be adjusted to the local mains voltage by means of the
voltage adaptor on the rear panel. Provision is made
for selecting 110 V, 125 V, 145 V, 200 V, 220 V
and 245 V. The voltage selectedis displayed through
an ap€rture in the cover plate.
The fuse-holder on the rear panel normally carries
a 2.5 A mains fuse but if the instrument is to be connected to a mains voltage of less than 200 V, the 5 A
fuse supplied should be fitted. The 5A fuse is
mounted on top of the screening partition over the
Y plug-in compartment.
A thermal cut-out is incorporated as an integral part
of the mains transformer to prevent excessive overheating in the event of a prolonged short circuit.
B. EARTHING
In the interests of safety, the instrument should be
earthed via one of the earth terminals (+) on the
front or rear panel, or via the mains flex if this has a
plug with an earth connection.
NOTE: Double-earthingn;ust be avoided as this may
cousehum on the trace.
C. PLUG.IN UNITS
The instrunent normally operatesonly if one of the
Y plug-in units, listed in the specification,has been
inserted. A push-button, situated below the aperture
for the plug-in unit, provides for the releaseof a unit
from the multi-way socket of the main frame to aid
extraction.
D.
SWITCHING ON
The instrument is switched on by means of the
POWER ON switch. The white pilot lamp, adjacent
to the switch, illuminates to indicate this condition
when the mains are connected and the POWER ON
switch is in the "up" position.
Under normal laboratory conditions, a warm-up
period of about fifteen minutes is generally sufficient
before accurate measurementsare taken. If the oscilloscope has been subjected to abnormally low temperaturesor to extrenie humidity, the warm-up period
should be extended accordingly.
WARNING:
This instrument generates high voltage and should
not be operated with the side panels removed. The
mains plug should be removed before attempting any
maintenance work, and qny relevant high voltage
points discharged.
23
V. OperotingÍnstructÍons
Before switchingon, ensurethat the oscilloscopehas
been correctly installed in accordancewith Chap-
ter IV, INSTALLATION, and that the precautions
outlined have been observed.
A. CONTROLS (refer to fig. l)
Main Time-baseGenerator
INT/EXTIMAINS
(SK4)
trigger source,three-positionswitch:
INT:
trigger signalderivedfrom Y plug-in unit.
trigger signal derived from a voltage applied to the TRIGG.
EXT:
BNC socket.(BUl)
MAINS: trigger signal at mains frequency derived internally from
mainstransfoÍïner.
LFIHF/DC (SK3)
triggercoupling,three-positionswitch:
LF: via a band-passfilter for frequenciesfrom 3 Hz to 1 MHz.
HF: via a high-passfilter for frequencies
above2kHz.
DC: direct coupling for triggering on a slowly varying voltage, or for
full bandwidthworking.
+ /- (SK2)
slopecontrol, two-positionswitch:
providesfor triggeringon the positive-goingor the negative-goingslope
of the signal.
LEVEL (Rl/SKl)
continuouslyadjustablecontrol to selectthe level at which the main
time-basetriggers.Incorporatesa pull switchfor X 5 increaseof external
trigger range.
AUTO/TRIGG/SINGLE(SK5)
time-basemode,three-positionswitch:
AUTO:
the time-baseis free-runningin the absence
of triggersignals.
TRIGG: the time-baseis triggerednormally.
SINGLE: the time-basesweepsonly once.
SET READY (SK8)
reset push-buttonfor the SINGLE position of the time-basemode
switch.
TIME/cm or DELAY TIME (SK6)
time coefficientcontrolof main time-base,23-wayswitch.
CAL (TIME/cm) (R2ISK7)
continuouslyvariablecontrol of time coefficientof main time-base.In
the CAL. positionthe time coefficientis calibrated.
DelayedTime-baseGenerator
AFTER DELAY TIME (SK15)
three-position
modeswitch:
STARTS:
sweepstartsimmediatelyafter delaytime.
EXT. TRIGG: can be triggeredfrom externalsource(BU2) after delay
time.
INT. TRIGG: can be triggeredfrom internal source after delay time.
LF/HF/DC (SK14)
triggercoupling,three-position
switch:
LF: via a band-passfilter for frequenciesfrom 3 Hz to I MHz.
HF: via a high-passfilter for frequenciesabove2 kHz.
DC: direct coupling for triggering on a slowly varying voltage, or for
full bandwidthworking.
A
+ /- (SK13)
slopecontrol, two-positionswitch:
providesfor triggeringon the positive-goingor the negative-goingslope
of the sigral.
LEVEL (R9/SK12)
continuouslyadjustablecontrol to selectthe level at which the delayed
time-basetriggers.Incorporatesa pull switch for X 5 increaseof external
trigger range.
TIME/cm (SK16)
time coefficientcontrol of delayedtime-base,23-wayswitch.
CAL(TIME/cm) (Rll/SK17)
continuouslyvariablecontrol of time coefficientof delayedtime-base.
ln the CAL. positionthe time coefficientis calibrated.
DELAY TIME
MULTIPLIER (RlO)
ten-turn helipot control of delay time used in conbination with the DELAY TIME controlsof the main time-base.
Horizontal Amplifier Controls
X POSITION (R7lR8)
continuouslyvariable control giving coarseand fine (vernier) horizontal
positioningof the display.
MAGN (SK10)
push-buttoncontrol for X 10 magnificationof horizontaldeflection.
X DEFL (SKl1)
time-baseselector,five-positionswitch:
MAIN TB:
horizontaldefiectionis achievedbv main tirne-base.
MAIN TB
INTENS.:
horizontal deflectionis achievedby the main time-base,
the part of the trace coinciding with the delayedsweep
being intensified. The intensity ratio is adjustable(see
MiscellaneousControls).
ALTERN.:
horizontal deflection is achievedby the main time-base
intensifiedand the delayedtime-basealternately.Vertical
trace separationand intensity ratio are adjustable(see
MiscellaneousControls).
DEL'D TB: horizontal deflection is achievedby delayed time-base.
via X INPUT: horizontal deflection is achievedby an external source
via X INPUT socket (BU3). Deflection coefficient is
.
adjustable (see MiscellaneousControls).
MiscellaneousConfrols
TRACE SEPARATION (R12)
continuouslyvariablecontrol providing verticaltrace separation.
INTENS. RATIO (R13)
continuously variable control for adjusting the intensity ratio in the
MAIN TB INTENS. and ALTERN. positionsof the X DEFL. switch.
mV/cm (X INPUT) (R14/SK18)
continuously variable control for X deflection,from external source
(BU 3) with integral X 10 pull switch attenuator.
CAL. (SK2O)
six-position switch for selecting calibrated 2 kHz square-wavesof
variousamplitudesfor calibrationpurposes,which are availableat BU4.
POWER ON (SK19)
toggleswitchfor the mains supplyto the oscilloscope.
CathodeRay Tube Controls
BEAMFINDER (SK9)
push-buttonto enable a trace to be readily located on the screenby
reducingthe deflectioncoefficients.
INTENS. (R3)
variablecontrol of tracebrightness.
FOCUS (R4)
variablecontrol of electronbeamfocusing.
ASTIGM. (R5)
variablecontrol of trace astigmatism.
ILLUM. (R6)
variablecontrol of graticuleillumination.
v
25
B. OPERA.TION & APPLICATIONS
Peak-to-Peak Voltage Measurements
An oscilloscopedesignedfor a wide range of applications is, inevitably, a complex instrument. As modern
instruments offer more and more facilities, so the
task of operating them increasesin complexity. The
PM 3370, although of logical design and built for
ease of operation, may present some problems to the
occasional operator confronted with such a large
number of controls. However, an understanding of
the techniques for making basic measurementstogether with a recognition of the less obvious triggering
problems and their solution, should help to dispel any
apprehensionon the part of the user.
To measurethe peak-to-peakvoltage value of the a.c.
component of a waveform, connect the signal to one
of the Y input sockets and adjust the Y plug-in unit
controls in accordancewith the operating instructions
to display as large a trace as possible.Then proceed
as follows:
Freliminary Adiustment of Y Amplifier
Observethe preliminary setting-upinstructionsfor the
particular Y plug-in unit fitted. Assuming that a
PM 3372 Dual-Trace Y Amplifier is fitted, the preset
GAIN controls can be adjusted as follows. As the
circuits are identical, only the procedure for channel
A has been described.
With the oscilloscope correctly installed as outlined in the previous chapter, connect the CAL
socket to the A input socket by means of a coaxial
link.
Select channel A on the display switch and DC on
the AC/DC push-button.
Set the mY / cm switch to 50 and ensure that the
potentiometeris in the CAL position.
Set the calibration output switch (CAL) to the
200 mV position and check that the vertical deflection is exactly 4 cm (2 cm when the second A
input is terminated in 50 A).
Adjust the preset GAIN control to achieve this, if
necessary.
This procedure should be repeated for the B channel
(and the C and D channels when a four-trace unit is
fitted).
VOLTAGE
MEASUREMENTS
Display the waveform as large as possible when
making voltage measurements in order to obtain
maximum accuracy. For all voltage measurements,
the Y / cm potentiometer on the Y plug-in unit must
be in the CAL position, otherwise the deflection coefficients are not calibrated.
When using a X l0 probe, observe that the displayed
amplitude must be multiplied by a factor of 10.
Ensure that the probe is adjusted for good step response, and, in the interests of accuracy, that the Y
GAIN preset is re-adjustedbefore use.
1. set the TIME / cm switch to display a few cycles
of the waveform as illustrated; (fig. I 3)
2. adjust the Y POSITION control so that the lower
peaks of the waveform coincide with the nearest
horizontal graticuleline;
3. adjust the X POSITION control so that one of
the upper peaks coincideswith the centre vertical
graticuleline;
4. measure the vertical distance between the peaks
of the signal;
5. multiply this measured distance by the voltage
setting of the Y amplitude switch and by the attenuation factor of the probe, if any.
a
I
I
Fig. 13. Measuring Peak-to - Peak Voltages
E xampl e 1.
Assume that the Y amplitude switch is set to 2 mV/cm
and a l0 : I attenuatorprobe is used. The measured
vertical distanceis 4.6 cm.
Using the formula:
voltso.o- fYt:ttt1] t
\oirtunr")x
. - 4.6 x
2
92 mY
1Y ampl'1
\ setting)x
l0
x
/o.t"ot)
\atten./
If the waveform is a pure sine wave the r.m.s. voltage
. Vo-o
itft:32.5
mV
26
Instantaneous Voltage Measurements
NOTE:
To measure the instantaneous value of a waveforffi,
coÍrnect the signal to one of the Y input sockets and
adjust the Y plug-in unit controls in accordance with
the operating instructions, to display as large a trace
as possible. Then proceed as follows:
1. set the Y input to zeÍo (CHEK ZERO pushbutton) and adjust Y POSITION control so that
the zeÍo reference line coincides with the nearest
horizontal graticule line;
NOTE:
The Y POSITION control must not be
moved alter this reference line has been
established;
2. releasethe CHECK ZERO push-button and select
DC;
3. rotate the X POSITION control so that the point
to be measuredlies on the vertical centre-line;
4. measure the vertical distance between this point
and the zero reference line; if the point lies above
the reference line, the voltage is positive, if it lies
below the line, the voltage is negative;
5. multiply themeasured distanceby the Y amplification setting and the attenuation factor of the
probe, if any.
a
I
I
Example 2
Assume that the Y amplitude switch is set to 0.5 V/cm
and that a 10 : I attenuator probe is used. The
measured vertical distance is 3.2 cm. (Fig. 14)
Using the formula:
: (il;#;,)'
('#il l.t,ïï;ï""/
lYertícal\ lY ampl.\ /
TIME AND FREQUENCY MEASUREMENTS
For all time and frequencymeasurements,the TIME/
cm potentiometermust be in the CAL position, otherwise the deflection coefficientsare not calibrated.
To reduce reading error, time and frequency measurements can be made by using the delayed sweep timebase.
Time Measurements
To measure the time interval between two points of a
wavefoÍffi, connect the signal to one of the Y input
sockets and adjust the Y plug-in unit controls in
accordancewith the operating instructions, to display
as large a trace as possible.Then proceed as follows:
1. set the TIME / cm switch so that the horizontal
distance between the time rneasuring points is as
large as possible;
2. rotate the X POSITION control so that one of
the measuring points coincides with its nearest
vertical graticuleline;
3. rotate the Y POSITION control to bring the other
point to the horizontal centre-line;
4. measure the horizontal distance between the two
time measurementpoints;
5. multiply the measureddistanceby the TIME/cm
setting. (If magnification is used, divide this
product by 10.)
Example 3.
Assume that the TIME / cm setting is 0. 1 ms and the
magnifier is on. The measured distance is 7 .5 cm.
Applying the formula:
F'ig. I4. M easuringInstantaneous V oltages
Instantaneous
Voltage
To meosure a voltage level with respect to
another voltage rother than with earth, apply
the relerence voltage to the ínput socket and
the Y POSITION control so that the trace
coincides with a horizontal graíicule line,
which can now be used as the reference linc.
T his replaces the zero ref erence procedure
descríbedín step I .
Pto:.t,^-\
:3.2
X10
X0.5
- 16 Volts, of positivepolarity.
Time
interval
horizontal distance X TIME/cm setting
magnification
'7.5x 0.1ms
10
0.075 ms - 75 ps
Hence, the frequeocy, which is the reciprocal of the
time duration of one cycle, can be easily calculated,
viz.
1
frequency : '/.,3lrJlz
:
75 x 106
27
h o r izo n ta l d ista n ce
t
-7,5cm
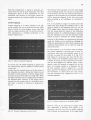
FiS. 15. Measuring Time Intervals
Rise-time Measurements
Rise-tirne is defined as the time required by the
leading edge of a signal to rise from l0' Vo to 90 Vo
of the amplitude, as shown in Fig. 16.
To measure the rise-time of a signal, connect the
signal to one of the Y input sockets and adjust the Y
plug-in controls in accordance with the operating
instructions to display as large a trace as possible.
Then proceed as follows:
1. set the TIME / cm switch of the main time-base to
display the total voltage step on the screen;
2. adjust the Y amplitude so that the vertical deflection is exactly six centimetres.
The l0 % and 90 % points now coincide with
the dotted lines of the graticule.
3. adjust the X POSITION control so that the l0 Vo
coincides with the nearest vertical graticule line;
this line is now the time reference line, and no
further adjustment of the X POSITION control
should be made;
4. measure the horizontal distance between the time
reference line (coincident with the l0 Vo point)
and the point of intersection of the signal and the
horizontal 90 Voline.
5. The rise-time is given by the product of the horizontal distance in centimetres and the TIME / cm
setting. If magnification is used, this product must
be divided by 10.
Example 4. (see fig. 17)
Assume that the TlME/setting is 200 ns and no
magnification is used. Assume a total oscilloscope
rise-time of 0.35ps is obtained with the PM 3372 set
accordingly.
measured rise-time
TIME / cm setting X Horizontal distance
Magnification
200 ns X 2.7
- 540ns
1
Fí5. 16. DeÍinition of Rise-Time
When the oscilloscoperise-time is comparable witir
the signal under test, the actual rise-time should be
calculated as follows:
Actual t. -
1/ (measured t,)'
Substitutingin the formula:
actualrise-time
/
y' m:O.4lps
(oscilloscope t,)'
The length of the resultant
arrow gives the displayed
rise-time. The same time-scale
must be used Íor all three
vectors.
o
a.
o
U
14
e
1.,
UI
o
o
I
3
2.t,
2
1
MA 5680
12315578
tr of signol +
Oscilloscope Ríse-Time
Fig. 17. Measuring Rise-Time
versus Sígnal Rise-Time.
28
Accuate Time M-asurementsusing
theDelayd Time-base
The delayedsweepis invaluablefor making accurate
time measurements.
The advantagesof usingthe delayedtime-basemethod
can best be understoodif we considerthe factorsthat
contribute towards measurementerrors when using
an oscilloscope.
Theseare:
a. the inaccuracyof the time-base,
b. the readingerror.
The inaccuracyof the time-baseis generallyspecified
for the middle 8 divisions of the deflection (due to
slight nonJinearities at the extremesof the scan) a
tolerance of approximately 3 Vo being common for
professionalequipment.This is often regardedas the
measuringerror of the oscilloscope,the readingerror
generallybeing neglected.However, this latter error
can have considerableinfluence on the accuracy of
the measurement.The factors that influence the
readingerror are:
- line thickness,
- the angle between the signal and the horizontal
graticule line at the point where the reading is
made,
- parallax.
The following methods illustrate the various uses clf
the delayed time-base. Note that the DELAY TIME
MULTIPLIER potentiometer introduces a slight inaccuracy due to its non-linearity which is 0.1 Vo
maximum.
COMPARISON OF METHODS
The attendant advantages of measuring tirne differences by means of the delayed time-base can be
shown by considering a specific example and applying
the various methods of measurement at our disposal.
Example 5.
Assume a signal as illustrated in Fig. I 8, where it is
required to measure the time difference between the
points tr, tz,tr, t+.
Line thickness is dependent on the focussing and
astignatismof the c.r.t. spot and upon its intensity.
For optimum line thickness,the intensity should not
be too high.
The angle between the sigral and the horizontal
graticule line at the point of reading should be as
large as possible to obtain a clearly defined crossover point. It is thereforeadvisableto work with the
biggestpossibledisplay and, if possible,to take the
readingat the steepestpart of the trace.
Fig. 18. Time Measurements
With the PM 3370, the readingerror due to parallax
is eliminatedas the c.r.t. hasan internal graticule.
The value of the reading error which results from
taking measurementsmay be as much as 0.05 of a
centimetre for each measuring point. As all time
measurementsare in fact the result of two measurements, the total reading eÍïor can be 0.1 of a centimetre. This is an additional factor contributing towards the total inaccuracy, and for measurements
over small distancesit adds a considerableerror to
the reading. For example, over two centimetres
Assume that the TIME/cm setting of the main timebase is 10 ps/cm and that the horizontal distance t1
and ta,is 8.2 cm. The measured time difference between them is therefore 8.2 X 10 ps - 82 ps. The
measured distance t2 t3 is 0.2 cm which represents
2 ps. The measured distance t3 - ta is 1.4 cm which
represents 14 pS. Therefore, the reading errors for
the respectivetimes are:
Method A.
Measuring the tirne difference by means of. the main
time-base.
0.05
tr-tc_2
X
X l O} V o:
+ l .zV o
x l00vo:
+ Sovo
X I0O%_
t7%
8.2
0.1
-XlO0Vo:SVo.
2
tz-h:2
By using the delayedsweepmethod.of measurement
it is possible to considerably reduce the influence of
the reading error.
tr-te :2
0.05
x
0.2
0.05
X
r.4
29
As the error of the time-basemay be as mucir as 3 Vo,
this must be taken into account when calculating the
total error.
Note: The figure Íor the time-base error con be
checked by displaying on accurotely known
f requency.
It will be observed that the accuracy is rapidly degraded as the distanceon the time axis decreases.For
distancesless than I cffi, the X l0 MAGN. can be
used. In the example for tz-tt,the distanceis expanded
to L7 cm, which gives1.7 ps.
0.05
The reading error is 2 X
X 100 Vo -
6 Vo
1 .7
Therefore the max. total error could be
3% + zVo + 6Vo:
ll %
The 2 Vo error factor is due to the use of the X 10
magnifier.
By using this method, the accuracy is improved by a
factor of 5.
Method B.
Measuring the time difference by means of the
delayedtime-base.
V/ith the X DEFL switch set to MAIN TB INTENS,
the DELAY TIME MULTIPLIER
potentiometer
may be adjusted in conjunction with the TIME / cm
switch of the delayed time-base to give an intensified
display of that portion of the trace which embraces
tz- tE.'
By switching the X DEFL switch to DEL'D TB an
expanded image, as shown in Fig. 19, is obtaineci.
The read-off error exp;essedas a percentageis now:
0.05
X 100Vo :
2 x 8.2
l.2Vo
The total measuringerror is thus 3 + 1.2 : 4.2 Vo.
When t3-t4is measured by the same method, the
largestdistanceon the time axis will be a setting of
2 ps/cm for the delay time-base.The distanceis 6.8
cm, therefore,the time is 13.6 ps, and this reading
error is 1.5 Vo giving a total error of |.5 Vo * 3 Vo
: 4.5 Vo.
Method C.
Measuringthe time differenceby meansof the delayed
time-baseand the DELAY TIME MULTIPLIER.
Obtain an expandeddisplayas in the previousmethod,
then rotate the TIME/cm switch of the delayedtimebaseto 100 ns/cm so that the trace is expandedby a
factor 100. Locate tz on the screenand align it with
the vertical centre-line of the graticule by means of
the DELAY TIME MULTIPLIER dial. Note the
dial reading.
Then rotate the dial until t3 coicideswith the vertical
centre-lineand notethe new dial reading.
If thesereadingsare,for example,7.08 and 6.92,then
the dial distance betweenthe two measuringpoints
has beenexpandedto 1.6 cm and the time difference
is 16 x 100ns : 1.6ps.
The total measuringerror using this method,is the
sum of the.maximum main time-baseerror and the
error due to the nonJinearity of the DELAY TIME
MULTIPLIER potentiometer(0.2 7o) togetherwith
the read-offerror.
The read-off error is now the sum of the error caused
by shiftingboth measuringpointsto the verticalcentre0.05
x IO0 Vo : 6.3 Vo.
line;i.e.,a maximumof 2 x 1.6
Thus the maximum total error : 3 Vo * O.2 Vo *
0.63 Vo + 6.3 Vo
lO Vo.
Measuring tr-to in -,the same manner will give dial
readingsof 7.08 and 8.445 so the differenceis 1.365.
Thus the distancebetweenthe two measuringpoints
has now been expandedto 136.5 crn, the time differencebeing136.5 x 100 ns : 13.65ps.
Fig. 19. Ttme MeasurementsusíngDelayeclTimeBase
Assume that the TIME / cm setting of the delayed
time-base is 0.2 ps/cm. The measured distance between t2 and t3 is now 8.2 cm and t2 - t3 is 1.64 ps.
The readingerror on the displayis
0.1
x IOOVo : O.O7Vo
1.365
0.01
X 100 Vo : O.'l Vo
the dial read-offerror is
1.365
therefore,the total error : 3 % + O.2 Vo * O.O7Vo
+ 0.7Vo:4Vo.
30
Measuring t1
ta with method C will give a dial
reading differenceof 8 .21. The tirne is therefore 82.1
ps and the expandeddistanceis 821 crn. The reading
0.I
x 100 Vo - 0 .0 12 %
error of the display is
821
0 . 01
which can be neglected.'Thedial reading eÍïor is 8 . 21
X 100 % - 0.12 Vo which makes the total error
3 % + 0.2 % + 0.12 V o :' 3.3 V o.
Conclusions
M ETHO D A
METHOD B
I nterval
X
tt - t+
tz-tl
tl-t+
1 M AGN.
8 2 p s+ 4 .3 %
2ps+53 %
l 4 p s+ l 0 %
X
METHOD C
1MA GN .
l . 7ps+ tl %
It will be seen from the table of results that Method B
is best when very small distances on the main timebase axis are to be measured. However, when these
distances are greater than about I cffi, the read-off
error of the DELAY TIME MULTIPLIER becomcs
negligible and Method C is to be preferred.
TIME RATIO MEASUREMENTS
The delay time multiplier offers the facility for the
accurate determination of time ratios. Any significant
errors incurred are due only to the incremental nonlinearity of the ten-turn potentiometer, and to the
reading error which can be kept small by using the
delayed time-base.
This is illustrated by reference to the following example. (fig. 20)
l .6ps+ 4.2%
l 3.6ps+ 4.s%
82ps+ 3.3yo
l.6ps:E l0 %
l3.65ps+ 4 %
The purpose of the measurementis to find the mark/
space ratio of the signal. For suitable expansion of
the leading and trailing edges, the delayed time-base
TIME / cm switch rwasset to 1 ps/cm.
The negative-going leading edge was dialled to the
centre vertical graticule line, as illustrated, and the
dial setting of the DELAY TIME MLILTIPLIER
noted; this was 1.770. Then the next positive-going
edge was dialled to the vertical centre-line, the setting
being 6.265. Similarly, the final negative-going edge
was dialled and a reading of 8.21 obtained.
Thus the negative-going portion of the trace gave a
measuredreading of:
6.265-1.77:
4" 495.
The positive-going portion of the trace gave a measured reading of:
8.21 -6.265:1.945.
Therefore, the mark/space ratio is:
1.945
: 0.433.
4.495
The. accuracy of the positive-going portion is determined by the reading eÍror and the incremental nonlinearity of the dial potentiometer.
As the main time-base is expanded by a factor of.20,
the pulse length is 20 X 1.945 - 38.9 cm.
Therefore,
reading error :
FiS. 20. Time Ratio Measurements
2 X 0.05 X L00 Vo
:
38.9
2x 0.005 X 100 Vo
clial reading erro r The upper trace shows the pulse displayed by the
main time-base at the 20 ps/cm setting. The lower
trace represents the intensified portion of the upper
trace as displayed in the ALTERN. position of the
X DEFL. switch.
0.26 Vo
:
0.5 Vo
L.945
potentiometernon-linearity: 0.2 Vo.
Total accuracy for the positive-going portion is therefore:
0.26 Vo + 0.5 Vo + 0,2 Vo : 0.96 Vo.
31
For the negative-goingportion:
2 x 0.05 x 100Vo
reading error -
g9.9
0 . 1 r%
2 xo'oo5xloo%-0.23 %
dial reading
error4.495
potentiometer non-linearity - 0.2 Vo.
Total accuracy for the negative-goingportion is therefore:
0. 11 V o + 0. 2 3 % + 0 .2 % -0 .5 4 7 o .
The total ratio error is therefore:
0 . 96 % + 0. 5 4 % _ 1 .4 % .
The resultant measurementgives a ratio of 0.433 +
1.4 Vo; i.e. within 0.427 and 0.439.
Set the X DEFL. switch to ALTERN. and adjust
the delayedtime-basecontrols for a suitabledisplay
of the leading edge of the square wave (Fig. zlb).
Adjust the Y deflection and POSITION controls
of the plug-in unit and the TRACE SEPARATION
control of the main instrument to remove the extreme tracesof Fig. 2lb for clarity.
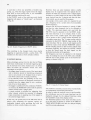
By employing a multi-exposure photographic techruique,the relationshipbetweeninput voltage and output rise-timccan be effectivelydisplayedas illustrated
i n Fi g. 2i c.
Display Switching
The PM 3370 is equipped with display switching, a
new feature for the Philips range of oscilloscope.This
rlow offers the instrument user a simultaneousdisplay
of the signal on the two time scalesprovided by the
main time-base and by the delayed time-base.
Detailed examination of a certain portion of the main
time-base display is enabled by expanding the time
interval of interest by means of the delayed time-base.
Expansion is achieved by selecting a correspondingly
faster sweep for the delayed time-base TIME / cm
control, and positioning the time interval by the
DELAY TIME MULTIPLIER poten,tiometer.
The part of the signal under detailed observation by
the delayed time-base appears as an intensified portion of the main time-base display. This not only
facilitates the location of the required detail during
dialling but also servesas a visual indication of which
portion of the overall trace is being examined. (See
Fig. 20.) Thus the operator can immediately correlate
the detail with the overall signal, which may be extremely complex, without the necessity of switching
between MAIN T.B. and DEL'D T.B. as required
with most other instruments.
This feature is extremely useful when the aspectsof
the detail being observed are changes caused by the
variation of some other signal displayedsimultaneously by the main time-base.
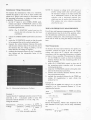
An example of this is shown in Fig. 2l where a sine
wave of variable amplitude is fed into an overdriven
amplifier which fr,rnctionsas a squarer. The amplitude
of the square wave output, unlike the rise-time, is
independent of the input voltage. To examine the
relationship between rise-time and input voltage, the
following procedure may be employed.
Using a multi-trace plug-in in the ALTERN. mode
display the output voltage as the upper trace and
the input voltage as the lower trace, as shown in
Fig. 2la.
u.
Output signul (upper truc'e) of u .\quurer, dríven
sinusoïdal input (lower trac'e).
by {t
h. ShowirtS1 the leuding edge (sec'ond trac'e) of the squure
w ul 'e.
c.
Multi-exposure photogruph showirtg the rise-time varying
with input amplitude.
Fig. 21. EfÍective Use of Display Switching
32
PHASE MEASUREMENTS
To measure the phase difference between two sinusoidal signals of the same frequetrcy, use the following
method.
Connect one signal to one of the Y input socketsand
the other signal to the other Y input socket of the
PM 3372, using probes or coaxial cables with equal
time delays. Display the traces using the AUTO
mode of the main time-base with the Y select switch
at CHOPP. (suitable for low frequencies) or ALT
ERN. (suitable for high frequencies). If the signals
are of opposite polarity then pull one of the Y POSITION controls to invert the lagging signal. Note that
the total phase difference must be subtracted from
180o in this event. With a stabledisplayof maximum
amplitude. adjust the Y POSITION controls for symmetry about the horizontal centre-line.
Having set up the display, proceed as follows:
1. set the TIME / cm switch and potentiometer so
that one cycle of the first signal occupies exactly
9 cm horizontally; i.e., each cm represents360"-/9
- 40o;
2. measure the horizontal distance between the two
corresponding points on the waveforms, and
multiply_this by 40o to obtain the phase differencé. If one of Y POSITION controls is inverted, subtractthe result from 180o.
NOTE: For small phase dillerences (less than 40" )
use the X I0 MAGN. push-button and divide
the result by I0. The phase scale rs now
4"/cffi, therefore, the measured distance in
centimetres should be multiplied by four to
obtain the desired phase diÍference measurement.
LEVEL
PULL FOR x 5
RANGE
EXT. TRIGG.
Small phase differences can also be measured by
rneansof the delayedtime-base.
The total period, time T, is Íreasured by using the
main time-base. Then the time difference dT is
measured using one of the methods previously described, depending on the distance between the two
measuringpoints.
The ratio between this tin e duration dT and T, multiplied by 360 degreesgives the phase difference between the two signals.
PHOTOGRAPHING
SCREEN TRACES
Photographicrecordsof the screentracescan be made
for periodic or single-shot events. Details are given
in the rnanual of camera assemblyPM 9380.
TRIGGERING
The precise functions of the trigger controls that are
found on a niodern oscilloscope may not be wellknown to the occasional user. However, a brief excursion into the basic principles of triggering will
facilitate correct adjustmentof the controls.
Put simply, triggering circuits have two main functions:
I . to initiate a pulse at a predeterminedpoint of the
signalunder observation,
2. to start the sweepby meansof this pulse.
Figure 22 shows the PM 3370 main time-base trigger controls together with a brief explanation of their
various functions.
Initially, the four trigger controls may be set to the
following positions;i.e., all in UP position:
LEVEL
mid-range
SLOPE
COUPLING
SOURCE
E-
+
LF
INT.
INT.
E X T.
MA IN S
1Mn
15pF
l,lA 569t
LEVEL CONTROL
determines the d.c.
level at which the oscilloscope will trigger. A
signal passing through
the desired level will
only trigger the oscilloscope if its direction
is that selected by the
SLOPE control.
SLOPE CONTROL
determines whether
the oscilloscope will be
triggered on a positivegoing slope, or on a
negative-going slope of
the signal.
Fig. 22. Matn Time-Base Trigger Controls
COUPLING
CONTROL
- determinesthe method
of coupling the signal
into the trigger circuit.
LF
coupling blocks
undesired d.c. levels
and h.f. interference
but responds to l.f.
triggering. HF coupling
blocks d.c. and l.f. (e.g.,
hum) but responds to
h.f. triggering signals.
DC coupling makes the
full signal bandwidth
available for triggering.
SOURCE CONTROL
determines the origin
of the trigger source.
INT.
from the internal plug-in unit. (for
multitrace units select
the appropriate channel
on the plug-in unit).
EXT.
from an external trigger source, via
the TRIGG.
input.
MAINS
from the
mains transformer.
TRIGGER INPUT
- provides a high-impedance coaxial input
(l MQ / / 15 pF) when
triggering from an external source.
33
With this configuration, ar display is generall.yproduced which can then be easily adjusted to meet other
requirements. Some of these applications are now
considered with reference to the trigger control adjustments required for optimum display and measuremgnt.
Double Triggering
Double triggering is an effect, inherent in all triggering systems,that can be produced when the signal
point at which the circuit triggers occurs more than
once in a single repetition time T as shown in Fig. 23.
This phenomenon is exhibited particularly in the
display of pulse trains.
Now because both time-base are of the same length
the next flyback period will end after a second pulse
in the waveform and the new sawtooth will again be
triggered on the first-pulse. So the sawtooth waveform
will be alternately triggered by the first and second
pulses resulting in an oscillogram as illustrated in
Fig. 24.
If it is not possible to trigger on another pulse that
occurs only once during the repetition time T, and
which is related to the displayed pulse (e.g. via the
EXT. trigger input), then the obvious remedy is to
vary the sweep speed by means of the continuous
time-base control. If a calibrated display is required,
then the alternative is to vary the time-base switch
control in steps to eliminate the double triggering.
However, if this produces an unsatisfactorytime-base
speed, the display can be rectified by switching the
TIME / cm potentiometer to the UNCAL position and
calibrated measurementscan be made by using the
clelayedtime-base.
Fig. 23. EfÍect of Double Triggering
As can be seen, the double triggering is apparent by
the "closed loops" that are present at various points
on the trace.
Assume that the sawtooth starts on the first pulse of
the composite waveform. During the flyback period
the input is made insensitive to further trigger pulses
by means of the hold-off pulse (see Chap. IID. When
this pulse terminates,the next trigger pulse will initiate
the sawtooth again. However, if this trigger puls is
derived from the second pulse of a rnulti-pulse waveform then a situation is obtained as illustrated in
Fíg.23.
In some instances,it is not obvious from the display
that double triggering is occurring and, in these circur-stances,time errors will inevitably result. lf, for
example, we apply the same signal as in Fig. 23 to
both inputs of a dual-trace unit, then with the electronic switch in the ALTERN. position there will be
a display as in Fig. 25. This is becausethe two channels are each triggered by different pulses. Consequently, when the sawtooth is triggered by the first
pulse, for example, channel A is displayed and for
the next sawtooth which is triggered by a second
pulse, channel B is displayed.Sincewe know that the
two waveforms are derived from the same source,
then the displayed time displacement error is inrrnediatelyapparent.
Fig. 25. Doubla Tríggeringín ALTERN. Mode
Fig. 24. Double Triggering on Pulse Trains
However, when we are observingtwo signals whose
time relaticlnshipis unknown (and requires to be
measured), this time error due to double triggering
may invaliclate the measurement.If the trigger signal
34
is such that it offers any possibility of double triggering, e.8, when the trigger signal crossesthe trigger
level twice or more during time T, the ALTERN.
ciisplayposition should not be used.
In the CHOPP. mode of the multi-trace unit, double
triggering will appear as "closed loops", ês illustrated
inFrg.26.
Fig. 26. Double Triggering in CHOPP. Mode
Thus switching to the chopped mode when double
triggering is suspectedprovides a useful check. The
remedies are the same as those already outlined.
Y OUTPUT SIGNAL
Many advantagesaccrue from the fact that in Philips
multi-trace oscilloscopesthe internal triggering signal
can be derived from either channel and it is always
taken off before the electronic switch. The main
advantagesare as follows:
the trigger signal is merely a part of the input signal
and is therefore devoid of interfering components
such as are present in the chopped mode of operation which could result in display instability;
in the alternate mode, the possibility of time relationship errors betweenthe displayed waveforms is
avoided since the trigger signal is not a combination of two or more signals;
the trigger is unaffectedby the continuous VOLTS/
cm control, the POSITION control and the polarity
selectorswitch of the Y plug-in unit;
a simple rnethod is provided for triggering from
either channel without the necessity of changing
input connectionsor applying one of the signals to
the externaltrigger input.
In this wêy, the systemused on the PM 3370 and its
plug-in units safeguards the operator against unmeaningful displays whilst providing him with the
facilitiesto obtain a stableCisplayvery easily.
However, there are some instances where a stable
display may be required from two signals the frequencies of which are unrelated. The Y output signal,
available at a socket outlet on the rear of the instrument, derived frorn the Y plug-in unit after the electronic switch, ffiêy be used for this purpose.
An example of this occurs when it is required to adjust a frequency to be a certain ratio of an accurately
known frequency.
Assume that the known frequency is exactly 2 MHz
and that the other frequency has to be adjusted to
5 MHz. The dual-trace plug-in unit used with the
PM 3370 must be operated in the ALTERN. mode.
The main time-base is set to display about 3 complete cycles of the 2 MHz signal. The input signals
will be present at the Y output socket alternately for
a complete sweep time. The Y output socket must be
connected to the EXT. TRIGG. input socket of the
main time-base. The d.c. level of each signal can be
varied by means of the relevant POSITION control.
Set the coupling selector to DC or HF to obtain main
time-base triggering, and adjust the LEVEL control
so that the sweep starts for both signals on the
horizontal centre-line of the graticule.
The frequency can now be adjusted to the desired
value by making the end of the fifth cycle coincide
with the end of the second cycle of the known frequency, &s shown in Fig. 27 .
Fig. 27. Using the Y Output Signal
This method is extremelyaccuratesincemeasurements
are independentof time-baseinaccuracies.
In order to make the read-off error as small possible,
the coincidence area on the main time-base can be
displayed enlarged by the delayed time-base using
the ALTERN. mode of the display switch.
The intensified portion of the main tinne-basecan be
set to the point of interest by means of the DELAY
TIME MULTIPLIER dial and the delayed disptay
used for accurate adjustment.