1
PSZ 19:16 (Pind. 1/07)
UNIVERSITI TEKNOLOGI MALAYSIA
DECLARATION
Author’s
full name : OF THESIS / UNDERGRADUATE PROJECT PAPER AND COPYRIGHT
Date of birth
:
WAN FAIRUZ JAMILAH BT W MOHD RIDZWAN
Author’s full name
Title
: :
Date of birth
: 13 JUNE 1988
Title
:
BLUETOOTH WIRELESS HEART RATE TELEMONITORING
Academic Session:
I declare that this thesis is classified as :
Academic Session:
2010 / 2011
I declare that this thesis is classified as :
CONFIDENTIAL
(Contains confidential information under the
Official Secret Act 1972)*
RESTRICTED
(Contains restricted information as specified by
the organization where research was done)*
I acknowledged that Universiti Teknologi Malaysia reserves the right as follows :
√
OPEN ACCESS
I agree that my thesis to be published as online open
access
(full text)Malaysia.
1. The thesis is the property of Universiti
Teknologi
2. The Library of Universiti Teknologi Malaysia has the right to make copies for the
I acknowledged
that
Universiti
Teknologi Malaysia reserves the right as follows :
purpose of
research
only.
3. The Library has the right to make copies of the thesis for academic exchange.
1. The thesis is the property of Universiti Teknologi Malaysia.
2. The Library of Universiti Teknologi Malaysia has the right to make copies for the
purpose of research only.
Certified by :
3. The Library has the right to make copies of the thesis for academic exchange.
SUPERVISOR
SIGNATURE
SIGNATURE
SIGNATURE OF
880613-11-5096
(NEW IC NO. /PASSPORT NO.)
(NEW IC NO. /PASSPORT NO.)
DR. RUBITA BT SUDIRMAN
NAME OF SUPERVISOR
NAME OF SUPERVISOR
Date :
Date :
9 MAY 2011
9 MAY 2011
“I hereby declare that I have read this project report and in my
opinion this project report is sufficient in terms of scope and quality for the
award of the degree of Bachelor of Engineering (Electrical - Medical Electronics)”
Signature
:
Name of Supervisor
: DR. RUBITA BT SUDIRMAN
Date
: 9 MAY 2011
BLUETOOTH WIRELESS HEART RATE TELEMONITORING
WAN FAIRUZ JAMILAH BT W MOHD RIDZWAN
A project report submitted in partial fulfilment of the requirement for the award
of the Degree of Bachelor of Engineering (Electrical - Medical Electronics)
Faculty of Electrical Engineering
Universiti Teknologi Malaysia
MAY 2011
ii
I declare that this project report entitled “Bluetooth Wireless Heart Rate
Telemonitoring” is the result of my own research except as cited in the references.
The project report has not been accepted for any degree and is not concurrently
submitted in candidature of any other degree.
Signature
:
Name
: WAN FAIRUZ JAMILAH BT W MOHD RIDZWAN
Date
: 9 MAY 2011
iii
ACKNOWLEDGEMENT
In the name of Allah most gracious most merciful. First of all I would like to
convey my thousand of thanks to Dr. Rubita bt Sudirman as my final year project
supervisor for always guiding, supporting and giving very helpful comments to me on
the project.
I also would like to dedicate my appreciation especially to my brother Wan
Mohd FatihilKamal for his helpful suggestions and knowledge on the project. Special
dedication also to Dr. Fauzan Khairi and my friend, Aimie Amalina who have taught
me a lot in using the softwares in the project. Also not to be forgotten special thanks
to all of Electrical Engineering Faculty lecturers and lab technicians those have been
helping me in this project directly or indirectly.
Not to be forgotten, dedication to my family who always stand by my side no
matter how life turns out to be. Thanks for all the support and love I had been
receiving since I was born.
Last but not least, thousands of appreciation to my friends who had been with
me during the years in UTM. Together we experience all the joy and hardship without
any single thought of giving up. Also thanks to any of my colleagues and anybody
who ever provide me with any kind of assistance. Thank You.
iv
ABSTRACT
In the era where technology kept changing our course of life, improvement in medical
field have become most needed and developed as people concern about their health
above all.
There are various researches done all over the world to monitor health
condition in the easiest way.
As cable becoming a burden to the user for limited
mobility, researchers kept finding methods to replace the usage of cables in
connecting the electronic devices.
This project is also one of the research done in
order to make health monitoring is easier without using cables.
This project has
proposed a method of wireless health monitoring using Bluetooth technology. There
are four parts in this project that is sensor development, amplifier development, data
processing and wireless transmission via Bluetooth. Sensor and amplifier was
developed to obtain amplified heart rate signal. However due to inconsistency of
output from both sensor and amplifier, the heart rate was obtained using ECG
simulator and amplified using biomedical amplifier. Then, input was processed and
wirelessly transmitted to laptop using microcontroller and Bluetooth module. The
output signal was displayed on laptop screen.
v
ABSTRAK
Dalam era dimana teknologi semakin mengubah gaya kehidupan kita, kemajuan dalam
bidang perubatan adalah yang paling diperlukan kerana manusia mementingkan
kesihatan mereka lebih dari yang lain. Pelbagai kajian telah dilaksanakan di seluruh
dunia untuk meninjau tahap kesihatan dengan cara yang paling mudah. Penggunaan
kabel semakin membebankan pengguna kerana menyebabkan pergerakan semakin
terhad.
Oleh itu para pengkaji sering mencari kaedah untuk menggantikan
penggunaan kabel dalan menghubungkan peralatan elektronik. Projek ini juga adalah
salah satu daripada kajian yang telah dilaksanakan untuk memudahkan peninjauan
tahap kesihatan diri tanpa menggunakan kabel.
Projek ini telah mencadangkan
kaedah peninjauan tahap kesihatan melalui penggunaan teknologi Bluetooth. Projek
ini terdiri daripada empat bahagian iaitu sensor, penguat, pemprosesan data dan juga
penghantaran data melalui Bluetooth. Sensor dan penguat telah di hasilkan untuk
mendapatkan kadar denyutan jantung yang diperbesarkan. Namun begitu, disebabkan
oleh sensor dan penguat yang dihasilkan tidak stabil, kadar denyutan jantung telah
diambil dari ECG Simulator dan signal diperbesarkan menggunalan penguat
bioperubatan. Kemudian, input tersebut diproses dan dihantar ke laptop tanpa
menggunakan
wayar
dengan
menggunakan
microcontroller
dan
Bluetooth.
vi
TABLE OF CONTENTS
CHAPTER
1
2
TITLE
PAGE
DECLARATION
ii
ACKNOWLEDGEMENT
iii
ABSTRACT
ABSTRAK
iv
TABLE OF CONTENTS
vi
LIST OF FIGURES
viii
v
LIST OF ABBREVIATION
ix
LIST OF APPENDICES
x
INTRODUCTION
1
1.1
Research Background
1
1.2
Problem Statement
8
1.3
Project Objective
9
1.4
Scope of Work
9
1.5
Thesis Outline
9
LITERATURE REVIEW
11
2.1
Introduction
11
2.2
Wearable Wireless ECG System
11
2.3
Heartbeat Monitoring Alert via SMS
12
2.4
Mobile Phone Based Sphygmomanometer
13
2.5
Wireless Technology Related Research
15
2.6
Conclusion
16
vii
3
4
5
METHODOLOGY
17
3.1
Introduction
17
3.2
Methodology
17
3.3
Circuit Design
22
3.4
Conclusion
23
RESULT AND ANALYSIS
24
4.1
Introduction
24
4.2
Results and Discussion
24
4.3
Conclusion
28
CONCLUSION
29
5.1
Conclusion
29
5.2
Future Development
30
REFERENCES
31
APPENDIX A-C
33-41
viii
LIST OF FIGURES
FIGURE
TITLE
PAGE
1.1
Human heart
2
1.2
Typical ECG waveform
3
1.3
PPG obtained using pulse oximeter
4
1.4
Instrumentation amplifier
5
1.5
Microcontroller block diagram
7
2.1
ECG system description
12
2.2
Heartbeat monitoring system block diagram
13
2.3
Result of heart rate obtained
13
2.4
Blood measurement device
14
2.5
Display on mobile phone screen
14
3.1
Optical sensor TCRT1000
18
3.2
Instrumentation amplifier INA114
19
3.3
Block diagram of microcontroller and Bluetooth module
20
3.4
Labview receiver block diagram
21
3.5
Simulation of instrumentation amplifier in Multisim
22
3.6
Microcontroller and Bluetooth module circuit
23
4.1
ECG simulator and BMA-400
25
4.2
Output of BMA-400
25
4.3
Wireless connections
26
4.4
Output from Labview 8.6
27
ix
LIST OF ABBREVIATIONS
ALU
–
Arithmetic Logic Unit
ECG
–
Electrocardiogram
I/O
–
Input / Output
IC
–
Integrated Circuit
ISM
–
Industry Scientific and Medical
LED
–
Light Emitting Diode
PCB
–
Printed Circuit Board
PDA
–
Personal Digital Assistant
PPG
–
Photoplethysmograph
QoS
–
Quality of Service
RF
–
Radio Frequency
SIG
–
Special Interest Group
UART
–
Universal Asynchronous Receiver Transmitter
x
LIST OF APPENDICES
APENDIX
TITLE
PAGE
A
COMPONENTS DATASHEET
33
B
PROGRAMMING SOURCE CODE
38
C
LABVIEW RECEIVER CIRCUIT DESIGN
40
CHAPTER 1
INTRODUCTION
1.1
Research Background
1.1.1
Heartbeat
Heart is one of the five vital organs. It can be found in all animals with a circulatory
system including all vertebras. Human heart basically a hollow, cone shaped, 10cm in
length and about the size of subject fist. It lies in the thoracic cage, in the middle of
chest area, just left of the center. Heart is responsible for pumping blood throughout
the blood vessels by repeated rhythmic contractions while rib cage is responsible for
heart protection [1].
Deoxygenated blood enters heart through superior vena cava and the heart will
pump the blood to lungs through pulmonary trunk. Exhalation process in lungs
removes carbon dioxide from blood and inhalation process absorb oxygen into blood.
Oxygenated blood returns from lung enter heart through pulmonary veins and will be
pumped throughout the body through aorta.
2
Figure 1.1 Human heart (Adapted from [1] )
Whether a person is awake or asleep, the heart never fails to pump. Heart
contracts and relaxes in a rhythmic cycle. When it contracts, it pumps blood. When it
relaxes, its chambers filled with blood. One complete sequence of pumping and
filling is called cardiac cycle. The volume of blood per minute that the left ventricle
pumps into the systemic circuit is called cardiac output. Heart rate and stroke volume
will determine cardiac output. Heart rate is the number of heart beat per unit of time
usually in unit of beat per minute (BPM). It is measured from the artery pulse in the
body (chest, wrist fingertips, etc). Heart rate can be measured by using heart rate
monitoring system. Stroke volume is the amount of blood pumped by left ventricle in
each contraction. In human heart, average stroke volume is about 75 mL. At rest, a
person heart beats about 70 beats per minute has cardiac output of 5.25 L/min. This is
equivalent to the total volume of blood in human body. During heavy exercise,
cardiac output will increase [2].
3
1.1.2
Electrocardiogram
When the heart muscle cells contract to make heart pumps the blood, it
generates an action potential which spread currents throughout the body. In various
parts of the body, different electrical potential were produced and this difference can
be recorded using surface electrodes attached to the skin. These waveforms are called
electrocardiogram (ECG) [3].
R
T
P
Q
S
Figure 1.2 Typical ECG waveform
Typically, ECG signal is measured from left arm to right arm and the
waveform measured usually as shown in Figure 1.2 ECG signal consist of P wave,
QRS complex, and a T wave which is normally visible in every ECG signal measured.
P wave occur during normal atrial depolarization when the main electrical vector is
directed from the SA node towards the AV node and spreads from right atrium to left
atrium. It usually occurs within 80 ms. PQ interval is measured from beginning of P
wave to the beginning of QRS complex. This interval shows the time required for
electrical impulse to travel to sinus node through AV node and entering ventricles.
The duration is between 120 to 200 ms. QRS complex shows rapid depolarization of
right and left ventricles. It usually occurs between 80 to 120 ms. Lastly, T wave
represent the repolarization, in other word a recovery phase of ventricles.
4
1.1.3
Photoplethysmograph
Photoplethysmograph (PPG) is a technique based on relative transparency of
human skin for red or near infrared light and on the diffusing effect of red blood cells
which reduces these wavelength retrodiffusions. Therefore PPG technique can be
used to measure any type of blood volume variation at the tested site [4].
When the source of light placed against the skin, the retrodiffused light will be
detected by photoelectric cell located in the same place. There are two types of signal
that can be used; first, the retrodiffused light systolic-diastolic variation and second,
through systolic-diastolic damping, the variation of the retrodiffused light baseline.
The first type of signal deals with sphygmic or arterial PPG while the second type
deals with volume or venous PPG.
The retrodiffused light depends on the variation of quantity of red blood cells
within the skin. The larger the volume of red blood cells, the lower the retrodiffused
light. Figure 1.3 shows an example of normal PPG obtained by using pulse oximeter.
Figure 1.3 PPG obtained using pulse oximeter (Adapted from [5])
1.1.4
Instrumentation Amplifier
Amplifier is an electronic circuit that has the capability to amplify power,
voltage of current. Amplifiers are needed in a situation where the input is very small.
In order to have a better analysis, there is a need to amplify the signal so that the
output will be higher thus making the signal analysis easier. However there are also
5
possibilities that amplifier circuit will amplify not only required signal but also
amplify the noise. Noise can be defined as unwanted signal. Therefore, in order to
make the signal analysis, the noise must be removed. One of the methods to remove
noise and amplify wanted signal is by using bioelectric amplifiers.
Bioelectric
amplifiers are used to process bipotential signals. The bioelectric signal is unique to
biomedical systems. It is generated by nerve cells and muscle cells. Its source is the
membrane potential, which under certain conditions may be excited to generate an
action potential [6].
The gain of bioelectric amplifiers can either be low, medium or high
depending on their application. The gain factor of low gain bioelectric amplifier
usually is in the range of unity (×1) to ×10. The uses of unity gain (×1) amplifiers are
mostly for isolation, buffering and possibly impedance transformation between signal
sources and read out device [3]. For medium gain bioelectric amplifiers, the gain
factors are usually in range of ×10 to ×1000.
They are mostly used for ECG
waveform recordings, muscle potentials and so forth. On the other hand, high gain
bioelectric amplifiers have gain factors of more than ×1000 and usually used for very
sensitive measurements such as brain waveform (EEG) measurements.
Bioelectric signal sources exhibit high source impedance thus the bioelectric
amplifier used must have high input impedance. Therefore, the solution to both high
gain and high input impedance problems is by using instrumentation amplifiers. It is
one of the bioelectric amplifiers which use three operational amplifiers.
Figure 1.4 Instrumentation amplifier (Adapted from [7])
6
Instrumentation amplifier is a differential voltage gain device that amplifies
the difference between the voltages existing at its two input terminals [8].
Instrumentation amplifiers are used in biomedical application for the purpose of
amplifying small voltages such as bioelectric signals that may be riding on large
common-mode voltages. The reasons instrumentation amplifiers are widely used in
biomedical application are because of its ability to obtain high gain with low resistor
values, extremely high input impedance, high common-mode rejection ratio, low
output offset and low output ratio. The voltage gain is usually set with an external
resistor. As shown in Figure 1.4, the first two amplifiers and the resistors are the
buffers.
Two input amplifier are connected in the non-inverting follower
configuration that provide high input impedance and voltage gain. The gain can be
controlled by the values of resistor R1 and Rgain as indicated in equation (1.1).
v
(1.1)
For the second part on the right side of Figure 1.4, shows the third operational
amplifier used as unity differential amplifier with high precision resistors that are
equal in value. Therefore, the value of resistor R2 = R3. The properties of differential
amplifiers are that they can reject equal noise on their inputs while amplifying unequal
signal voltages on their inputs.
1.1.5
Microcontroller PIC16F877A
Microcontroller is a device that can be used as a complete computer on a
single chip. Microcontroller is different than microprocessor because microprocessor
is only a heart of a computer whereas microcontroller can work on its own.
According to Harvard architecture, basic components are input/output (I/O) pin,
program memory, data memory and arithmetic logic unit (ALU) as central control
unit.
On the other hand, according to Von Neumann architecture the basic
7
components of microcontroller only composed of I/O, ALU and memory where both
data and program memory are stored in a same memory space [9] [10].
Figure 1.5 Microcontroller block diagram
PIC microcontrollers are popular with both industrial developers and hobbyist
due to several advantages. The advantages are low cost, wide ability, large user base,
an extensive collection of application notes, an availability of low cost or free
development tools, ability to perform serial programming, and ability to reprogramming with flash memory.
1.1.6
Bluetooth
Bluetooth technology is one of the wireless communication systems developed
to replace the usage of cables in electronic devices.
The aims for Bluetooth
technology are short range, radio frequency (RF) based wireless communication
between several devices.
It was first developed by Ericson in 1994 and now the
current developer is a special lobby of Special Interest Group (SIG) [11].
The first
governing idea behind the Bluetooth technology is to replace cable and specify wide
scale Integrated Circuit (IC) to be deployed on large scale on various type of
equipment.
A complete Bluetooth system requires four elements. The first element is an
RF portion for receiving and transmitting data.
Second element is a module with a
8
baseband microprocessor.
Third element that must have in Bluetooth module is
memory and lastly, the fourth element is an interface to the host device such as mobile
phone or laptop.
The advantages of this technology are low power consumption, low price, high
level of integration and profile, simple Quality of Service (QoS) and error control,
instantaneous networks, reliable and secure transmissions, and lastly this technology
have global compatibility and compliant with global emission rule. This technology
uses the unlicensed 2.4 GHz Industrial, Scientific and Medical (ISM) Band
communication thus also compliant with airline regulation. So it is safe to be used on
airlines [12] [13].
1.2
Problem Statement
In this modernization world nowadays, health becomes main concern of all
party. Ever growing industry kept on increasing by day improving the technology.
As widely known, heart attack is the leading cause of death for both men and woman
worldwide. From Malaysian cause of death statistics, heart disease is the number one
killer which is up to 12%. There are a lot of cases where patients not even realized
that they actually have heart problems. Therefore, a mobile heart rate monitor will
help patient identify the symptom of heart disease thus prevent sudden death caused
by heart attack anywhere and anytime necessary. The other problem is that since
Bluetooth architecture is compliant with global emission rule and available on
unlicensed portion of the radio frequency 2.4 GHz ISM Band, therefore theoretically it
can be used between medical devices. However, practically it is hard to achieve due
to instability of Bluetooth transmission thus making a real time processing using
Bluetooth is the least choice for wireless health telemonitoring.
9
1.3
Project Objectives
The main objective of this project is to design and develop a prototype system
of hardware and software that can acquire and transmit heart beat wirelessly and
display heart beat rate on laptop and mobile phone.
1.4
Scope of Work
In order to achieve the objective of the project, the scope of work includes;
i.
Study on heart beat monitoring system and its working principal.
ii.
Study on Bluetooth system and how it works.
iii.
Designing a sensor circuit that can capture heart rate.
iv.
Implementing amplifier circuit in the system so that the signal can be
recorded easily.
v.
Establish connections between microcontroller and Bluetooth system to
program microcontroller to receive and transmit heart beat via UART
vi.
Establish wireless connection between Bluetooth system and target
device (Laptop and PDA) and display heart beat on the device’s screen.
1.5
Thesis Outline
This thesis made up of five chapters.
The first chapter presents the
introduction to the project which includes research background, problem statement,
objective of the project, and scope of work.
The second chapter presents about literature review on previous researches that
have been done before.
The research discussed includes wearable ECG system,
methodology on how to obtain heart rate, heart rate monitoring using mobile phone,
and other researches involving wireless technology.
10
In the third chapter is the methodology and circuit design used in this project.
The details of the procedure for the project are also included in these chapters which
are sensor, data acquisition, data processing, and wireless data transmission. The
designed circuit also discussed in this chapter.
Fourth chapter is discussing on the results obtained in the project as well as the
analysis of the result. Meanwhile, Chapter 5 concludes the reports and the findings.
Also included in this chapter is the future research recommendation.
11
CHAPTER 2
LITERATURE REVIEW
2.1
Introduction
This chapter discussed on the projects that have been done previously such as
wearable device, heartbeat monitoring system and blood pressure monitor.
The
previous work discussed in order to understand the project better.
2.2
Wearable Wireless ECG System
Nowadays, there are a lot of concepts like “wireless hospital”, “mobile
healthcare”, or “wearable telemonitoring” emerge in medical technology industry.
These concepts refer to the bio-signal acquisition devices that can make health
monitoring easier even without staying in hospital.
Based on the research done previously, the most important feature for a
wearable device is to have a small size and light weight. It also requires using only
low power consumption. Furthermore, a wearable device must be able to interoperate
with different mobile devices and communication networks in the environment.
Above all, the most important feature of wearable device is to be able to do real time
12
processing. However, power consumption is a major limitation for mobile device
because heavy long lasting battery is not convenient for wearable purpose.
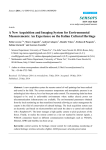
In the research stated the description of the system built for the reconfigurable,
wearable, wireless ECG system. The system consists of two parts; hardware system
and monitoring application for the mobile phone or PDA.
Figure 2.1 ECG system description (Adapted from [14])
The hardware system composed of three layers; acquisition layer, analog to
processing layer and wireless transmission layer.
Acquisition layer built using
bioamplifier and a bandpass filter while transmission layer consist of Bluetooth
module. The processing layer includes a microcontroller (PIC 16F876) and a FPGA
(Xilinx Spartan3E-100). The functions of microcontroller are to capture and digitalize
the ECG signal, establish the connection to the Bluetooth device and send the data
[14].
2.3
Heartbeat Monitoring Alert via SMS
The proposed system discussed by [15] was about heartbeat monitoring via
SMS. The hardware used involves sensor circuit, PIC circuit and MAX232 circuit.
The software used to simulate the design, schematic capture and printed circuit board
(PCB) design is PROTEUS 7.
13
Finger
Sensor
Circuit
PIC
Circuit
MAX232
Circuit
GSM
Modem
Mobile
Phone
(receiver)
Figure 2.2 Heartbeat monitoring system block diagram
Heartbeat is sensed using high intensity LED (Light Emitting Diode) and LDR
(Light Dependent Resistor). By illuminating the fingertip skin with the high intensity
LED, any changes in blood volume in each pulse will be detected by LDR. With each
heartbeat, a surge of blood from vascular system will expand capillaries in the finger
thus changing the amount of light returning to the LDR. The PIC circuit then will
process and analyze the signal and MAX-232 will be the interface between
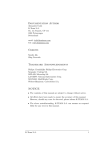
microcontroller and RS-232. The result obtained from the experiment is as Figure 2.3.
Figure 2.3 Result of heart rate obtained (Adapted from [15])
2.4
Mobile Phone Based Sphygmomanometer
The research is focusing on developing a high precision, non-invasive
continuous blood pressure monitor using pulse arrival time. The software used in the
research developed in the Eclipse integrated development environment with Java as
the programming language. The environment for mobile phone used is the Doja 5.0
profile. Doja 5.0 is a Java runtime environment specification for DoCoMo’s mobile
phone based on the Java ME CLDC. The procedure to estimate blood pressure is
firstly by obtaining ECG from the tip of finger from both hands and using index finger
14
of left or right hand to obtain pulse wave. Both ECG and pulse wave are sampled at
250 Hz filtered using notch filter and bandpass filter then transmitted to mobile phone.
Figure 2.4 shows the sensor and the blood pressure measurement device while Figure
2.5 shows the result displayed on the mobile phone screen during blood pressure
estimation. Table 2.1 shows the specification for communication between mobile
phone sensors.
Figure 2.4 Blood measurement device (Adapted from [16])
Figure 2.5 Display on mobile phone screen (Adapted from [16])
15
Table 2.1 Specification of communication between sensor and mobile phone
Band rate
38400 bps
Parity check
No
Stop bits
2 bits
In the investigation [16], blood pressure was measured on 13 subjects. Each
subject’s blood pressure was tested for three times to ensure data collected consistent.
Compared to blood pressure obtained from the commercial blood pressure monitor,
the systolic blood pressure obtained from mobile phone is slightly higher and diastolic
blood pressure is slightly lower than average. However it is easier to obtain the result
from mobile phone blood pressure than the commercial blood pressure monitor and
the measurement result was not affected by gender or age.
2.5
Wireless Technology Related Research
J.H.
Hong, et al. [17], discussed on the system which composed of
transmitter, receiver and remote server. In the transmitter stage, the input was from
measured ECG signal and fed to microcontroller before being sent to ZigBee
transmitter, Tx.
Then, in the receiver stage, the input transmitted from Tx will be
received by ZigBee receiver, Rx and then transmitted to PDA. Data from the receiver
also will be forwarded to remote server to be displayed on computer screen.
The
experiment was conducted using necklace type transmitter attached to a subject’s
sternum and the ECG signal was displayed on the screen of remote server receiver.
Since the prototype developed able to operate even while the subject is moving, the
system was suitable to be used by the old, the weak and the disabled people for
consistent physical condition monitoring. The system designed also able to store the
patient data continuously in the SD card and on the happening event, the data will be
sent to remote server through the receiver.
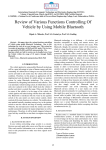
Eric R. Grigorian, et al. [18], discussed in on a system developed which
composed of MEMS sensor, microcontroller, Bluetooth and host computer. In their
16
research implementation, raw data was transmitted to base station for near real time
processing. The hardware developed in the research focus in miniaturizes the design
to produce compact size prototype which allow the ability to capture necessary
biometrics for the analysis.
On the host side, the data transmitted by Bluetooth
appeared as bounded serial interface. The received raw data was de-packetized by
removing start and stop bytes and the raw data was stripped out into an individual
ECG for data analysis.
2.6
Conclusion
As for the conclusion of this chapter, mostly previous research on heartbeat
monitoring system used same procedure which involves sensor layer, data acquisition
layer and data processing layer.
For wireless technology related researches, the
methods used are very advanced and the prototype developed are considered
applicable to healthcare systems. This information from previous research will help in
completing this project.
17
CHAPTER 3
METHODOLOGY AND CIRCUIT DESIGN
3.1
Introduction
This chapter mainly concern about how data are generated and collected in the project
as well as how they are analyzed to achieve the objective of the project. The detailed
explanation on the procedure of the project is included in this chapter.
3.2
Methodology
The procedure used for the experiment can be divided into four parts; sensor,
data acquisition, data processing, and wireless data transmission. The first part of the
project was the sensor used to detect hart beat via PPG technique. Firstly, the sensor
used was the reflective optical sensor with transistor output TCRT1000/TCRT1010.
18
a)
b)
c) Top view
Figure 3.1 Optical sensor TCRT1000 (Adapted from [19])
The TCRT1000/1010 has a compact construction where light-emitting source
and the detector were arranged in the same direction to sense the presence of any
object by using the reflective IR-beam from the object. The features of this optical
sensor are; compact construction in spacing of 0.1 with 7 mm length and 4 mm wide,
no setting efforts, high signal outputs, low temperature coefficient, detector provided
with optical filter and Current Transfer Ratio (CTR) of typical 2.5%. The sensing
distance of the sensor is 1 mm. By referring to sensor block diagram in Figure 3.1c, a
various values of resistor pair used to find the most suitable pair of resistor that can
capture PPG signal from finger correctly. In this project, resistor 220 Ω and 00 kΩ
was used where 220 Ω resistor was connected to C of the emitter and 5V power
supply while resistor
00KΩ was connected to E and Ground.
The A pin was
connected to Ground and C pin of receiver was connected to 5V power supply.
The second part was the data acquisition circuit which used instrumentation
amplifier INA114. Instrumentation amplifier was chosen due to its ability to obtain
high gain, high input impedance, and high common mode rejection ratio.
The output of sensor was fed into pin 3 of instrumentation amplifier. As
mention in introduction, using equation (1.1), gain can be calculated. Thus, Resistor
47 Ω was connected to RG which is between pin 1 and 8 to obtain gain was calculated
using equation (3.1) which is approximately 1000.
19
Figure 3.2 Instrumentation amplifier INA114 (Adapted from [20])
50 kΩ
R
(3.1)
The third part of the system was the data processing.
For this part,
microcontroller PIC16F877A was used. Software MicroC PRO for PIC was used to
program the microcontroller and PICKit2 was used as microcontroller programmer to
burn the program into microcontroller.
The amplified signal obtained from
instrumentation amplifier was fed to the external interrupt of microcontroller
PIC16F877A which is PORT A. PORT A was programmed to receive analog input
and transmit the data to UART pin which was PORT C pin RC6 and RC7. Pin RC6
was microcontroller’s transmitter pin thus it was connected to receiver pin of
Bluetooth module.
Meanwhile, pin RC7 was receiver pin of microcontroller thus it
was connected to transmitter pin of Bluetooth module. The connection between
microcontroller and Bluetooth is as shown in Figure 3.3.
The fourth part of this project was the wireless data transmission. Before the
data can be transferred, Bluetooth connection was established first between the
Bluetooth Module and the target device. Bluetooth Module came with a pair which
was the Bluetooth Dongle. If the laptop used to receive the data already has Bluetooth
device embedded, then Bluetooth Dongle was not needed.
20
Figure 3.3 Block diagram of microcontroller and Bluetooth module
(Adapted from [21])
The IVT BlueSoleil software was used to establish wireless connection
between the Bluetooth Module and target devices which was laptop and PDA. To
establish the connection, firstly all Bluetooth devices were turned on.
When IVT
BlueSoleil software detected the devices, all the devices appeared on the Bluetooth
network range. Then, the devices were connected by right hand click on the device
icon and connect to device option was clicked. COM PORT will be automatically
assigned by computer. Different devices were assigned to different COM Port.
In the meantime, software Labview 8.6 was used to receive and display the output
signal on the laptop. Firstly, VISA resource name was used to specify the input was
from which COM Port.
Then, it was connected to VISA serial to define serial
communication properties especially the baud rate. For Bluetooth data transmission,
baud rate used was 115200. Next, it was connected to VISA Read to read the data.
Lastly, the data will be displayed using waveform chart. The Labview diagram of the
receiver part is as illustrated in Figure 3.4.
21
Figure 3.4 Labview receiver block diagram
22
3.3
Circuit Design
The instrumentation amplifier circuit was simulated in Multisim before it was
implemented on protoboard.
The components chosen was as stated in INA114
datasheet except that in Multisim, there is no 25 kΩ and 40 kΩ resistor so, resistor 24
kΩ and 39 kΩ was used instead. From equation (3.1), gain of instrumentation
amplifier can be calculated.
Figure 3.5 Simulation of instrumentation amplifier in Multisim
4 kΩ
47
1022.27
(3.1)
23
Figure 3.6 Microcontroller and Bluetooth module circuit
For microcontroller and Bluetooth module as shown in Figure 3.6, the circuit
used was bought readily made from Cytron Technologies Sdn. Bhd. which is model
SK40 and SKKCA.
The connection between the microcontroller UART pin and
Bluetooth pin was soldered afterwards. The yellow and red light emitting diode
(LED) on the Bluetooth model will be used to indicate the data transmission. When
data is transmitted, red LED blinked and when data is received yellow LED blinked.
3.4
Conclusion
This chapter discussed on the methodology used in the project.
Generally,
there are four stages in this project which are sensor circuit, data acquisition, data
processing and wireless data transmission. Also included in this chapter are the
circuits developed for this project.
24
CHAPTER 4
RESULT AND DISCUSSION
4.1
Introduction
This chapter mainly discussed on the results obtained in this project. Every results
was discussed regardless the success or failure of each result obtained. The reason
behind every result is explained further in this chapter.
4.2
Results and Discussion
From the simulation done in Multisim, the output obtained was in Volts when
given input of miliVolts which shows that instrumentation amplifer can amplify the
gain until 1000.
However, when the circuit was implemented on protoboard, the
output obtained was not as simulated. Implemented circuit shows too much noise and
the amplifier circuit did not manage to increase the gain. After a lot of trial done, the
result showed that the amplifier circuit can only amplified the gain up to 20. There
was also another problem occur which is the noise also amplified along the input
signal.
Furthermore, the circuit designed also very unstable both sensor and amplifier
because the output was not consistent. After a few consideration, the sensor part and
25
amplifier part was removed from the project due to time constraint. Instead, the input
source was taken directly from ECG simulator and amplified using Biomedical
Amplifier (BMA-400) as shown in Figure 4.1. The ECG simulator was set to give 80
BPM ECG pulse taken from right leg (RL) and right arm (RA). Left leg was set to be
ground point in the ECG simulator. All three pin was connected to ISO-Z to give the
polarity to the signal where RA is positive and RL is negative.
Then ISO-Z device
was connected to BMA-400 to amplify the ECG signal. In BMA-400, only channel 1
was used and it was set to give AC coupling, gain 1000 and band pass filter 3Hz for
low frequency and 0.1Hz. The output of BMA-400 is as shown in Figure 4.2. Then,
the output was fed to microcontroller pin RA5.
Figure 4.1 ECG simulator and BMA-400
Figure 4.2 Output of BMA-400
26
In a meantime, wireless connection was established between the laptop,
microcontroller and PDA was established.
Since the range of Bluetooth network is
about 10 meters, other Bluetooth device also appeared in the network. KcSerial icon
in the Figure 4.3 indicates the microcontroller and the others are mobile phone and
PDA.
Figure 4.3 Wireless connections
The COM port given by the laptop to microcontroller was COM 30 so in the
Labview, serial communication was also set to be COM 30 so that the data can be
transmitted and displayed on the laptop screen as displayed in Figure 4.4.
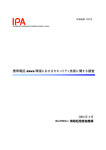
From the output obtained in the Labview, we can see some of the similarities
between the output of BMA-400 and as shown in the Labview especially for P peak
and R peak of the signal.
However, the signal obtained after wireless transmission
was not as smooth as the output given. This shows that for real time processing, the
27
data transmission using Bluetooth will not yield accurate data.
Even if it does, the
data transmitted must be filtered and processed before it can be used for medical
diagnosis.
This finding further proved that real time data transmission is hard to
achieve due to unstability of Bluetooth transmission.
Figure 4.4 Output from Labview 8.6
Supposedly, after the data was transmitted to laptop it must also be transmitted
to PDA for diagnosis.
However, Labview 8.6 software was unable to detect the
device because the software used was a trial version. Thus it does not have any PDA
module.
Other version of Labview was used which is Labview 8.0 but since the
version used is more previous than the 8.6 version, the data were unable to be
retrieved from input. Although Labview version 8.0 have PDA module installed, the
software still unable to detect the device. Thus, no data were able to be displayed on
the PDA.
28
4.3
Conclusion
This chapter has discussed all the results obtained in the project.
Since the
first and second part of the project failed to produce usable output, both stages were
removed and replaced by ECG simulator input. The input used was amplified using
Biomedical Amplifier BMA-400.
Bluetooth data transmission of the input was
successfully displayed on the laptop but the output obtained differs than the input
given due to transmission problem. Lastly, the output was unable to be displayed on
PDA due to software related problem.
29
CHAPTER 5
CONCLUSION AND RECOMMENDATION
5.1
Conclusion
To conclude this report, generally there are four stages in this project which are
sensor, data acquisition, and data processing and wireless data transmission to laptop
and PDA. However, due to instability of sensor and data acquisition hardware, both
first and second stage was eliminated from the project. For testing purpose, input was
taken from ECG simulator and amplified by Biomedical Amplifier BMA-400.
The
input was fed into microcontroller which has been programmed to transmit the data
wirelessly using Bluetooth module.
Wireless data transmission was successfully
retrieved by laptop and viewed on the screen. However, the data obtained was not as
smooth as the input given due to transmission problem. Wireless data transmission to
PDA was not successfully achieved due to software related problem.
Therefore, this project succeed to fulfill the main objective of this project
which is to design and develop a prototype system of hardware and software that can
acquire and transmit heart beat wirelessly and display heart beat rate on laptop and
mobile phone.
However the output of the prototype system was not as accurate as the input
given thus making it hard to be used for medical diagnosis. This project has proven
the theory which Bluetooth wireless data transmission can be used between medical
devices however, it is hard to achieve due to its unstability of Bluetooth transmission
30
thus making a real time processing using Bluetooth is the least choice for wireless
health telemonitoring.
5.2
Future Development
For future research, Bluetooth technology was not recommended to be used as
wireless data transmission between medical devices especially for real time data
processing because real time data processing requires accurate data transmission.
Even if it can be used, there must be a lot of data processing and filtering before the
data can be used for medical diagnosis.
It is also recommended to use ZigBee or
GSM Module for wireless data transmission and SMS alert.
31
REFERENCES
[1]
Viegas, J. (2001). The Heart: Learning How Our Blood Circulates. New York:
Rosen Pub. Group. pp7-8.
[2]
Campbell, N. and Reece, J. Biology (2005). San Fransisco: Pearson, Benjamin
Cummings. pp.870-874.
[3]
Carr, J.J. and Brown, J.M. (2001). Introduction to Biomedical Equipment
Technology. Fourth ed. Ohio: Prentice Hall. pp.743.
[4]
Agache, P., Humbert, P., Maibach, H.I. (2004). Measuring the skin. Berlin:
Springer. pp.336.
[5]
Photoplethysmograph.
22 June 2010;
Wikipedia. Available
from:
http://en.wikipedia.org/wiki/Photoplethysmograph.
[6]
Bronzino, J. (2000) The Biomedical Engineering Handbook. Boca Raton: CRC
Press. pp16.
[7]
File:Opampinstrumentation.xcf. 12 November 2005; Wikimedia Commons.
Available from:
http://commons.wikimedia.org/wiki/File:Opampinstrumentation.xcf.
[8]
Floyd, T. (2008). Electronic Devices. New Jersey: Pearson / Prentice Hall. pp
710-714
[9]
Sickle, T.V. (2001). Programming Microcontrollers in C. Eagle Rock, Calif.:
LLH Technology Pub.
[10]
Jasio, L.D., Wilmshurst, T., Dogan, Ibrahim, Morton, J., Bates, M. P., Smith,
J., Smith, D. W., Hellebuyck, C. (2008). PIC Microcontrollers: Know It All.
United Kingdom: Newnes. pp.910.
[11]
Labiod, H., Afifi, H., and Saintis, C.D. (2007). Wi-FiTM, BluetoothTM,
ZigBeeTM and WiMaxTM. The Netherlands: Spronger. pp.75-108.
[12]
Bakker, D.M. and Gilster, D.M. (2002). BluetoothTM End to EndTM. End to
End, ed. R. Gilster. New York: Hungry Minds, Inc. 5-13,43-49,143-148.
32
[13]
Bray, J. and Sturman, C.F. (2002). Bluetooth 1.1: Connect without Cables.
Second Edition ed., New Jersey: Prentice Hall PTR. 126-128,176-197.
[14]
Borromeo, S., Rodriguez-Sanchez, C., Machado, F., Hernandez-Tamames, J.
A., de la Prieta, R. (2007). A Reconfigurable, Wearable, Wireless ECG
System. Engineering in Medicine and Biology Society, 2007.
[15]
Jubadi, W.M. and Mohd Sahak, S.F.A. (2009). Heartbeat monitoring alert via
SMS. Industrial Electronics & Applications, 2009.
[16]
Abe, H., Wenxi, C., Togawa, T., Maeda, T., Arai, R. (2007). Development of a
mobile
phone
based
beat-by-beat
sphygmomanometer.
Information
Technology Applications in Biomedicine, 2007. ITAB 2007. 6th International
Special Topic Conference.
[17]
Hong, J.H., Kim, J.M., Cha, E.J., Lee, T.S. (2007). A Wireless 3-channel ECG
Transmission System Using PDA Phone. International Conference on
Convergence Information Technology,. vol., no., : p. pp.462-465.
[18]
Grigorian, E.R., R. Adhami, and Toutonji, O. (2007). Wireless EGG Monitor.
Computational Advances in Multi-Sensor Adaptive Processing,. CAMPSAP
2007. 2nd IEEE International Workshop on(vol., no., pp.161-164).
[19]
Semiconductors, V. (1999). TCRT1000/TCRT1010 Reflective Optical Sensor
with Transistor Output. ; Available from: www.vishay.com.
[20]
Corporation, B.-B. INA114 - Precision INSTRUMENTATION AMPLIFIER Burr-Brown. 08-05-2011]; Available from:
http://pdf1.alldatasheet.com/datasheet-pdf/view/56674/BURRBROWN/INA114.html.
[21]
Technologies, C. KC Wirefree Bluetooth Starter Kit User's Manual. 09-042011 08-05-2011]; Available from:
http://www.cytron.com.my/usr_attachment/SKKCA%20Users%20Manual.pdf
.
33
APPENDIX A
COMPONENTS DATASHEET
34
Figure A.1 Microcontroller board layout
35
36
Figure A.2 Further explanation on microcontroller board layout
37
Figure A.3 Bluetooth module board layout
38
APPENDIX B
PROGRAMMING SOURCE CODE
39
char uart_rd;
void main() {
ADCON1 |= 0x0F;
// Configure AN pins as digital
CMCON |= 7;
// Disable comparators
UART1_Init(115200);
// Initialize UART module at 115200 bps
Delay_ms(100);
// Wait for UART module to stabilize
UART1_Write_Text("Start");
UART1_Write(10);
// Line feed
UART1_Write(13);
// Carriage return
while (1) {
// Endless loop
if (UART1_Data_Ready()) {
uart_rd = UART1_Read();
UART1_Write(uart_rd);
}
}
}
// If data is received,
// read the received data,
// and send data via UART
40
APPENDIX C
LABVIEW RECEIVER CIRCUIT DESIGN
41
LABEL
FUNCTION
VISA Resource Name
Select input port wireless transmission
VISA Serial
Specify serial communication properties such as Baud rate
For Bluetooth, Baud rate = 115200 bps
VISA Read
Read data received from transmitter
Read buffer
Buffer to wait for next data received
Waveform Chart
Display the data received in amplitude versus time
Decimal integer string
Buffer to wait for data to be displayed in waveform cart
Stop
To stop receiving the data
Figure C.1 Labview block diagram and functions