1
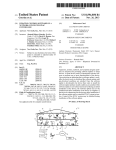
MS2500L Transmitter
Operator’s Manual
Metal Samples Corrosion Monitoring Systems
A Division of Alabama Specialty Products, Inc.
152 Metal Samples Rd., Munford, AL 36268 Phone: (256) 358-4202 Fax: (256) 358-4515
E-mail: [email protected] Internet: www.metalsamples.com
Houston Office: 6327 Teal Mist Lane, Fulshear, TX 77441 Phone: (832) 451-6825
.
Table of Contents
I. Introduction ....................................................................................................................... 1
A. General Description ..................................................................................................... 1
B. Principle of Operation .................................................................................................. 2
C. Modes of Operation .................................................................................................... 3
D. Specifications .............................................................................................................. 4
E. Summary ..................................................................................................................... 5
II. Installation Procedures ....................................................................................................... 6
A. MS2500L Transmitter Mounting .................................................................................. 6
B. MS2510 Receiver Installation ...................................................................................... 6
III. Operation ....................................................................................................................... 7
A. Cycle Time Predetermination ....................................................................................... 7
IV. Accessories ....................................................................................................................... 8
A. MS2510 Receiver/Power Supply ................................................................................ 8
B. Probes and Electrodes ................................................................................................. 9
C. Electrodes Normally Carried in Stock .......................................................................... 10
D. Probe Placement ......................................................................................................... 11
E. Probe Installation ......................................................................................................... 11
F. PAIRTM Probe Assembly ............................................................................................. 12
V. Circuit Description ............................................................................................................. 14
A. Introduction ................................................................................................................. 14
B. LPR Measurement Technique ...................................................................................... 15
C. Basic Structure ............................................................................................................ 16
D. Circuit Description ....................................................................................................... 17
E. Operation Modes ........................................................................................................ 20
VI. Calibration Procedure ........................................................................................................ 21
A. Disassembly ................................................................................................................ 21
B. Equipment Needed ...................................................................................................... 21
C. Applying Power .......................................................................................................... 21
D. Frequency Calibration ................................................................................................. 21
E. Zeroing Adjustments .................................................................................................... 22
F. Current Span Adjustment ............................................................................................ 22
G. Disconnection .............................................................................................................. 22
VII. Instrument Testing and Repair ........................................................................................... 23
A. Recommended Test Equipment .............................................................................. 23
B. Board Removal ..................................................................................................... 23
C. Electrostatic Shield Removal .................................................................................. 23
D. Visual Inspection ................................................................................................... 24
E. Electrical Testing ................................................................................................... 24
VIII. Current Loop Operation and Testing ............................................................................... 28
A. Recommended Test Equipment .............................................................................. 28
B. Instrument and Loop Verification ............................................................................ 28
C. Probe Element Testing ........................................................................................... 28
D. Current Loop Isolation Testing ............................................................................... 29
Appendix A: Drawings .............................................................................................................30
Assembly Drawings ..........................................................................................................31
Installation Drawing ..........................................................................................................36
Appendix B: Parts List .............................................................................................................37
Appendix C: Effects of Process Variables .................................................................................38
Temperature .....................................................................................................................38
pH 54 ..............................................................................................................................38
Oxygen Concentration ......................................................................................................38
Fluid Velocity ...................................................................................................................38
Suspended Solids .............................................................................................................39
Electrode Potentials ..........................................................................................................41
Common Corrosive Agents ..............................................................................................43
Appendix D: Warranty Information ...........................................................................................44
Appendix E: Maintenance and Repair Instructions ....................................................................45
I. Introduction
A. General Description
The MS2500L corrosion rate transmitter is a two-wire, 4-20mA current loop transmitter for corrosion
measurements using the three-electrode, linear polarization technique (LPR). Functionally, the MS2500L
transmitter operates under the same principles as the automatic LPR instruments offered by Metal
Samples Corrosion Monitoring Systems with the exception of its low-power current loop operation.
Figure 1. MS2500L
1
The MS2500L transmitter is housed in an explosion-proof enclosure with the following ratings:
Housing Ratings:
Class I
Class II
Class III
FM Approved
Groups B,C,D
Groups E,F,G
NEMA 4X
CSA Approved
The MS2500L is equipped with 10 feet of transmitter-to-probe cable and uses the standard five-pin
environmental connector found on all of our existing LPR equipment. This light-armor cable passes into
the housing through an explosion-proof cable gland.
Located inside the housing is an electronics package consisting of two printed circuit cards, the mounting bracket for the circuit cards, and all the necessary termination points for the cable and current loop
connections.
The termination points on the printed circuit cards are constructed using removable terminal blocks. This
provides a permanent screw type connection which can break-away from the printed circuit cards for
their easy removal.
The printed circuit cards rest in slide rails within the mounting bracket. Once the terminal blocks are
detached from the printed circuit cards, the circuit cards slide out of the instrument for easy repair,
calibration, or replacement.
B. Principle of Operation
The MS2500L transmitter reads and stores the potential difference between a reference electrode and a
test electrode. It then applies a current through an auxiliary electrode and the test electrode until the
potential measurement between the test and the reference electrodes changes by 10 millivolts. The
instrument then allows this current to settle for a predetermined length of time (polarization cycle), after
which, it samples this current and updates the current loop output using the conversion factor of 5.5 µA
per MPY.
Note: The surface area of the electrode has been adjusted where 5.5 µA converts to 1 MPY.
The polarizing current is then turned off and the cell is allowed to relax for the same length of time as the
polarization cycle.
2
Cycle Time Adjustment
The MS2500L uses a digital timing circuit which can be adjusted using three 10-position rotary switches
(Figure 2). The first switch represents tens of minutes, the second switch represents minutes, and the
third switch represents tenths of minutes. This allows user-selectable time cycles from 00.1 minutes to
99.9 minutes in 00.1 minute increments. The switches are located in the upper right hand corner.
Figure 3. Front Board
Figure 2. Back Board
C. Modes of Operation
An additional feature that is incorporated into the MS2500L transmitter is the ability to monitor and
transmit the corrosion potential of the cell. This a switch selectable function where the 4-20mA current
loop represents a corrosion potential of 1V positive or 250 mV negative full scale.
In either mode, LPR or OFFSET, the user can select two different modes of current loop response.
The first mode is the normal operation mode or SAMPLE mode. This mode is as the one described
earlier where the current loop information is updated upon the completion of a measurement cycle. This
is the logical choice of operation when taking LPR measurements where the current loop information
constantly represents the corrosion rate in mils per year. This mode of operation can also be used in
conjunction with electrode potential measurements where the corrosion potential can be sampled and
the current loop updated on intervals as set by the cycle time adjustment.
The second mode of operation is the TRACK mode. In this mode, the current loop output is updated
every 1.5 seconds. When taking corrosion potential measurements, this provides the user with a current
loop output that constantly tracks the cell corrosion potential. For LPR measurements, the current loop
will reflect the cell response to the applied current. This provides an excellent method for selecting the
cycle time for the normal mode of operation.
3
D. Specifications
Model
MS2500L - Loop-Powered LPR Transmitter (Ordering # IN2500L)
Physical Data
Instrument Weight:
Total Weight w/ Accessories:
Instrument Dimensions:
Case Specifications:
5.02 lb. (2.28 Kg)
7.08 lb. (3.21 Kg)
5.81"H x 4.5"W x 4.81"D (14.76cm x 11.43cm x 12.22cm)
Explosion Proof (FM, CSA, CENELEC, UL)
Class I, Groups B, C, D, Class II, Groups E, F, G, Class III,
CENELEC: Eexd IIC
Mounting Specifications:
Operating Temperature:
Storage Temperature:
NEMA 4X, 7BCD, 9EFG
0.728"H x 1.756"W (1.85cm x 4.46cm) Bolt Pattern with 1/4-20
Tapped Mounting Holes, or May Be Mounted on a 1/2" to 2"
(1.27cm to 5.08cm) Pipe Using Supplied Hardware
32° to 158°F (0° to 70°C)
32° to 158°F (0° to 70°C)
Performance Data
Measurement Type:
Range:
Cycle Time:
3-Electrode LPR, Potential
3-Electrode: 0-100 mpy Potential: ± 1V
0.1 to 99.9 minutes
Electrical Data
Power Requirements:
11 to 35 VDC
Maximum Probe Cable Distance: 10 ft (3.05 m)
Output Specifications:
4-20mA Current Loop Output
Special Features
• Switch selectable measurement type and cycle time
• Loop powered
Accessory Items
10' Probe Cable (attached), Meter Prover, Mounting Hardware, Operation Manual
4
E. Summary
The MS2500L transmitter moves on-line corrosion monitoring into the realm of conventional plant
practice by placing the D.C.- powered transmitter close to the corrosion rate probe (the sensor) and
using the two-wire signal loop to provide both the power to the transmitter and the proportional signal
corresponding to the data.
User Selectable Operation
Switches on the transmitter’s circuit board allow the user to select necessary parameters such as:
•
•
•
Operation Mode: Track or Sample
Cycle Time: .1 - 99.9 minutes
Transmitter Data Type: Corrosion Rate (MPY) or Electrode Potential (mV)
Low Cost
Since the transmitter is of the two-wire type, the installed cost of an installation is far less than if the
analyzer is located in the control room and signal cables are run from the sensor to the analyzer.
Safe
The transmitter itself is housed in a compact explosion-proof housing.
Standardized Output
Since the 4-20mA data signal from the transmitter is the most common in industrial use today, the
display of the corrosion rate data is simplified. The data may be displayed on a suitable recorder, digital
voltmeter or on the optional MS2510 digital display unit which will display loop current, corrosion rate
(MPY), or electrode potential (mV). The MS2510 also has an auxiliary power supply for powering the
transmitter and a current loop output for passing the data on to another reading device.
PAIRTM probes (3-electrode, Linear Polarization type) can be used as sensors for the MS2500L
without modification.
5
II. Installation Procedures
A. MS2500L Transmitter Mounting
When mounting the MS2500L choose a location that is free from vibration. The mounting bracket (Ubolts) can accept a pipe that is no larger than 2.5 inches.
Always remove power to the instrument when mounting; especially when mounting it in a hazardous
area.
(See Drawing No. 8102 in Appendix A for preferred hardware mounting scheme.)
B. MS2510 Receiver Installation
The MS2500L transmitter can be used in conjunction with the MS2510 receiver. (See Drawing No.
8101 in Appendix A for connecting these two instruments together. See Section IV for description and
specifications of the MS2510.)
Front Panel
Two of the three positions on the front panel of the MS2510 are used with the MS2500L. One is the
loop current in milliamps and the other (far right) is corrosion rate in mils per year.
Back Panel
The back panel’s 10-position rotary switches must be set to 999 when operated in the Corrosion Rate
Mode. In Current Loop Mode the switch positions do not matter.
Wire Connections
Once the MS2500L is installed, connections are made by connecting the red wire (+) coming out of the
MS2500L to the (+) side of terminals on back of the MS2510 receiver labeled - LOOP +. Connect
the black wire (-) to the (-) side under - LOOP +.
6
III. Operation
A. Cycle Time Predetermination
The following procedure assumes both the mechanical and electrical installation of the instrument. This
procedure also requires that some form of device is available for monitoring the loop (ie., DVM, chart
recorder, etc).
1. Connect the instrument cable to the probe.
2. Set the sample time adjust switches on the MS2500L to 999.
3. Set the operation switches to LPR and TRACK mode.
4. Power up the loop and observe the loop current (using a ammeter, recorder, etc). The
current reading will change every two seconds. These readings will then begin to settle.
Depending upon the conditions, this may take from 30 seconds to 30 minutes. Record this
time interval.
Figure 4. Settle Time
5. Set the sample time adjust switches to this time interval.
6. Set the operation switches to LPR and SAMPLE.
7. Cycle the loop power on and off. (Break Loop)
8. The instrument is now in the run mode and will update the current loop output once every
two sample time intervals.
7
IV. Accessories
A. MS2510 Receiver/Power Supply
When operated together, the MS2510 receiver and MS2500L transmitter provide the corrosion
investigator with a low-cost, 4-20mA corrosion monitoring system. Data received from the transmitter is
displayed on the receiver’s front panel, a three digit L.E.D. The three-position function switch, located
at the center of the receiver’s front panel, permits the data to be displayed in one of two formats,
depending on switch position: milliamps and corrosion rate (MPY). Located at the back of the receiver
are 4-20mA and 10V output terminals for connection of the receiver to a customer-supplied computer,
data logger, or recorder; connection terminals for the MS2500L; and an AC power cord connector.
General Specifications - MS2510
Display:
3-digit L.E.D. display to give:
a) Loop Current (in mA)
b) Probe Reading (0-100 MPY)
Dimensions:
Length: 5.25"
Width: 2.0"
Height: 6.6"
Required
Installation Space:
4.3" x 2"
Weight:
3 lbs.
Electrical Specifications - MS2510
Power Requirements:
120/240V AC 50/60 Hz @ ½ Amp
Outputs:
24V DC - 4 to 20 mA current loop drive
4-20mA - isolated output to CPU, etc.
0-10V - isolated output to chart recorder
8
B. Probes and Electrodes
The PAIRTM probes used in conjunction with Metal Samples Corrosion Monitoring Systems corrosion
rate instruments are an essential component of a corrosion rate measuring system. For this reason, the
composition of the electrodes installed on the probe must be matched as nearly as possible to the
composition of the components of the processing system in which the probe and electrodes are installed. In addition, the placement of the probe is extremely important in obtaining accurate corrosion
rate readings. Basically, a probe is simply a means of mounting the three electrodes which are necessary
to make the corrosion rate measurement and provides a means of electrically connecting the electrodes,
the composition of which is determined by the customer.
The probes are generally classified into two types: laboratory probes and industrial probes. All probes
are supplied with MIL environmental electrical connectors unless otherwise specified. For further
information on probes and electrodes contact:
Metal Samples Corrosion Monitoring Systems
P.O. Box 8
Munford, AL 36268
Phone: (256) 358-4202
Fax: (256) 358-4515
E-mail: [email protected]
Internet: www.metalsamples.com
9
C. Electrodes Normally Carried in Stock
EL-600
EL-601
EL-610
EL-611
EL-612
EL-613
EL-614
EL-615
EL-620
EL-621
EL-630
EL-631
EL-632
EL-633
EL-634
EL-635
EL-640
EL-641
EL-643
EL-651
EL-652
EL-653
EL-654
EL-655
EL-657
EL-658
EL-660
EL-671
EL-672
EL-673
EL-687
EL-681
Lazaran1 Reference Electrode with one VITON2 Gasket
Aluminum, Alloy 6061 (standard)
Copper (99.0% Pure)
Brass (85-15)
Admiralty Metal
Copper-Nickel
Aluminum/Bronze (92 Cu-8 Al)
Copper-Nickel (70-30)
Cold Rolled Mild Steel (1018) 0.250" Dia.
Cold Rolled Mild Steel (1018) 0.375" Dia.
304 Stainless Steel
316 Stainless Steel
410 Stainless Steel
430 Stainless Steel
304 Low Carbon Stainless Steel
316 Low Carbon Stainless Steel
Hastelloy3 B
Hastelloy C
Hatelloy N
Nickel 200
Inconel4 600
Inconel 625
Incolloy4 800
Incolloy 825
Monel4
Alloy 20 Cb5
Zinc
Titanium
Tantalum
Zirconium
Aluminum/Brass
Replaceable Electrode Assembly for PR-556-E Flush Mounted Probe
Registered trademark of Beckman Instruments, Inc.
Registered trademark of DuPont.
3
Registered trademark of Stellite Division, Cabot Corp.
4
Registered trademark of Huntington Alloys Inc.
5
Registered trademark of Carpenter Technology.
1
2
10
D. Probe Placement
Proper probe location is the first and one of the most important considerations in obtaining pertinent
data with the corrosion rate instrument. Any system can be expected to have corrosion occurring at
several rates as a function of location within the system. The different rates may be due to changes of
temperature, changes in velocity, impingement effects, differences of metallurgy, variations in character
of fluid stream, etc. It is therefore unlikely that a single probe location will be able to produce quantitative corrosion rate data for the overall system. Each probe does, however, provide valuable information
by reading the corrosion at the particular location, and by indicating the general range of overall corrosion by following changes in corrosion rates caused by adjustments in inhibitors, oxygen level or process
variables.
The change in corrosion rate of a system due to altering a variable should be in direct ratio for all parts even
though the absolute rates are widely different. For instance, if the addition of an inhibitor will reduce the
instrument’s reading by 90 percent, all normal surfaces of the same metal contacted by the inhibitor should
have their corrosion rates similarly reduced. Usually, a probe location is selected to read on the high side of
a system’s average rate in order to accentuate changes.
It should be emphasized that a corrosion rate reading is the actual corrosion rate taking place on the
surface of the Test electrode at the time of measurement.
The condition of the probe’s Test electrode surface due to past service, as well as current process conditions, may have an important bearing on the readings.
The corrosion engineer is challenged to adapt the above to his situation and interpret the results In light of
the location and operational factors involved.
E. Probe Installation
Probe installations should generally be selected on the following basis:
1. Locate the probe as close as possible to the warmest section of the system. If vaporization is
experienced in the process, the probe should be installed immediately after condensation.
2. If the fluid is normally flowing, it is recommended that the probe be inserted in such a way as to
experience approximate pipe wall velocity. The probe should not be installed in a stagnant section of
line. Some turbulence at an elbow or tee may result in slightly high, but acceptable, corrosion rate
readings.
11
3. Direct fluid impingement on the probe’s electrodes (at a very high velocity of about 10-feet-persecond or so), should be avoided as this usually results in abnormally high corrosion rates aggravated by erosion.
4. The probe should not be installed in a position where solids are likely to collect. Solids can build up
on the probe base and electrically short out the electrodes.
5. Any surface area in contact with a hydrocarbon phase or gas phase will not be corroding. Therefore, representative maximum corrosion rates are obtained when the total Test electrode surface is
in water or electrolyte.
6. A bypass loop around a section of the main piping may be considered. Probe inspection and
electrode replacement can be made without system shutdown. Effects of velocity can be checked
by throttling of bypass valves.
The above is furnished as a general guideline. The existing physical facilities of most systems will dictate
the probe location. If this turns out to be in conflict with the ideal considerations, the probe should be
installed keeping in mind the problems that may arise.
F. PAIRTM Probe Assembly
All probes with replaceable electrodes are shipped with the electrodes and gaskets in a separate packet
if the electrodes are purchased with the probes.
When ready to install, open the packet and place one of the gaskets on each of the three mounting pins.
Pin A is connected to the Reference electrode, Pins B and D are connected to the Test electrode and Pin
C is connected to the Auxiliary electrode.
Figure 5. Electrode Mounting Configurations
12
The electrodes should not be handled with bare sweaty or oily hands. If possible, pick up the electrodes
with a paper towel or clean cloth and thread onto each of the three mounting pins. The electrodes
should be firmly hand tightened in place sufficiently to deform the gasket. A one inch piece of plastic
tubing slipped over an electrode is an effective means of tightening it on the probe without soil or
damage. Do not force with pliers or in a vise, as this will mark the surfaces. Do not use thread
lubricant.
The mild steel electrodes have been given a surface preparation to permit fastest possible equilibrium to
the system. Any foreign material such as grease, oil or sweat will delay obtaining uniform readings.
Should a change in location or environmental service of mild steel electrodes be desired, the electrodes
need to be removed, scrubbed with scouring powder and water, and then placed in a beaker of 5-10
percent hydrochloric acid (uninhibited) until the surfaces are uniformly covered with a layer of hydrogen gas bubbles. They should be rinsed thoroughly in clean water before reinstalling. This action is
usually sufficient to prevent effects of previous service seriously interfering with the new application.
13
V. Circuit Description
A. Introduction
The MS2500L is a Linear Polarization Resistance (LPR) type corrosion monitoring instrument that
translates corrosion rates obtained from polarization techniques into a 4-20ma current which is then
transmitted through a two-wire twisted cable.
This instrument also incorporates the ability to monitor and transmit the Corrosion Potential, obtained
from LPR probes using a reference electrode. The power for the instrument is supplied on the same two
wires that return the corrosion rate signal. Therefore, to power its internal circuitry, the instrument can
use no more than the four milliamp, live zero, current supplied on the loop. This 4-20mA type of monitoring instrumentation has become a standard in the process monitoring industry. The 4 and 20 milliamp
values are used for several reasons:
1. A power supply voltage of 25 volts or more can be supplied to overcome long cable drops or to
fulfill power requirements for the instrumentation.
2. The 4 milliamp live zero not only provides current to power the instrument, but also provides a
method to determine loop failure. If the zero output point of the instrument was at zero milliamps,
there would be no way to differentiate between a zero output or a failure in the loop.
3. The transmission of a low impedance signal, (such as a current), rather than a high impedance signal,
(such as a voltage), sets up a transmission technique that is much more impervious. Generally, noises
induced onto signal cables are of very high impedances. It would take a very large external force to
induce a noise signal onto the loop at a current of 4mA or more. Again, if a true zero point were
used, it might be possible to induce a noise error around the zero current level. However, the use of
the 4mA live zero precludes this possibility.
14
B. LPR Measurement Technique
The LPR technique is a near instantaneous method for determination of corrosion rates using PAIRTM
probes or similar probes. It is a simple process which incorporates several steps.
1. The potential difference between the test and the reference electrode is sampled and recorded.
2. A current is forced between the auxiliary and test electrodes until the original potential difference is
changed by 10 millivolts.
3. This polarization current is allowed to settle for a user specified duration.
4. The current is then sampled and a conversion factor is used to calculate the MPY value. 5.5 µA/
MPY.
5. The polarization current is relaxed for the same duration after which, the process can then be
repeated.
The MS2500L instrument incorporates the circuitry necessary to perform the above steps as well as the
ability to monitor and transmit the potential difference between the reference and test electrodes.
Following the above description, the circuitry is divided into several sections:
•
Potential measurement and recording.
•
Polarization reference and current control.
•
Clock and timing circuits.
•
Polarization current measurement and conversion.
General circuitry required for the operation of the instrument.
•
Power supplies.
•
Current loop sensing and control.
•
Power on reset
15
C. Basic Structure
The circuitry for the MS2500L is contained on two circuit cards.
The A1 Board contains circuitry for:
•
Corrosion potential measurement.
•
Corrosion potential null and hold.
•
10 millivolt probe polarization and reference.
•
Polarization current control, measurement and conversion.
The A2 Board contains circuitry for:
•
Power supplies.
•
Clock and timing control circuits.
•
Power on reset.
•
Current loop sensing and control.
•
Output sample and hold.
16
D. Circuit Description
The following circuit description describes the behavior of the circuitry in the LPR mode with the output
mode set to SAMPLE. This is the most common mode of operation for this type of instrument. Differences in operation modes are described in following sections.
Power Supplies
The power supply circuitry is contained on the A2 Board. This includes:
• A 2.5 volt reference circuit made up of U9 and CR6.
• The main 6 volt source maintained by AR5-A and Q2.
• The 1 volt common reference maintained by AR6.
• The Auxiliary common reference and supply consisting of AR5-A and AR5-D.
The constant current IC, U9, and the micropower reference diode, CR6, maintain a stable 2.5 volt
reference. This reference is amplified and regulated at 6 volts by AR5-A. Since this is the main power
source for the circuitry, the 2N2222 transistor, Q2, in the feedback loop of AR5-A adds extra current
drive. AR6 contains a built-in 200 millivolt reference and a power OP-amp. Together these are used to
supply a 1 volt common source for most of the analog and digital circuitry. AR5-C and AR5-D are unity
gain buffers used to supply the power to the clock circuitry which tend to degrade the power supplies.
Clock, Timer and Power On Reset Circuit
The clock, timing and power on reset circuitry are contained on the A2 Board. These circuits consist of:
• A power on reset pulse generator; U17.
• A clock oscillator and divider circuit consisting of U16 and U12.
• A user programmable timer circuit made up of U8, U10, and U11, and SW3, SW4, and SW5.
Upon power up, a pulse is generated by U17 which sets the initial states of the timer circuits to the user
selected BCD value using SW3, SW4, and SW5. The timers are cascaded in order to count down
upon every pulse generated from the Q14 output of U12. Upon each completion of
17
count down, a pulse is generated to reload the counters and to initiate either a polarization cycle or a
relaxation cycle, (initially a polarization cycle), depending upon the previous state. Pulses from Q14
output of U12 are generated upon 1/10 minute intervals, (0.166 Hz), which are divided down from the
2730 Hz signal developed by the U16 clock oscillator. A 5.332 Hz signal generated by the Q9 output
of U12 is also used to clock the sample and hold circuits.
Potential Sample and Hold Circuits
The potential sample and hold and measurement circuits are contained on the A1 Board and are made
up of:
• An infinite term digital sample and hold consisting of:
A bipolar successive approximation ADC using U7, U4, U5 and AR4-B-C-D.
A 200 millivolt ADC reference using part of AR3.
• A low power instrumentation amplifier made up from AR1-A-B, AR2, R4, R5, R8 and
R9.
• An inverting amplifier using AR1-C, R1 and R2.
As explained earlier, the first part of the LPR measurement process is the sampling and storing of the
potential value. This is accomplished by a digital sample and hold technique with an indefinite holding
capability. On the initiation of a polarization cycle, a pulse triggers the start of a successive approximation conversion performed by U4 and U5. U4 and U5 switch the output of the 12 bit D/A converter
circuit, (U7, AR4-C and AR4-B), using the comparison generated by AR4-D between common and
the output of the instrumentation amplifier, (AR1-A, AR1-B and AR2), unto the output of the instrumentation amp is zero. This is by setting a bias on the reference of the instrumentation amp, SW1-C,
using the output of the D/A converter circuit.
This scheme nulls the instrumentation output to zero so an offset shift of 10 millivolts can be easily read
by the next process step. Upon the completion of this process, an end of conversion signal is generated
by the successive approximation registers. This signal is used to trigger the remaining portion of the
polarization cycle.
If the OFFSET+ or OFFSET- function is selected, the above scheme is bypassed with the reference
point of the instrumentation amplifier, SW1-C, set to common and the output of the instrumentation
amplifier, which reflects the potential difference, is sent directly to the output circuits or, if OFFSET- is
selected, the output is inverted and amplified by AR1-C.
18
Polarization Current Control and Measurement
The circuitry for the polarization current control and measurement resides on the A1 Board and consists
of:
•
A 10 millivolt polarization reference made up from the reference portion of AR3.
•
Current drive and scaling amplifier using the power amp portion of AR3.
•
Polarization balancing amplifier; AR1-D.
•
Current sensing differential amplifier; AR4-A.
•
Solid state current control switching; U1-A and U1-B.
Upon the end of conversion signal generated by the potential sample and hold, the current control is
enabled via SW1-A. U1-B and U1-A are enabled allowing a current path through the cell between the
auxiliary and test electrodes. As current is allowed to flow, the potential of the cell (voltage between the
reference and test electrodes, changes. AR1-D monitors this change, compares it with the 10 millivolt
reference (generated by AR3, R3, R7and R10), and controls the current drive by AR3 until a balance
point is reached where the potential of the cell has changed by 10 millivolts. The 1.82K resistor, R11, in
the feedback loop of AR3 gives a 0.0 - l.0 volt drop for a span of 0 - 100 MPY using the conversion
factor of 5.5 µ/MPY. AR4-A is used as a differential amplifier which converts the 0 - 1 volt drop across
R11 to a 0.0 - 1.0 volt signal which is sent to the output circuitry.
Output Sample and Hold
The output sample and hold circuits are contained on the A2 Board and consist of:
• An infinite term digital sample and hold consisting of a successive approximation ADC
using U13, U14, U18, AR9 and AR8.
• A short term sample and hold using U15-A, AR7 and C13.
When operating in the SAMPLE mode, there is a possibility of 3.5 hour holds between reading updates. This long hold time is accomplished by a second infinite term digital sample and hold.
At the end of a polarization cycle, a conversion is initiated to sample the current amplifier output in the
LPR and SAMPLE modes. During this conversion process, a conversion in process signal is generated
by the successive approximation registers. This signal is used to disable U15-A thus maintaining a short
term sample and hold using C13 and AR7. Once completed, the end of conversion signal reenables
U15-A and triggers the relaxation portion of the LPR cycle. The gain of AR7 rescales the signal to a 1.0
to 5.0 volt signal (with reference to true ground), which is used by the current loop control circuitry.
19
Current Loop Control
The circuitry for the current loop control is contained on the A2 Board and consists of:
• The current loop sense and balancing amplifier; AR5-B.
• The current loop control transistor; Q1.
• The current loop sense network; R23, R24, R25, and R41.
The output of the current loop must be maintained at the desired signal level regardless of the amount of
current drawn in order to power the circuitry. This is accomplished by using the R23 resistor placed in
the loop to develop a voltage drop from -1.0 to -5.0 volts for a current span of 4-20 mi11iamps. At an
output of zero, the sample and hold circuitry is at 1.0 volt (with reference to ground), this voltage is
subtracted from the negative voltage developed by R23 using the R24, R41, and R25 network. AR5-B
senses this difference and biases Q1 until the current loop develops a -1.0 volt drop across R23,
(4mA). At full scale output, the sample and hold develops a 5.0 volt signal thus requiring a 20mA loop
current to balance the circuit.
E. Operation Modes
Offset Mode
A mentioned earlier, the polarization current and the potential null circuitry are disabled when operating
in the OFFSET+ and OFFSET- modes . The reference to the instrumentation amplifier, SW1-C, is set
to the common reference and the output of the instrumentation reflects the cell potential difference. This
value is sent directly to the output sample and hold circuitry in the OFFSET+ mode. If OFFSET- mode
is selected, AR1-C inverts the polarity and amplifies the signal before it reaches the output sample and
hold circuit.
Track Mode
When the TRACK mode is selected, the output sample and hold circuitry is set to run repetitive conversion cycles constantly updating its output on 2.5 second intervals.
20
VI. Calibration Procedure
A. Disassembly
After unscrewing enclosure cover and disconnecting J5 connector, remove interconnected boards A1
and A2 from bracket.
Remove shield by removing nuts and washers from switches SW1 and SW2 and screws Z5 and Z6.
Replace both screws.
B. Equipment Needed
•
•
•
•
•
1 - Adjustable 18 Volt Power Supply
2 - Digital Volt Meters and Leads
1 - Frequency Counter and Probe
1 - Shorting Plug
1 - Spare Lead
C. Applying Power
Connect positive (+) lead of digital volt meter (DVM) to the positive terminal of J3/J6. Connect the
negative (-) lead to positive terminal of power supply. Attach spare lead to negative terminal of power
supply and other end to negative terminal of J3/J6.
Note: While making connections, power supply should be off. The power supply, DVM, and leads will
remain in place during all calibrations.
Turn power supply adjustment all the way down. Turn on power supply and DVM. Set volt meter to
read in the 200 milliamp range. (200.0 mA)
While watching DVM, slowly adjust power supply up to 18 Volts; making sure that the DVM reading
does not exceed 40.0 mA.
D. Frequency Calibration
Connect frequency counter ground to pin 8 on U12 and probe to pin 11 on U12.
Adjust R50 until the frequency read is 2730 Hz ± 1 Hz.
Disconnect frequency counter.
21
E. Zeroing Adjustments
Connect shorting plug to J1. Set switch SW1 to the Offset + position and SW2 to the Track position.
Using the second DVM, connect the positive lead to pin 6 on AR2 and the negative lead to wire on
shorting plug.
Adjust R12 until a reading of 0.0 mV ± 0.1 mV is shown on second DVM.
Move same two leads to pins 2 and 3 on AR7 and adjust R46 until it reads 0.0 mV ± 0.1 mV.
While looking at other (original) meter, adjust R25 until the current reads 4.00 mA.
F. Current Span Adjustment
Replace shorting plug with the instruments meter cable. Insure that 10 MPY prover is still in place.
Hook the positive lead on second DVM to the (A) red position on J1/J5 and the negative to the (B)
blue position on J1/J5. Set meter to read in the 20 mV range.
Set SW1 to the LPR position, SW2 to the Sample, SW3 to 0, SW4 to 0 and SW5 to 4.
Turn off power supply, wait one second and turn it back on. Let instrument sit for one full minute.
Note: During this time, the second DVM will cycle from 0 mV to ~10 mV every 24 seconds.
During the time that the DVM reads ~10 mV, adjust R3 until the meter reads 10.00 mV ± .01mV
exactly. You have 24 seconds to do this before next cycle.
Once R3 is adjusted, observe meter for two more cycles to insure that 10.00 mV ± .01mV is held.
Remove leads from J1/J5. Adjust R45 until original meter reads 5.60 mA.
G. Disconnection
Remove power from power supply and remove all leads.
Replace connectors and instrument shield. Put instrument back in the condition that it was first received.
22
VII. Instrument Testing and Repair
A. Recommended Test Equipment
•
•
•
•
•
•
•
1 - Adjustable Power Supply.
1 - Digital Voltmeter.
1 - Digital Voltmeter with capability of reading current.
1 - Dual channel oscilloscope.
1 - 10 MPY meter prover.
1 - Set of working replacement boards.
1 - Replacement cable and connector assembly.
Note: Unless suitable environment and expertise is available for the testing and repair of sensitive
electronics, it is recommended that component level testing and replacement for this instrument be
performed only by Metal Samples Corrosion Monitoring Systems.
Caution: When instrument is operated in hazardous areas all power to the instrument must be removed
before opening cover. The instrument was designed for easy board access and replacement in the field.
However, it is recommended that all electrical tests be performed in a laboratory or bench top environment.
B. Board Removal
After unscrewing enclosure cover and removing probe and loop current connectors, remove interconnected boards from bracket. The boards should easily slide out from bracket.
C. Electrostatic Shield Removal
Using a 1/16" Allen wrench, remove the knobs from the shafts by loosening the 4 Allen head set
screws. Then remove the two switch mounting nuts using a 3/8" socket wrench. Remove the two
Phillips head screws from the top of the electrostatic shield and remove the electrostatic shield
23
D. Visual Inspection
Carefully separate the boards and inspect the two circuit boards for:
• Signs of overheating or overheated components.
• Short circuits caused by foreign debris.
• Broken or cracked solder traces.
• Corrosion on connector surfaces.
• General corrosion attack to boards or components in general.
• Signs of moisture damage or condensation.
• Tampering or abuse.
Inspect all cable connections and connectors for integrity. If necessary, use a DVM set to read ohms or
continuity to test cables and connectors.
E. Electrical Testing
Carefully reassemble the two circuit cards. For testing or calibration purposes, the instrument can be
operated without the electrostatic shield. However, it is necessary to replace the two screws used to
secure the upper part of the shield. These two points are used for board interconnection of the instrument ground. It will also be necessary to temporarily replace the two control knobs by tightening only
the two set screws used to bind the flat parts of the switch posts.
Connect the spare cable assembly to the connector on the A1 Board. Note that the cable shield need
not be connected for testing purposes. Place a 10 MPY prover on the cable connector. With the power
supply turned off, connect the power supply and the current reading DVM to the A2 Board connector
observing proper polarity. Set the mode of operation to LPR and the output mode to SAMPLE. (Refer
to the labeling on the electrostatic shield). Set the SAMPLE TIME to 00.1 minutes. Turn on the power
supply and observe the current. If the unit functions properly, the current reading should settle out to
5.6mA (± 0.1mA) after 2 to 3 polarization cycles. If the unit malfunctions, one or more of the following
symptoms will appear:
24
1. The unit gives incorrect readings (Error > ±0.1 mA).
2. The unit is erratic or has intermittent operation (Readings fluctuate).
3. The unit draws excessive current (30mA or more).
Isolate the problem to the faulty board by substituting a spare working board and retesting the instrument following the above procedures. At this point, repairs could be considered complete by using the
replacement board. The instrument can now be reassembled, recalibrated, and placed back into service. However, if component level repairs are intended, the following guidelines are intended to help
isolate the cause of the problem.
Incorrect Readings
If the errors are minimal (±2mA), this can usually be corrected by recalibration of the instrument. Follow
the recalibration procedures and retest the instrument. If the instrument cannot be recalibrated then
check the following points:
During a relaxation cycle, the output of the instrumentation amplifier (AR2 pin 6) should be equal to the
common reference point. If there is an error, the problem is in the instrumentation amplifier (AR1-A,
AR1-B and A2) or the operation of the OCP sample and hold circuit (U7, U4, U5, AR4-C, AR4-B
and AR4-D). Be sure to check the sample and hold clock (U12 pin 13) and the triggering signal (U2
pin 1) for this circuit.
Test voltage between J1-B and J1-A for the 10.00 mV offset during a polarization cycle. If there is no
offset, then check the 200mV reference at AR3 pin 1 and the divider output at AR1-12 (~10 mV).
Check the current gate (U1-A and U1-B) and the current enable pulse at U1 pin 6.Also test CR1 and
CR2.
If there is an error in the offset (> ± 1mV) during the polarization cycle, the output of the instrumentation
amplifier (AR2 pin 6) should be ~10 mV, the inputs of AR1-D (pins 12 and 13) should be equal, and
the output of AR3 pin 6 should be ~100 mV. Test the operation of AR1-D, this amplifier controls the
offset voltage by adjusting the current driven by AR3.
Test the operation of the differential amplifier (AR4-A). The output of AR4-A pin1 should be 100 mV.
Test the operation of the long term sample and hold (U13, U14, U18, AR9 and AR8). During a relaxation cycle, the output of AR9 should be 100 mV; same as the input of AR8 pin 3. If there is an error,
check the operation of U13, U14, U18 the sample and hold clock (U12 pin 13) and the trigger pulse at
the end of the polarization cycle (U3 pin 13).
Test the operation of the short term sample and hold (U15-A, C13, and AR7). During the relaxation
cycle, the output of AR7 should be at 500mV. If there is an error, check the operation of the sample
and hold gate (U15) and the hold pulse (U15 pin 13) the hold pulse should only occur during a conversion cycle of U13 and U14.
25
Test the operation of the current loop control circuit (AR5-B and Q1). The inputs of AR5-B pins 5 and
6 should be equal. The voltage drop across R23 will represent the total loop current. The difference
between the voltage drop across R40 and the voltage drop across R23 will reflect the amount of current
required to power the circuitry. This current cannot exceed 4mA.
Erratic or Intermittent Operation
This problem is most often caused by faulty switch contacts. Again, if there is visual evidence of corrosion attack or moisture on the boards, then the switch contacts are most likely damaged. It will be
necessary to replace the switches or the boards.
Check the operation of the power on reset circuit. cycle the power off and on and check the output of
U17 pin 3. There should be a high pulse for one second after the power is applied to the circuit.
Check the operation of the system clock. U16 pin 3 should show a 2750 Hz square wave. This is
divided down to a .1666 Hz square wave by U12 pin 3.
Check the timer circuits (U8, U10, and U11). There should be a pulse each the time the counter
reaches 0 at U8 pin 12 and the counters reloaded with the BCD value of the switch settings.
Check the control circuits. U2-B outputs (pin 13 and 12) will alternate between polarization mode and
relaxation mode upon each countdown of the timer circuits. U3-A controls the current gate (pin 1), U2A controls the OCP sample trigger (pin 1), and U3-B controls the output sample and hold (pin 13)
Excessive Current
This symptom (current > 30mA) is usually caused by a faulty or damaged component which draws an
excessive amount of supply power. Test for a voltage drop across R4.
If a voltage drop appears, current is drawn by the loop control circuit. Test the operation of Q1 and
AR5. Test to see that R23 is not damaged.
If no voltage drop appears, current is drawn by a faulty or damaged component. Check the +V and
+V1 rails. They should be about +6 volts with reference to ground. Also check COM and COM1
these common reference points should be at + 1 volt with reference to ground. If left operating for 30
minutes or more, the faulty component may overheat. If this occurs, the component can then be easily
located and replaced. If not, then the component must be located by substitution or the board replaced.
If the cause of the problem cannot be resolved, send unit back to Metal Samples Corrosion Monitoring
Systems for repair. Use form in the Appendix E of this manual.
26
Recalibration
Once the instrument has been repaired, it should be recalibrated as described by the Calibration Procedure in Section VI.
Replacement
After repairing or replacing boards, interconnect the two boards making sure that the connectors on
each board (probe and loop current) are at the same end and that no pins are bent while inserting.
Replace the shield after removing nuts and washers from switches. Put screws back into boards and
nuts and washers back on switches to secure. Replace knobs on the switches.
Reinsert boards back into brackets with connectors facing out. Insure that the connectors face their
respective access holes in the housing.
Test the instrument using a prover to insure proper operation.
27
VIII. Current Loop Operation and Testing
A. Recommended Test Equipment
• 1 - Portable DVM with the ability to read current.
• 1 -10 MPY meter prover.
• 1 -1K ohm 1/4 watt resistor.
B. Instrument and Loop Verification
With the instrument installed and the wiring for the current loop complete, install the DVM in the current
loop and set it to read current in milliamps. Install the 10 MPY meter prover on the probe cable. Set the
operation switches to LPR and SAMPLE. Set the sample time switches to 00.1 minutes.
The use of the 10 MPY prover insures that there are no ground fault currents caused by a non-isolated
loop during this step of the test procedure.
Power up the loop and observe the current. After 30 seconds, the current should settle out to 5.6
milliamps. If the readings are correct, the operation of the instrument and the current loop are correct. If
the readings are incorrect, test the voltage at the current loop terminals for the minimum specification of
11 volts. If the voltage meets the specification, then it is possible that the instrument needs repair or
recalibration.
C. Probe Element Testing
Set the DVM to read DC voltage in millivolts. Test the Offset Corrosion Potential across the Reference
and Test electrodes (pins A and B on the probe connector). For the MS2500L to operate correctly in
the LPR mode, this offset potential can be no greater than + 200 millivolts and no less than -200
millivolts. If the OCP does not fall within these limits of ± 200 millivolts, it is possible that a Lazaran type
electrode is used for the reference or, the reference and test electrodes are of dissimilar metals. Depending upon the application, this may be the intention of the user if the instrument is Intended to operate only in the OFFSET mode.
28
D. Current Loop Isolation Testing
Disconnect the current loop connections from the MS2500L instrument. Using a clamp or alligator type
connectors, connect one end of the 1K ohm resistor to the probe body. Connect the positive side of the
current loop to the other end of the 1K ohm resistor. With the current loop powered up, read the
voltage drop across the 1K ohm resistor in both AC and DC modes on DVM. In either mode there
should be less than 10 millivolts to indicate a floating loop. Repeat the test using the negative side of the
loop. If the voltage drop is greater, this indicates the presence of a non-floating power supply or the
current loop monitoring device (chart recorder, panel meter, computer inputs, etc.) is of a grounded or
non-floating nature. If this is the case, do not attempt to connect the probe connector to the probe. A
loop isolator or a repeater power supply such as a MTL #2441 must be used.
29
Appendix A: Drawings
1. Assembly Drawings
A1 Board Overlays - 05A122-O
A2 Board Overlays - 05A123-O
Cable Assembly - 8067
Enclosure Assembly - 8068
Dimensional Drawing with Field Wiring - 8103
2. Installation Drawings
MS2500L (IN-3300) Transmitter Installation Drawing - 8102
30
Appendix B: Parts List
B.1 MS2500L
Reference
Designators
Part No.
Description
Quantity
A1
IN2500L-1
Measurement and Control Board
1
A2
IN2500L-2
Loop Control & Timing Board
1
H1
IN2500L-12
Enclosure Assembly
1
CA1
IN2500L-3
Cable Assembly
1
AC1
IN2500L-4
Accessory Kit
1
MN
N/A
Operation / Maintenance Manual
1
37
Appendix C: Effects of Process Variables
1. Temperature
As a general rule, increasing temperature increases corrosion rates. This is due to a combination of
factors: first, the common effect of temperature on the reaction kinetics themselves and second, the
higher diffusion rate of many corrosive by-products at increased temperatures. This latter action delivers
these by-products to the surface more efficiently.
Occasionally, the corrosion rates in a system will decrease with increasing temperatures. This can occur
because of certain solubility considerations. Many gases have lower solubility in open systems at higher
temperatures. As temperatures increase, the resulting decrease in solubility of the gas causes corrosion
rates to go down.
2. pH
Corrosion rates almost always increase with decreasing pH (increasing acidity).
This is a direct result of increasing the concentration of an aggressive ion (H-) and
increasing the solubility of most potentially corrosive products.
3. Oxygen Concentration
Oxygen’s role in corrosion is as an aggressive gas or oxidizing agent. As its concentration increases, corrosion rates increase until the rates of diffusion to the surfaces reach a maximum. The same principles apply to most other oxidizing agents,
such as Cl2, H. Br2.
4. Fluid Velocity
The dependence of corrosion rate on fluid velocity is complex. In general, the
higher the velocity, the higher the corrosion rate. At very low velocities, even zero,
there are diffusion effects that can cause corrosion. As fluid velocities increase
from stagnant to moderate values, the corrosion rates increase. Then, as the limit of
diffusion at a particular temperature is reached, further increases in velocity have
little effect on the corrosion rate. At some point, however, the velocity reaches such
high values that the surface film of the metal begins to be damaged. At these velocities, the corrosion rates resume increasing with the higher velocities.
38
5. Suspended Solids
An increase in suspended solids levels will accelerate corrosion rates. These solids
include any inorganic or organic contaminants present in the water. Examples of
these contaminants include clay, sand, silt or biomass.
Some specific contaminants can interfere with the Linear Polarization corrosion rate
measurement, among these are iron sulfide, and hydrocarbons.
Iron sulfide, in the form frequently encountered in some applications, is electronically conductive. Since the Linear Polarization Technique assumes ionic conductivity between the electrodes, this interferes with the measurements. When significant
amounts of FeS are present in the system, its interference exhibits itself as rapidly
increasing corrosion rates until the maximum full scale (or unreasonably high) level
is reached.
In the opposite way, hydrocarbon contamination of Linear Polarization electrodes
will effect the readings. Usually, hydrocarbon “coating” of the electrodes isolates
them from the electrolyte and from electrical communication with each other. This
results in very low corrosion rate readings.
39
Figure 6. Typical Behavior of Corrosion Rate as a Function of Process Variables
40
6. Electrode Potentials
Corrosion reactions are a combination of oxidation and reduction reactions.
Oxidation is the electrochemical process by which an element or species loses electrons and increases
its valence state. A metal transforming to a metal ion with the simultaneous loss of an electron is an
example.
M
M- + e-
Figure 7. Corrosion Reactions on Iron
Reduction is the electrochemical process by which an element or species acquires one or more electrons, thus reducing its valence. The transformation of hydrogen ions to atomic hydrogen is an example.
H+ + e-
H0
When reactions of these types occur, they never occur in isolation, only in pairs or combination. In fact,
the oxidation process, which produces more electrons, depends on the simultaneous consumption of
those electrons by a reduction reaction. If no reduction reaction is available, no oxidation occurs. In
these cases, the species which undergoes a reduction reaction is called the oxidizing agent.
The quantitative study of oxidation reduction reactions has resulted in two useful concepts:
1.
2.
Oxidation reduction potentials (which apply to elements and compound).
Galvanic series (which applies to alloys in their environments).
41
Oxidation Reduction Potentials
The table below is a listing of some useful oxidation-reduction potentials. These values represent the
thermodynamic tendency for the indicated reaction to occur on a relative basis. All potential values are
compared to an arbitrary value of 0.00 volts which is assigned to the hydrogen oxidation reaction. The
more negative a value, the more likely the reaction will proceed in the direction shown in table. Thus we
see that zinc oxidation
Zn
Zn++ + 2e-
E = -0.763 volts
is more likely to occur than iron oxidation
Fe
Fe++ + 2e-
E = -0.44 volts
which, in turn, is more likely than hydrogen oxidation
H2
2H+ + 2e-
E = 0.00 volts
Some other generalizations drawn from the standard oxidation reduction potential table are:
1. Oxygen is a stronger oxidizing agent than hydrogen ion.
2. Iron is more reactive than lead, copper or silver.
3. Gold is very unreactive.
More Reactive
Reaction
Na
Na+ + eMg
Mg++ + 2eAl
Al+++ + 3eZn
Zn++ + 2eFe
Fe++ + 2eNi
Ni++ + 2ePb
Pb++ + 2eH
2H+ + 2e-
Cu
Cu++ + 2e4OH
O2 + 2H2O + 4e+2
Fe
Fe+++ + e+
Ag = Ag + e2H
Hg2++ + 2e2BrBr2 + 2e2H2O
O2 + 4H+ + 4e2Cl
Cl2 + 2e++
Pt
Pt + 2eAu
Au+++ + 3eMore Noble
42
Eo (volts)
- 2.71
- 2.38
- 1.66
- 0.763
- 0.409
- 0.250
- 0.126
0.00 Reference
+ 0.34
+ 0.401
+ 0.771
+ 0.799
+ 0.905
+ 1.06
+ 1.23
+ 1.36
+ 1.2
+ 1.498
Galvanic Series
The table below is a simple version of the galvanic series of alloys in seawater. Because electrode
(oxidation-reduction) potentials only apply to pure elements and true compounds, another system was
developed to compare the relative reactivity of alloys in an environment. This series has the added
advantage of allowing you to predict the galvanic behavior of certain alloy pairs in an environment.
If a pair of alloys listed in the series are coupled, the alloy higher in the list will be corroded more rapidly
than if it were uncoupled, and the alloy lower in the series will be protected, or corrode more slowly
than if it were uncoupled. The table shows why alloys of aluminum and magnesium are galvanically
coupled to steel to protect the steel. Coupling steel to copper, brass, or stainless steel accelerates the
corrosion of steel.
Active / Anodic
Magnesium
Zinc
Aluminum
Iron / Steel
Lead
Brass
Admiralty
Copper
70-30 Copper Nickel
Stainless Steel (passive)
Noble / Cathodic
7. Common Corrosive Agents
Most, but not all, of the common corrosive agents encountered in industrial waters are gases. The
reactions of importance are:
2H+ + 2e2H
H2
O2 + 4H+ + 4e2H2O
O2 + 2H2O + 4e4OH0
HCO3 + eH + CO3-2
Cl2 + 2e2ClOther corrosive agents occur in industrial waters, although infrequently. Among these are the ferric ion
(Fe+++), sulfide ion (S-2), bromine (Br2), and cupric ion (Cu++).
43
Appendix D: Warranty Information
Metal Samples Corrosion Monitoring Systems warrants that any part of the MS2500L and accessories
which proves to be defective in material or workmanship within one year of the date of original shipment
to Purchaser will be repaired or replaced, at Metal Samples Corrosion Monitoring Systems’ option,
free of charge. This warranty does not cover (1) probe assemblies, (2) items expendable in nature, or
(3) items subject to damage from normal wear, misuse or abuse, or failure to follow use and care
instructions.
All damaged items are to be shipped at Purchaser’s expense to and from Metal Samples Corrosion
Monitoring Systems which shall have the right to final determination as to the existence and cause of a
defect.
The foregoing shall constitute the sole and exclusive remedy of any purchaser of Metal Samples Corrosion Monitoring Systems products for breach of warranty and IS EXCLUSIVE AND IN LIEU OF
ALL OTHER WARRANTIES, EXPRESSED, IMPLIED OR STATUTORY, INCLUDING THE
IMPLIED WARRANTIES OR MERCHANTABILITY AND FITNESS. IN NO EVENT SHALL
METAL SAMPLES CORROSION MONITORING SYSTEMS BE LIABLE FOR SPECIAL OR
CONSEQUENTIAL DAMAGES, OR FOR ANY DELAY IN THE PERFORMANCE OF THIS
WARRANTY DUE TO CAUSES BEYOND ITS CONTROL.
Orders or request for additional information should be addressed to:
Metal Samples Corrosion Monitoring Systems
P.O. Box 8
Munford, AL 36268
Telephone: (256) 358-4202
Fax: (256) 358-4515
The technical information and suggestions contained herein are believed to be reliable, but they are not
to be construed as warranties since conditions of use are beyond our control.
Shipping Address
Metal Samples Corrosion Monitoring Systems
152 Metal Samples Road
Munford, AL 36268
Telephone: (256) 358-4202
Fax: (256) 358-4515
44
Appendix E: Maintenance and Repair Instructions
This form may be photocopied for use when returning instruments to Metal Samples Corrosion
Monitoring Systems for repair. Please fill in all known information. Enclose a copy of the filled in form
with the instrument.
1. Check one:
Repair this instrument under warranty.
Repair this instrument regardless of problem or cost of repair.
Inspect the instrument and advise the customer of the approximate cost of repairs if the
instrument is not covered under warranty. (Note: This procedure may delay the return of the instrument to you.)
2. Instrument Identification:
Instrument Model #
Serial #_________________
Date and Location of Purchase_____________________________________
Company’s Purchase Order # for Original Sale_________________________
3. Return the Instrument to:
Company Name ________________________________________________
_____________________________________________________________
Address/Location ______________________________________________
____________________________________________________________
Telephone Number:___________________________________
4. Description of Trouble: (a clear description of the problem may shorten repair
time)_______________________________________________________
___________________________________________________________
___________________________________________________________
5. Urgency of Repairs: ___________________________________________
___________________________________________________________
___________________________________________________________
45