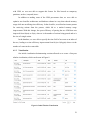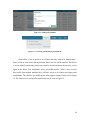
1
NavPro: Network Analysis and Visualization using Provenance Data A Major Qualifying Project submitted to the Faculty of Worcester Polytechnic Institute in partial fulfillment of the requirements for the Degree of Bachelor of Science in Computer Science by Christopher Botaish Michael Calder Date: October 16th, 2014 Sponsoring Organization: MIT Lincoln Laboratory Project Advisors: Professor George Heineman, Advisor This report represents work of WPI undergraduate students submitted to the faculty as evidence of a degree requirement. WPI routinely publishes these reports on its web site without editorial or peer review. For more information about the projects program at WPI, see http://www.wpi.edu/Academics/Projects. This work is sponsored by the Assistant Secretary of Defense for Research and Engineering under Air Force Contract FA8721-05-C0002. Opinions, interpretations, conclusions and recommendations are those of the author and are not necessarily endorsed by the United States Government. Approved for public release; distribution is unlimited. Abstract The goal of this project is to develop a tool and framework that will allow forensic analysts to leverage provenance data when investigating cyber crimes. The solution supports data collected by an existing in-development provenance-aware operating system, and is extensible so that other sources can be used in the future. The product processes live-recorded data, analyzes it internally, and presents a visualization of the data that users can navigate through in an organized way. 1 Acknowledgements Without the help of certain individuals and organizations, the completion of this project would not have been possible. First, we would like to thank Worcester Polytechnic Institute and Professor Ted Clancy for presenting us with the opportunity and arranging transportation to Lexington every day. Additionally, we would like to thank Professor George Heineman for advising our project and challenging us to make the project as successful as it was in the end. We would also like to thank Lincoln Laboratory for providing us with the resources to complete the project in the time we were given, as well as giving us valuable experience working in the cyber security industry. Thank you Jeff Diewald for working so closely with us on the project and providing us with guidance in all of the challenges we faced. Thank you Tom Moyer for helping us solve some of the most difficult issues the project presented and for always being enthusiastic about the work. Finally, thank you Nabil Schear for all of your support and for being an encouraging resource throughout the duration of the project. 2 Executive Summary As the importance of cyber security increases in organizations with sensitive data, network administrators and forensic analysts need stronger tools to keep up with cyber criminals. Data provenance is the history of a system’s activity, commonly collected as a series of low-level actions and stored locally on the machine. While this data is large and does not aid analysts in its raw form, it has the potential to be processed and presented in a way that allows an observer to derive meaning. The goal of this project was to produce a tool and framework for organizing, interpreting, and visualizing provenance data. This involved allowing a user to navigate through the data in order to understand a cyber attack without knowing all the details of the incident. There was already a provenance-aware operating system in development that can collect these low-level actions, but there was no central mechanism to store the data and process it. This problem led to the creation of the Network Analysis and Visualization using Provenance Data (NavPro) framework. NavPro consists of a classification server and a web application servlet. The classification server receives data from all provenance-aware machines on a network, processes the raw data, and normalizes it to a common format so that it can be organized in a database. The web application servlet queries the database so that it can produce visualizations of the data and allow a user to navigate through those visualizations to establish meaning in the events. The NavPro framework is extensible in that it allows plugins to be written for different data sources and operating systems. It also provides APIs that abstract databasespecific functionality so that different databases can be used to store provenance data in the future. The final product is cross-platform and can be deployed in an automated way on Mac OS X and Linux operating systems. 3 Table of Contents 1 Introduction ................................................................................................................... 9 1.1 Data Provenance .................................................................................................... 9 1.2 Project Scope ....................................................................................................... 10 2 Background ................................................................................................................. 11 2.1 Information Security ............................................................................................ 11 2.2 Security in Linux.................................................................................................. 11 2.2.1 Classic Operating System Access Rights ..................................................... 12 2.2.2 SELinux ........................................................................................................ 12 2.3 Cyber Threat Sources ........................................................................................... 13 2.4 Provenance ........................................................................................................... 14 2.4.1 Collection ...................................................................................................... 15 2.4.2 Encoding ....................................................................................................... 15 2.4.3 Storage .......................................................................................................... 16 2.4.4 Analytics/Visualization ................................................................................. 16 2.4.5 Security ......................................................................................................... 17 2.4.6 Linux Provenance Modules (LPM) .............................................................. 17 2.5 Visualization ........................................................................................................ 17 2.6 Analytics .............................................................................................................. 19 2.7 Technologies ........................................................................................................ 20 3 Methods....................................................................................................................... 23 3.1 Project Preparation ............................................................................................... 23 3.2 Classification........................................................................................................ 25 3.2.1 Retrieving Provenance Information .............................................................. 26 3.2.2 Parsing Raw Data.......................................................................................... 27 3.2.3 Normalizing Actions ..................................................................................... 27 3.3 Database ............................................................................................................... 29 3.3.1 Technology Comparisons ............................................................................. 29 3.3.2 Database Schema .......................................................................................... 30 3.3.3 Java Database Interface Architecture............................................................ 32 3.4 Interpretation ........................................................................................................ 33 4 3.4.1 Server-Side Query API ................................................................................. 33 3.4.2 Client-Side Web Application ........................................................................ 34 4 Results ......................................................................................................................... 36 4.1 NavPro Product .................................................................................................... 36 4.1.1 Data Analysis ................................................................................................ 36 4.1.2 Visualization ................................................................................................. 38 4.1.3 User Features ................................................................................................ 41 4.2 Additional Outcomes ........................................................................................... 45 4.2.1 Scenarios ....................................................................................................... 45 4.3 Evaluation ............................................................................................................ 46 4.3.1 Requirements ................................................................................................ 46 4.3.2 User Study..................................................................................................... 47 5 Discussion ................................................................................................................... 49 5.1 NavPro Future Development ............................................................................... 49 5.1.1 New Visualizations ....................................................................................... 49 5.1.2 Advanced Filtering........................................................................................ 50 5.1.3 Added Security.............................................................................................. 50 5.2 Addressing LPM Limitations............................................................................... 51 5.3 NavPro Deployment Potential ............................................................................. 52 6 References ................................................................................................................... 53 7 Appendix A – Parsers and Normalizers ...................................................................... 55 7.1 Parser API ............................................................................................................ 55 7.2 Normalizer API .................................................................................................... 55 7.3 Parsing LPM Binary Data .................................................................................... 55 7.4 Normalizing Parsed LPM Actions ....................................................................... 57 8 Appendix B – Database APIs ..................................................................................... 58 8.1 Knowledge Cache API ......................................................................................... 58 8.2 User Database API ............................................................................................... 58 8.3 Events Database API............................................................................................ 59 9 Appendix C - Visualizer Query API ........................................................................... 61 9.1 GET Queries ........................................................................................................ 61 5 9.2 POST Queries ...................................................................................................... 64 10 Appendix D – NavPro Extension Developer’s Guide ................................................ 67 10.1 Sending Data To NavPro ................................................................................... 67 10.2 Writing A NavPro Parser ................................................................................... 67 10.3 Writing A NavPro Normalizer ........................................................................... 69 10.4 Using A Database Other Than MySQL ............................................................. 70 11 Appendix E – NavPro Deployment Guide.................................................................. 71 11.1 Deployment Directory Layout ........................................................................... 71 11.2 Configuring NavPro ........................................................................................... 71 11.3 Deployment on Mac OS X................................................................................. 74 11.4 Deployment on Linux ........................................................................................ 74 11.5 Deployment on Windows .................................................................................. 75 11.6 Creating Future Deployments ............................................................................ 75 6 Table of Figures Figure 1: Data provenance relationships as defined by OPM [3] ..................................... 15 Figure 2: Internet map visualization [12].......................................................................... 19 Figure 3: Data storage hierarchy for BigTable ................................................................. 21 Figure 4: D3.js visualization examples ............................................................................. 22 Figure 5: NavPro Architecture .......................................................................................... 24 Figure 6: Project Timeline ................................................................................................ 25 Figure 7: AJAX Request Architecture .............................................................................. 35 Figure 8: Initial Tabular Visualization .............................................................................. 38 Figure 9: Chart Based Visualization ................................................................................. 39 Figure 10: Filter User Interface......................................................................................... 40 Figure 11: Filters and Charts............................................................................................. 40 Figure 12: Chart Visualization with Table Visualization ................................................. 41 Figure 13: Viewing Table Cell Details ............................................................................. 41 Figure 14: Profile Selection .............................................................................................. 42 Figure 15: Profile Dropdown ............................................................................................ 42 Figure 16: Adding a Bookmark ........................................................................................ 43 Figure 17: Accessing and Removing Bookmarks ............................................................. 43 Figure 18: Modifying Alert Trigger Settings .................................................................... 44 Figure 19: Alert Notifications Dropdown ......................................................................... 44 7 List of Tables Table 1: Classic Linux Permissions [27][28].................................................................... 12 Table 2: Knowledge Cache Schema ................................................................................. 30 Table 3: Users Table Schema ........................................................................................... 31 Table 4: Bookmarks Table Schema .................................................................................. 31 Table 5: Alerts Table Schema ........................................................................................... 31 Table 6: Notifications Table Schema ................................................................................ 32 Table 7: Event Table Schema ........................................................................................... 32 Table 8: Event Types Table Schema ................................................................................ 32 8 1 Introduction In the modern world, organizations have become dependent on computing and networking technologies. With operations and intellectual property residing exclusively in the digital world, cyber security has become vital. Increasingly, motivated attackers have sought to access internal networks to steal confidential information and compromise operational integrity. In this landscape, companies must use strong security measures and vigilance to prevent cyber attacks. Because cyber attack methods constantly evolve, not all threats can be prevented. In these cases, the ability to perform quick and effective forensic analysis on a system can provide crucial details about the mission impact of an attack and help orchestrate an appropriate response. 1.1 Data Provenance Data provenance provides one potential forensic outlet. Provenance is the “history of an object, either physical or digital” [1]. Many fields, such as fine art, use provenance to track the history of an artifact over time. In computing, data provenance helps answer questions about the integrity and confidentiality of data. These answers are an important step in the forensics process. A system that supports data provenance can be broken into five components [1]: • Collection – The method through which the data provenance is gathered. • Encoding – The format with which the data provenance is represented. • Storage – The method and form of storage used to persist the data provenance. • Analytics/Visualization – The tools used by a human operator to understand data provenance. • Security – The measures taken to ensure the integrity, confidentiality, and availability of data provenance. Many of these components have been extensively studied in the research literature and solutions have been proposed. Linux Provenance Modules (LPM) is one such solution that focuses on these aspects of data provenance for the Linux operating system [5]. However, it is difficult for humans to make sense of this data without effective 9 analytic and visualization solutions. Provenance data can be overwhelmingly large and difficult for a human to understand. 1.2 Project Scope The Network Analysis and Visualization using Provenance Data (NavPro) framework will help analysts explore and investigate cyber attacks by satisfying the following base requirements: • NavPro will be accessible through a web browser. • NavPro will allow a user to input Linux Provenance Modules (LPM) HiFi data. • NavPro will allow a user to view activity performed on (or by) an entity (user, process, or file). • NavPro will simplify provenance data from system calls to readable actions. • NavPro will allow a user to search for activity based on different types of entities. • NavPro will be deployable in an automated way. If time and resources allow, this project will additionally fulfill the following requirements: • NavPro will have the capability to accept provenance data from different data sources, operating systems, etc. through an extensible plugin system. • NavPro will allow a user to monitor a network of computers from the web application. • NavPro will allow a user to view activity performed by a specific host in a network. • NavPro will allow backward and forward navigation through visualizations. • NavPro will allow a user to export the raw data from a table or chart visualization based on the current filter set. • NavPro will allow a user to set alerts for entities (hosts, users, processes, files) and be alerted when an event occurs involving that entity. 10 2 Background 2.1 Information Security Information Security (InfoSec) is the practice of protecting information from unauthorized access or modification [21]. A common way to describe information security is that it seeks to assure three principles, known as CIA principles [22]: • Confidentiality – Information is only accessible by those who are authorized to access it. For example, classified information is only accessible to those with the proper clearances and need-to-know. • Integrity – Information is only modifiable by those who are authorized to modify it. For example, an attacker cannot add a new account to the /etc/passwd file. • Availability – Information is always accessible to those who are authorized to access it. For example, an attacker cannot reduce the availability of a service through a Denial of Service (DoS) attack. The tenets of information security are at the core of cyber security, with many solutions addressing a subset of the CIA assurances. Traditional operating system permissions systems ensure the confidentiality and integrity of data by limiting read, write, and execute privileges. Services such as CloudFlare attempt to thwart DoS attacks and ensure availability [25]. While these solutions work at the prevention level, data provenance allows analysts to understand which principles were violated after a cyber attack has occurred. A system administrator can use data provenance to determine the information an attacker accessed, and show where data has been leaked and confidentiality has been violated. Likewise, by seeing what information an attacker modified, data provenance can show where data has been corrupted and integrity has been violated. 2.2 Security in Linux There are two main components to security in the Linux operating system: classic Linux access rights and Security-Enhanced Linux (SELinux) policies [23]. 11 2.2.1 Classic Operating System Access Rights The classic operating systems concept of access rights refer to the read-write- execute permissions system used to define what a user or group can do with a file. Every file and directory contains a set of permissions that can be expressed with three octal digits. The first digit is for the owner of the file, the second is for the group the file is assigned to, and the third is for all other users [28]. Each octal digit is a three-bit value between 0 and 7, where the rightmost bit indicates execute permissions, the middle bit indicates write permissions, and the leftmost bit indicates read permissions. For example, the permissions value 163 translates to -‐-‐xrw-‐-‐wx, or that the owner can only execute, the group can read and write, and other users can write and execute. The mappings between each number and the corresponding permissions can be seen in Table 1. Number Permission rwx bits 7 read, write, and execute 111 6 read and write 110 5 read and execute 101 4 read only 100 3 write and execute 011 2 write only 010 1 execute only 001 0 none 000 Table 1: Classic Linux Permissions [27][28] 2.2.2 SELinux SELinux is a set of Linux kernel patches originally developed by the National Security Agency and merged into the mainline Linux kernel in August 2003. SELinux provides Linux support for access control security policies, including the Department of Defense’s mandatory access controls (MAC) [23]. MAC controls what a process or thread can do on a system by limiting access to targets such as files, directories, ports, memory, or devices. In essence, MAC provides sandboxing for processes, containing the 12 damage that can be caused in an exploit by forbidding the process from accessing targets outside of itself and its resources. SELinux implements its access control security policies at the lowest system call level. When basic functions such as link, inode_alloc, or inode_dealloc, are called, SELinux checks its policies to see if the call is allowed. A subset of where SELinux performs its policy checks can be seen in the Hi-Fi system [7]. Provenance data collection mechanisms can leverage the location where SELinux performs its policy checks to collect its provenance data. By collecting data after SELinux performs its checks, these mechanisms can ensure that the system calls were actually executed and not stopped due to policy violations. This allows the capture of all major events that have actually occurred within a system. 2.3 Cyber Threat Sources Cyber threats to an organization can take many different forms and come from numerous sources. Currently, the greatest source of cyber threats is external intruders, or hackers, that seek to gain access to a system [30]. The goals and motivations of external intruders can vary greatly, but in general external intruders are attempting to violate information security principles [21]. These intruders often gain access to a network through unpatched and exploitable software [29]. Once on the network, these intruders work to secure a reliable access point. External intruders can often be detected through their entry point to the network, but the impact of what the intruder has done on the system is not easily understood. Malware attacks represent one way that external intruders seek to gain access to an organization’s networks. Malware has evolved in recent years from being a way to satisfy curiosity into a source of “illicit financial gain” [29]. This shift has led to increased malware production – in 2010 alone, over 280 million new malware variants were detected by Symantec [29]. A key way that malware gains access to a system is through tactics that target internal individuals, such as spear phishing. Spear phishing is the practice of creating targeted, personal emails that aim to trick a target into downloading and running malicious code [24]. Spear phishing represents a major threat and source of weakness of organizational networks [29]. The symptoms of malware are often easily identified 13 through the detection of system file modification. Once detected, however, it can be difficult to deduce where the malware entered the system, information that is vital to crafting an effective response and ensuring the security of the system. As malware becomes more profitable, and therefore more pervasive, it will continue to be a growing problem that organizations must confront. The second largest source of cyber threats is insider threats, which can come in the form of current or former employees and contractors of an organization [30]. The types of insider threats vary: an insider threat can be malicious, such as a user trying to steal information from an organization, or benign, such as a user that unknowingly uses an infected USB drive on organizational equipment. In both of these scenarios, an insider threat is an individual who, whether maliciously or not, violates information security policies put in place by the organization. 2.4 Provenance Provenance, a term commonly associated with fine art, is the history of an artifact. Many pieces of art have records to indicate their chronology of ownership, allowing collectors to confirm their authenticity. Data provenance takes this same concept and applies it to computational systems and artifacts. On a provenance-aware machine, records of interactions between users, processes, sockets, and files are stored so that an observer can understand what actions left the computer in its current state. Figure 1 visualizes the relationships between these entities. 14 Figure 1: Data provenance relationships as defined by OPM [3] The responsibilities of systems that implement computer provenance can be broken down into five steps: [1] 2.4.1 Collection During this step, a system is responsible for collecting the raw information that will form the basis of the data provenance. There are many research projects that study different mechanisms for collection of provenance. One example is PASS, which involves modifying a file system to record activity [6]. Also, modifying the Linux kernel (like Hi-Fi does) can allow low-level system calls to be tracked [7]. Databases can also be provenance-aware; Trio is an example [8]. The main concern with collection regards scalability, and each of these solutions has their own unique methods to minimize the amount of data collected. 2.4.2 Encoding Once raw information has been captured, the provenance system must properly encode the information for processing. Decisions need to be made about what metadata comes along with each event that is encoded, such as whether a timestamp is included or if host/user attributes should be noted. Each collection system typically proposes its own encoding based on what information is collected. 15 The only provenance encoding standard still being updated is W3C PROV, while PASS provides its own specification and OPM has been used but is no longer active (last updated in early 2013) [2][3]. 2.4.3 Storage On any given machine running a modern operating system, thousands of actions occur every minute even when the user is not actively working. Because of the vast amounts of data that is collected, storing this data in an efficient way can be extremely difficult. While some research has been done to minimize the amount of storage required for provenance data, any mechanism that involves keeping the data on the machine where it is collected can create performance and memory overheads [9]. There is no standard way to determine how to store provenance data; many different options have been attempted. Storing data in an SQL database allows encoded provenance actions to be sorted into tables based on the type of information they contain. If the collected data is all in the same format, a NoSQL database could provide more scalability. To prevent memory issues on the client, data can be sent off to a central server that stores the database of events in the cloud. All of these methods provide different tradeoffs that need to be considered. 2.4.4 Analytics/Visualization An area where very little success has come so far is the analysis and visualization of provenance data. While possessing the data creates the potential to perform forensic analysis of malicious computer activity, searching through and interpreting the data presents a significant challenge. The reason almost no work has been done in this area is because big data visualization can be complex when each action alone can represent significant activity. While visualizations such as heap maps can make the density of action types understandable for a human operator, navigating through these visualizations to extract meaningful data can be difficult. Using analysis to simplify the data prior to the visualization stage may be a path to solving this problem, but such an avenue has not yet been explored. 16 2.4.5 Security The final responsibility of data provenance is that everything must be collected securely. When it comes to provenance data, a “secure” collection method has been defined as being tamperproof, simple to verify, and providing complete observation [4]. 2.4.6 Linux Provenance Modules (LPM) Recently, a framework for developing provenance-aware systems was created; this framework is called Linux Provenance Modules [5]. LPM is able to leverage Linux’s existing security features to provide strong provenance security guarantees. This can be accomplished by inserting data-collecting hooks after the existing security hooks SELinux has in place. This means that as an interpreter of the data, an analyst can be confident that permission or policy issues did not later block any recorded actions. One of the current provenance collection implementations built on LPM is a version of Hi-Fi that outputs the data collected in the kernel to a relay buffer that can be removed by a process in user space at any given time to encode and store the data. This data indicates what kernel-level system calls were executed since the relay buffer was last emptied. Each data message also contains enough information to associate the call with a user, process, and possibly a file as well. While there may be other provenance-aware systems that use LPM over the next few years, the framework is currently a work in progress and research is still being done to further enhance LPM's abilities. 2.5 Visualization The field of Computer science visualization can be subdivided into six different sub-fields [10]: • Information visualization • Interaction techniques and architectures • Modeling techniques • Multi-resolution methods • Visualization algorithms and techniques • Volume visualization 17 For this project, we will focus on information visualization, where the information displayed consists of the actions that represent computer activity collected by provenance-aware systems. Information visualization takes advantage of the innate ability of humans to see and understand large amounts of information rapidly. Information visualization focuses on “the creation of approaches for conveying abstract information in intuitive ways [11].” Although the observer interprets the data being presented, the visualization system is only attempting to display the data in a way that can be understood. The collection mechanism is responsible for obtaining data that can be used to derive meaning, and the analysis mechanism is responsible for deriving meaning from the visualization of the data. The visualization’s responsibilities do not stretch beyond the presentation of the information. In addition to having data points in a visualization represent actions over a period of time, information visualizations can also show relationships between data assuming the collection mechanism provides that data as well. One example of this strategy applied in visualization is the Internet map visualization in Figure 2. This visualization uses the length of lines between two nodes to represent the delay between two IP addresses, where each node represents a single IP address. 18 Figure 2: Internet map visualization [12] Another feature that can be utilized in information visualization is interaction. If a graph or chart allows entities to be selected in such a way that navigation occurs, the user experience can potentially be enhanced. This technique becomes most practical when the data being visualized is extremely large. A common result of making visualizations interactive is that many more types of data presentations occur. In addition to letting an analyst zoom in on a particular part of the initial display, the way the data is presented can morph into different visualizations as the user navigates through it. This concept of a human manipulating a visual representation of data leads into the subject of visual data analysis. In the overall flow of information the visualization is the tool used to perform the analysis. The analysis is where meaning in the data is finally established. 2.6 Analytics While analysis is often perceived as a part of or synonymous to visualization, it is a significantly different aspect of data interpretation. While the two are often performed together in the process, neither one is a part of the other. Visualization can allow for analysis, while analytics can drive visualization. 19 With regard to provenance data, analysis must occur both before and after data visualization. After the raw data is collected, processing needs to be done before storage that cuts down the amount of information that needs to be visualized. Without this step, the size of the data is too large to produce meaning. Common methods used to perform this reduction include record matching, deduplication, outlier detection, and column segmentation [13]. After visualizations have been generated, analysis of frequency counts and associations can be used to establish meaning. The main goal of big data analysis is to establish patterns in small actions that represent larger actions. In the case of provenance data, this is a result of having the data collection mechanism record all activity on a system. 2.7 Technologies While the collection mechanism for the provenance data is already in place for this project, many different technologies can be leveraged for encoding, storage, analytics, and visualization. First of all, the current list of cross-platform programming languages that provide strong object-oriented extensibility is limited. The most popular is Java, which can be run on any modern operating system because it is run inside the Java Virtual Machine (JVM) and lacks kernel-specific dependencies by nature [14]. Because LPM data is collected as binary data, we leverage an existing parser written in C using the Java Native Interface (JNI) [15]. While JNI has a bad reputation for causing large development costs to manipulate Java objects in C, passing strings between the two languages is not difficult and allows encoding and decoding of data to be performed without having to inspect each byte received in Java code. As far as data storage is concerned, there are many options available. A simple solution that is more practical as an initial data store is MySQL [16]. The open source relational database allows batch scripts to be used to store data quickly and leverages the SQL language to provide simple querying. As the data gets larger over time, this may become an impractical solution. A common solution to the storage scalability problem is to leverage a NoSQL database, one of the most common being Accumulo [17]. This is effectively a key/value 20 store that is much more scalable than MySQL and can have strong performance with big data. The scalability is accomplished by leveraging Google’s BigTable, a distributed storage system published in 2006 [18]. The implementation uses a three-level hierarchy depicted in Figure 3. More details can be found in [18]. Figure 3: Data storage hierarchy for BigTable Once the data is stored and can be queried, visualizations need to be produced. d3.js, a popular JavaScript library, allows visual elements to be tied to large datasets and be intuitively manipulated in a web browser [19]. The library is open source and welldocumented. Examples of visualizations created by d3.js can be seen in Figure 4. 21 Figure 4: D3.js visualization examples While the visualizations used to display provenance may be less complex in the final product, it is clear even at a quick glance that D3.js is powerful enough to handle any data we may present it with. Finally, to tie these visualizations together a front-end framework will be needed to effectively allow the user to navigate the web application. The most common technology used to accomplish this is called Bootstrap [20]. This framework provides quick front-end implementation that a project as short on time as this one will need. Many of the technologies discussed in this section are the most common and welldocumented frameworks used to accomplish their respective purposes. It is important to select easily leveraged technologies so that the majority of our short time for this project is not spent on learning unnecessarily complex tools and languages. 22 3 Methods In this section we begin by discussing our initial steps in preparing for the project. This involves how we defined our requirements, how we decided on measures for success, and how we designed our initial architecture. We then break down that architecture into each of its major components and explain the significant choices we made at each step. Additionally, we discuss how each component contributes to the usefulness of NavPro from a user/developer point of view. 3.1 Project Preparation In our first week at Lincoln Laboratory, our objective was to read through all of the documentation we could find, including research papers we were given, to learn the current state of provenance data research and understand the scope of our project. We found ourselves speaking with experts in big data, visualization, and computer forensics. This effort helped us define the concrete requirements for the project. We started by identifying a core set of user stories to capture the essential features of the project [26]. To increase the effectiveness of these user stories, we created a user persona to represent the actor in the user stories. To learn more about how to create a realistic user persona, we worked closely with Jeff Diewald (Group 58), who had significant experience with the subject. With his help, we created Carl the Network Administrator. Carl is 35 years old and has a Bachelor’s degree in Management Information Systems. He has a wife and two kids, and is familiar with data provenance but is not an expert in the field. His career goal is to be more successful at his job so that he can provide a bright future for his family. Carl knows that he can use data provenance to be more effective at his job and impress The Boss, but he needs a tool that allows him to intuitively interact with and understand the data. When his coworkers come to him looking for help investigating a cyber threat, he is usually looking to view activity involving a specific host, user, process, or file. Using this persona along with the different kinds of common cyber threats discussed in the background, we were able to create the lists of requirements for NavPro that depict its baseline features, reasonable outcomes, and future direction. 23 With the user persona in place, we then designed the overall architecture of the project. We knew the tool had to provide an extensible framework so that any provenance data source could be used. Additionally, we knew that the user needed to interact with the tool through a web browser. When thinking about the different responsibilities NavPro needed to have, we broke it down into three major components: classification, database, and interpretation. The data retrieved from provenance-aware systems would be sent to our classifier, which would use the appropriate parser to extract the system calls and their arguments from the raw data. Once those system calls were turned into human-readable actions by the appropriate normalizer; they would be stored in the database so that they could be queried and visualized for interpretation as seen in Figure 5. Figure 5: NavPro Architecture Finally, we organized a timeline that depicted our plans regarding development and paper work. We realized early that the interpretation would require the majority of out development time, so we made sure to allocate the most time for that part of the product. The work for the paper was also very spread out so that we did not have to end 24 up rushing to finish it toward the end of our time at Lincoln Laboratory. The full timeline for our project is shown in Figure 6. Figure 6: Project Timeline 3.2 Classification The classification component of NavPro turns raw provenance data into objects that can be queried and visualized by the web application. The raw data may be binary data, strings, serialized data, or any other format future provenance-aware systems may use. Because we did not know all of the possibilities during the timeframe of the project, we needed to provide a flexible way to accept data from different sources. To do so, we created a parser “plugin pool” that is a directory the classifier observes at runtime; it automatically loads any new parsers/normalizers that are placed in the plugin directory both at startup and during execution. This allows the server to always be running, even when new hosts are being added to a network that collect provenance data in a different format. Similarly, we created a plugin pool for normalizers, which take the system calls and their arguments (turned into action objects by a parser) and analyze them to create human-readable user activity. Examples of these activities include creating a file, 25 changing a file’s permissions, and sending data through a network. The full parser and normalizer API can be seen in Appendix A – . Because the server may receive data from thousands of hosts, it uses multithreading to retrieve and process data. We also designed the parser and normalizer interfaces so that they iterate through one action at a time. Originally, we were processing the data in the chunk sizes they were sent in, but we quickly noticed that this could cause memory concerns. To prove that our design is effective, we created our own normalizer and parser for LPM data. The only provenance-aware system we were provided with by Lincoln Laboratory was a virtual machine running LPM, so we needed to collect its data and write a parser and normalizer specific to its data [5]. 3.2.1 Retrieving Provenance Information The LPM kernel allows provenance data to be collected by storing it in a “relay buffer” that a daemon can access at any time. For our server to retrieve this data, we needed to develop a daemon that would run on this Linux machine and forward all of the provenance data to our server. We create a daemon, called “sprovd”, to poll this relay buffer every five seconds, create a connection with the NavPro server, send all the data it read, and close the connection. It was necessary to poll so frequently because the kernel would crash and stop collecting data if the buffer overflowed. With default settings, the buffer had a capacity of 64MB. Because there may be many different data sources that require unique parsers and normalizer to be classified, we needed to make sure the data source identified itself so that the right plugins could be selected. To solve this problem, we designed a protocol that all NavPro input sources must conform to. The messages the NavPro server expects begin with a string identifier ending with a null character, such as “LPM HiFi”. This is followed by a string hostname ending with a null character. Finally, the raw provenance data is sent. All parsers and normalizers are required to implement a boolean method canProcess(String s) that takes in the string identifier and tells the classifier whether it knows how to process the given input source. The classifier uses the hostname to 26 guarantee to that all provenance events are received in chronological order, allowing multi-system-call actions to be derived. 3.2.2 Parsing Raw Data For LPM, the raw data is binary C structs (defined in Appendix A – ) that cannot easily be manipulated in Java. We were provided with a C program pcat that translates these C structures into strings. To reduce development costs, we leveraged pcat instead of writing reinventing the wheel. With that said, we did not want to add any processing overhead to the client machines collecting the provenance data, so we decided to use this program code in our LPM parser plugin. To effectively leverage this code, we needed to use the Java Native Interface (JNI). This is accomplished by receiving the input stream from the classifier, loading in a library (contained in the JAR) that has the C code, calling the methods through JNI and storing the string response. Once the input source for the parser is successfully set, a classifier thread begins asking it for one system call at a time from the raw data. The LPM parser iterates over the string (throwing away the parts it has processed) and sends an object representation of a system call back to the classifier so that it can be normalized. Once the parser runs out of actions it will notify the classifier so that it can start the next thread to process more events from the host sending LPM provenance data. 3.2.3 Normalizing Actions One of the biggest challenges of this project was converting operating system API calls into human-readable actions. There was very little documentation explaining what the data meant at a low level, and none explaining what it meant at a high level. Once we were able to connect our server to our VM running the LPM kernel, we started recording what system calls were invoked (with what parameters) when we stepped through simple actions like creating and deleting files. When looking through the thousands of calls per second we were receiving, it was nearly impossible to tell which calls were caused by our actions. An example of one of these system calls is link. This function makes a hard link to a specified inode in the file system. The arguments only contain the inode, the inode of 27 the containing folder, and the new name for the hard link. Alone, these parameters tell us nothing that a network administrator would care about. Inode numbers are reused constantly and knowing a filename does not give enough context to derive a full path for the file involved. We do not know what user created this hard link, what file was executed to do so, or whether this is the first hard link to the inode. We ended up creating a “knowledge cache”, which is effectively a persistent hash map that normalizers can use to store what they currently know about a given host. This allows us to associate user IDs with usernames, usernames with processes, inodes with file paths, and much more metadata we can use to derive meaning from these actions that alone contain very little information. As we were slowly able to combine our use of the knowledge cache with our understanding of what each system call did, we defined high-level user actions to insert into the database so that they can later be searched and visualized. These human-readable actions include (see Appendix A – for the resulting derivations of each of these actions): • create a file • delete a file • access a file o read from a file o write to a file o execute a file • change file permissions • send data on a socket • receive data on a socket Every one of these actions has a host, user, process, and file associated with it that are understandable for someone who is not familiar with provenance data. The host is the computer hostname, the user is the username, the process is the file executed that caused the action, and the file contains the full path to its hard links at the time. Every event also has a timestamp to keep its time context in the database. Having objects structured this way in the database allows them to be easily queried based on what the network administrator knows entering his forensic analysis process. 28 3.3 Database Once the provenance data is classified into discrete events, it needs to be stored in a queryable form for later analysis. This is accomplished by leveraging a database management system alongside a set of our own Java interfaces that work with the database. By storing the events in a database, we can craft performant queries that allow us to quickly present the data in a visualization that empowers the user to derive meaning from the provenance. This section will elaborate on the reasoning behind our decisions regarding provenance events storage, as well as an overview of the architecture that powers the querying structure of NavPro. 3.3.1 Technology Comparisons The database technology that was chosen to power NavPro was MySQL, a popular open source relational database that implements the Standard Querying Language (SQL) [16]. MySQL has the benefit of being well documented and supported through a vibrant development community. It also has the capability to scale while maintaining high performance. Above all, MySQL is a solution that we are familiar and comfortable with. In such a short development timeframe, it is important to rely on technologies that are easily deployed to fulfill the requirements of the project in a timely manner. Alternatives to MySQL that were explored include other SQL databases and alternative NoSQL systems. Potential competing SQL databases are PostgresSQL and Oracle. These databases have benefits, drawbacks, and intricacies of their own, but overall operate on the same premise as MySQL. Due to this, it made sense to go with the SQL implementation that we are most familiar with over other SQL databases. In contrast, comparing NoSQL systems against MySQL required a deeper understanding of provenance data that will be stored and the performance requirements that must be met by NavPro. There is a lot of diversity in the NoSQL space – the databases differ from each other greatly. Potential candidates include MongoDB, a document-based database, Accumulo, a highly distributed key-value store based off of Google’s BigTable, and Cassandra, a similarly highly distributed database developed by Facebook [17][18]. The primary benefit of using a NoSQL system is improved scalability, concurrency, and performance over large sets of data. Depending on the size 29 of the provenance events data and the types of queries being executed, a NoSQL solution would potentially outperform a MySQL implementation. In the end, we decided on MySQL because we felt that the ability to quickly deploy and use MySQL outweighed potential future performance benefits of a NoSQL database. However, to facilitate easy switching to a NoSQL setup, we designed the Java database interface in such a way that alternatives can be easily switched in for the existing MySQL setup. 3.3.2 Database Schema Three separate databases are utilized to support NavPro: knowledge cache, user database, and events database. The knowledge cache is used by the Provenance Classifier to provide a way for the normalizer to store information for later use. More details on the use of the knowledge cache can be found in Section 3.2.3 and Appendix A – Parsers and Normalizers. The knowledge cache is kept in a separate database from the user database and events database so that the normalizers can access it during the classification process without impacting the performance of the user and events databases. In the knowledge cache database, a separate table is created for each host that sends provenance data to the classifier. The schema of each of these tables can be seen in Table 2. Field Name Field Type Other Info entry_key entry_value VARCHAR (512) VARCHAR (2048) NOT NULL, INDEX NOT NULL Table 2: Knowledge Cache Schema The user database contains all user-specific data. This includes information on alerts, notifications, bookmarks, and user profiles. These features are extended functionality that went beyond the original scope of the project. We elaborate on the features in the 30 Results section. This data is kept in a separate database from the events database due to the nature of the data and the frequency with which the data will be accessed. The user data is small compared to the events data, and as such it would potentially better benefit from a SQL database. Using multiple databases allows for the user database to be implemented using a different database technology than the events database. Additionally, the information in the user database, specifically the alerts and notifications data, is often accessed. Keeping the user and events databases separate helps prevent the events database from being slowed down due to a flood of requests for user data. The user database contains the following tables: • Users: The user profiles that are used to log in to NavPro. The schema of the users table can be seen in Table 3. • Bookmarks: The user-specific bookmarks set on specific views in NavPro. The schema of the bookmarks table can be seen in Table 4. • Alerts: The user-specific alert triggers that notify users when an event occurs matching the trigger’s filters. Table 5 contains the alerts table schema. Field Name Field Type Other Info Id MEDIUMINT userName VARCHAR (100) NOT NULL, AUTO_INCREMENT, PRIMARY KEY NOT NULL, UNIQUE Table 3: Users Table Schema Field Name Field Type Other Info id MEDIUMINT bookmarkName userID VARCHAR (100) MEDIUMINT hostFilter userFilter processFilter fileFilter eventTypeFilter timeLowerBound timeUpperBound tickCount TEXT TEXT TEXT TEXT TEXT VARCHAR (100) VARCHAR (100) VARCHAR (100) NOT NULL, AUTO_INCREMENT, PRIMARY KEY NOT NULL NOT NULL, FOREIGN KEY on users(id) ON DELETE CASCADE NOT NULL NOT NULL NOT NULL NOT NULL NOT NULL NOT NULL NOT NULL NOT NULL Table 4: Bookmarks Table Schema Field Name Field Type Other Info 31 id MEDIUMINT alertName userID VARCHAR (100) MEDIUMINT hostFilter userFilter processFilter fileFilter eventTypeFilter TEXT TEXT TEXT TEXT TEXT NOT NULL, AUTO_INCREMENT, PRIMARY KEY NOT NULL NOT NULL, FOREIGN KEY on users(id) ON DELETE CASCADE NOT NULL NOT NULL NOT NULL NOT NULL NOT NULL Table 5: Alerts Table Schema • Notifications: The user-specific notifications that are generated by the alert triggers. The schema of the notifications table can be seen in Table 6. Field Name Field Type Other Info id MEDIUMINT alertID MEDIUMINT description datetime unread TEXT DATETIME(3) BOOLEAN NOT NULL, AUTO_INCREMENT, PRIMARY KEY NOT NULL, FOREIGN KEY on alerts(id) ON DELETE CASCADE NOT NULL NOT NULL NOT NULL Table 6: Notifications Table Schema The events database stores the normalized provenance events that are output by the classifier. Currently, the database is a MySQL database that contains one table. This is because we envision the database eventually taking the form of an Accumulo, or other similar NoSQL, database that would have a single big table. The schema of the events table can be seen in Table 7. Field Name Field Type Other Info description descriptionDetails hostName userName processName processDetails fileName fileDetails fileIdentifier datetime VARCHAR(512) VARCHAR(2048) VARCHAR (512) VARCHAR (512) VARCHAR (512) VARCHAR(2048) VARCHAR (512) VARCHAR (2048) VARCHAR(512) DATETIME(3) eventType VARCHAR(512) NOT NULL NOT NULL NOT NULL NOT NULL NOT NULL NOT NULL NOT NULL NOT NULL NOT NULL NOT NULL, INDEX NOT NULL 32 Table 7: Event Table Schema An additional table is used to store all of the known types of events that can occur. The schema of this event types table can be seen in Table 8. Field Name Field Type Other Info eventType VARCHAR(512) NOT NULL, UNIQUE Table 8: Event Types Table Schema 3.3.3 Java Database Interface Architecture We developed a set of Java interfaces to allow for easy interaction with the knowledge cache, user database, and events database in the classifier and query API. This set of interfaces also allows the database implementation to be switched out without modifying non-database specific code. The database architecture centers on three interfaces: IKnowledgeCacheProvider, IProvenanceUserDatabase, and IProvenanceEventsDatabase. Together, these interfaces define the methods that a database must make available to be used as a knowledge cache, user database, or events database, respectively. A full description of these API interfaces can be found in Appendix B – Database APIs. With these methods, a Java consumer of any of these interfaces is able to fully interact with the knowledge cache, user database, or events database. Initially, only MySQL implementations of these interfaces are provided. Additional options, such as an Accumulo version, can be easily added by meeting the contracts described in these interfaces. This architecture allows for the rest of NavPro to be developed independently of the database. By providing uniform interfaces for interactions with the database, future changes to the database will only affect the small amount of database-specific code present in the project. 3.4 Interpretation Once the provenance event data has been stored, an interactive visualization is created that allows a user to gain meaningful insights from the data. Displaying this visualization is accomplished through a web application that queries a Tomcat-powered server-side query API. This API provides access to activity metadata (broad details on the 33 amount of activity occurring during time intervals) and actual event data. The web application displays the data it receives from these queries by leveraging existing JavaScript libraries such as d3.js and Bootstrap.js. 3.4.1 Server-Side Query API The server-side query API provides an interface for a client to access information from the provenance event database. The API is powered by a Java servlet running on top of Tomcat. Tomcat provides the basic routing and load-balancing features necessary for a scalable web based project – allowing us to focus on writing our project-specific code. We chose a Java-powered server due to its platform-independent nature and our own personal comfort developing in Java. Using the Java servlet, we created a RESTful API capable of handling multiple requests from different clients concurrently. This API provides access to the queries made available through IProvenanceUserDatabase and IProvenanceEventDatabase. A full list of these queries can be seen in Appendix C - Visualizer Query API. These queries are designed to support the specific visualizations that the web application needs to display to the user. 3.4.2 Client-Side Web Application The client side web application is the culmination of the work being done by the architecture throughout the rest of NavPro. Once the provenance events are classified, stored, and query-able, the web application must display the data in a way that empowers the user to extract meaning from the provenance. Deciding on a data visualization that would be capable of doing this was done through an iterative design and prototyping process. In this process, we first identified a few key scenarios that a user would want to achieve with NavPro. Then, we thought about how a user would be able to complete these scenarios when first approaching the tool without any knowledge other than a time period. We refined the results of these initial brainstorming sessions by consulting with other members of the project, such as Jeff Diewald and Tom Moyer (Group 58). More information on the results of this brainstorming and the final visualization that was implemented can be found in the 34 Results section. By taking a user-first and scenario-centric approach to the design process, we were able to keep ourselves focused on creating features that added immediate value to the user. This kept us from pursuing superfluous visualizations that did not add important meaning. By narrowing the focus of our visualization, we were able to create a polished and stable product that focuses on solving a few key scenarios well. Powering the visualization is a JavaScript library known as d3.js, an established library that supports visualizing data in interactive ways [19]. d3.js allows us to rapidly iterate on our prototypes by using existing library functionality to implement key features of the visualization. Additionally, d3.js supports advanced features such as data binding that make working with large amounts of data very fast and easy to code. Using a supported, and well-documented library such as d3.js greatly sped up development and allowed for additional visualization ideas to be prototyped and evaluated, leading to a better final visualization. For the UI elements of our web application, we relied heavily on Bootstrap. Bootstrap solves some of the most challenging problems of web design – cross-browser compatibility and responsiveness – saving us valuable development time and helping us create a professional web application. We also utilized jQuery to allow for quick and easy DOM manipulation and to provide some of the animations used in the product. We used AJAX to make the web application responsive to user input while querying the server for more information. The AJAX request architecture supporting the functionality of NavPro can be seen in Figure 7. 35 Figure 7: AJAX Request Architecture 36 4 Results In this section, we discuss the results of our project. By following the process outlined in the Methods section, we created the NavPro product along with additional concrete accompanying deliverables. We speak in depth about these deliverables, and evaluate our performance based on the goals that were initially specified for the project. 4.1 NavPro Product The NavPro product we created focused on 3 key components: 4.1.1 Data Analysis In NavPro, data analysis is centered on taking the raw provenance data, parsing it into objects, and normalizing those objects into human understandable actions. By the end of our project, we were able to create a normalizer that derived the following human understandable actions from the LPM provenance data: • create a file • delete a file • access a file o read from a file o write to a file o execute a file • change file permissions The derivations that led to these human-understandable actions can be found in Appendix A – Parsers and Normalizers. Each event captured from the LPM provenance data is tagged as one of these actions, allowing a user to query by action type. Due to technical restrictions with LPM, we were not able to include any socket-based actions. To make these human-understandable actions useful to the user, we also were able to map the information we were given about users, processes, and files into humanunderstandable data. For users, LPM does not provide us with any details on who is performing what actions. Instead, LPM uses a provenance message called setid to communicate a user ID associated with file actions. We were able to send over the 37 mapping of user IDs to usernames through our sprovd daemon and used this mapping to derive what user was performing what actions. For processes, the LPM provenance data provided us with a process ID instead of the actual process name. We were able to derive the process name by examining the forks and execs that led to the creation of the process. With this, we were also able to record the arguments that a process was run with, giving us additional context that was originally hidden in the provenance data. For files, LPM provides the inode number of the file instead of the actual file name. This makes it difficult, if not impossible, for an analyst to derive meaning from file actions. To rectify this, we were able to track file creates and deletes to create our own knowledge cache mapping of inode numbers-to-file names. This allowed us to see what files were hard linked to the same source and track what files are accessed, executed, or deleted. An early limitation of this solution was that it was not able to display the file name for any files that were created before the machine became provenance-aware. This is because we would not have a mapping in the knowledge cache from which we could derive the file name. As a workaround for this limitation, we created a program called spbang, a modified version of an existing utility called pbang. This utility sends the NavPro classifier server inode_alloc, link, and setattr provenance messages for every file on a given unmounted partition. This allows us to create a full hierarchy of the partition’s file system in the knowledge cache. Without this hierarchy, files would be displayed in the form of: “(Partition GUID:Inode Number)/File Name”, which is less than helpful when performing forensic analysis. This feature was beyond the original scope of the project, but we were able to implement it regardless. Additionally, spbang sets an extended attribute on the given partition that can be used to identify the partition once it is mounted. With this extended attribute set, sprovd is able to establish a mapping of extended attributes-to-mount points. This mapping is sent to NavPro along with the regular provenance data messages. By leveraging this mapping, we are able to track partitions as they are mounted and unmounted at runtime. This feature was also beyond the original scope of the project, but had to be implemented to work around a current limitation of LPM. Because of a different technical restriction 38 with LPM, we were not able to support this feature for files housed on temporary partitions, such as /tmp and /boot. In addition to making sense of the LPM provenance data, we were able to optimize our classifier architecture and database schema in a way that reduced memory usage while not sacrificing time efficiency. In the classifier, we utilized an iterator pattern for retrieving actions from the parsers, which led to a marked memory usage improvement. With this change, the space efficiency of parsing the raw LPM data was improved from O(mn) to O(m), where n is the number of actions being parsed and m is the size of a single action. In the database, we were able to specify the time field of an event as an index of the row, leading to a time efficiency improvement from O(n) to O(log(n)) where n is the number of events in the events table. 4.1.2 Visualization Our initial visualization brainstorming sessions allowed us to create a first-pass tabular visualization, which can be seen in Figure 8. Figure 8: Initial Tabular Visualization 39 With this first attempt, we were able to consult with other members of the project, such as Jeff Diewald and Tom Moyer (Group 58), to further refine and iterate on the visualization. Eventually, we decided upon using a chart-based visualization that displayed aggregate overall, user, process, and file activity. This visualization allows a user to identify interesting changes in levels of activity over time. The visualization can be seen in Figure 9. Figure 9: Chart Based Visualization We also experimented with implementing live update functionality for the chart visualization. With live update, the data shown in the charts would automatically change as time went by, always displaying the most up to date information if the user has not changed the time bounds. However, once we implemented this feature, we decided against its inclusion. We felt that it went against the theme of NavPro being a forensic tool, as opposed to a live monitoring detection tool. Additionally, the user experience of live update was jarring as the data was constantly changing without any clear explanation. As well as the visualization, we created a filtering feature that allows a user to specify exactly what hosts, users, processes, files, and event types they are interested in. When a filter is applied, the visualization changes to display the activity that meets the requirements of the filters. Additionally, a user can modify the time span that they are 40 viewing, allowing the user to hone in on specific moments in time. The interface for adding and removing filters can be seen in Figure 10, while the filters alongside the charts can be seen in Figure 11. Figure 10: Filter User Interface Figure 11: Filters and Charts Also visible in Figure 11 is the interface for modifying the time span that the user is viewing. A user can set the time span precisely using the boxes in the upper left corner of the interface, or they can zoom directly on the graph by drag-selecting a region. When the user selects a region on the graph, all of the graphs are zoomed to the selected time span. The user can undo and redo changes to the filter and time span options using the undo and redo buttons in the top left corner of the interface. 41 Once a user has refined the data that they are interested in to the point that only a couple hundred events match the criteria, a table is displayed alongside the chart visualization. This table allows for the user to see exactly what happened, allowing for more advanced analysis to take place. This table-chart view can be seen in Figure 12. Figure 12: Chart Visualization with Table Visualization The table displays the information in the human understandable form that we were able to normalize the provenance data to. Additional information, such as full file path or process arguments, can be found in some table cells by clicking the blue information icon in the right of the cell, as seen in Figure 13. Figure 13: Viewing Table Cell Details 4.1.3 User Features In addition to the visualization features, we implemented convenience features such as profiles, bookmarks and alerts. Profiles allow users to create their own personal profiles that can contain user specific settings. This feature was initially outside of the scope of our project, but was completed to provide better bookmarks and alerts experiences. With this feature, a user is first prompted to select a profile before they can 42 use NavPro. Once they select a profile, their selection is remembered until they logout. Currently, an authentication method is not included with this feature and is instead a future consideration for how to further enhance NavPro. The interface for choosing a profile can be seen in Figure 14, while the interface for logging out and deleting a profile can be seen in Figure 15. Figure 14: Profile Selection Figure 15: Profile Dropdown Bookmarks allow a user to save a set of filters to be returned to later. Bookmarks are saved specific to a profile and are persisted across both machines and sessions. This means that a user can login to their profile on another machine and have access to all of their bookmarks, while not seeing other user’s bookmarks. The bookmarks feature was originally outside of the scope of this project. The interface for adding a bookmark can be seen in Figure 16, while the interface for accessing and removing bookmarks can be seen in Figure 17. 43 Figure 16: Adding a Bookmark Figure 17: Accessing and Removing Bookmarks Alerts allow a user to specify a set of filters that they wish to be alerted about – that is, when an event occurs that meets those filters, the user will be notified. This allows a user to identify interesting activity once and be alerted whenever that activity occurs again in the future. Like bookmarks, alerts are profile-specific. When a user accesses their profile from another machine, they will have access to all of their alert triggers and notifications. The interface for modifying the alert triggers settings can be seen in Figure 18. The interface for viewing alert notifications can be seen in Figure 19. 44 Figure 18: Modifying Alert Trigger Settings Figure 19: Alert Notifications Dropdown A user can view a notification by clicking on the notification. When that happens, NavPro will zoom in on the event that triggered the notification to show the user what happened. From there, the user can adjust the zoom and filters to see contextual information around the event that occurred. In the alert notifications dropdown, notifications are initially colored light blue if they are unread. Once a user views a notification, it will be considered read and will turn a gray color. Likewise, the red badge at the top of the alerts dropdown will update accordingly to reflect the number of unread notifications. When there are no unread notifications, it will turn blue instead of red to signal to the user that there are no new notifications. Notifications are kept until a user clears them – either by clicking the “X” next to the notification or by clicking “Clear Notifications”. 45 4.2 Additional Outcomes To complement the NavPro product that we created, we created a “NavPro Extension Developer’s Guide”, which can be seen in Appendix D – NavPro Extension Developer’s Guide. This guide documents how to send data to NavPro, create a new parser/normalizer, and swap out the initial MySQL database implementation with a different database implementation. We also created an automatic deployment package for OS X (.pkg). This package includes all of the dependencies of NavPro, allowing a user to install the package and immediately get started using the product. We created an installation script for Linux, as well as automated startup and shutdown scripts for both operating systems. For Windows, we provided documentation on how to manually deploy NavPro and include similar automated startup and shutdown scripts. To aid in future deployments, we provide a Makefile that will generate deployment packages based on the platform specified. Documentation on how to deploy future builds is included in Appendix E – NavPro Deployment Guide. 4.2.1 Scenarios To illustrate the power of our product, we came up with two key scenarios that NavPro can solve. The first of these scenarios focused on understanding the impact of a phishing attack. In this scenario, a user has been tricked into downloading and running a malicious executable file. After realizing what has happened, the user alerts their IT department about the event, and the network administrators move to contain the damage of the attack. Without NavPro, the response team would have to comb through logs and search for small traces of the process’ activity. With NavPro, a network administrator is able to filter on the specific executable file that was downloaded and ran. From here, the network administrators can see exactly what the malicious file affected and respond appropriately. The second scenario focuses on performing forensics on a system that has been compromised due to the Shellshock bug. In this scenario, a vulnerable server is running an Apache Web Server that relies on CGI bash scripts. With this setup, an attacker is able to run arbitrary bash commands through a specially crafted HTTP request. 46 Without NavPro, there would be no way to identify that the server had been attacked using Shellshock without examining the content of every request sent to the server. With NavPro, a network administrator can filter on the apache user, which runs the Apache Web Server, and identify any unusual or unexpected behavior. Additionally, a network administrator can set alert triggers that will raise a notification when suspicious activity occurs on the web server. In addition to identifying these scenarios, we were able to successfully mock these crime scenes and record a user reaction with NavPro where the real data was used to solve each case. 4.3 Evaluation 4.3.1 Requirements By the end of our project, we were able to satisfy all of the base requirements that we enumerated in Section 1.2: • NavPro will be accessible through a web browser. • NavPro will allow a user to input Linux Provenance Modules (LPM) HiFi data. • NavPro will allow a user to view activity performed on (or by) an entity (user, process, or file). • NavPro will simplify provenance data from system calls to readable actions. • NavPro will allow a user to search for activity based on different types of entities. • NavPro will be deployable in an automated way. We were also able to fulfill all of the requirements that we designated as “if time allows” work in Section 1.2: • NavPro will have the capability to accept provenance data from different data sources, operating systems, etc. through an extensible plugin system. • NavPro will allow a user to monitor a network of computers from the web application. • NavPro will allow a user to view activity performed by a specific host in a network. • NavPro will allow backward and forward navigation through visualizations. 47 • NavPro will allow a user to export the raw data from a table or chart visualization based on the current filter set. • NavPro will allow a user to set alerts for entities (hosts, users, processes, files) and be alerted when an event occurs involving that entity. As well as the work that was described in the initial project scope, we were able to complete the following additional features: • NavPro will display condensed high-level versions of “readable” actions. • NavPro will quantify relationships between entities through search result filters. • NavPro will live update data in view of the currently visualized entity. o Note: This feature was implemented, but later removed. More information on why this feature was removed can be found in Section 4.1.2. • NavPro will allow a user to save visualizations as bookmarks so they can be revisited later in the session. • NavPro will track provenance events that cross multiple host machines. By the end of our project, we successfully completed the implementation of the entire enumerated project scope as well as five major features that fell outside of the original project scope. We were able to deliver a high quality, production quality product that shows how provenance data can be leveraged for useful computer forensics. 4.3.2 User Study Once the product implementation was finalized, Jeff Diewald connected us with forensic analysts from Lincoln Laboratory’s Information Services Department (ISD) and Security Services Department (SSD). They sat down with us to interact with the NavPro user interface and discuss its potential in the field of computer forensics. First, the analysts were surprised by how much context was provided with each event that they could view. Both of them had grown accustom to tools that only show the state of the machine after the cyber crime has been committed. Once they were able to understand the events-based approach of NavPro, they noted that having a host, user, process, and file associated with every event could make discovering points of interest less stressful and time-consuming. 48 Additionally, they stated that NavPro could “bridge the gap” between networkand host-based forensic tools. In their experience, all the tools they have used for analysis were either specific to network traffic or to the state of a given machine. With the latter, they were often combing through log files and examining file hierarchies. The analysts were impressed that NavPro provides the ability to derive process hierarchies, file hierarchies, and network activity for all hosts and users at once. Both analysts wanted to be added to the loop moving forward with this tool’s development and were excited about its potential. 49 5 Discussion In this section, we primarily discuss the future of NavPro development and the enhancements we would make if we had another few months to work with Lincoln Laboratory. We also mention limitations we faced with LPM, and how they could be addressed moving forward. Finally, we discuss the potential NavPro has to benefit forensic analysts as it evolves over time. 5.1 NavPro Future Development At the conclusion of our project, we have multiple ideas for useful features that could be added to NavPro. These features can be broken down into three categories: 5.1.1 New Visualizations While the chart and table visualizations NavPro provides enable analysts to navigate through the data and view specific events, other visualizations may provide additional benefits. A visualization we believe would be helpful, though we have not had time to explore, is a time graph that would represent the life of a single inode. To the user, this would be the life of a “file”, where the first node would be the creation of the file and every event moving forward would be permissions changes and added/removed hard links. The life of the inode would end when it is no longer linked to any files. To prepare NavPro for this visualization, we included a “fileIdentifier” field for every ProvenanceEvent. This is a string UUID that corresponds to a single inode on a partition from the moment it gets its first hard link until it is unlinked for the last time, making its reference count 0. We did not leverage this UUID or mock the graph due to time constraints, but creating this visualization may provide better guidance through the data than charts and tables alone. Another potentially helpful visualization would be a graph representing the hierarchy for a given process. If a malicious process spawns a child process that attacks a system, it is important to be able to make the connection back to the parent process. This data is available because the normalizer can track parent-child relationships every time a new process is forked. Time constraints prevented us from mocking or implementing potential graphs for this data, but NavPro would benefit from visualizing it. 50 5.1.2 Advanced Filtering NavPro currently supports filters that can search through the database for events with specified times, hosts, users, processes, files, and types. These filters also allow for SQL wildcards to be used when searching. With that said, much more could be done with the concept of filtering provenance data. An example is to expand beyond filenames and allow full paths to be filtered on in a way that doesn’t force the user to specify a full path when they do not want to. If a user wanted to see all of the files under a certain directory, they could leverage full paths and wildcards to make a filter that does so. The same concept can be applied to processes. In addition to filtering by a process name, a user may want to find all processes that used a specific environment variable as one of their arguments. They also may want to discover the values of environment variables at a given time, which our normalizer knows but omits to prevent clutter in the table visualization. Another example is allowing a user to specify a sequence of actions that they would like to search for or be alerted on. This could be viewed as a “compound filter”, which searches for a sequence of events, that fit certain criteria, all happening within a specified time of one another. This would be complicated work, as we could potentially end up defining our own language for analysts to use when defining compound events they want to search for. With that said, the benefits could outweigh the development cost. 5.1.3 Added Security NavPro currently makes the assumption in many places that its physical server is not compromised. The classifier loads in classes from the parser and normalizer plugin pools without verifying their authenticity, and the visualizer does not authenticate users when they log in. The configuration files for both are also unencrypted. While internal security was not a point of emphasis for this project, these issues should be addressed as it moves toward production. Ensuring that all user and provenance data is validated at all steps will be vital. Additionally, all of the data sent from the LPM daemon to the server should be encrypted. 51 5.2 Addressing LPM Limitations During this project, NavPro became the first large-scale consumer of Linux Provenance Modules data. Overall, this data provided us with a solid foundation to build our final product, but there were gaps in the data that are worth mentioning. We would also like to propose solutions to those limitations so that they can be implemented as NavPro and LPM continue to be developed. First, the lack of mount information in LPM data caused a lot of work for our daemon and still did not provide location context for all files. For every partition on a host, a partition is given a unique identifier that can be used by the normalizer to identify its file system. With that said, LPM alone does not establish mappings between these identifiers and their mount points. Additionally, LPM does not provide any way, even with workarounds, to establish an identifier for a temporarily mounted file system. This lack of data prevents NavPro from providing full file paths for all events on a host. This problem can be solved by creating two new provenance messages: one that identifies when a partition is mounted and another that identifies when a partition is unmounted. They can both contain the path of the mount point, the location of the partition, and the file identifier that can be used to associate other messages with that file system. There are already hooks in place to identify when these events happen, LPM just needs to be modified to create messages at those times. Another known issue is that socket data is not being accurately collected. The messages that capture when data is sent and received on a network are broken. Also, the structs do not include important data such as how many bytes were sent/received or when a specific port is bound to. These issues can be remedied by altering the send/receive messages to contain more metadata and adding a new call, or modifying sockalias, to identify when a socket is bound to. Also, LPM does not provide the ability to accurately identify when a symbolic link is made to a file. The readlink call may be helpful in marking when a soft link is being created, but knowing which file the link is to will require more link metadata. Finally, encoding for LPM data to remove the need for manual binary struct processing would cause less development costs moving forward. 52 5.3 NavPro Deployment Potential Looking ahead, NavPro has the potential to be deployed on live networks to provide forensic analysts and network administrators with a tool that can help them with their daily workload. Provenance data can provide footprints of suspicious activity that are otherwise not collected, and NavPro presents that data in an organized way. We have automated the deployment of NavPro for Mac OS X and for Linux operating systems. Analysts that want to leverage this tool only need to have access to a web browser. As parsers and normalizers are developed for more provenance-aware systems, the likelihood of having a full network of provenance-aware hosts increases. Leveraging NavPro in this kind of environment can demonstrate the usefulness of provenance data in performing computer forensics and understanding the impact of cyber crime. 53 6 References [1] Thomas Moyer, Jeff Diewald, Nabil Schear. WPI MQP: Data Provenance Visualization and Analytics. Work in progress. [2] PROV-Overview: An Overview of the PROV Family of Documents. http://www.w3.org/TR/prov-overview/. [3] The Open Provenance Model. http://openprovenance.org/. [4] J. P. Anderson. Computer security technology planning study. Technical Report ESD-TR-73-51, ESD/AFSC, Hanscom AFB, Bedford, MA, October 1972. [5] Adam Bates, Kevin R. B. Butler, and Thomas Moyer. Linux Provenance Modules: Secure Provenance Collection for the Linux Kernel. Work in Progress. [6] David A. Holland, Margo I. Seltzer, Uri Braun, and Kiran-Kumar MuniswamyReddy. Passing the provenance challenge. Concurrency and Computation: Practice and Experience, 20(5):531–540, 2008. [7] Devin J. Pohly, Stephen McLaughlin, Patrick McDaniel, and Kevin Butler. Hi-fi: collecting high- fidelity whole-system provenance. In Proceedings of the 28th Annual Computer Security Applications Conference, ACSAC ’12, pages 259–268, New York, NY, USA, 2012. ACM. [8] Jennifer Widom. Trio: A system for data, uncertainty, and lineage. In Managing and Mining Uncertain Data. Springer, 2008. [9] Yulai Xie, Kiran-Kumar Muniswamy-Reddy, Dan Feng, Yan Li, and Darrell D. E. Long. Evaluation of a hybrid approach for efficient provenance storage. Trans. Storage, 9(4):14:1–14:29, November 2013. [10] Frits H. Post, Gregory M. Nielson and Georges-Pierre Bonneau (2002). Data Visualization: The State of the Art. Research paper TU delft, 2002. [11] James J. Thomas and Kristin A. Cook (Ed.) (2005). Illuminating the Path: The R&D Agenda for Visual Analytics. National Visualization and Analytics Center. [12] Internet Visualization. http://en.wikipedia.org/wiki/Information_visualization. [13] Data Cleaning. Microsoft Research. Retrieved 26 October 2013. [14] The Java Virtual Machine. http://docs.oracle.com/javase/specs/jvms/se7/html/. [15] Java Native Interface Specification. http://docs.oracle.com/javase/6/docs/technotes/guides/jni/spec/jniTOC.html. 54 [16] MySQL Reference Manual. http://dev.mysql.com/doc/refman/5.6/en/index.html. [17] Apache Accumulo User Manual. http://accumulo.apache.org. [18] Fay Chang, Jeffrey Dean, Sanjay Ghemawat, Wilson C. Hsieh, Deborah A. Wallach Mike Burrows, Tushar Chandra, Andrew Fikes, Robert E. Gruber. Bigtable: A Distributed Storage System for Structured Data. 2006. [19] d3.js – Data-Driven Documents. http://d3js.org. [20] Bootstrap. http://getbootstrap.com/2.3.2/getting-started.html. [21] Nichols, Randall K. Defending your digital assets against hackers, crackers, spies, and thieves. McGraw-Hill Professional, 2000. [22] Whitman, Michael, and Herbert Mattord. Principles of information security. Cengage Learning, 2011. [23] Loscocco, Peter, and Stephen Smalley. "Meeting critical security objectives with security-enhanced linux." Proceedings of the 2001 Ottawa Linux symposium. 2001. [24] Hong, Jason. "The state of phishing attacks." Communications of the ACM 55.1 (2012): 74-81. [25] Cloudflare. https://www.cloudflare.com. [26] User Stories. http://www.mountaingoatsoftware.com/agile/user-stories. [27] Chmod. http://en.wikipedia.org/wiki/Chmod. [28] chmod(1). http://www.freebsd.org/cgi/man.cgi?query=chmod&sektion=1. [29] Choo, K. K. R. (2011). The cyber threat landscape: Challenges and future research directions. Computers & Security, 30(8), 719-731. [30] Greitzer, Frank L., et al. "Combating the insider cyber threat." Security & Privacy, IEEE 6.1 (2008): 61-64. 55 7 Appendix A – Parsers and Normalizers 7.1 Parser API Tells the classifier if the parser can interpret data based on the source identifier. boolean canParse(String identifier); Sets the parser's input stream to generate actions from. This will always be called before getNextAction is called for the first time. void setInputStream(InputStream inputStream); Gets the next ProvenanceAction from the previously set input. ProvenancAction getNextAction(); 7.2 Normalizer API Tells the classifier if the normalizer can interpret data based on the source identifier. boolean canNormalize(String identifier); Sets the normalizers host and knowledge cache to the given string and cache. This will always be called before normalize is called for the first time. void setHostAndKnowledgeCache(String host, KnowledgeCache knowledgeCache); Normalizes the given ProvenanceAction into a ProvenanceEvent. ProvenanceEvent normalize(ProvenanceAction provenanceAction); 7.3 Parsing LPM Binary Data The C struct that LPM collects many instances of is called prov_msg. Each contains a message type, a content length, and a pointer to a character array of the length specified by the second field. The first of those fields categorizes the struct as one of the following types: • boot (the system booted) 56 • inode_alloc (a new inode was allocated) • inode_dealloc (an inode was deallocated) • link (a new hard link was created to an inode) • unlink (a hard link was removed from an inode) • credfork (a new process was forked) • credfree (a process ended) • readlink (a process read the location of another file) • mmap (memory was mapped) • setattr (permissions/ownership of a file changed) • setid (a process is associated with a user and group) • socksend (data was sent on a socket) • sockrecv (data was received on a socket) • iperm (inode metadata was accessed) • fperm (file block contents of an inode were accessed) • exec (an exec system call was made) • mqsend (message queue data was sent) • mqrecv (message queue data was received) • shmat (shared memory was attached to an address space) • sockalias (a socket was bound to) There is an existing C program called “pcat” that takes this binary data as input and produces string representations of each (i.e. “[42] link abcdef12-abcd-acbd-acbdacbdef1234567890:1234 to 1233:hello” means process 42 linked inode 1234 on partition abcdef12-abcd-acbd-acbd- acbdef1234567890 to a file named ‘hello’ in the directory that is inode 1233). The LPM parser we built uses JNI to leverage this program and turns the output string into a list of ProvenanceActions. These objects contain a method name (i.e. “link”), an array of arguments (i.e. [“42”, “abcdef12-abcd-acbd-acbd-acbdef1234567890:1234”, “to” “1233:hello”]), and a timestamp. Because LPM data does not currently include timestamps, we simply use the current time of day for each action so that they stay in chronological order. 57 7.4 Normalizing Parsed LPM Actions The normalizer then takes these ProvenanceActions as input and produces ProvenanceEvents (defined in the database schema) when an action implies a user-level event. The derivations for each of these events are as follows: • Create file – a link call is made (this is a new file if only inode_alloc was called on that inode previously and no other link calls have happened on it before) • Delete file – an unlink call is made (inode_dealloc will follow if the reference count to the given inode becomes 0 with this unlink call) • Access file – an fperm call is made on an inode with either Read, Write, or Execute permissions (we consider many fperm calls on the same inode with the same permissions within 10 seconds to be a single file access) • Change file permissions – a setattr call is made with information containing the new list of owner/group/other permissions, as well a possibly new owner socksend and sockrecv also directly indicate network activity, but current issues with LPM prevented us from leveraging this data in our implementation. sockalias is another action type that is currently ignored, but most of the rest are used (as explained in the bulleted list in the previous section) to collect metadata that is stored in the knowledge cache so that every ProvenanceEvent produced will have a full file path, a process with all of its arguments, a username, and a hostname. 58 8 Appendix B – Database APIs 8.1 Knowledge Cache API Associates the given value with the host name and key. boolean rememberData(String hostName, String dataKey, String dataValue); Retrieves the data associated with the given host name and key. String retrieveData(String hostName, String dataKey); 8.2 User Database API Stores an alert in the database. boolean addAlert(int userID, ProvenanceAlert alert); Add a bookmark to the database for the given user ID. boolean addBookmark(int userID, ProvenanceBookmark bookmark); Stores a notification in the database. boolean addNotification( int alertID, ProvenanceNotification notification); Adds a provenance user to the database. boolean addUser(String username); Updates a notification in the database to be read. boolean readNotification(int primaryKey); Removes the alert with the given primary key from the database. boolean removeAlert(int userID, int primaryKey); Removes the bookmark with the given primary key from the database. 59 boolean removeBookmark(int userID, int primaryKey); Removes the notification with the given primary key from the database. boolean removeNotification(int primaryKey); Removes a provenance user from the database. boolean removeUser(int userID); Retrieves a single alert based on a notification’s primary key. ProvenanceAlert retrieveAlertForNotification(int primaryKey); Retrieves a list of all alerts. List<ProvenanceAlert> retrieveAlerts(); Retrieves a list of all alerts for the given user ID. List<ProvenanceAlert> retrieveAlerts(int userID); Retrieves a list of all of the bookmarks for a given user. List<ProvenanceBookmark> retrieveBookmarks(int userID); Retrieves a list of all of the notifications for a given user. List<ProvenanceNotification> retrieveNotificationsForUser(int userID); Retrieves a list of all of the provenance users. List<ProvenanceUser> retrieveUsers(); 8.3 Events Database API Retrieves the activity metadata from the database that describe the level of activity over the given time span. ProvenanceActivityMetadata retrieveActivityMetadata( String[] hosts, String[] users, String[] processes, String[] files, String[] eventTypes, Date timeLowerBound, Date timeUpperBound, int ticks); 60 Retrieves an array of all of the provenance event types. String[] retrieveProvenanceEventTypes(); Stores the given provenance event in the database. Boolean storeProvenanceEvent(ProvenanceEvent eventToStore); Stores a provenance event type in the database. Boolean storeProvenanceEventType(String eventTypeToStore); 61 9 Appendix C - Visualizer Query API 9.1 GET Queries • /query/metadata o Performs a metadata request. The response to a metadata request includes activity metadata over time for overall activity, user activity, process activity, file activity, and network activity. Also includes the list of provenance events that matched the query if the count of those events if below a configured threshold. Finally, includes an array of provenance event types that can be used to filter the provenance events in future queries. o Parameters: ! host: A list of host names to query. If left null, this parameter is ignored. ! user: A list of user names to query. If left null, this parameter is ignored. ! process: A list of process names/ids to query. If left null, this parameter is ignored. ! file: A list of file names to query. If left null, this parameter is ignored. ! eventType: A list of event types to query. If left null, this parameter is ignored. ! tl: The lower bound of the time span that the query will focus on, inclusive. This parameter MUST NOT be null. Must be in the format of MS since Unix Epoch. ! tu: The upper bound of the time span that the query will focus on, inclusive. This parameter MUST NOT be null. Must be in the format of MS since Unix Epoch. ! ticks: The number of ticks to retrieve information. The timespan will be divided into "tick" number of buckets, and activity counts will be retrieved for each of those buckets. 62 ! forceEvents: Whether or not to force the query to send back the provenance events for the filters. If not provided, defaults to false. • /query/fulldata o Performs a full data request, retrieving a list of provenance events that matched the query. Also includes an array of provenance event types that can be used to filter the provenance events in future queries. o Parameters: ! host: A list of host names to query. If left null, this parameter is ignored. ! user: A list of user names to query. If left null, this parameter is ignored. ! process: A list of process names/ids to query. If left null, this parameter is ignored. ! file: A list of file names to query. If left null, this parameter is ignored. ! eventType: A list of event types to query. If left null, this parameter is ignored. ! tl: The lower bound of the time span that the query will focus on, inclusive. This parameter MUST NOT be null. Must be in the format of MS since Unix Epoch. ! tu: The upper bound of the time span that the query will focus on, exclusive. This parameter MUST NOT be null. Must be in the format of MS since Unix Epoch. • /query/export o Performs an export request, retrieving an exported tab-separated version of the provenance events that match the query. o Parameters: ! host: A list of host names to query. If left null, this parameter is ignored. ! user: A list of user names to query. If left null, this parameter is ignored. 63 ! process: A list of process names/ids to query. If left null, this parameter is ignored. ! file: A list of file names to query. If left null, this parameter is ignored. ! eventType: A list of event types to query. If left null, this parameter is ignored. ! tl: The lower bound of the time span that the query will focus on, inclusive. This parameter MUST NOT be null. Must be in the format of MS since Unix Epoch. ! tu: The upper bound of the time span that the query will focus on, exclusive. This parameter MUST NOT be null. Must be in the format of MS since Unix Epoch. • /query/bookmark/view o Retrieves all of the bookmarks stored in the database for a user. o Parameters: ! • userID : The user to retrieve the bookmarks for. /query/alert/view o Retrieves an alert for a given notification. o Parameters: ! • notificationID: The notification to retrieve the alert for. /query/alerts/view o Retrieves all of the alerts stored in the database. o Parameters: ! • userID: The user to retrieve the alerts for. /query/notifications/view o Retrieves all of the notifications stored in the database. o Parameters: ! • userID: The user to retrieve the notifications for. /query/notifications/poll o Retrieves all of the new notifications stored in the database. o Parameters: 64 ! • userID: The user to retrieve the notifications for. /query/users/view o Retrieves all of the users stored in the database. 9.2 POST Queries ! /query/bookmark/add o Adds a bookmark with the given parameters to the database. Returns whether or not the query failed. o Parameters: ! name: The name of the bookmark. ! host: A list of host names to query. If left null, this parameter is ignored. ! user: A list of user names to query. If left null, this parameter is ignored. ! process: A list of process names/ids to query. If left null, this parameter is ignored. ! file: A list of file names to query. If left null, this parameter is ignored. ! eventType: A list of event types to query. If left null, this parameter is ignored. ! tl: The lower bound of the time span that the query will focus on, inclusive. This parameter MUST NOT be null. Must be in the format of MS since Unix Epoch. ! tu: The upper bound of the time span that the query will focus on, inclusive. This parameter MUST NOT be null. Must be in the format of MS since Unix Epoch. ! ticks: The number of ticks to retrieve information. The timespan will be divided into "tick" number of buckets, and activity counts will be retrieved for each of those buckets. ! ! userID: The user to add the bookmark for. /query/bookmark/remove 65 o Removes a bookmark with the given identifier from the database. Returns whether or not the query succeeded. o Parameters: ! ! bookmarkID : The identifier of the bookmark. ! userID : The user to remove the bookmark for. /query/alert/add o Adds an alert with the given parameters to the database. Returns whether or not the query succeeded. o Parameters: ! name : The name of the alert. ! host : A list of host names to query. If left null, this parameter is ignored. ! user : A list of user names to query. If left null, this parameter is ignored. ! process : A list of process names/ids to query. If left null, this parameter is ignored. ! file : A list of file names to query. If left null, this parameter is ignored. ! eventType: A list of event types to query. If left null, this parameter is ignored. ! ! userID : The user to add the alert for. /query/alert/remove o Removes an alert with the given identifier from the database. Returns whether or not the query succeeded. o Parameters: ! ! alertID : The identifier of the alert. ! userID : The user to remove the alert for. /query/notification/read o Marks a notification with the given identifier as read in the database. Returns whether or not the query succeeded. o Parameters: 66 ! ! notificationID: The notification to mark as read. /query/notification/remove o Removes a notification with the given identifier from the database. Returns whether or not the query succeeded. o Parameters: ! ! notificationID: The identifier of the notification. /query/users/add o Adds a user with the given username to the database. Returns whether or not the query succeeded. o Parameters: ! ! userName: The name of the user. /query/users/remove o Removes a user with the given user ID from the database. Returns whether or not the query succeeded. o Parameters: ! userID: The ID of the user to remove. 67 10 Appendix D – NavPro Extension Developer’s Guide 10.1 Sending Data To NavPro When sending data from a provenance-aware system to NavPro, the sending process must repeatedly take the following steps every few seconds (or any other time interval, in the case of LPM HiFi it is 5 seconds): 1. Open a TCP connection with the NavPro classifier server. 2. Send the hostname of your machine, followed by a null character (i.e. “lpm2014-09-22-mitll” + ‘\0’, 21 bytes in this case). 3. Send a string that your Parser and Normalizer will use to identify you, followed by a null character (i.e. “LPM HiFi” + ‘\0’, 9 bytes in this case). 4. Send the bytes of data that you want to be handled by your Parser and Normalizer, no termination character needed. 5. Close the TCP connection with the NavPro classification server. It is important that your sending process does not maintain an open connection with the server because it will only begin to process the data once the connection is closed. Notes • The hostname and identifier strings will be interpreted using Java’s String constructor (i.e. “new String(identifierBytes)”, where identifierBytes is a byte array containing the bytes prior to the first null character). • The daemon that implements this protocol for LPM HiFi is called “sprovd”, sprovd.c can be found in the Cyber-Provenance/analytic-platform repository. 10.2 Writing A NavPro Parser When the NavPro classifier server receives data from the sending process on your provenance-aware machine, your Parser will be passed that data as a Java InputStream immediately. This stream should either be stored for later use or fully read from before being discarded (the latter using significantly more memory). 68 Later, the method getNextAction will be called repeatedly until your Parser returns null, indicating it has no more actions to parse from the input. Until your parser is out of input to parse actions from, it should be returning the next action from the raw provenance bytes. This action is represented as a ProvenanceAction object (defined in ProvenanceClassifier.jar), which contains: 1. methodName – an string identifier for the type of action this is (i.e. “exec”) 2. args – an array of strings representing the arguments for the method (i.e. [“touch”, “helloWorld.txt”] for the method “exec”) 3. timestamp – a java.util.Date object specifying when the action occurred Each of these ProvenanceAction objects will be passed to your Normalizer one by one, with the order being guaranteed (even if sent in different bursts from the sending process). Notes • The interface Parsers need to implement is IProvenanceParser, which (in addition to setInputStream() and getNextAction() mentioned above) requires implementing a canParse() method, which takes in an identifier string (like “LPM HiFi” in the example from the previous section) and returns whether or not it can parse data from that source. • To make your Parser, create an Eclipse Java project (with any name) and have a package called “Parser” with a class called “Parser” that implements the IProvenanceParser interface. • Export your project as a JAR file and place it in the NavPro classifier’s ParserPool folder (specified in your classifier.config file) to start accepting data. This can be done at runtime without restarting the server. • The implementation of IProvenanceParser for LPM HiFi is in the “LPMParser” folder in the Cyber-Provenance/analytic-platform repository. It uses JNI to leverage a C parser that can interpret the binary data sent from sprovd, which is not a recommended method of parsing moving forward. 69 10.3 Writing A NavPro Normalizer As explained in the previous section, your Parser will be returning single ProvenanceAction objects to the classifier until it reads all the way through its input stream. Each one of these objects will be passed into your Normalizer (one by one, in order) so that they can be turned into ProvenanceEvent objects. The specific details of this object can be found in the Javadocs for the project. Each time your Normalizer is passed a ProvenanceAction object, it needs to decide whether or not to create a ProvenanceEvent. Every time it creates and returns a ProvenanceEvent, the event will be stored in the database and can be seen in the web application’s visualization. Before receiving these actions through the “normalize” method, you will be given the hostname of the machine this data is from. Additionally, you will be given what we call the “knowledge cache”. This will effectively function as a persistent HashMap for your Normalizer, which you can use in any way you’d like. An example is storing file name mappings to inode numbers so that your Normalizer can tell how many hard links a specific file has at any given time. Notes • The interface Normalizers need to implement is IProvenanceNormalizer, which (in addition to setHostAndKnowledgeCache and normalize mentioned above) requires implementing a canNormalize method, which takes in an identifier string (like “LPM HiFi” in the example from the previous section) and returns whether or not it can normalize actions parsed from that source. • If you would like to add new EventTypes (in addition to the default ones provided), you can create an enum that implements IProvenanceEventType and use one of those values instead. For an example implementation, see ProvenanceEventTypeDefault.java in the ProvenanceCommon project. • To make your Normalizer, create an Eclipse Java project (with any name) and have a package called “Normalizer” with a class called “Normalizer” that implements the IProvenanceNormalizer interface. 70 • Export your project as a JAR file and place it in the NavPro classifier’s NormalizerPool folder (specified in your classifier.config file) to start accepting data. This can be done at runtime without restarting the server. • The implementation of IProvenanceNormalizer for LPM HiFi is in the “LPMNormalizer” folder in the Cyber-Provenance/analytic-platform repository. 10.4 Using A Database Other Than MySQL For our initial implementation of NavPro, we used a MySQL database to store the ProvenanceEvents generated by the classifier. As the data gets larger, it may be necessary to migrate to something more scalable. To accommodate this change, we have created an interface called IProvenanceEventDatabase that can be implemented to easily substitute in any new database system. In our version of NavPro, the MySQLProvenanceEventDatabase class contains all of the MySQL specific code. The specific methods that need to be implemented for the interface can be found in the Javadocs for the project. 71 11 Appendix E – NavPro Deployment Guide 11.1 Deployment Directory Layout The directory layout of all NavPro deployments can be seen below: • bin: This directory contains the installations of MySQL (if included), Tomcat, Provenance Classifier, and Provenance Visualizer. • classifier.config: The configuration file for the classifier. Modify this file to update classifier-specific settings. See Configuring NavPro for more details. • log: The log files for the visualizer and classifier. • NormalizerPool: The pool of Normalizers for the classifier to use. Initially, this includes the sample LPM Normalizer. Future normalizer JARs should be placed here as well. • ParserPool: The pool of Parsers for the classifier to use. Initially, this includes the sample LPM Parser. Future parser JARs should be placed here as well. • startup.sh (Linux & OS X Only): The script used to start up NavPro. • shutdown.sh (Linux & OS X Only): The script used to shutdown NavPro. • visualizer.config: The configuration file for the visualizer. Modify this file to update visualizer-specific settings. See Configuring NavPro for more details. 11.2 Configuring NavPro When NavPro is installed, there are two configuration files that can be customized to modify the behavior of NavPro. The first configuration file is classifier.config. In it, there are the following customizable options: • SERVER_IP_ADDRESS: The IP that the classifier server can be accessed at. It must be set correctly for connections to be made to the classifier server. • SERVER_PORT: The port that the classifier server can be accessed at. It must be set correctly for connections to be made to the classifier server. • PARSER_POOL_PATH: The path to the parser pool. • NORMALIZER_POOLPATH: The path to the normalizer pool. 72 • KNOWLEDGE_CACHE_SERVER: The IP of the knowledge cache server. • KNOWLEDGE_CACHE_PORT: The port of the knowledge cache server. • KNOWLEDGE_CACHE_USERNAME: The username to the knowledge cache. • KNOWLEDGE_CACHE_PASSWORD: The password to the knowledge cache. • KNOWLEDGE_CACHE_NAME: The database name for the knowledge cache. • KNOWLEDGE_CACHE_MAX_POOL_SIZE: The maximum number of connections to pool for connecting to the knowledge cache. • KNOWLEDGE_CACHE_INITIAL_POOL_SIZE: The minimum number of connections to pool for connecting to the knowledge cache. • EVENT_DATABASE_SERVER: The IP of the events database server. • EVENT_DATABASE_PORT: The port of the events database server. • EVENT_DATABASE_USERNAME: The username to the events database. • EVENT_DATABASE_PASSWORD: The password to the events database. • EVENT_DATABASE_NAME: The name of the events database. • EVENT_DATABASE_MAX_POOL_SIZE: The maximum number of number of connections to pool for connecting to the events database. • EVENT_DATABASE_INITIAL_POOL_SIZE: The minimum connections to pool for connecting to the knowledge cache. • USER_DATABASE_SERVER: The IP of the user database server. • USER_DATABASE_PORT: The port of the user database server. • USER_DATABASE_USERNAME: The username to the user database. • USER_DATABASE_PASSWORD: The password to the user database. • USER_DATABASE_NAME: The name of the user database. • USER_DATABASE_MAX_POOL_SIZE: The maximum number of connections to pool for connecting to the user database. • USER_DATABASE_INITIAL_POOL_SIZE: The minimum number of connections to pool for connecting to the user database. The second configuration file is visualizer.config. In it, there are the following customizable options: 73 • EVENT_DATABASE_SERVER: The IP of the events database server. • EVENT_DATABASE_PORT: The port of the events database server. • EVENT_DATABASE_USERNAME: The username to the events database. • EVENT_DATABASE_PASSWORD: The password to the events database. • EVENT_DATABASE_NAME: The name of the events database. • EVENT_DATABASE_MAX_POOL_SIZE: The maximum number of number of connections to pool for connecting to the events database. • EVENT_DATABASE_INITIAL_POOL_SIZE: The minimum connections to pool for connecting to the knowledge cache. • USER_DATABASE_SERVER: The IP of the user database server. • USER_DATABASE_PORT: The port of the user database server. • USER_DATABASE_USERNAME: The username to the user database. • USER_DATABASE_PASSWORD: The password to the user database. • USER_DATABASE_NAME: The name of the user database. • USER_DATABASE_MAX_POOL_SIZE: The maximum number of connections to pool for connecting to the user database. • USER_DATABASE_INITIAL_POOL_SIZE: The minimum number of connections to pool for connecting to the user database. • MAX_QUERY_RESULT_COUNT: The maximum number of results to send back in table form for a metadata request. There are additional Tomcat-specific configuration files located at bin/tomcat/conf. For information on how to configure Tomcat, please reference the Tomcat User Guide. If you do not have MySQL pre-installed on your system and rely on the MySQL installation packaged with the Linux and OS X deployment options, there are additional MySQL configuration files located at bin/mysql/. For information on how to configure MySQL, please reference the MySQL User Guide. 74 11.3 Deployment on Mac OS X As a prerequisite, NavPro requires that you have a Java Virtual Machine installed on your machine with the ability to run jar files through the java command. Included in the deployment.tar.gz archive in the NavPro repository is a file called NavPro-1.0.pkg. This file is an automated package installer for Mac OS X. To install NavPro, simply double click this file and follow the instructions in the installation dialogs. This installer installs NavPro at the location /usr/local/NavPro/. From there, the startup.sh and shutdown.sh scripts can be run to startup and shutdown NavPro, respectively. On first startup, the Linux distribution of NavPro will automatically setup the database and any permissions settings that need to be configured to run the application. It is recommended that you already have MySQL installed on your machine as a prerequisite to installing NavPro. However, if you do not have MySQL, the OS X deployment of NavPro will use a MySQL installation prepackaged with the installer. This MySQL instance is installed at /usr/local/NavPro/bin/mysql/. 11.4 Deployment on Linux As a prerequisite, NavPro requires that you have a Java Virtual Machine installed on your machine with the ability to run jar files through the java command. Included in the deployment.tar.gz archive in the NavPro repository is a file called NavPro-1.0-linux.tar.gz. This file is the NavPro deployment package for Linux. To install NavPro from this package, untar the package somewhere on your file system and run the install.sh script in the root of the untar-ed directory. This script will install NavPro at the location /usr/local/NavPro/. From there, the startup.sh and shutdown.sh scripts can be run to startup and shutdown NavPro, respectively. On first startup, the Linux distribution of NavPro will automatically setup the database and any permissions settings that need to be configured to run the application. It is recommended that you already have MySQL installed on your machine as a prerequisite to installing NavPro. However, if you do not have MySQL, the Linux deployment of NavPro will use a MySQL installation prepackaged with the installer. This MySQL instance is installed at /usr/local/NavPro/bin/mysql/. 75 11.5 Deployment on Windows As a prerequisite, NavPro requires that you have a Java Virtual Machine installed on your machine with the ability to run jar files through the java command. Unlike OS X and Linux, deploying on Windows must be done manually. In the deployment.tar.gz archive included in the repository, there is a NavPro-1.0-Windows.zip file. This file contains the NavPro binaries needed to run NavPro on Windows. To install NavPro, you must first install and configure MySQL on your computer. MySQL is not packaged with the Windows deployment of NavPro. Then, you can unzip the NavPro-1.0-Windows.zip file anywhere on your file system. After this, you must run the SQL script located at [Path to NavPro Directory]/bin/setup/DatabaseSetup.sql on your MySQL server. Once you have completed these steps, you can then start NavPro by running the following commands: To start the provenance classifier: java –jar [Path to NavPro Directory]/bin/provenance-classifier.jar To start the provenance visualizer: [Path to NavPro Directory]/bin/tomcat/bin/startup.bat And you can stop NavPro by running the following commands: To stop the provenance classifier: Open Task Manager -> Select Java -> End Task To stop the provenance visualizer: [Path to NavPro Directory]/bin/tomcat/bin/shutdown.bat 11.6 Creating Future Deployments To create future deployments of NavPro, you can use the Makefile included in the deployment.tar.gz archive provided in the repository. To do this, first you must update 76 the binaries that you modified in the corresponding locations in the deployment folder. A list of files that must be updated based on the projects you modified can be seen below: • LPMParser o If you modified the LPM Parser, you must export the LPM Parser into a .JAR file and place it in deployment/Shared/ParserPool. o To export the LPM Parser into a .JAR file, right-click on the LPM Parser project in Eclipse and choose Export > JAR File • LPMNormalizer o If you modified the LPM Normalizer, you must export the LPM Normalizer into a .JAR file and place it in deployment/Shared/NormalizerPool. o To export the LPM Normalizer into a .JAR file, right-click on the LPM Parser project in Eclipse and choose Export > JAR File • ProvenanceClassifier o If you modified the Provenance Classifier, you must export the Provenance Classifier as a .JAR file and place it in deployment/Shared/bin. o To export the Provenance Classifier into a .JAR file, right-‐click on the ProvenanceClassifier project in Eclipse and choose Export > Runnable JAR. When prompted about Library handling, choose the “Package required libraries into generated JAR” option. • ProvenanceCommon o If you modified the Provenance Common project, you must export the Provenance Common project as a .JAR file and place it in the lib directories for (ProvenanceClassifier/lib) both and ProvenanceClassifier ProvenanceVisualizer (ProvenanceVisualizer/WebContent/WEB-‐INF/lib). o Then, you must rebuild both the provenance classifier and provenance visualizer and follow the instructions for deploying those projects. 77 • ProvenanceVisualizer o If you modified the Provenance Visualizer project, you must copy the contents of the WebContent folder in the ProvenanceVisualizer folder to the deployment/Shared/bin/tomcat/webapps/NavPro folder. Once you have updated the files necessary for your changes, you can use make to create the deployment packages using any of the following commands: • make all: Build all deployment packages. o Note: You can only build the OS X deployment package when running OS X. • make osx: Build the OS X deployment package. o Note: This command will only work on OS X • make linux: Build the linux deployment package. • make windows: Build the windows deployment package. 78