1
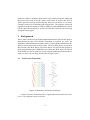
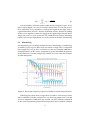
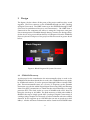
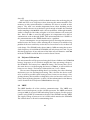
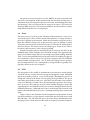
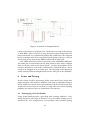
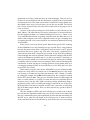
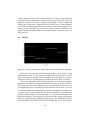
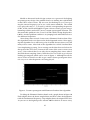
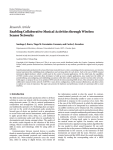
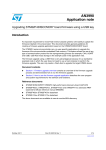
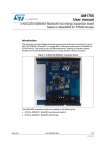
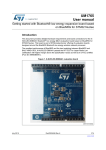
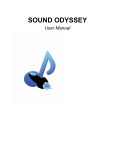
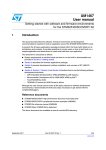
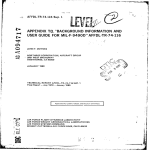
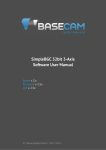
ECE410L Project
A Music Instrument Training Device
C ODY H ARRIS
DigiPen Institute of Technology
April 18, 2015
1
Special Thanks
Special thanks to Christopher Theriault for getting me all the parts as
quickly as you could. Also for always helping as much as you can. I would
also like to thank Jeremy Thomas for helping me when I was stuck with my
Matlab code. You also did a great job in advising me through this semester
in both project class in other classes. I would like the thank Lukas P Van
Ginneken for always helping in any way you can. You work very hard to
learn and understand each student project, so it is greatly appreciated. I
would also like to give thanks to Claude Comair for making this experience
possible for me.
2
Abstract
This paper presents a hardware implantation of a sound to MIDI
converter. Using techniques such as Harmonic Product Sum to find
frequencies in tandem with an FFT to gain higher precision. A Piezo
sensor will be used to get better quality sound data from acoustic
instruments. Aside from precision, the use of HAL drivers will be
discussed to allow programming in C++ on the STM32F4 ARM chip.
Power consumption is another major topic that will be discussed, as
well as sending data wirelessly with XBEE.
1
Introduction
There have been many professional pieces of software made to help people
learn how to play instruments. Most software such as Rocksmith[1] or
Sythesia[2] only work for specific electric instruments. The purpose of this
project is to make training software available for all instruments. By combining Piezo, a high performance microcontroller, and Fast Fourier Transforms
this project can make instrument learning software available to anyone and
any instrument. This project will also cover wireless transmission using
XBEE. This paper will also discuss the techniques used to get more accurate
data, such as Harmonic Product Sum from the Fast Fourier data.
A finished product will look
something like the figure 1. It will
be a small device that can clip on
to an instrument. It will then pick
up the vibrations from the instrument using the Piezo sensor. The
built in processor will then calculate
the note that the player of the instrument is playing and send it out
wirelessly in MIDI format. What
Figure 1: Similar design look
this means is that any instrument
learning software that Uses MIDI format can be used with this hardware.
Aside from the hardware there will be custom software made by Shivam
Kumar. Shivam is a Software Engineer student at DigiPen and will be
making software as part of his senior project. This software will work with
the hardware to help teach the player how to play their instrument. The
software will be developed for Windows operating system with the hope
of supporting Android, Mac and Linux in the future. One mode of this
3
software will have random sheet music notes scroll in from the right and
the player will need to hit the correct note before it reaches the far left.
This is just one of many modes that the software will allow. A few more
examples consist of ear training and song practice. The software will work
separately from the hardware and be usable by other MIDI devices but it
will be specially designed to work well with the hardware that is being
designed in this paper.
2
Background
This section will discuss the background information needed in this project.
Information on what a Fast Fourier Transform is and how it’s used. An
algorithm called Harmonic Product Sum is used to find fundamental frequency and is discussed in this section. The last thing that is covered in
this section is the HAL driver. The HAL driver was used in this project to
make programming the STM32F4 easier. What the HAL driver is and all
the benefits of it are covered here. If you already understand what all these
topics are then you can skip ahead to the Design section.
2.1
Fast Fourier Transform
Figure 2: Illustration of Fourier Transform
A Discrete Fourier Transform takes a signal and breaks it down into sine
waves. The equation can be seen here:
4
n =0
X [k] =
∑
x [n] ∗ e
− j∗2∗πn∗k
n
(1)
n = N −1
N is the number of discrete points and k denotes frequency space. If we
take a look at figure 2 we can see on the left that there is a few sine waves.
If we add all the waves together we will get the signal on the right. This is
a good illustration of how a Fourier Transform works. Instead of adding
all the waves together it takes the signal on the right and breaks into more
simple sine waves as seen on the left. FFT stands for Fast Fourier Transform
which is just a faster algorithmic way to do a Discrete Fourier Transform[3].
2.2
Windowing
An important part of taking multiple Fourier Transforms is windowing.
A window is just a given data array for which a single FFT is computed.
For example let’s say we have a sound wave that was sampled 2,048 times.
Using Equation 1 an FFT can be computed to get the individual frequencies
of the sound wave. In this example the window size is the entire data sample
of 2,048 data points.
Figure 3: Shows the frequency response of different windowing functions
What happens when there is larger data set and we want to have better
time resolution? For this example let’s say that our sample size is 16,384
and was sampled at 1,024 times per second. An FFT could be computed
on the entire 16,384 data points but the frequencies that would be returned
5
would not be very accurate because the FFT was computed over a 16 second
period. Instead of using 16,384 data points as a window sizes a smaller
window can be used to get better time resolution. If the 16384 sample is
divided into window sizes of 1024 then a time resolution of one second
can be achieved. A drawback of having the window size too small is that
frequency resolution decreases.
Figure 4: Example of what windowing functions look like
Another important part of windowing is convolving it with a periodic
function. Figure 4 shows some examples of what a window function looks
like. These window functions are convolved with the sound data to help
in two ways the resolution and the Spectral leakage. Figure 3 shows the
frequency response of a few different types of windowing functions. In this
graph we have the main lobe which determines the frequency resolution.
The wider the main lobe the wider the frequency peaks become. If we
take a look at figure 3 we can see that the windowing function BlackmanHarris has a wide main lobe. This function could be a problem if you need
more frequency accuracy. Spectral leakage is when additional frequency
components get added to the signal, usually in the higher frequencies. If we
look back at figure 3 we can see the side lobes. The higher the side lobes the
more spectral leakage there will be. So if a noisy system is a problem then it
is best to choose a windowing function with smaller side lobes. If we take a
look at the Blackman-Harris again. We see that there is relatively low side
lobes, meaning that it will have less noise at the cost of accuracy.
2.3
Down Sampling
Down sampling is used to reduce the amount of data in a given signal. An
equation is given for down sampling here:
6
L −1
y[n] =
∑ x [n + M]
(2)
k =0
Where L is the length of the data and M is each point that will be kept.
For example if M is equal to two then every other data point will be kept
and the other data points will be removed there by down sampling the data
to half the size. The output is a new data set with less data points.
2.4
Harmonic Product Sum
Harmonic Product Sum[4] is an algorithm used to find the fundamental
frequency with fewer errors. The algorithm works by taking the data received from the FFT and down sampling it into five different samples. The
FFT is down sampled by a factor of two each time so that the fundamental
frequency will line up with its harmonics. Once all the down samples are
made they will be multiplied together. The fundamental frequency will
be amplified because the down sampled harmonics will line up with the
fundamental frequency. This is because the harmonics are multiples of the
fundamental frequency. After this process is done the highest peak should
be the fundamental frequency. Figure 5 illustrates how the algorithm works
[5].
Figure 5: Illustration of Harmonic Product Sum algorithm
7
In figure 5 we can see that windowed data is input into the FFT. The
output of the FFT is then down sampled five times. When multiplying
all the down samples together we get a higher peak in the fundamental
frequency and the other peaks become small or go away completely due to
multiplication by fraction or by zero.
2.5
YIN Algorithm
In my project I used frequency space to find the fundamental frequency.
There is also a time domain approach to this problem. YIN is an example of
an time domain algorithm for finding the fundamental frequency. Frequency
space was described in the Fast Fourier Transform section above. Time
domain is the signal that is left in amplitude versus time on a plot. Working
in time domain is just working with the original signal.
YIN works by finding the periodic signal. To do this it uses a method
of auto correlation to find where the sound wave is periodic. To do this it
takes a duplicate of the signal sample and moves the signals across each
other adding there values together. This creates a second plot referred to
as the lag graph. This lag graph can then be used to find the fundamental
frequency. I don’t want to go into too much detail on this algorithm because
it is not the one that I implemented. To learn more about this algorithm you
can take a look at a paper named YIN, a fundamental frequency estimator
for speech and music [6].
This algorithm is not perfect and it also has problems with octave errors.
The main reason that I didn’t choose to use this algorithm was because I
didn’t see a benefit to implementing this over the frequency space version
and I had already started working in frequency space. I just decided that it
would be best to keep working on the method I had already started. There
seemed to be a lot more resources on the Frequency space approach.
2.6
HAL Driver
HAL stands for Hardware abstraction layer [7]. This allows the same code
of one chip to work with any chip in that family. For example since I am
using the STM32F4 the code that I write will work for any STM32 family.
This driver also allows to code in C++ instead of C. HAL drivers also have
features of error handling that allow it to be programmed in IDEs such as
visual studio.
8
3
Design
The figure 6 below shows all the parts of the project and how they work
together. The Piezo connects to the STM32F4 through an ADC (Analog
to Digital Converter). The XBEE connects to the STM32F4 through UART
(Universal Asynchronous Receiver and Transmitter). The XBEE that is
connected to the computer will talk to it using the computers com-port.
Power management is handled through battery circuitry. the design allows
for the device to be powered from battery or USB port used on the STM32F4Discovery board. Each piece of the project will be discussed in greater detail
below.
Figure 6: Block Diagram Of System Overview
3.1
STM32F4 Discovery
As discussed in the introduction the microcontroller that is used is the
STM32F4.The breakout board that is used is the STM32F4 Discovery made
by STMicroelectronics. It can be powered through USB or external GPIO
pins. This microcontroller runs at 1.8 V to 3.6 V. It operates on the Thumb2
instruction set with the added Digital Signal Processing (DSP) and Floating
Point Unit (FPU) instruction set. Built into the microcontroller is a single
precision FPU. The clock works at a rate of 50 MHz with a PLL that can
bring the clock up to 168 MHz. The flash memory is 1Mb with 192Kb of
SRAM. It has up to 3 high speed ADC (Analog to Digital Conversion) of
2.4 Msps (Mega Samples Per Second) at 12 bit resolution with 24 available
channels. It also supports up to 2 USARTs that can run at speeds up to 10.5
Mbit/s. All this and more information and be found in the STM32F4 data
9
sheet [8].
Since most of this project is DSP to find the notes that are being played
a DSP and FPU were a big factor when choosing this microcontroller. The
memory on this microcontroller is sufficient for what is needed on this
project. The ADC was another important factor when deciding on the
microcontroller because it needed to be quick enough to handle the standard
audio sampling at 44,100 KHz with a decent resolution. Although normally
audio is sampled with 16bit or higher a 12 bit resolution will work just
fine. Since an XBee is used for this project it is important to be able to
communicate with it through UART. This microcontroller has 2 UARTs so
the communication to the XBEE should not be a problem.
Power consumption was an important part of choosing this microcontroller because the device will be running off of a battery. It would be a big
problem if the user could only use the device for one hour or less in-between
each charge. The STM32F4 only draws 230 uA/MHz meaning that at max
clock frequency of 168 MHz the STM32F4 will only draws 38.6 mA. To put
this into perspective if you take one of the little coin cell batteries with 200
mAh the STM32F4 would be able to run for about 5 hours.
3.2
Polymer Lithium-ion
The microcontroller will be powered using the Polymer Lithium-ion GSP062530
battery. It operates at 3.7v which is roughly the same operating voltage as
the STM32F4. The battery has a 400 mAh rating. This means that even if
the entire device was discharging the battery at 100mA, it still could last 4
hours on one charge. The battery’s dimensions are 5 x 25 x 35mm.
The two most important things that I was looking for when choosing
this battery was size and Amp hour rating. This is because the device needs
to be as small as possible while lasting at least 8 hours on one charge. Also,
getting a battery that would be rechargeable so the end user does not have to
worry about replacing batteries so often. All the information for the Battery
can be found in the Li-Polymer GSP062530 data sheet [9].
3.3
XBEE
The XBEE handles all of the wireless communication. The XBEE uses
802.15.4 stack and operates on the 2.4 GHz spectrum. The XBEE can broadcast up to 300ft. It accepts UART and analog signal as inputs. For this project
I am be using UART to communicate between the STM32F4 and the XBEE.
The supply voltage is between 2.8 to 3.4 Volts which matches the STM32F4.
The current draw is 45 mA for transmitting data.
10
My greatest concern for power was the XBEE. I am only concerned with
the power consumption of the transmission and not how much power is
consumed from receiving data because I am only transmitting data from
the hardware. The receiving end has its own power source. The reason for
choosing XBEE is because it is already available in the lab and I have already
implemented it before on a recent project.
3.4
Piezo
The Piezo sensor is used to get the vibration of the instrument. A Piezo sensor is made up of a Piezo electric material that produces a voltage whenever
pressure is applied to the material. When the instrument is played it will vibrate this vibration changes the air pressure that your ears pickup as sound.
This same pressure that is transferred to the air will also be transferred to
the Piezo sensor. The Piezo sensor can handle up to 12mA at 12V. This is
based on what resistance value is being used[10].
Initially I thought that just attaching the piezo sensor to the ADC on the
STM32F4 with a large enough resistor would be enough. This approach only
got me in the 50 mV range and was not enough to get good readings from the
ADC. To solve this problem I built an Op-Amp circuit to amplify the signal. I
also needed the values to always be a positive voltage because the STM32F4
cannot handle voltages below -.5V. To make the voltage always positive
the Op-Amp references 1.5v coming from a voltage divider as ground. The
Op-amp circuit can be seen in figure 7.
3.5
PCB
For this project to be usable on instruments it needed to be much smaller.
I started out my second semester trying to redesign the entire STM32F4
Discovery board to make it a very small design. Through the process of
doing this I discovered that it was not going to be possible in the given
time frame that I had to work on it. Also this is the first time I have tried to
create a PCB design so I didn’t have the background to put into such a huge
task. So to save time and give myself a more reliable design to work with
i decided that it would be better if I just created a daughter board for the
STM32F4 Discovery. Although this is not a small design like what the end
product should look like it gives me a working prototype that can be built
upon.
Figure 7 shows the schematic for the daughter board that that I created.
On the board there is a lipo battery connection spot for both power and
JST-XH cable. The JST-XH cable gives all of the charge information from
the battery. The circuit connects this cable to a battery tester that will buzz
11
Figure 7: Schematic of Daughter Board
whenever the battery is getting too low. The buzzer i’m using for this project
is AOK-BL8S. This is in place to stop the battery from going below the
battery threshold. For a commercial product this would have to be designed
better to shutdown the device instead of just beeping at the user. Also on
the board is the op amp circuit, XBEE module and an audio jack.
The XBEE contains just basic connections to the STM32F4 UART pins.
The audio jack is connected to the op-amp circuit to allow either a plugin
from an electric violin or the Piezo sensor. To solve the problem of not
having a small device to fit on the violin I made a cable that allows a Piezo
sensor to be plugged in as an audio jack. The Op-Amp circuit discussed
earlier connects from the daughter board to the ADC pin on the STM32F4.
4
Issues and Testing
In this section I will be discussing all the issues that I have had in this
project and how I solved them. Methods used such as in Matlab or help of
visual studio to overcome most of the problems will also be discussed. Not
all issues have been fixed so I will be covering what my current standing
problems are and how I plan to tackle them next semester.
4.1
Prototyping in Visual Studio
Using Visual Studio became a great help after working with Keil. I was
facing problems with bugs in Keil that I was constantly looking on the
internet to fix. For example there was a problem with variables getting
12
optimized out so they would not show up in the debugger. This was an easy
fix but it is just small details like this that make working in the Visual Studio
environment nicer. The main reason that I switched to Visual Studio was
that I didn’t have to pay a lot of money to use the use the IDE. The school
has a license for Keil so the only why that I could work on my project was if
I was at school.
An Issue at first when working in Visual Studio was that I had to use the
HAL library. The HAL library has many advantages as discussed before
but the biggest problem was understanding how to use it. There is not
very much documentation on getting started in with the HAL driver so it
took a while to figure it out. Once I figured out how to get it working then
everything became a lot easier and there was no known downfall to using
Visual Studio.
Some issues were more about speed. When I first got the FFT working
on the STM32F4 it was only running once per second. This is a big problem
because that means that there is a big delay between when a note is played
and when the device picks it up. Not only is the delay a problem but if
someone hits more than a single not per second. To try to fix this problem I
when through and tried to optimize all the code that worked with the FFT
such as the Harmonic product sum. I was able to get the FFT running at 2
times per second which was a lot better but this was still not fast enough.
eventually I discovered that I was not using the FPU to do the floating point
calculations. It turns out that in a settings panel in visual studios there was
a setting for turning off FPU. So I switched it to use the FPU and I was able
to get 5 FFT Per second.
When I first setup the ADC for the STM32F4 I was just reading in 4096
samples in a loop. Since my sample rate was 41000 that means every loop I
was waiting .1 seconds just to get the data from the ADC. I found .1 seconds
by taking the sample rate 41000 and dividing it by the samples I needed
for the FFT which is 4096. This gave me 10 which means I could sample 10
times a second which is .1 seconds. To make this faster I setup DMA (Direct
memory access) for the ADC. DMA works by taking information from a
peripheral such as ADC or UART and storing it without the use of the CPU.
By using DMA I am able to calculate an FFT at the same time as collecting
the Next 4096 sample chunk. This was able to boost my speed to about 7
FFT per second.
The max number of FFT’s that I can calculate per second is 10. At first I
just felt that the algorithm could not get any faster. I tried on last thing and
that was commenting out each major block of code that did something for
the FFT to see what was the bottle neck of the process. It turns out most
of the stuff that I believed would take up most of the time was not making
13
a major difference when I was commenting it out. There was one block of
code that when I commented it out the speed was greatly increased. The
problem was that it was just a simple loop through an array which held
nothing that seemed to be computation heavy. There were a couple doubles
in the code and I tried switching them to floats. After this the program was
running at the full 10 FFT’s per second. It turns out that the FPU does not
support doubles and the software simulated double calculations are very
process heavy.
4.2
Matlab
Figure 8: Custom spectrogram without Harmonic Product Sum algorithm
Matlab was used for most of the prototyping done on this project. Using
Matlab allowed me to speed up the design and learning process of this
project by taking advantage of the math libraries. It also gave me a way to
visualize the data so I could quickly determine what the data was doing.
One of the algorithms that I implemented was a custom spectrogram.
Matlab has a built-in spectrogram function but I only wanted to visualize
the frequencies that were important to me. So I decided to write my own
spectrogram function. The purpose of this function was to take a .wav file
as input then find the fundamental frequency and graph the frequencies
over time. The second function that was made in Matlab was the Harmonic
product Sum the purpose of this algorithm was one part in finding the fundamental frequency. This function is used inside of the custom spectrogram
function to help find the fundamental frequency. The Harmonic Product
Sum algorithm is described in detail in the background section of this paper.
14
Matlab as discussed in the design section was a great tool for helping
me prototype my design. One problem that I was running into with Matlab
is that I have octave errors. My test case for checking to see if I was getting the correct frequency was to use a cello tuner sound file. The sound
wave plays the notes C, G, D and A, with the corresponding frequencies
65 Hz, 98 Hz, 146 Hz and 220 Hz. Figure 8 shows what I get just using a
hamming window and an FFT on my custom spectrogram function. The
first noticeable problem is the C note at 65 Hz which is being displayed as
130 Hz. Another problem with this is its jumping back and forth between a
few different frequencies.
After doing some research I came across Harmonic Product Sum. How
this algorithm works was discussed in the background section. After applying this algorithm I was still having a lot of trouble because there were still
many octave errors. After look at the algorithm for a while I realized that
I was implanting it wrong. I was zeroing out the data that was below the
first peak of the FFT. Once I removed this some of the octave errors went
away. I also realized that I was only down sampling three times when I
should be down sampling 5 times. With these fixes I was able to get a decent
looking spectrogram which can be seen in figure 9. Although not all the
octave errors are fixed I was able to get a much cleaner spectrogram where
it is easy to see what frequencies are being played.
Figure 9: Custom spectrogram with Harmonic Product Sum algorithm
To debug the Harmonic Product Sum I used a graph shown in figure 10.
Each subplot shows the down sampled data and how it lines the harmonics
with the fundamental frequency. Top subplot shows the original FFT data.
As you can see the highest peak is around 140 Hz which is an octave away
15
from the correct fundamental frequency. The next 3 subplots show the down
sampled data. The last subplot shows the output data. You can see how all
the harmonics aligned to the fundamental frequency. Now we are getting
the correct frequency of 65 Hz.
Figure 10: Graph to help debug Harmonic Product Sum
Conclusion
I was able to get everything that I wanted into the project and working better
than I could have imagined. The project is at a running state and a good
stopping point for this project. All that is needed to make this a commercial
product is simplifying the PCB design to get it into a small slick device and
optimizing the performance for battery usage. Soon this could be a device
used to help many new instrument players to learn their instruments.
Parts
Part
StM32F4-Discovery Board
Piezo Element
XBee 1mW Wire Antenna
Lithium-ion battery 400mAh
FTDI chip
AOK-BL8S
Part Number
STM32F4DISCOVERY
SEN-10293
WRL-08665
PRT-10718
B00MCC25WA
N/A
16
Distributor
STMicroelectronics
SparkFun
SparkFun
SparkFun
Amazon
fpvmodel
Price
$14.88
$1.50
$24.95
$6.95
$7.49
$3.68
References
1. U. nationwide in-home placement study, Rocksmith. Ubisoft Entertainment, 2013.
2. CNET, Synthesia. CBS Interactive Inc., 2012.
3. P. Steven W. Smith, The Scientist and Engineer’s Guide to Digital Signal
Processing2011. California Technical Publishing, 2011.
4. K. Lee, Automatic Chord Recognition from Audio Using Enhanced Pitch.
Stanford University.
5. P. de la Cuadra, PITCH DETECTION METHODS REVIEW. Stanford
University, 2005.
6. H. Kawahara, YIN, a fundamental frequency estimator for speech and music.
Wakayama University, 2002.
7. ST, UM1725 User Manual. ST, 2014.
8. ST, RM0090 Reference manual. ST, 2014.
9. L. GREAT POWER BATTERY (H.K.) CO., GSP062530 Specification.
GREAT POWER BATTERY (H.K.) CO.,LTD, 2012.
10. M. Manufacturing, Piezoelectric Sound Components. Murata Manufacturing, 2013.
17