1
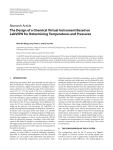
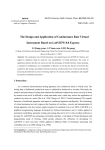
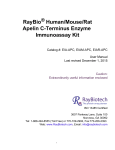
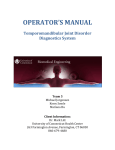
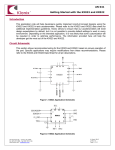
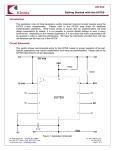
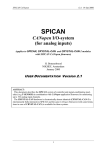
Hindawi Publishing Corporation
Journal of Automated Methods and Management in Chemistry
Volume 2007, Article ID 68143, 7 pages
doi:10.1155/2007/68143
Research Article
The Design of a Chemical Virtual Instrument Based on
LabVIEW for Determining Temperatures and Pressures
Wen-Bin Wang, Jang-Yuan Li, and Qi-Jun Wu
Department of Chemistry, College of Chemistry and Chemical Engineering, China West Normal University,
Nanchong 637002, Sichuan, China
Received 16 December 2006; Accepted 22 February 2007
A LabVIEW-based self-constructed chemical virtual instrument (VI) has been developed for determining temperatures and pressures. It can be put together easily and quickly by selecting hardware modules, such as the PCI-DAQ card or serial port method,
different kinds of sensors, signal-conditioning circuits or finished chemical instruments, and software modules such as data acquisition, saving, proceeding. The VI system provides individual and extremely flexible solutions for automatic measurements in
physical chemistry research.
Copyright © 2007 Wen-Bin Wang et al. This is an open access article distributed under the Creative Commons Attribution License,
which permits unrestricted use, distribution, and reproduction in any medium, provided the original work is properly cited.
1.
INTRODUCTION
Measuring instruments have gone through several stages in
their development: analog meter, discrete component parts
(DCP) instruments, digital instruments, intelligent instruments, and have now reached the stage of the virtual instrument (VI) [1]. VI is the result of the close combination of
modern electronics, transducers, instrumentation, and computer techniques. The hardware of the VI exploits the capacity of the transducer, signal condition circuit, and computer
resources, and so forth. Under given hardware conditions,
the software is the VI’s key component. Given different softwares, the VI can transform into different instruments. We
might say the software is the instrument [2]. LabVIEW is a
graphical programming language developed by National Instruments and it has great power and utility. It is possible
for amateur programmers to design programs of high quality by using LabVIEW, and it suits the thinking methods of
scientists and engineers so that it can be honored with the
name of engineering language. Nowadays, it has wide application in the fields of aerospace, communications, automobile engineering, biomedicine, and so forth. However, to our
knowledge [3], it has not yet been reported on frequently in
the field of chemistry.
Temperature and pressure are two very important parameters in many fields of research, including chemistry.
Especially in chemical thermodynamics and the chemical
industry, we can acquire vital information and guide production by measuring temperatures and pressures. Some
important physical chemistry parameters, such as enthalpy,
entropy, reaction rate, molar mass, can be obtained by measuring the change of the two parameters. However, owing to
the special features of chemistry, these physical parameters
cannot be obtained directly from the experimental values of
temperature and pressure. In general, these experimental values must be processed at a deeper level according to the principles or laws of chemistry, such as converting by formula,
plotting, finding equations that obey specified laws. In many
situations, the value of temperature and pressure can indicate to the researcher whether the reaction is in process. Obviously, a normal instrument has difficulties in achieving that
effect. Moreover, when using a standard instrument, the researcher has to process data by hand. This not only wastes
time, but also easily causes human measurement error. In
this paper, LabVIEW 7.0 Express-based VI for determining
temperatures and pressures is developed by using temperature and pressure sensors, a signal-conditioning circuit, a
DAQ card, or standard chemical instrument. This VI is able
to complete the measurement of a system’s temperature and
pressure automatically and obtain results duly. The results
are satisfactory.
2.
THE CONFIGURATION OF THE VI SYSTEM
The configuration chart for the VI system is in Figure 1.
The signals of chemical reaction are analog signals converted by sensors, such as temperature, temperature difference, pressure, pressure difference. The analog signals are
Temperature
The
system of
chemistry
reaction
Pressure
Signalconditioning
circuit
Sensors
Temperature
difference
DAQ
card
Standard chemical Serial port
instruments with
serial port
Pressure
difference
LabVIEW platform
Journal of Automated Methods and Management in Chemistry
Computer
2
Figure 1: Configuration for VI system.
−15 V
R1
3.2 K
−9 V
1
A1
AD620
Rt
Pt100
2−
LM339
IC
R3
100 Ω
R∗
3+ 8 7
R2
3.2 K
W1
5K
C24
3.3 μ
6
R4
13 K
W2
10 K
R5
11 K
1
3 4 5
+
C23
2.2 μ
2
4
5
+9 V
R6
2K
C22
0.01 μ
A2
LM741
−
6
Out
7
R7
2K
+15 V
Figure 2: Signal-conditioning circuit of temperature.
converted into digital signals in the DAQ card or by standard chemical instruments and are sent to a computer.
Finally, the digital signals are processed on the LabVIEW
platform.
2.1. PCI-DAQ card method
The PCI-DAQ card method was the earliest method used in
the construction of the VI. The method utilizes a DAQ card
to convert analog signals to digital signals, so that a computer
can process the various analog signals. It provided a way of
constructing the VI by using the computer’s bus, input devices, output devices, software, and so on. It is still popular
in the world of measurement and control on account of its
wide use and applicability for use in various laboratories and
teaching sectors.
The analog signals from normal sensors are very weak, so
they must be preprocessed before entering the DAQ card by
methods such as impedance conversion, amplification. The
signal-condition circuit of a temperature sensor made by the
author is shown in Figure 2. A DC bridge is made up of a
temperature sensor, Pt100, and three impedances, and sends
converted DC signals, caused by the change of temperature
signals, to the instrument amplifier AD620 for amplification. The bridge power source comes from 1.5 mA constant
current produced by the operational amplifier. AD620 is a
monolithic instrumentation amplifier based on a modification of the classic three-op-amp approach. Monolithic construction and laser wafer trimming allow the tight matching
and tracking of circuit components, thus ensuring the high
level of performance inherent in this circuit [4]. The LM399,
in Figure 2, is a precision, temperature-stabilized monolithic
offering high-quality reference voltage to the fifth pin of
AD620. The amplified signals are sent to a second-order filter circuit via the sixth pin of AD620, and then are sent to a
channel of a multifunction DAQ card, PCI-2005, to convert
analog signals to digital signals. PCI-2005 is made by Beijing
Art Corp. and it has 16 bits, 16SE/8DI, ±10 V input range,
connects to computer with PCI bus, and the driver can operate it by calling LabVIEW’s function [5]. Figure 3 shows the
program of the PCI-2005 driver realization and dual-channel
DAQs, which is used to determine the constant of the reactive rate by the decomposition of peroxide. In order to realize
the PCI-DAQ driver, we use call library function (CLF) node
in LabVIEW, implement A/D converters for corresponding
temperature and pressure, at the same time, save text file in
a text model. The other sensors’ signal-condition circuits are
similar to the temperature circuit, the only difference lying in
amplifying times and reference voltage.
2.2.
Serial port method
Serial port communication is a common method of communication between computers or between computers and
peripheral devices. This method has the advantage of generalized use, but the speed of data transfer is rather lower,
so it suits a measurement system that does not demand a
high data transfer speed. There are very few testing systems
in chemistry experiments requiring high-frequency signals,
so using the serial port method to acquire data is not only
making the best of laboratory resources, but also using traditional instruments to upgrade intelligent instruments.
Wen-Bin Wang et al.
3
[0] ”data acquisition”: value change
3[0 . . . 6]
Read device proAD not empty
100
010
I32
I32 I32
0
1024
U32
0
DBL
0
U32 U32
I32 I32
True
x
E:\data
0.30518
1024
÷
x
y = 0.033196∗ x
y
+128.524452;
÷
x
y = 2.793751∗ x
y
−11198.91;
Pressure data
Lively temperature
DBL
?
TF
Data saving
abc
◦C
512
+
Tem. data
DBL
Lively pressure
Time
97038.3
Time DBL
x
i
x
1000
TF
i
Figure 3: Program of PCI-2005 driver and dual-channel DAQ realization.
False
Sample
abc
=
0
VISA
Error out
!
?
i
C
I/O
1200
8
VISA
serial
VISA
CLR
0
14
VISA
abc
[U8]
SGL
R
255
0
10000
?
4
Experimenter
5
abc
6
Time
abc
1/89
10 : 21
+
x
Exit
TF
x
x
+
1000
10
+
Data logging Tem. diff.
TF
?
7
9
10
11
True
÷
x
+
Time interval
1000
1000
100
11
+
i
x
+
8
U16
Temperature difference
DBL
[SGL]
1, default
2 +
+
3
?
+
+
+
1000
x
100 x
10
x
−1
Tem.
x
÷
+
100
Temperature
DBL
Figure 4: DAQ program of serial communication.
According to communicating protocol, we can acquire
the experiential data by using correlation functions in
LabVIEW [3, 6]. Figure 4 shows a DAQ program of serial
communication using the digital temperature-measuring instrument for determining molar mass with freezing point depression. According to the communicating protocol by which
data is sent, invoke the VISA node in LabVIEW to obtain initialization of the serial port, VISA Read, and VISA Close, and
so forth, then programe for data acquisition, display, saving,
and so forth.
3.
DESIGN OF PROGRAM FOR VIRTUAL INSTRUMENT
3.1. Design for control panel
The control panel of the virtual instrument is an interface
between user and computer. Besides friendly interface and
easy control, the corresponding test function can be started
up by a simple manipulation. It should also be able to finish
user’s task successfully. Software is a key section of the VI.
Given different softwares, the VI can have different functions.
The author designs the program by the module method
for convenience in development and call. Figure 5(a) shows
the VI control panel where four physical chemistry experiments are displayed. The program is designed by selecting
different events and a corresponding VI panel will open and
enter the chemical testing system as long as we click the
corresponding icon, for instance, by clicking the molecular
weight icon, the panel will show as in Figure 6. The program
provides a helping function in that the user can get help by
lighting the help icon or keeping the cursor on a few seconds, when some helping textual material will display to describe the function of the modules and give the user some
4
Journal of Automated Methods and Management in Chemistry
[0] drawing the binary metal dia.
TF
Type
False
TF
1
Value
Drawing the binary
? metal diagram with
DAQ method.VI
Help
TF
(a)
TF
Select
method
Select
method
TF
TF
(b)
Figure 5: (a) Operation panel of the VI and (b) program for operation panel.
Figure 6: Front panel for determining molar mass with freezing point depression.
information about the experiment. It is possible to select the
method of acquisition, DAQ card or serial port, via select
icon. The exit icon is used to exit from the VI testing system safely. Figure 5(b) is the block program of the VI, while
a loop is used to ensure that the program will check continuously. Some sub VIs that were previously made and ran
well can be called up by selecting the event. This programing
method is convenient for extension and modification.
3.2. Design of program for public sub-VI
There are different tasks and data processing methods in different chemical testing systems, but the basic procedures,
data acquisition, data filtering, curve fitting, real-time displaying, calculating, and generating the report of results are
the same. Therefore, one program can be made as a shared
sub-VI for different chemical VIs to use. During the design
program based on LabVIEW, the sub-VI is a key element
to modularize and layer the modular program and it corresponds to function or subprogram in text-based programing languages. User can call each VI as a sub-VI [7], and the
number of sub-VIs is limitless. Moreover, a sub-VI can be the
subroutine itself. By using a sub-VI during the development
of a program, we can save code, reduce developing time, and
raise efficiency. It is also easy to debug and manage.
3.2.1. Sub-VI for redisplaying data
To check or compare with acquired data expediently, the author designed a data-redisplaying icon on every subpanel.
Figure 7(a) is a picture of a data-redisplaying sub-VI
panel. Clicking the redisplay icon, a dialog box will allow user
to select a file to read. User can redisplay acquired data several times until he clicks the exit icon. Values of the x-, yaxes are shown in the region of the cursor. The curve setting
icon is used to set the curve’s type, color, and thickness, and
enlarge some segment of the curve. The print icon is used
to print the curve on the panel. Figure 7(b) is a program for
a data-redisplaying sub-VI. There are two case structures in
the whole loop, the uppercase structure is used to read an
acquired data file and send the data to waveform graph for
display, and the lowercase structure is used to print the curve
Wen-Bin Wang et al.
5
True
Redisplay temperature difference
N
12.3
TXT
0
i
0
TF
Redisplay
True
Print
TF ?
100
i
(a)
Exit
TF
Redisplay temperature difference
0
Wave form graph
(b)
Figure 7: (a) Panel of sub-VI for redisplaying and (b) program of sub-VI for redisplaying.
on the panel. The mechanical natures of both icons are set
as Latch When Pressed, and both default values are false. To
avoid mistakes in reading a data file, the format of the storage
file should be unified.
3.2.2. Sub-VI for fitting curve automatically
In a general way, the testing system of the chemical VI is able
to acquire plentiful data at tremendous speed, but the whole
data is discrete. During data processing, we sometimes need
to fit discrete data to a curve, obtain its equation, and get
intersection points of some curves, for example, we need to
get the intersection points of some curves in drawing the binary metal diagram and determining molar mass with freezing point depression and we need the curve equation in measuring the surface tension of a solution. There is no function
to obtain an equation directly, so we have to program it by
ourselves via calling correlated functions in LabVIEW.
The program for curve fitting and obtaining equations
automatically is shown in Figure 8. The testing data is automatically fitted, respectively, in given fitting models, and the
mean square errors (MSEs) of fitting effects are sent to an
array, then according to the least MSE, computer confirms
the best fitting model or fitting order. The fitting models are
linear fitting, exponential fitting, and general polynomial fitting, which are found in functions “Mathematics” Fitting,
and the comparing array elements are achieved depending
on Array Max & Min function. When making a curve fitting
in case structure the corresponding fitting result displays instantly. The program sets a sub-VI of writing equation again,
which has a function for converting the best coefficients to
strings, and write expressions f (x) and y = f (x), which have
different functions in different conditions, for example we
must use the form f (x) in the function Eval y = f (x).VI or
Integration.VI. If we use the form y = f (x) [8], the program
cannot run. However we have to give the form y = f (x),
when we write the equation. Now we can solve the problem
by connecting the right output terminals in different circumstances.
Due to the limitations of this paper’s length, other common modules such as data acquisition, real-time dynamic
display, elimination of excess data, and curve fitting for the
construction of chemical VIs are not discussed.
3.2.3. Property setting for sub-VI node
After developing and debugging the sub-VI, we can create a
property node and call it up as a module when we need. Every
sub-VI has a connector pane, and every connector pane has
several terminals. The programmer simply connects the controls or indicators with terminals but need not worry about
the internal structure of the sub-VI. In a sense, input and
output terminals correspond to formal parameter and actual
parameter in C language, respectively. Select an appropriate
terminal pattern for the sub-VI by right clicking the connector pane. There are 36 kinds of patterns to select or edit by
increasing or decreasing terminals [7]. For example, the subVI for fitting curve has three input and two output terminals,
which are connected to an array of fitting coefficient control,
digital precision control, model of fitting control, and an expression of equation indicator for f (x), y = f (x), respectively.
When LabVIEW calls a sub-VI, ordinarily the sub-VI
runs without displaying its front panel. But some sub-VIs
need to display their front panels when called and to close
their front panels after being called, such as the sub-VI for redisplaying data. There are two ways to set its properties. The
first way is to select VI properties, select window appearance
6
Journal of Automated Methods and Management in Chemistry
False
[DBL]
y
f (x)
1
≥
[DBL]
x
?
2
Precision
I32
0
abc
2
0
3
?
N
Writing
equation
i
2
+1
abc
Best fit
[DBL]
−1
−1
y = f (x)
Fitted data
I32
DBL
Raw data
DBL
Figure 8: Program for curve fitting and obtaining equation automatically.
Table 1: Measurement results.
Sample
Benzene
Cyclohexane
Cyclohexene
Sample
quality (g)
Ignition
wire (g)
ΔT/K
−Qv/kJ·mol−1
0.447 4
0.384 7
0.432 2
0.015 2
0.011 7
0.013 2
1.182
1.151
1.202
3238.7
3950.6
3612.5
from the category pull-down menu, click the customize icon,
and set its dialog box. The second way is to right click the
sub-VI icon and select sub-VI node setup from the shortcut
menu. The first way requires every instance of the sub-VI to
display its front panel when called, but the second way simply
displays its front panel when called.
4.
APPLIED EXAMPLES
The author carried out corresponding test experiments in
turn, with data acquisition, real-time display, data processing, generating the report of result which can all be completed automatically giving satisfactory results [3, 6]. The
data processing module of the system, set on a different mission, can fulfill the corresponding testing assignment. For example, we add a data processing module of heat of combustion in the system, and can apply it to measuring the material
combustion heat. The results are shown as Table 1. Their relative measurement errors are all less than 4%, a satisfactory
result.
5.
CONCLUSION
The author designed VIs for measuring temperature and
pressure based on LabVIEW. These instruments were composed of four representative physical chemistry experiments:
drawing a binary metal diagram, determining molar mass
with freezing point depression, determining the constant of
the reactive rate in the decomposition of peroxide, and measuring the surface tension of a solution by the pressure of
froth. These experiments can determine the temperature,
temperature difference, pressure, and pressure difference of
the system, respectively. In these experiments, we can take the
measurements by the PCI-DAQ method or standard chemical instruments serial port method. A manipulator can com-
bine the sensors, signal-condition circuit or standard chemical instruments and corresponding data processing modules, according to the actual condition in the laboratory and
the concrete requirements of the experiment, thus the system of chemical testing VIs can be constructed easily and
quickly. For example, with the combination of VIs for drawing a binary metal diagram, if we take the measurements
by the PCI-DAQ method, we should select Pt100 temperature sensor, temperature signal-condition circuit, DAQ card
in hardware, select data acquisition.VI, data redisplaying.VI,
abnormal point removed.VI, find out turning points.VI, find
out eutectic point.VI, draw phase diagram.VI in software. If
we take the measurements with standard instruments, we
should substitute a digital temperature-measuring instrument with serial ports in place of the hardware. Nothing
needs to be changed except the data acquisition.VI in software. It is similar to other experimental testing systems. The
VI can be used in extensive applications because of its flexibility. It can be used in numerous experimental systems,
such as determining temperature and temperature difference
of fusible heat, burning heat, determining the pressure and
pressure difference of pure liquid saturated steam pressure,
the disposed pressure of solid.
This system solves the problem of communication between the sensors or between standard instruments and the
computer, which are unfamiliar for most chemical workers, and the common problems for designing chemical VI to
measure temperature, temperature difference, pressure, and
pressure difference. When the user needs to test the temperature and pressure which are beyond this system, then he
can compose a new measuring system to meet the requirements of the new testing by transferring the function designed modules and combining them, thus avoiding a waste
of manpower and material resources. This means that developers can design customized measuring instruments according to their own requirements. Exploiting VIs based on LabVIEW has many advantages, such as a user-friendly working
panel, ease of manipulation, complex data processing, drawing and printing the result at the click of the mouse. Moreover, using the application builder tools that belong to LabVIEW itself to create standalone applications and installers
or shared libraries (DLLs) for VIs, the user can run and extend independently from the LabVIEW development environment. Altogether, this system has very great practical application value.
Wen-Bin Wang et al.
ACKNOWLEDGMENTS
The authors are financially supported by the Key Research
Application of China West Normal University with the
Project number 200201, and National Higher-Education Innovation with the Project number [2005]198 in Sichuan
province. The authors specially thank National Instruments
for offering many possibilities to get support for application
of software, technical support, customer meetings, and training.
REFERENCES
[1] J. H. Liu, Z. R. Shen, and F. T. Guo, Modern Test Technology and
System Integration, Publishing House of Electronics Industry,
Beijing, China, 2005.
[2] Q. Z. Zhou, Z. H. Qian, and P. P. Liu, VI and Program Design of
LabVIEWTM 7 Express, Buaapress, Beijing, China, 2004.
[3] J.-Y. Li, W.-B. Wang, Y. W. Li, Z. R. Liu, and D. C. Cai,
“LabVIEWTM 7 express-based virtual instrument for drawing
binary phase diagrams,” Computer and Applied Chemistry,
vol. 22, no. 8, pp. 623–626, 2005.
[4] M. Y. Cao, X. Wang, and N. L. Sun, “Instrumentation amplifier
AD620 and its application,” Electrical Measurement & Instrumentation, vol. 37, no. 418, pp. 49–52, 2000.
[5] H. T. Xiong, “Three methods for driving data acquisition
card in LabVIEW,” Electrical Measurement & Instrumentation,
vol. 38, no. 428, pp. 35–37, 2001.
[6] J.-Y. Li, W.-B. Wang, and Y. W. Li, “LabVIEWTM 7 express-based
virtual instrument for measuring the surface tensions of solution,” Computer and Applied Chemistry, vol. 22, no. 11, pp.
1055–1058, 2005.
[7] LabVIEWTM 7 Express User Manual, National Instrument, 2003.
[8] L. P. Yang, H. T. Li, and Y. Zhao, Advanced Program Design of
LabVIEW, Tsinghua University Press, Beijing, China, 2003.
7