1
Phase IV Progress Report
William T. Shepherd
Office of Aviation Medicine
Federal Aviation Administration
Washington, DC 20591
Galaxy Scientific Corporation
Atlanta, GA 30345
May 1995
Acknowledgements
This program was sponsored by the federal aviation administration. Technical program
management was provided by Dr. William Shepherd, Office of Aviation Medicine. This
program was conducted under Contract DTFA01-92-Y-01005.
The research team would like to thank Dr. William Shepherd and Ms. Jean Watson, Office of
Aviation Medicine, for their assistance and support during this program.
The authors also wish to thank the many government and industry personnel who continue to
cooperate with the research team. As the work continues, the number of contributors (FAA
entities, air carriers, and consortiums of industry groups) has grown beyond a reasonable size to
individually list all those who have provided guidance and cooperation.
CHAPTER ONE
PHASE IV OVERVIEW
1.0 INTRODUCTION
Since 1989, the Federal Aviation Administration (FAA) Office of Aviation Medicine (AAM) has
conducted research related to human factors in aviation maintenance and inspection. The
research has been well received by FAA, the scientific community, and the airlines. This
research program has sponsored eight workshops on human factors issues in aviation
maintenance and inspection. These workshops have been attended by more than 800 participants.
The 8th workshop was conducted during this phase of the research program. The theme for this
meeting was "Trends and Advances in Aviation Maintenance Operations." The proceedings were
distributed in April 1994 and were also included on the second FAA/AAM CD-ROM, produced
in May 1994.
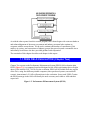
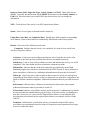
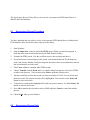
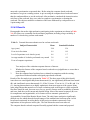
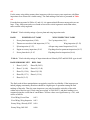
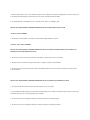
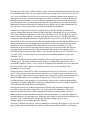
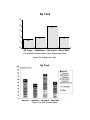
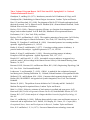
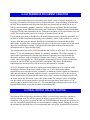
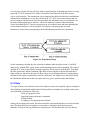
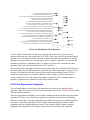
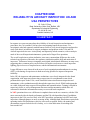
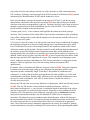
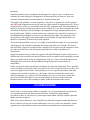
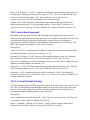
Figure 1.1 outlines the research plan for this program. The first phase consisted of extensive
investigations of airline maintenance organizations in order to gain a better understanding of the
problems/needs of the "real world" of airline maintenance (Shepherd et al., 1991). The second
phase developed a number of human performance enhancements based on the findings from
Phase I [e.g., the Environmental Control System (ECS) Tutor, NDI Simulation, etc.]
(FAA/AAM & GSC, 1993a). The third phase continued the investigations and demonstrations of
various human performance enhancements. Examples are the FAA/AAM CD-ROM #1,
improved workcards for inspection, and the Performance ENhancment System (PENS) for
Aviation Safety Inspectors (ASIs). The third phase also began evaluating the effects of the
research program outputs (ECS Tutor evaluations) (FAA/AAM & GSC, 1993b; FAA/AAM &
GSC, in press). The current phase (Phase IV) also continued with investigations, demonstrations,
and evaluations. Phase IV also included fielding of research results. Feedback to all stages of the
research program is provided by industry adoption of the research products. All products,
procedures, and ideas that have been generated contribute to the continued safety and
improvement of operational efficiency through improved human performance.
Figure 1.1 The Research Program
As with the other reports from this research program, this volume begins with a sincere thanks to
and acknowledgement of the many government and industry personnel who continue to
cooperate with the research team. As the work, continues the number of contributors (FAA
entities, air carriers, and consortiums of industry groups) has grown beyond a reasonable size to
individually list all those who have provided guidance and cooperation.
The remainder of this chapter describes each chapter in this report.
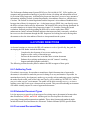
1.1 PENS FIELD EVALUATION (Chapter Two)
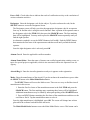
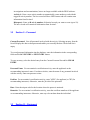
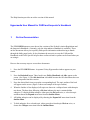
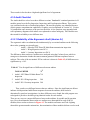
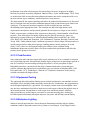
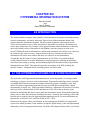
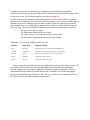
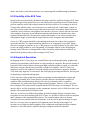
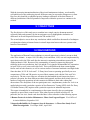
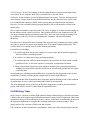
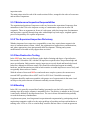
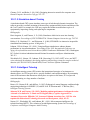
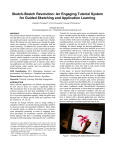
Chapter Two reports on the Performance Enhancement System (PENS) field evaluation plan.
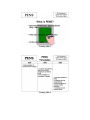
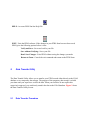
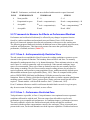
PENS (Figure 1.2) is a computer-based tool designed to aid ASIs in performing their oversight
duties (FAA/AAM & GSC, 1993b). For the evaluation, PENS will be fielded in all nine regions
of the FAA, using four different portable computers (three pen-based systems, one trackball
system). Approximately 36 ASIs will participate in the evaluation, four at each FSDO. Testing
the PENS prototype in the field will identify the tools necessary and viable to ASIs and their
supervisors.
Figure 1.2 Performance ENhancement System (PENS)
1.2 DESIGN OF PORTABLE COMPUTER-BASED
WORKCARDS FOR AIRCRAFT INSPECTION (Chapter Three)
Chapter Three discusses a computer-based workcard system developed during Phase IV, using a
portable computer and hypertext software. This system was based on the improved paper-based
workcard developed in Phase III (FAA/AAM & GSC, 1993b). Eight tasks were implemented on
the computer-based system (five A-checks and three C-checks). Results from tests performed
during Phase IV show that the computer-based system is better than the paper-based system,
even though the computer-based system could benefit from improved hardware.
1.3 ERGONOMIC AUDIT FOR VISUAL INSPECTION OF
AIRCRAFT (Chapter Four)
In order for airlines to determine which human factors interventions are most urgently needed in
their own operations, an ergonomics audit was developed to help evaluate potential
human/machine mismatches in any inspection task. Chapter Four discusses this audit which
contains a method of choosing tasks to be audited, an audit checklist, and computer program
evaluating checklist response against national and international standards to produce an audit
report. An evaluation conducted in Phase IV showed that while the audit program is no
substitute for a detailed ergonomics analysis, it is a useful tool for identifying error-prone
situations. Chapter Four Appendix is an example output from the program.
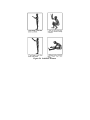
1.4 INVESTIGATION OF ERGONOMIC FACTORS RELATED
TO POSTURE AND FATIGUE IN THE INSPECTION
ENVIRONMENT (Chapter Five)
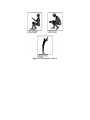
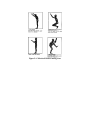
Chapter Five reports on an investigation of ergonomic factors which may cause increased
inspector stress, fatigue and workload, particularly restrictive spaces that cause extreme postures.
Phase III developed a methodology for studying the effects of these restrictive spaces on
inspector fatigue (FAA/AAM & GSC, 1993b). Phase IV evaluated these effects using a set of
four tasks from the C-check of a DC-9. Inspectors were observed and tests were taken to
measure fatigue, postural discomfort and workload. The results showed that the same tasks have
the greatest impact on the inspector. Based on this evaluation, a posture/fatigue module has been
developed and integrated into the ergonomic audit program (Chapter Four). Also several
improvements/ interventions were implemented at the partner airline to reduce the effects of
restrictive spaces.
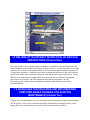
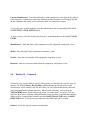
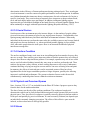
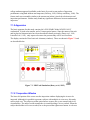
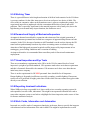
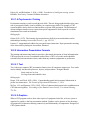
1.5 HYPERMEDIA INFORMATION SYSTEM (Chapter Six)
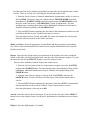
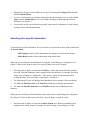
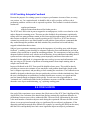
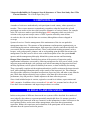
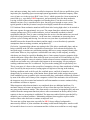
Phase IV continued to expand the Hypermedia Information System (HIS). Research during
Phase IV continued to make the tools generic and enhance their functionality. The current HIS
contains eight conference proceedings and three phase reports. It also contains one complete
training simulation (ECS Tutor) as well as a computer-based workcard system and an
ergonomics audit for inspection. The HIS also contains the Performance Enhancement System
(PENS). Two new libraries used in conjunction with PENS were added: one contains the Federal
Aviation Regulations; the other, the Inspector's Airworthiness Handbook. This edition of the
HIS was released on a CD-ROM (Figure 1.3) in May 1994.
Figure 1.3. Human Factors Issues in Aviation Maintenance and Inspection, CD-ROM#2
1.6 CORRELATES OF INDIVIDUAL DIFFERENCES IN
NONDESTRUC-TIVE INSPECTION PERFORMANCE (Chapter
Seven)
A previous report reviewed literature related to differences in inspectors' NDI proficiency
(FAA/AAM & GSC, 1993b; FAA/AAM & GSC, in press). Several variables were identified
which would appear potentially relevant to NDI inspector selection and/or proficiency:
•
Boredom Susceptibility
•
Concentration/Attentiveness/ Distractibility
•
Extroversion/Impulsivity
•
Motivation/Perseverance
•
Decision Making/Judgement
•
Mechanical/Electronics Aptitude
•
Need for Autonomy
The goal of Phase IV research was to determine the relationship between selected tests and
measures derived from the above category and performance on an NDI task. Research also
investigated possible performance changes from sustained performance during a simulated
one-day shift and interactive effects between performance changes and the variables identified
above. Chapter Seven reports on the findings of this research.
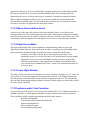
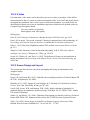
1.7 RESULTS OF THE ENVIRONMENTAL CONTROL SYSTEM
TUTOR EXPERIMENT AT CLAYTON STATE COLLEGE
(Chapter Eight)
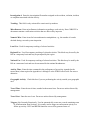
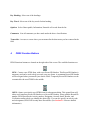
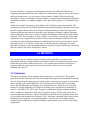
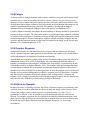
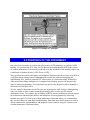
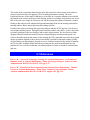
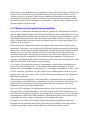
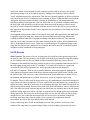
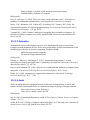
Chapter Eight describes an investigation to determine the effect of an Intelligent Help Agent
(IHA) on the effectiveness of computer-based training. The training system used was the
Environmental Control System (ECS) Tutor, a simulation-based trainer developed in previous
phases of this research (Figure 1.4). Subjects used the ECS Tutor either with or without an
error-driven IHA. No significant difference in performance was found between the two groups.
Other findings are also discussed in the chapter.
Figure 1.4 ECS Tutor
1.8 RELIABILITY IN AIRCRAFT INSPECTION: UK AND USA
PERSPECTIVES (Chapter Nine)
The CAA and the FAA co-sponsored an investigation of reliability in aircraft inspection in the
United Kingdom (UK) and the United States of America (USA). Aircraft inspection sites in both
countries were visited with an analysis made of the overall inspection/maintenance system and
of larger floor operations. Similarities were more common than differences due to the technical
specification of the tasks, regulatory similarities, and skill and motivation of inspectors. Larger
differences in nondestructive testing (NDT) were observed due to a difference in emphasis
between the two countries. The USA emphasized rule-based performance; the UK,
knowledge-based. Chapter Nine documents the similarities and differences and offers
recommendations.
1.9 GUIDELINES FOR DESIGNING AND IMPLEMENTING
COMPUTER-BASED TRAINING FOR AVIATION
MAINTENANCE (Chapter Ten)
Chapter Ten is a bibliographic overview of selected issues in designing computer-based training
(CBT) systems. Issues such as instructional design, information presentation formats, screen
design and layout, and hardware are covered. Over 60 references are included.
1.10 FUTURE PLANS
Capitalizing on a research team of scientists and engineers from industry, government and
academia, the research program will continue to develop and implement tools and procedures for
human performance enhancement. Future phases will increase field studies of research results.
The program will also continue to conduct research with partners in both industry and
government. All research efforts will continue to emphasize the measurable impact of the
research program on increasing maintenance effectiveness and efficiency with resultant cost
control.
1.11 REFERENCES
Shepherd, W.T., Johnson, W.B., Drury, C.G.,
Taylor, J.C., Berninger, D. (1991). Human factors in aviation maintenance phase 1:
Progress report. Washington, DC: Federal Aviation Administration. (Report No.
DOT/FAA/AM-91/16).
Federal Aviation Administration Office of Aviation Medicine (FAA/AAM) and Galaxy
Scientific Corporation (GSC). (1993a). Human factors in aviation maintenance - Phase two
progress report. Washington, DC: Federal Aviation Administration. (Report No.
DOT/FAA/AM-93/5).
Federal Aviation Administration Office of Aviation Medicine (FAA/AAM) and Galaxy
Scientific Corporation (GSC). (1993b). Human factors in aviation maintenance - Phase
three, volume 1 progress report. Washington, DC: Federal Aviation Administration.
(Report No. DOT/FAA/AM-93/15).
Federal Aviation Administration Office of Aviation Medicine (FAA/AAM) and Galaxy
Scientific Corporation (GSC). (in press). Human factors in aviation maintenance - Phase
three, volume 2 progress report. Washington, DC: Federal Aviation Administration.
CHAPTER TWO
PENS PROJECT FIELD EVALUATION
Charles F. Layton, Ph.D.
Galaxy Scientific Corporation
2.1 PENS: A PERFORMANCE ENHANCEMENT SYSTEM
The Performance ENhancement System, PENS, is a tool designed to aid Aviation Safety
Inspectors (ASIs) in performing their oversight duties. Aviation Safety Inspectors (ASIs) make
up the inspection team for the Flight Standards Service (FSS), which is the regulatory branch of
the Federal Aviation Administration (FAA). They perform a variety of tasks, in both commercial
and general aviation areas, including: inspecting aircraft and equipment, reviewing manuals and
records, certificating pilots, and evaluating training programs.
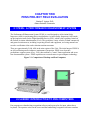
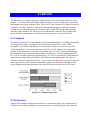
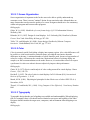
There are approximately 2,600 ASIs in the nine regions of the FAA. The initial target of PENS is
an ASI performing an airworthiness (maintenance) inspection. PENS is an electronic
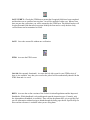
performance support system (Gery, 1991) that combines a "smart" forms application and an online documentation system. PENS capitalizes on recent advances in pen computer technology.
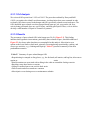
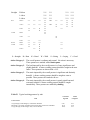
Figure 2.1 Comparison of Desktop and Pen Computers
2.2 A BRIEF INTRODUCTION TO PEN COMPUTERS
Pen computers use handwriting recognition software and a pen stylus for input, rather then a
keyboard. The operator writes on the screen and the handwriting recognition software translates
the written characters to typed characters. The pen stylus also acts as a pointing device, much
like a mouse. When combined with a graphical user interface, such as Microsoft Windows for
Pen Computing, the pen stylus and handwriting recognition software hold the promise of making
computers easier to use than traditional desktop computers. A comparison of typical desktop and
pen computers is shown in Figure 2.1.
2.3 IMPROVED FORMS
As is typical with regulatory agencies, there are several forms that must be completed while
performing an ASI task. Currently, these forms are on paper and require that redundant
information be recorded on each form. After completing the forms, the ASI either types the data
into a local computer database or he/she submits the forms to a data entry clerk. There are
several drawbacks to such an approach. First, redundant recording of data on multiple forms
takes time that could be devoted to more productive activities. Second, the two-step process of
recording data on paper and then entering the data into a computer is inefficient. Third, one is
either paying an inspector to do a task for which he/she is over-qualified, or one is paying for a
staff of data entry clerks. Fourth, a data-entry clerk may make transcription errors (due to
misreading the inspector's handwriting) or errors due to incomplete knowledge and
understanding of the inspector's activities. Such errors mean that the database is an unreliable
source of information. Finally, the current process takes considerable time, which means there is
a delay in getting safety data into the national database where it can be accessed by other
members of the FAA.
Pen computer technology can be easily applied to such tasks to minimize the number of steps
required to collect data and assimilate it into the database. Forms will be linked together so that
an entry in one form propagates to the other forms, thus eliminating redundant data entries.
Furthermore, the data will be collected so that they are ready for direct downloading into the
database. This method of collecting data reduces the need for data entry clerks and it reduces
data transcription errors. At the end of the work day, the inspector will return to the office,
connect the pen computer to the network, and initiate a downloading procedure that will be
carried out overnight.
2.4 ON-LINE DOCUMENTATION
The second major contribution of PENS is an on-line documentation system. Whereas ASIs
currently must carry two briefcases full of books (including Federal Aviation Regulations
(FARs), ASI Handbooks, and other regulatory documents), the necessary data will be stored on
the hard disk of the pen computer or on a CD-ROM (compact disc, read-only memory). Not only
is the computer media more lightweight and compact, it also facilitates quick retrieval of specific
information. For instance, an ASI will be able to search the regulations for the word "corrosion"
to answer a question on reporting defects. PENS would then indicate all of the instances of the
word corrosion. The ASI could then ask PENS to retrieve the relevant documents and display the
pages that discuss the term.
Besides the bulk and inefficiency of the books, inspectors must deal with problems of
information currency. One complaint made by inspectors is that they will tell an operator that it
is not in compliance with the regulations, only to be shown a more recent edition of those
regulations. That is, sometimes the operators get the most recent editions of the regulations
before the inspectors do. This problem could be dealt with by distributing updated documents to
the pen computers when they are connected to the database computer network. Thus, a new
edition of a document could literally be published one day and in the inspector's hands the next.
2.5 ADDITIONAL BENEFITS
A side benefit of using a computer to support inspection activities is that it opens the door to
other types of activities and methods for documenting an inspection. For example, an inspector
could follow an on-line checklist for an inspection. The checklist would then become the focus
of interaction with the computer; by completing the checklist, all of the necessary forms would
be automatically completed. We could even develop a scheduling component that would remind
the inspector to follow up on an inspection. When documenting an inspection, ASIs currently
must record their findings verbally. However, because the bulk of a ramp inspection is
conducted by visually inspecting an aircraft, sketching is a more natural method for recording
the results of such an inspection. Thus, if an inspector found a leaking seal on the wing of an
aircraft, the inspector could annotate a line art drawing of that aircraft on the computer. This
graphic could then be stored along with the completed form.
2.6 EVALUATION AND IMPLEMENTATION
There are a number of issues that can affect the success of introducing new technology into the
ASI work environment. Many inspectors do not have experience using computers. Of those
inspectors, some are willing to try the new tools based on promised increased productivity, while
others think that using computers is not part of their job description. Some inspectors are even
concerned with how they will be perceived by the operators when they are carrying a pen
computer.
We are capitalizing on constraints built into the forms and data to make the system easy to use.
For instance, because many fields on the forms require one item out of a finite set of possible
entries, one can display that set and select an item from it. This approach has the added benefits
of reducing memory demands on the inspectors and of increasing data reliability.
Pen computer configurations and durability must also be considered, as there are significant
tradeoffs in these areas. Questions that should be asked include: Is it better to have a lightweight
unit without a keyboard, or a slightly heavier unit with a keyboard? Which is more important to
inspectors, weight or ruggedness? Is battery life sufficient to even consider using such a device?
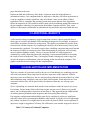
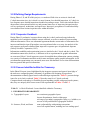
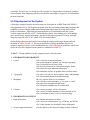
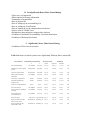
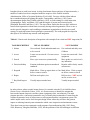
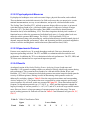
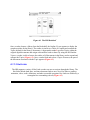
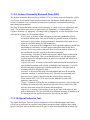
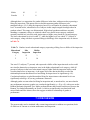
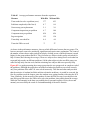
Table 2.1 Features of Evaluated Computers
Computer A
Computer B
Computer C
Computer D
486/25 Mhz CPU
200 Mb Hard
Drive
Built-in Keyboard
Pen
486/25 Mhz CPU
80 Mb Hard
Drive
Separate Keyboard
Pen
386/25 Mhz CPU
200 Mb Hard
Drive
Separate Keyboard
Pen
486/25 Mhz CPU
120 Mb Hard
Drive
Built-in
Keyboard
Trackball
PENS is undergoing a field evaluation in one Flight Standards District Office (FSDO) in each of
the nine FAA Regions in order to answer the above questions and to determine whether pen
computers are a viable solution to the FSS information management needs.
2.6.1 Design of the Evaluation
Four models of portable computers, each from a different manufacturer, have been fielded in one
office in each of the nine FAA Regions. These computers were selected because each one had a
particular differentiating characteristic that may be important to ASIs. For example, three of the
computers were pen computers, while the fourth used a trackball. The latter computer was
fielded to address the following question: Is a pen computer necessary or will inspectors benefit
simply from having a portable computer? This and similar questions have been raised, and rather
than dictate an answer and force inspectors to adapt to our decisions, we deemed it more
appropriate to provide the inspectors the opportunity to tell us what were their requirements.
The following sections address the details of the evaluation.
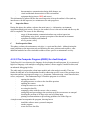
2.6.1.1 Evaluated Computers
A total of thirty-six computers (nine units of each of four models) are were fielded. These
computers were selected based on their particular combination of features and differentiating
characteristics. That is, the computers were selected because they had certain features in
common, but they also had a particular feature that made them unique compared to the others.
These features are described in Table 2.1.
These computers allow us and inspectors to address the following questions:
1.
Is a field computer a viable solution?
2.
Is a pen computer required, or will any portable computer work?
3.
Is a 486 processor required?
4.
Is a separate or built-in keyboard preferable (given that it adds weight)?
5.
The 80 Mb Hard Drive limits the functionality of the computer, but it also weighs less.
Which is preferable: A lightweight machine with limited functionality or a slightly
heavier machine with increased functionality?
The following features common to all four computers:
•
8 Mb RAM
•
•
•
•
Backlit LCD Monochrome display
PCMCIA Data Storage Card
DOS 6.0
Windows (Windows for Pen Computing or Windows 3.1; functionally equivalent
except for handwriting recognition)
•
PENS Software
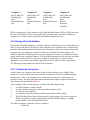
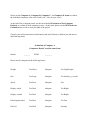
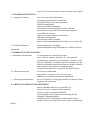
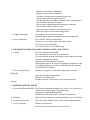
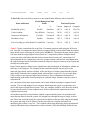
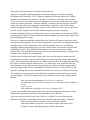
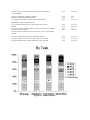
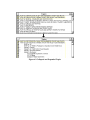
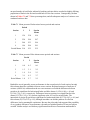
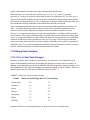
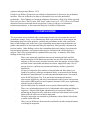
Table 2.2 Evaluation Sites
Region
FSDO
Environment
Installation Dates
Great Lakes
Milwaukee
Cold, snow
November 15-16, 1993
Central
St. Louis
Average
November 18-19, 1993
Southwest
Ft. Worth
Warm, dry
November 21-24, 1993
Western Pacific
Long Beach
Warm, humid
November 29-30, 1993
Northwest Mountain Seattle
Average, humid
December 2-3, 1993
Alaska
Fairbanks
Extreme cold, dry
December 6-7. 1993
New England
Boston
Cold, snow
December 13-14, 1993
Eastern
Harrisburg
Cold, snow
December 16-18. 1993
Southern
San Juan
Hot, humid, rainy
January 10-11, 1994
The PENS software is common to all four computers and runs nearly identically on each of the
three pen computers. (Computer B does not have sufficient hard disk space to contain all of the
FARs or the Airworthiness Inspector's Handbook.) It runs essentially the same way on the
trackball computer, with the exception that there is no handwriting recognition on that computer.
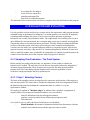
2.6.1.2 Evaluation Sites
Units were fielded in all nine FAA Regions. This scope gives the project broad exposure to field
inspectors and it subjects the hardware to a range of environmental conditions. The nine FSDOs
were selected based on the worst-case environmental conditions present in those regions. The
FSDOs, environmental conditions, and installation dates are listed in Table 2.2.
2.6.1.3 Experimental Design
A team of four inspectors in each FSDO is evaluating these units. These inspectors represent a
cross-section of the inspector population in terms of age, sex, work experience, and computer
experience. Each inspector is using one of the computers for a week and then switching to a
different model. The rotation is counterbalanced to eliminate order effects. This rotation will
continue until each inspector has had an opportunity to use each model. At the end of the
rotation, each inspector will complete an evaluation form that requests him/her to rate each unit
and answer some general questions. Appendix 2-A contains a complete set of evaluation forms.
The inspectors still have access to the units at this time to refresh their memories of the specifics
of each unit. From these data, we will recommend one commercial, off-the-shelf model (or its
subsequent version) and a custom design for final implementation. The custom design will be
specified because it is unlikely that a commercial, off-the-shelf model will incorporate all of the
desired features.
2.6.1.4 Training
The inspectors were trained for two days as a group. The first day of training consisted of DOS
and Windows basics, the specifics of Windows for Pen Computing, and training the pen
computers to their individual handwriting. The second day of training consisted of using PENS
and the On-Line Documentation, the computer rotation procedure, transferring field-collected
data to the FSDO database system (the Flight Standards Automation Subsystem, FSAS), and
training specific to each of the computers. Appendix 2-B contains copies of the training slides.
Appendix 2-C contains copies of the software user manuals.
2.6.2 Expected Outcomes of the Evaluation
ASI activities are too diverse to expect that a single approach will address all of the difficulties
that inspectors encounter in the field. Pen computers will certainly be appropriate for some
inspection activities, but it is highly unlikely that they will be appropriate in all situations. For
example, cockpit enroute inspections are likely not amenable to a computer tool for two reasons:
1) airlines are becoming increasingly sensitive to devices that emit radio frequency interference
(RFI) and the potential for resultant difficulties with avionics; 2) cockpit environments are
typically so small that an inspector has room for only a very small notepad, not a computer the
size of a clipboard or larger. But one should not condemn the approach just because it does not
work in all situations; it just means that PENS tools will have to be modified to meet the
requirements of the various environments in which they will be used. For example, we are
already investigating voice recognition systems that would permit nearly hands-free operation.
Furthermore, inspectors have already identified specific activities in which PENS would be
invaluable even in its present prototype state. For example, inspectors frequently go on
week-long trips to remote sites where they will inspect all of the operators in that area. As
another example, inspectors also perform in-depth inspections on particular operators. They may
spend several days at a single site inspecting all of the maintenance and training procedures,
operations materials, and the like to ensure that the operator is complying with the regulations. In
both examples, the inspectors need to be able to quickly and accurately collect such field data
and they need access to reference materials (FARs, Handbooks, etc.) while they are in the field.
2.7 SUMMARY AND CONCLUSIONS
As discussed above, pen computers use handwriting recognition software and a pen stylus for
input, rather then a keyboard. The user writes on the screen and the handwriting recognition
software translates the written characters to typed characters. The pen stylus also acts as a
pointing device, much like a mouse. The pen stylus and handwriting recognition really make
computers viable field devices when they are combined with a graphical user interface, such as
Windows for Pen Computing. After extensive in-house evaluations of pen computers, several
models were chosen for a field evaluation by Aviation Safety Inspectors. Custom software to
support the inspectors was also installed on the computers for evaluation.
As with the introduction of any new tool into an existing system, the effects are widespread. The
potential for enhancing the productivity and job satisfaction of Aviation Safety Inspectors is
great. However, with that potential comes the possibility of either having no effect (because of
rejection of the tool) or, worse yet, actually decreasing performance. Time and again, experience
has shown that buying systems and installing them without consulting the individuals who are
supposed to use them does not work. Such an approach results in user and management
frustration, as well as a waste of resources. Only by developing prototype systems and testing
them in the field will the Flight Standards Service learn what tools are necessary and viable to
Aviation Safety Inspectors and their supervisors. The PENS project is taking just such an
approach.
2.8 REFERENCES
Gery, G. J. (1992). Electronic performance support systems (2nd ed.). Boston: Weingarten.
Appendix 2-A Evaluation Forms
Personnel Background
Post-Training Comfort Level
Evaluation Form Instructions
Evaluation of Computer A (Computers B and C used the same form)
Evaluation of Computer D
Evaluation of Pen Computer Products
PENS Software Evaluation
Personnel Background
Initials:
_______
FSDO:
_______
Age:
_______
Years as ASI: _______
Type of operator you inspect regularly: 121
other _______
_______
125
_______
Type of operator you inspect most frequently:
121
129
133
135
137
133
135
_______
125
129
137
other _______
Have you ever used a computer before? Yes
No
How many years?
______
What type of computer have you used? IBM PC Compatible (e.g., AT&T/NCR OATS)
Apple Macintosh
Other: ________________
Do you own a computer? Yes
No
What type of computer do you own?
How many years?
______
IBM PC Compatible (e.g., AT&T/NCR OATS)
Apple Macintosh
Other: ________________
Have you ever used a "Mouse" before?
Yes
No
Have you ever used a "Trackball" before?
Yes
Have you ever used a "Pen Computer" before? Yes
No
No
Do you currently use the PTRS Transmittal System (Paradox)? Yes
No
At this point, how comfortable do you feel using a computer?
1
2
not at all comfortable
3
4
5
somewhat comfortable
quite comfortable
What is your opinion of the following computer manufacturers:
Computer A
Favorable
Unfavorable
No Opinion
Computer B
Favorable
Unfavorable
No Opinion
Computer C
Favorable
Unfavorable
No Opinion
Computer D
Favorable
Unfavorable
No Opinion
Post-Training Comfort Level
Initials:
_______
FSDO:
_______
Now that you have been trained...
How comfortable do you feel using a computer?
1
2
not at all comfortable
3
4
somewhat comfortable
5
quite comfortable
How comfortable do you feel using a pen computer?
1
2
3
4
5
not at all comfortable
somewhat comfortable
quite comfortable
How comfortable do you feel with handwriting recognition?
1
2
not at all comfortable
3
4
somewhat comfortable
5
quite comfortable
How comfortable do you feel with the PENS PTRS?
1
2
not at all comfortable
3
4
somewhat comfortable
5
quite comfortable
How comfortable do you feel with the On-Line References (Hypermedia)?
1
2
not at all comfortable
3
4
somewhat comfortable
5
quite comfortable
Do you have any other comments?
If there is anything you feel the least bit uncomfortable about, or if you have any questions,
please bring them to our attention now. We are here to address your concerns and ensure
that PENS meets your needs. PENS will only be as good as you personally make it. Please
take the time to bring your concerns to our attention.
Evaluation Form Instructions
Please use the Computer A, Computer B, Computer C, and Computer D forms to evaluate
the individual computers at the end of each week. (One form per week.)
At the end of the evaluation period, use the form labelled Evaluation of Pen Computer
Products to evaluate all four computers at once. At that time, please use the PENS Software
Evaluation form to tell us what you think of the project.
Chuck Layton will return between mid-January and early February to debrief you and answer
individual questions.
Evaluation of Computer A
(Computers B and C used the same form)
Initials:
_______
FSDO:
________
Please rate the computer on the following factors:
Weight
Too Heavy
Adequate
Too Light/Fragile
Size
Too Large
Adequate
Too Small (e.g., screen)
Speed
Too Slow
Adequate
Fast
Display--inside
Too Dark
Adequate
Too Bright
Display--outside
Too Dark
Adequate
Too Bright
Pen Responsiveness
Too Slow
Adequate
Too Fast
Pen Feel
Too Slick
Adequate
Scratchy
Overall Comfort
Not Comfortable
Adequate
Comfortable
What were the environmental conditions in which you used the computer?
snow
drizzle rain
heat
cold
frigid
Did you use the computer for five working days?
If not, why not?
Broken
Yes
On Travel/Vacation/RDO
No
Too difficult to use
Do you prefer to have the pen tethered to the unit?
Yes
No
Could you comfortably carry this unit throughout a typical day?
Yes
No
If a neck, shoulder, or waist strap were available, would you use it?
Which would you prefer?
Neck
Shoulder
Yes
Waist
What are the three largest drawbacks to this product?1. _____________________
2. _____________________
3. _____________________
Would you use this computer in the field as part of your job?
If not, why not?
Evaluation of Computer D
Yes
No
No
Initials:
_______
FSDO:
________
Please rate the computer on the following factors:
Weight
Too Heavy
Adequate
Too Light/Fragile
Size
Too Large
Adequate
Too Small (e.g., screen)
Speed
Too Slow
Adequate
Fast
Display--inside
Too Dark
Adequate
Too Bright
Display--outside
Too Dark
Adequate
Too Bright
Trackball Speed
Too Slow
Adequate
Too Fast
Trackball Ease
Too Cumbersome
Adequate
Easier than a Pen
Overall Comfort
Not Comfortable
Adequate
Comfortable
What were the environmental conditions in which you used the computer?
snow
drizzle rain
heat
cold
frigid
Did you use the computer for five working days?
If not, why not?
Broken
On Travel/Vacation/RDO
Could you comfortably carry this unit throughout a typical day?
Yes
No
Too difficult to use
Yes
No
If a neck, shoulder, or waist strap were available, would you use it?
No
Which would you prefer?
Neck
Shoulder
Yes
Waist
What are the three largest drawbacks to this product?1. _____________________
2. _____________________
3. _____________________
Would you use this computer in the field as part of your job?
Yes
No
If not, why not?
Evaluation of Pen Computer Products
Initials:
_______
FSDO:
________
Please gather together all four of the evaluated computers, then circle the best computer and
draw an X through the worst computer for each of the following characteristics:
Weight
Computer A
Computer B
Computer C
Computer D
Size
Computer A
Computer B
Computer C
Computer D
Speed
Computer A
Computer B
Computer C
Computer D
Display inside
Computer A
Computer B
Computer C
Computer D
Display outside
Computer A
Computer B
Computer C
Computer D
Pen Responsiveness Computer A
Computer B
Computer C
Computer D (trackball)
Pen Feel
Computer A
Computer B
Computer C
Computer D (trackball)
Handwriting
Computer A
Computer B
Computer C
Computer D
Comfort
Computer A
Computer B
Computer C
Computer D
Computer C
Computer D
No preference
Which product do you prefer?
Computer A
Computer B
Do you think you could carry any of these units for a significant period of time? Yes No
Which one? Computer A
Computer B
Computer C
Computer D
If a neck, shoulder, or waist strap were available, would you use it? Yes
Which would you prefer?
Neck Shoulder
No
Waist
Would you prefer a very rugged unit, even though it weighs nine pounds?
What are the three largest drawbacks to all of these products?
Yes
No
1. _____________________
2. _____________________
3. _____________________
The following is a description of two products. Which one would you prefer?
Product A.
Product B.
Weight: 1-3 lbs.
Weight: 3-5 lbs.
Runs only PTRS form
Runs complete PENS system
Doesn't run Windows
Runs Windows and Windows
applications
No keyboard
Built-in or separate keyboard
PENS Software Evaluation
Initials:
_______
FSDO:
________
Now that you have used PENS for a signficant period of time, please tell us what you think.
I enjoyed using PENS.
True False
I am eager to see PENS evolve to meet my additional needs.
True False
I would like all of my forms linked together so that I don't have to fill in the same
information on multiple forms.
True False
I will continue to use PENS after the evaluation period.
True False
I would rather use paper in the field and transcribe the forms at the office. True
False
I would rather use the current transmittal system (FSAS) for transcribing forms.
True
False
I like the On-Line References (Hypermedia), such as FARS and Handbooks.
False
True
I would like more On-Line References (Hypermedia), such as ADs, ACs, etc. True
False
The On-Line References (Hypermedia) are the best part about PENS.
True False
I had difficulty transferring my files from the computer to the network.
True False
If any of the following need improvement, please comment below:
Section I
PTRS Record ID function
Inspector ID, Inspector Type, Activity Number, and FAR screen
NPG
Status
Callup Date, Start Date, Completion Date
Designator
Airman Certification #
Airman Name/Other
Aircraft Registration #
Make-Model-Series
Loc/Departure Point, Arrival Point
Flight #
Investigation #
Tracking
Miscellaneous
Numeric Misc
Local Use
National Use
Activity Time
Travel Time, Travel Cost
Section II, Personnel
Personnel Name
Position
Base
Remarks
New Entry, Save Entry, Clear Entry
Section III, Equipment
Manufacturer
Model
Serial #
Remarks
New Entry, Save Entry, Clear Entry
Section IV, Comments
Primary
Key Heading
Key Word
Opinion
Clear Comment
Erase Last Ink
Erase All Ink
Undo Last Erase
Transcribe
Transcription Screen
Scratchpad Entries
Transcribed Text
Done For Now, Keep Ink
Done, Erase Ink
Aircraft Graphic
Help
Save
Save Verify
Open
New
Exit
On-Line References (Hypermedia)
Open Book
Topics (Table of Contents)
Viewer
Searching
--This Chapter
--Entire Book
Bookmarks
Copying
Other
Data Transfer
Inspector Name
Transfer List
Record List
Supervisory Review
Previous
Next
Transfer
Print
Delete
Appendix 2-B Training Slides
Training Slide 1
Training Slide 2
Training Slide 3
Training Slide 4
Training Slide 5
Training Slide 6
Training Slide 7
Training Slide 8
Training Slide 9
Training Slide 10
Training Slide 11
Training Slide 12
Training Slide 13
Appendix 2-C Software User Manuals
PENS User Manual
HyperMedia User Manual for FARS and Inspector's Handbook
PENS User Manual
PENS is a suite of tools to assist Aviation Safety Inspectors (ASIs) in their daily activities. It
primarily addresses two main aspects of inspector activities: data collection via the PTRS form
and accessing regulatory documents. The current PENS softare provides these functions for
airworthiness activities, including an enhanced version of the PTRS form. Future development
will include the forms, job aids, and reference documents associated with all ASI activities.
1.
Data Collection Procedure
Here are the necessary steps to run the PENS software:
1.
Start Windows, if you are not already in the Windows envrionment.
2.
Start the PENS software located in the PENS group.
3.
Fill out the information on the PENS Login Screen. This information is needed to identify
the job aids, forms, letters, and reports that are required for an inspection activity. (See PENS
Login Section for detailed information on how to enter this information.)
4.
Press the OK button. This action brings you to the PTRS screen.
5.
The PTRS screen is divided into four sections. Boxes containing the required information
for the activity are surrounded with thick black boxes. Fill out these boxes accordingly. (See
PTRS Section for detailed information on how to enter this information.)
6.
You can also access the FARs and Inspector's Handbook using the PENS Function buttons
(the Job Aid and Aircraft functions are not currently functional).
7.
Choose either SAVE or SAVE VERIFY to save your data. SAVE VERIFY will review
your data for consistency and completeness. SAVE will not make such checks, but it will save
your data for later verification. PTRS records cannot be transferred to FSAS database if they are
not verified.
8.
Select EXIT when you are finished with the data collection.
2.
PENS Login
The following paragraphs illustrate how to fill out information on the Login screen:
1.
Inspector ID: Enter your three character initials. (Other fields will be blanked until this
information is filled in.)
2.
Inspection Type, Section, Heading and Subheading fields will help you select the proper
activity number. (These fields replace the small notebooks you currently use.) To supply this
information press the down-arrow on the corresponding list box and select one of the options.
Once these fields are filled out, the PENS will supply the relevant Activity Number.
3.
If you know the Activity Number, you may write or type the number in the Activity # field
instead of performing step 2. PENS will automatically fill the Inspection Type, Section, Heading
and Subheading (if available) information.
4.
Once you have entered an activity number, the FAR field will contain a list of relevant
FARs for that activity number. Select the appropriate FAR for the activity.
5.
Hit one of the following buttons to continue:
CLEAR: Erases all input on the Login screen.
NEW: Creates new PTRS form with the information from the Login screen. If a backup PTRS
exists, PENS will give you a choice to restore or delete the backup.
OPEN: Opens a specific PTRS form. (See section 2.1)
CANCEL: Cancels the operation and exits from the PENS software.
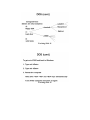
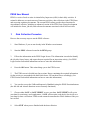
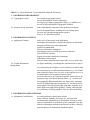
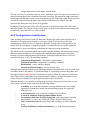
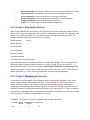
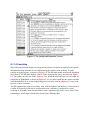
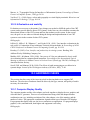
2.1
Opening an existing PTRS form
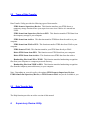
Figure 1. The Open Screen
The OPEN button accesses the Open Screen (Figure 1). The screen displays the Record ID
Number for all PTRS forms found in the database. When the FSAS button is checked, PENS will
display only the PTRS forms in the FSAS database. Likewise, PENS will only display PTRS
forms in the temporary directory when the TEMPORARY button is checked. When a form is
selected, PENS also provides the Activity number, Designator, Aircraft, Status, and Verification
status to help you identify the desired PTRS form.
You can also search for a specific PTRS form. To do this, follow these steps:
1.
Check the FSAS or the TEMPORARY button to identify the database to search on.
2.
Enter a specific activity number in the Activity: field.
3.
Enter a specific Designator Code in the DESIGNATOR field.
4.
Hit the SEARCH button. All records in the database that match the search information will
be displayed in the FORM ID# box.
5.
Tap the desired form to select it. (Corresponding information about the file will be
displayed.)
6.
Press OK.
3.
PTRS
The screen is divided into four sections (see below). Depending on the Activity number, thick
black borders will be placed on several fields. This border indicates that the informatin is
required for the activity (detailed instructions for completing the form are provided in each
section).
Section I: Used for describint the PTRS activity, the overall results, the subject and other
basic information
Section II: Used for recording informatin acquired on personnel (other than those recorded
in Section I) during the accomplishment of the task. It is also used to record a certificate
applicant's information along with the recommending instructor's information for a designated
examiner's certification activity.
Section III: Used for identifying a particular item that was inspected by manufacturer,
model and serial number (other than that identified in Section I).
Section IV: Used for classifying observations or evaluations into specific areas of interest
in a coded format.
3.1
Section I -- General
The following paragraphs illustrate how to fill out Section I of the PTRS Screen:
Inspector Name Code, Inspection Type, Activity Number and FAR: These fields are not
editable. To modify this information, hit the SELECT button next to the Activity Number or
FAR field. This action takes you to the PENS Login Screen where you can change the
information.
NPG: Check the box if the activity is an NPG required surveillance.
Status: Select Closed, Open or Planned from the status list.
Callup Date, Start Date and Completion Date: Modify these fields using the corresponding
arrow buttons. (Some of these dates are automatically filled based on the activity status.)
Results: Select one of the following result codes:
Completed: Indicates that the activity was completed. It is used to close out all work
activities except Surveillance.
Assistance: Used to prevent recording more than one unit of work for an activity when
inspectors of the same specialty combine their effort to accomplish an activity.
Satisfactory: Used to close out Surveillance activities and indicates the activity was in full
compliance. This code should only be used when no comments are made.
Information: Indicates that the result of the inspection was satisfactory in the Flight
Standards program area, but there is information in the PTRS Section IV that is pertinent to
future surveillance of the activity. Additional information must be provided in Section IV.
Follow up: Used in two ways, either to indicate that a corrective action was taken prior to
completing the Surveillance activity, or that a re-inspection was opened for completion in the
future to confirm continued compliance. Additional information must be provided in Section
IV.
Enforcement: Indicates that a violation was found and an enforcement action opened.
Additional information must be provided in Section IV.
X(Canceled): Indicates a Surveillance activity has been canceled. A planned activity should
be canceled when the scheduled date exceeds 60 days, if the same activity is scheduled at a
later date. Do not use X to cancel an NPG Required Surveillance, except when the DO's
division grants a deviation from the required Surveillance in accordance with FAA Order
1800.56.
Terminate: Indicates that a certification activity was aborted or that an NPG required
surveillance was terminated because the subject of inspection ceased operation or no longer
was active within the region.
Pass or Fail: Check either box to indicate the result of certification activity or the conclusion of
various evaluation activities.
Designator: Enter the designator code for the subject. If you do not know the code, hit the
SELECT button to access the Designator Screen.
The Designator screen will help you select the appropriate designator code for an operator.
One way to find the code is using the search function: Enter a portion of the operator name or
the designator code in the FIND field, then press the SEARCH button. The first matching
data will be highlighted. You may need to press the SEARCH button repeatedly until you
find the right operator.
An alternative method is to use the INDEX buttons (A-G to 0-9). Push the INDEX button
that contains the first letter of the operator name and then scroll until you find the desired
operator.
Once the right designator code is selected, press OK.
Airman Cert #: Enter the applicable certificate number.
Airman Name/Other: Enter the name of airman, non-certified organization, training course, or
topic of a special project as applicable, which is not associated with an Air Operator or an Air
Agency.
Aircraft Reg #: Enter the aircraft registration exactly as it appears on the registration.
Make: Enter the manufacturer of the aircraft. If you do not know the manufacturer, press either
the SELECT button or the Make/Model/Series button.
The SELECT button will access the Make screen. There are two ways to find the aircraft
manufacturer in this screen:
1. Enter the first few letters of the manufacturer name in the field FIND and press the
SEARCH button. The first matching entry containing these letters will be highlighted.
Additional manufacturers may be found by subsequent pushing of the SEARCH button.
2. Press an INDEX button containing the first letter of the manufacturer and then use the
scroll bar to find it. Tap the manufacturer name to select it.
Once the right manufacturer is highlighted, press OK. The cursor will change into an hour
glass while the software loads the models and series.
The Make/Model/Series button accesses the Make/Model/Series screen. This button can be
used instead of the above method, provided that you know the aircraft popular name, model,
or series. There are several ways of finding the aircraft code in this screen:
1. Enter the first few letters of either the manufacturer, popular name, model, or series in
the field FIND. Then press either one of these buttons: SEARCH MAKE (search the
manufacturer), SEARCH NAME (search the popular name), SEARCH MMS (search
the make, model and series), or SEARCH ALL (search all information). The first
matching entry containing these letters will be highlighted. Additional aircraft may be
found by subsequent pushing of the SEARCH button.
2. Press an INDEX button containing the first letter of the manufacturer and then use the
scroll bar to find the aircraft. Tap the aircraft name to select it.
Once the right aircraft is selected, press OK. The cursor will change into an hour glass
while the software loads the make, model, and series.
Model and Series: Select the appropriate Aircraft Model and Series from the corresponding
lists. (These codes will automatically be entered if you used the Make/Model/Series screen to
find the aircraft code.)
Depart: Enter the code for the airport most proximate to the location of activities conducted
outside of the office (for En Route inspections, enter the code of the departure airport). If you do
not know the code, hit the SELECT button to access the Airport Screen.
There are three methods to find the airport code in this screen:
1. Enter the first few letters of the city, airport name or airport code in the field FIND
and press the SEARCH button. The first matching entry containing these letters will be
highlighted. Additional manufacturers may be found by subsequent pushing of the
SEARCH button.
2. Enter the state where the airport is located, in the field STATE: and press the
SEARCH button. Use the scroll bar to find the airport. Then tap the airport name to
select it.
3. Press an INDEX button containing the first letter of the state (INTL for international
airports) and then use the scroll bar to find it. Tap the airport name to select it.
Once the right airport is selected, press OK.
Arrival: Enter the code for the arrival airport. If you do not know the code, hit the SELECT
button to access the Airport screen. (See the above information for searching the arrival airport
code.)
Flight #: Enter the flight number, if available.
Investigation #: Enter the investigation file number assigned to the accident, violation, incident,
or complaint associated with the activity.
Tracking: This field is only activated for certain activity numbers.
Miscellaneous: Enter miscellaneous information regarding a work activity. Enter "OBSVD" to
document examiner certification activities that are observed by inspector.
Numeric Misc: Enter items for later mathematics manipulation, e.g., the number of records
checked during a records system inspection.
Local Use: Used for temporary tracking of selected activities.
Regional Use: Used for temporary tracking of selected activities. This block may be used by the
DO on a temporary basis and may be preempted by the region.
National Use: Used for temporary tracking of selected activities. This block may be used by the
DO on a temporary basis and may be preempted by the national headquarters.
Activity Time: Enter the time consumed in the performance of an activity (rounded to the
nearest hour) when required in Appendices A through F or the PTRS Pocket Guide. Do not use
otherwise.
Geographic Activity: Check this box if you are performing the activity outside your geographic
area.
Travel Time: Enter the travel time, rounded to the nearest hour. Do not use unless directed by
management.
Travel Cost: Enter the travel cost. Do not use unless directed by management.
Triggers (Not Currently Functional): Used to automatically create new records containing some
or all information from Section I. It is usually used to trigger an enforcement activity or a
follow-up activity. INVS and REXM functions were used to generate letters of
investigations and reexaminations, but are no longer available with the PENS software.
Activity #: Enter a new activity number to automatically create another record with this
triggered activity number. The new record will have OPEN status and will contain some
information from Section I.
R#(repeat): Enter an R and the number of identical records you want to create (up to 50).
The new records will contain all information from Section I.
3.2
Section II -- Personnel
Current Personnel: Lists all personnel involved with the activity. Selecting an entry from the
list will display the data on that person and enable you to modify the data. The default list is
empty.
To record personnel information into the database, enter the information in the corresponding
fields and hit SAVE ENTRY or NEW ENTRY button.
To erase an entry, select the desired entry from the Current Personnel list and hit CLEAR
ENTRY.
Personnel Name: For an examiner's certification activity, enter the applicant's or the
recommending instructor's name. For other activities, enter the name of any personnel involved
with the activity. Enter one person at a time.
Position: For an examiner's certification activity, enter "APPL" (for applicant) or "RI" (for
recommending instructor). Otherwise, enter the job title of the personnel.
Base: Enter the airport code for the location where the person is stationed.
Remarks: For an examiner's certification activity, enter the certificate numbers of the applicant
or recommending instructors. Otherwise, enter any relevant data about the individual.
3.3
Section III -- Equipment
Current Manufacturer: Lists all manufacturers of the equipment or tools that are the subjects
of the inspector's evaluation or inspection. Selecting an entry from the list will display the data
on that equipment and enable you to modify the data. The default list is empty.
To record an entry into the database, enter the information to the corresponding fields and hit
SAVE ENTRY or NEW ENTRY button.
To erase an entry, select the desired entry from the Current Manufacturer list and hit CLEAR
ENTRY.
Manufacturer: Enter the name of the manufacturer of the equipment, component, or tool.
Model: Enter the model of the equipment, component, or tool.
Serial #: Enter the serial number of the equipment, component, or tool.
Remarks: Enter any relevant remarks about the equipment, component, or tool.
3.4
Section IV -- Comment
Section IV gives you the ability to classify observations or evaluations into specific areas of
interest. The fields: Primary, Key Heading, and Key Word, provide the means of this
classification. It also contains a special area where you can jot down short notes without the
notes being translated to printed characters. When you have the time, you can click the
TRANSCRIBE button, which will bring up a new screen that shows your notes. You may
transcribe those notes, including adding information, until you have completed that comment.
When you have completed the comment, press the DONE, ERASE INK button or DONE,
KEEP INK button. You must erase the ink before the PTRS form can be verified.
Primary: Select the general comment classification.
Key Heading: Select one of the headings.
Key Word: Select one of the key words for that heading.
Opinion: Select Unacceptable, Information, Potential or Exceeds from the list.
Comments: Lists all comments you have made under the above classifications
Transcribe: Accesses a screen where you can transcribe the short notes you have entered in the
field.
4.
PENS Function Buttons
PENS Functions buttons are located on the right side of the screen. The available functions are:
NEW: Creates a new PTRS form, with a new Record ID Number. This Record ID Number is
temporary and can be used to help you track your own forms. A permanent Record ID Number
will be assigned when you transfer your data to FSAS. Temporary Record ID Numbers can be
recognized by the word TEMP in the middle.
OPEN: Opens a previously saved PTRS form for subsequent editing. This opened form will
either use a temporary Record ID Number or a Record ID Number. Along with the Record ID
number, PENS provides the Activity number, Designator, Aircraft, Status, Results, and
Verification status to help you identify the desired file. You can also specify an activity code
and a designator, PENS will list only these Record IDs. (See Section 2.1 for more detailed
information.)
SAVE VERIFY: Checks the PTRS data to ensure that ll required fields have been completed
and that there are no conflicts between data. You will be notified of either case. When a form
does not pass the verification, you will be returned to the PTRS form. Thick black borders will
be placed around fields that need correction. Modify the form and re-verify the data. Only
verified forms can be transmitted to FSAS.
SAVE: Saves the current file without any verification.
PTRS: Accesses the PTRS screen.
Job Aid (Not currently functional): Accesses the Job Aid screen for your PTRS activity if
there is one available. Any data you record on the job aid will be automatically shared with the
PTRS form and vice versa.
REFS: Accesses the on-line versions of the Federal Aviation Regulations and the Inspector's
Handbooks. Which handbook is selected depends upon the inspection type. (Currently, only
the Airworthiness Handbook is available.) These on-line documents allow you to quickly find
specific information without having to thumb through the bulky paper books. Specific help for
these on-line references is available when you are using them.
AIRCFT (Not currently functional): Illustrates an improved capability to document visual
inspection. PENS provides line drawings for some Boeing and Airbus aircrafts. You can then
mark the area of defects and add your comment to the drawings. If the FSAS database were
modified properly, these drawings could then be saved with the PTRS data.
TOOLS: Accesses the standard windows for PEN computing tools:
Gives you information on editing gestures
Is not currently useful for PENS software
Is the standard on-screen keyboard
Starts the handwriting recognition trainer
Provides help for Windows for PEN Computing
HELP: Accesses PENS On-line Help File
EXIT: Exits the PENS software. If the changes in your PTRS form have not been saved,
PENS gives the following options before it exits:
Verify and Save: Saves and verifies your file.
Save without Verifying: Saves your file.
Don't Save Changes: Exits PENS without saving the changes you made.
Return to Form: Cancels the exit command and returns to the PTRS form.
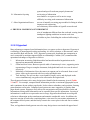
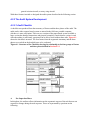
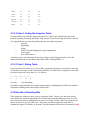
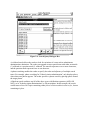
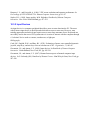
5.
Data Transfer Utility
The Data Transfer Utility allows you to transfer your PTRS records either directly to the FSAS
database or to a temporary data storage. The purpose of the temporary data storage is to hold
your data until your supervisor verifies the data. When your facilities do not require this
supervisor's approval, you can directly transfer the data to the FSAS database. Figure 2 shows
the Data Transfer Utility Screen.
5.1
Data Transfer Procedure
To transfer the data follow these steps:
1.
Connect the Xircom Adapter to your computer. (Follow the steps for Connecting the
Xircom Pocket Ethernet Adapter in your computer user manual.)
2.
Follow the prescribed network login procedure.
3.
Start the Data Transfer Utility.
4.
Select your name from the Select Inspector Name box.
5.
Select the type of data transfer from the Transfer... box. Files available from the
selected data transfer type will be shown in the Select Forms box. (See Type of Data Transfer
section for more detailed information.)
6.
Tap the file(s) you wish to tranfer with your pen. (Press the SELECT ALL button to
select all files; Press the UNSELECT ALL button to deselect all files.)
7.
Press the Transfer Files button. (Messages about the transfer status will appear on the
screen.)
8.
Repeat steps 5 to 7, if you would like to transfer other files.
9.
Choose DONE to exit from the Data Transfer Utility.
Figure 2. Data Transfer Utility Screen
5.2
Types of Data Transfer
Data Transfer Utility provides the following types of data transfer:
PTRS forms to Supervisory Review: This function transfers your PTRS data to a
temporary storage location where your supervisor can review it before it is entered into
FSAS.
PTRS forms from Supervisory Review to PEN: This function transfers PTRS data from
the temporary storage to your computer.
PTRS forms from Archive: This function transfers PTRS data from the archive to your
computer.
PTRS forms from FSAS to PEN: This function transfers PTRS data from FSAS to your
computer.
PTRS forms to FSAS: This function transfers your PTRS data directly to FSAS.
Delete PTRS forms from PEN: This function erases PTRS data from your computer.
Delete PTRS forms from Archive: This function erases PTRS data from the archive.
Handwriting files from PEN to TEMP: This function transfers handwriting recognition
files from your computer to a temporary network directory.
Handwriting files from TEMP to PEN: This function transfers handwriting recognition
files from the temporary network directory to your computer.
Note: Depending on your site's policy, the options: PTRS forms to Supervisory Review,
PTRS forms from Supervisory Review, or PTRS forms to FSAS may not be available to you.
5.3
Data Transfer Help
The Help function provides an on-line version of this manual.
6.
Supervisory Review Utility
The Supervisory Review Utility allows you to review your inspectors' PTRS data before it is
added to the FSAS database.
6.1
Supervisory Review Procedure
You have indicated that you wish to review your inspectors' PTRS data before it is added to the
FSAS database. Here are the necessary steps to run the utility:
1.
Start Windows.
2.
Start the Supervisor utility located in the PENS group. (When you start this program, it
loads the most recent record transferred by the Data Transfer Utility.)
3.
Examine the PTRS record. (Use the scroll bar to move the record up and down.)
4.
If you find errors or inconsistency in the record, write down the Record ID, the Inspector
name, and Activity Number. Notify the inspector about the errors or inconsistencies and ask
him to resubmit the revised record.
5.
Select Next or Prev to examine other PTRS records.
6.
Choose Transfer from the Form menu. (A transfer dialog box appears with a list of PTRS
records in the directory.) You can also select Print to print the current record.
7.
Tap the record IDs to select the records you want to transfer to FSAS. You can select more
than one record. The selected records will be highlighted. You can also use the Select All
button to select all records.
8.
To deselect a record tap the highlighted file with your pen (or mouse). Use the Unselect All
button to deselect all records.
9.
Press OK to transfer the selected records to FSAS and press Cancel to cancel the transfer
process.
10. Choose Exit! when you are finished.
6.2
Supervisory Review Help
The Help function provides an on-line version of this manual.
Hypermedia User Manual for FARS and Inspector's Handbook
1.
On-line Documentation
The PENS REFS button accesses the on-line versions of the Federal Aviation Regulations and
the Inspector's Handbook. (Currently, only the Airworthiness Handbook is available.) These
on-line documents allow you to quickly find specific information without having to thumb
through the bulky paper books. It also eliminates the necessity to carry the FARs and the
Handbooks to the field. Specific help for these on-line reference systems can be found when you
are using it.
Here are the necessary steps to access these documents:
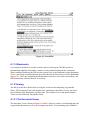
1. Press the PENS REFS button. A separate Galaxy Hypermedia window appears on your
screen.
2.
Press the Bookshelf button. Three book icons: FARs, Handbook and ADs, appear on the
screen. (See Figure 1.) The ADs book icon is disabled because the ADs documents have not
been incorporated into this version.
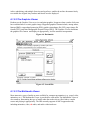
3.
Press the desired book icon to open the corresponding book. The topic outline of the book
will appear on the screen. (Figure 2 shows an example of the topic outline.)
4.
When the Outline is first displayed, all topics are shown in a collapsed state with subtopics
not shown. The three-dots following a file icon indicates the topic contains hidden
subtopics. To display hidden subtopics either press the file icon twice, or select the topic
and then choose the Expand menu item from the Outline Menu.
5.
All hidden subtopics can be displayed by choosing the Expand All menu item from the
Outline Menu.
6.
To hide subtopics for a selected topic, either press the selected topic file icon twice, or
choose the Collapse menu item from the Outline Menu.
7.
Subtopics for all topics can be hidden in one step by selecting the Collapse All menu item
from the Outline Menu.
8.
To view a selected topic (or subtopic) either press the selected topic twice, or choose View
Topic from the Outline Menu. A Viewer window will appear, displaying the selected
document. (See Figure 3.)
9.
You can also use the search function to quickly locate specific information. See the Search
section for more detailed information.
Searching for a specific information.
To search fro a specific information, first you will have to choose the location of the search from
the Search Menu:
This Chapter searches for the information in a chapter or a portin of the chapter.
Entire Book searches for the information in the whole book.
When you are searching for the information in a chapter, a Find dialog box will appear. (See
Figure 4.) Here are the steps to search for a specific phrase or term in a chapter.
1.
Enter the terms or phrase to search in the Find box, choose the search direction, and then
press OK. Boolean conditions can be assigned to the search string. For example, the search
string "(cats and dogs) or "wild horses"" will execute a search for the documents that
contain the terms "cats" and "dogs" or the phrase "wild horses".
2.
The Hypermedia Viewer will display and highlight the first occurance of the search term.
3.
Use either the Find Next icon or the Find Next menu item to find the next instances.
4. Use either the Find Previous icon or the Find Prev menu item to find the previous
instances.
When you are searching for the information in the entire book, a Search dialog box will appear.
(See Figure 5.) Here are the steps to search for a specific phrase or term in a book.
1.
Enter the terms or phrase to search in the Enter Search: box. Boolean conditions can be
assigned to the search string. For example, the search string "(cats and dogs) or "wild
horses"" will execute a search for documents that contain the terms "cats" and "dogs" or the
phrase "wild horses".
2.
Check the Same Paragraph button when you want to locate the paragraphs that contains all
the search terms or phrases.
3.
Press the Enter key or the Do Search button.
4.
The Topic Found box will display all topics where search conditions were satisfied.
5.
Press the topic twice to view the document.
Copying information to the PTRS form.
You can copy any information from the Viewer into the comment box in Section IV of the PTRS
form. Here are the steps to copy the information:
1.
Open the desired document.
2.
Select the portion you wish to copy by dragging your pen (or mouse) across the document.
3.
Select Copy from the Edit menu.
4.
Switch to the PENS PTRS form.
5.
Press the TRANSCRIBE button.
6.
Press Shift-Insert keys simultaneously.
Exiting the On-line Documentation.
Choose Exit from the File menu.
CHAPTER THREE
DESIGN OF PORTABLE COMPUTER-BASED
WORKCARDS FOR AIRCRAFT INSPECTION
Swapnes Patel, Amy Pearl, Sanjay Koli, and Colin Drury
State University of New York at Buffalo
Department of Industrial Engineering
John Cuneo
National Helicopter
Jay Lofgren
Continental Airlines
3.0 Abstract
From the analysis of workcards performed in Phase II, an improved paper-based workcard was
developed in Phase III. Issues raised and designs developed all directly apply to workcards on a
portable computer. Such a computer-based workcard system was designed, using an IBM
ThinkPad and hypertext software. It was implemented for eight tasks: five A-check tasks on a
B-737-200 and three C-check tasks on a DC-9-30. We undertook a direct test of the computer
system against both the original and improved paper-based systems, using eight inspectors
performing an A-check task of the landing gear of a B-737-200. Results show that the superiority
of the computer-based system enabled rapid learning by the inspector. Significant savings can
accrue from the use of such an integrated, portable system.
3.1 INTRODUCTION
The workcard, as the primary document controlling an inspection task, has a great influence on
inspection performance. During Phase I, many human-system mismatches were identified which
could contribute to errors. The costs of undetectable faults or faulty detection when weighed
against those of providing quality documentation make a strong case for developing optimum
documentation and for developing a methodology coupled with a set of guidelines for designing
such documentation. This study develops such a methodology based on applying human factors
knowledge to the analysis of aircraft inspection tasks. In Phase II, a paper workcard was
designed as a replacement for the current workcard. From this design, we developed a set of
guidelines to improve workcard design. This generic methodology can be extended to the design
of portable computer-based workcards.
Portable computer-based workcards can overcome some limitations of paper-based workcards.
Feedforward and feedback information can be presented, in addition to traditional directive
information. Access to detailed information in attachments and maintenance manuals is easier.
The display can act as an external working memory keeping all relevant information in front of
the user at all times. Computer-based information also provides additional flexibility for
organizing information about the tasks. Multi-layered information usage can cater to the needs of
both experts and novices. As an example of these benefits, Glushko (1989) described the
advantages of using an "intelligent electronic manual" in organizing the information contained in
maintenance manuals. According to Higgins (1989), there can be as many as 70 manuals for one
plane.
Advances in portable computing systems make it more feasible to realize these benefits. The
combination of inspectors' increasing information needs and technological advances ensures that
portable computer-based workcards will replace traditional hardcopy workcards. Specialized
computer hardware and software systems have been designed to automate complex diagnostic
tasks (maintenance) such as the Air Force's Integrated Maintenance Information System (IMIS)
(Johnson, 1989). There remains a need for a simpler, less-expensive system using off-the-shelf
components. Such computer-based systems have been aimed at diagnostic tasks, but here they
are applied to more information-intensive procedural tasks that form a major portion of aircraft
inspection activity. The objective of this study is to develop and test a prototype of a simple,
inexpensive inspection workcard implementation on a lap-top computer. Specifically, the design
had to be effective for both A-checks and C-checks.
3.2 METHODS
The computer-based workcard's design used and extended guidelines developed for the
paper-based workcard. Computerization of information solves some problems and opens a new
set that this project had to identify and resolve. The computer-based workcard's design was
compared against the paper-based workcard's to determine if these issues were properly
identified and resolved.
3.2.1 Hardware
The choice of hardware for the computer-based workcard was a critical issue. The original
paper-based system studied lacked a convenient hand-held integrated workcard holder, although
one was designed for the improved paper-based system. Current lap-top systems are inexpensive
and are getting smaller while adding new sets of features and sacrificing little in computing
power. Key breakthroughs in technology are feeding this process: storage devices are getting
smaller; IC designs supporting fewer chips are lowering power requirements (Linderholm, O.,
Apiki, S., and Nadeau, M., 1992). Also, designs are getting more rugged, inspiring confidence
when a computer is intended for field usage. Using these systems is still inconvenient, due to
keyboard and pointer interfaces. Systems operated by keyboards and mice partially defeat goals
of accessibility and connectivity (Meyrowitz, 1991). Pen-based computing allows links between
information to be created by a mere pointing gesture. Thus, the first step in implementing
computer-based workcards is to define the hardware requirements as part of the overall design
requirements.
3.2.2 Defining Design Requirements
During Phases I, II, and III of this project, we conducted field visits at various A-check and
C-check inspection sites. An A-check is a more frequent, less-detailed inspection. A C-check is a
less-frequent, more detailed inspection scheduled according to zones. Field visits included direct
observations, observational interviews, and personal interviews of inspectors (inexperienced as
well as experienced), technicians, and supervisors. Inspector's perceptions of workcard usability
were obtained from various inspection sites within the airline.
3.2.2.1 Inspector Feedback
During Phase II, mechanics' responses about using the A-check workcard usage indicated a
moderate level of satisfaction with the current workcard, as well as a number of users needing
different information. There was substantial agreement that the current order of information was
incorrect and that the sign-off procedure was not performed after every step. An analysis of the
task sequence preferences obtained from inspector's responses gave an optimal task sequence
(Galaxy Scientific Corporation, 1993).
Information readability and organization issues are similar for the C-check and the A-check. The
information content issue, however, is different so far as requirements for graphic information
are concerned. Most C-check inspectors seem to be troubled about information content, pointing
at a scarcity of information and their need for more and better quality graphic information. As far
as information organization was concerned, most users felt that there was no clear differentiation
between general and specific information.
3.2.2.2 Issues Identified within the Taxonomy
In the Phase III report, issues highlighted by the inspector responses and generic knowledge of
the tasks were compared against a taxonomy of guidelines for designing of paper-based
documentation to identify paper-based workcard design requirements. Table 3.1 presents design
issues for an A-check workcard; Table 3.2 does the same for a C-check workcard.
Computer-based workcards give flexibility beyond anything possible with paper-based systems;
thus, they are uniquely able to meet some of the requirements in Tables 3.1 and 3.2.
Table 3.1 A-Check Workcard: Issues identified within the Taxonomy
1. INFORMATION READABILITY
A. Typographic Layout
•no consistent typographic layout
•layout discontinuous, breaks within pages
•no usage of secondary typographic cueing, e.g., boldface, etc.
•no use of full justification of typographic material
B. Sentence, Word, and Letter
•non-conformability with printing conventions
•use of all capitals format, resulting in a low reading speed
•use of a 5x7 dot matrix typeface, hence no choice of any standa
2. INFORMATION CONTENT
A. Appropriate Content
•some inaccuracy in the information
•incomplete information for certain tasks
•language difficult to use and comprehend
•syntax not standardized
•directive information ambiguous
•generalization across aircraft types causes confusion
•not flexible for use by both novice and expert inspectors
•use of difficult acronyms
•logical errors and contradictory statements
•redundancy and repetition
•not consistent with user training
•does not foster generalizations across tasks, as every task is des
B. Graphic Information
•system unsupportive of graphics
•spatial information conveyed through text, resulting in the use
comprehend
3. INFORMATION ORGANIZATION
A. Information Classification
•no categorization or classification of tasks
•notes, cautions, methods, directions, etc., not prioritized
•no demarcation among directive information, references, notes
•directive information is not broken up into command verb, obje
•directive information includes more than two or three related ac
•general and specific information chunked together
•external and internal tasks not properly demarcated, mixed
B. Information Layering
•no layering of information
•not conducive to expert as well as novice usage
•difficulty in writing such unstructured information
C. Other Organizational Issues
•no use of naturally occurring page modules for fitting in inform
•improper task sequencing
4. PHYSICAL HANDLING & ENVIRONMENT
•physical handling difficult due to unwieldy size
•excessively heavy, cannot be held continuously
•usage in extreme environments difficult
•not compatible with the other tools used during the task
•inadequate lighting conditions
•no holder or place for holding the workcard while using it
•all these factors force inspectors to carry out the external inspec
memory.
Table 3.2 C-Check Workcard: Issues identified within the Taxonomy
1. INFORMATION READABILITY
A. Typographic Layout
•no consistent typographic layout
•layout discontinuous, breaks within pages
•no usage of secondary typographic cueing, e.g., boldface, etc.,
•no use of full justification of typographic material
B. Sentence, Word, and Letter
•non-conformability with some of the printing conventions
•use of all capitals format, resulting in a low reading speed
•no room for selecting an appropriate typeface
•use of a 5x7 dot matrix typeface
2. INFORMATION CONTENT
A. Appropriate Content
•some level of inaccuracy in the information
•incomplete information for certain tasks and lack of informatio
•language difficult to use and comprehend
•syntax not standardized
•directive information ambiguous
•generalization across aircraft types causes confusion
•use of difficult acronyms
•logical errors and contradictory statements
•redundancy and repetition
•does not foster generalizations across tasks, as every task is des
B. Graphic Information
interpretation
•no figure numbering, even though the workcard refers to specif
•no consistent layout of figures, use of mixed layout with no dem
•no consistency in view directional information, e.g., use of both
•non-contextual figure views, or views as the inspector sees it, ju
•no information to aid in spatial location of parts
•no back references to the workcard page/task which refers to th
•improper usage of technical drawing terms, e.g., "section• and
•no typographic differentiation between: figure titles, part name
•no use of standard drawing conventions, e.g., location of sectio
•same graphics for both left and right wing tasks, mentally inver
•some figures use high fidelity graphics, causing confusion and
•no consistency of scaling graphics, close-up views not differen
3. INFORMATION ORGANIZATION
A. Information Classification
•no categorization or classification of tasks
•notes, cautions, methods, directions, etc., not prioritized
•no demarcation among directive information, references, notes
•directive information is not broken up into command verb, obje
•directive information includes more than two or three related ac
•general and specific information chunked together
•general and specific tasks not properly demarcated
B. Information Layering
•no layering of information
•not conducive to expert as well as novice usage
•difficulty in writing such unstructured information
C. Other Organizational Issues
•no use of naturally occurring page modules for fitting in inform
•improper task sequencing
•no consistency in the number of signoffs across the task
4. PHYSICAL HANDLING & ENVIRONMENT
•size of attachments different from the workcard, causing inconv
•inadequate lighting conditions in certain work areas
•no holder or place for holding the workcard while using it
3.2.2.3 Hypertext
Many advantages computer-based information have over paper are due to hypertext. Hypertext is
a technology of nonsequential writing and reading: it is also a technique, a data-structure, and a
user interface (Berk and Devlin, 1991). Hypertext systems split documents into components or
nodes connected by machine-supported links or relationships. Conklin (1987) summarized the
operational advantages of hypertext as follows:
1.
Information structuring: Both hierarchical and non-hierarchical organization can be
imposed on unstructured information.
2.
Global and local views: Browsers provide table of contents-style views, supporting easier
restructuring of large or complex documents; both global and local views can be mixed
effectively.
3.
Modularity of information: Since the same text segment can be referenced from several
places, ideas can be expressed with less overlap and duplication.
4.
Task stacking: The user can have several paths of inquiry active and displayed on the
screen simultaneously; any path can be unwound to the original task.
These hypertext features solve many design issues identified in the taxonomy given in Tables
3.1 and 3.2. For example, computer-based information provides a consistent typographic layout
and a continuous layout with no page breaks. It also reduces redundancy and repetition, fostering
generalizations across tasks. Computer-based systems are more supportive of graphics than
paper-based systems. Hypertext easily allows for categorization and classification of tasks and
information so that general information can be separated from specific information. Layering of
information is conducive to expert and to novice usage. Hypertext should make accessing and
referring to information such as attachments and manuals considerably easier. In addition, the
inspector can sign off tasks after completing them, write notes For non-routine maintenance in
the computer-based system, and then easily return to the correct place in the task list to continue
inspection.
Thus, we hypothesize that hypertext can solve many design issues associated with paper-based
workcards. The next step is to design specific examples of computer-based workcards, using the
lessons learned from designing paper-based workcards, knowledge of hypertext, and information
on inspection tasks.
3.2.3 Development of the System
A prototype computer-based workcard system was developed on an IBM Think Pad 700 PS/2
using Spinnaker PLUS. This hypertext program is an object-oriented programming language that
simplifies creation of detailed information management applications by using links between
stacks of information. Eight different inspection tasks were implemented into the system.
A-check inspection tasks for a B727-200 included log books, nose landing gear, main landing
gear, aircraft wings, aircraft empennage, and aircraft fuselage inspection. Left wing and right
wing inspection for a DC-9-30 C-check were also implemented.
System design adhered to the lessons learned from developing of the paper-based workcard
identified in Tables 3.1 and 3.2. The design also followed design guidelines specific for
computer interfaces (Brown, 1988; Smith and Mosier, 1986). The specific guidelines which were
used to develop the computer-based systems are identified in Table 3.3.
Table 3.3 Design guidelines for the computer-based workcard system
1. INFORMATION READABILITY
1. Layout
•Use a fixed set of proportions/grids
•Use spatial layout as a primary cue for object grouping
•Use a consistent layout across fields
•Use fixed size/location for "functional category fields•
•Left justify the most important information
•Use blank lines in place of graphic lines to reduce clutter
2. Typography
•Use upper case only for short captions, labels, and headings
•Use conventional punctuation and formalisms
3. Metaphors
•Be very explicit in the use of metaphors
•Use explicit screen transitions, e.g., iris open vs. scroll
•Use paper form metaphor for data input
•Use soft button metaphor for all external links
4. Contrast
•Use contrast sparingly and as a last option
•Use contrast to attract attention to select portions of text
•Use a maximum of three levels of contrast coding
2. INFORMATION CONTENT
1. Input information
•Use familiar mnemonics for input
•Use congruent command pairs, e.g., R/Wrong, not R/Close
•Use "radio buttons• for all multiple choice information
2. System output information
•Use the display as an external working memory of the user
•Provide screen identity information
•Display only necessary information
•Condense all unnecessary information into icons
•Avoid a display density higher than 15%
•Use the inheritance metaphor to identify position in hyperspace
•Use affirmative dialogue statements
•Provide input acknowledgments and progress indicators
•Use auditory feedback conservatively
•System messages should be polite and instructive
•Do not provide a system-initiated help feature
3. Graphic information
•Use graphics to reduce display density
•Show all spatial, numeric, temporal information graphically
4. Iconic information
•Use icons for all direct manipulation
•Use icons to save display space and reduce clutter
•Use icons for all external links
•Use icons to permit cross-cultural usage
3. INFORMATION ORGANIZATION, MANIPULATION, AND ACCESS
1. Linking
2. General organizational
philosophy
•Provide contextual internal links
•Use internal links for all reference information
•Use external links sparingly and only for non-contextual informat
•Provide a link backtrack option
•Provide an UNDO option for navigation
•Make linking explicit; do not leave anything to exploration or bro
•Use linking sparingly to avoid user confusion and disorientation
•Label links where possible
•Organize for progressive disclosure and graceful evolution
•Keep layered information optional
•Do not use scrolling fields
•Organize tasks in a fixed linear as well as optional nested
structures
4. OTHER PRAGMATIC ISSUES
1. Physical handling and infield •Develop and implement standards for reverse video, contrast for v
•Follow a pencentric display design philosophy
•Design for a single-handed operation
•Minimize the use of key entries, use direct manipulation
2. Hardcopy
•Provide feasible options for obtaining hardcopies in a fixed forma
3. System response time
•Keep the system response times for all actions within standards
4. User acceptability
•Honor user preferences
•Provide only those functions that a user will use
3.2.3.1 Features of the System
The computer-based workcard meets these design guidelines with the following features. The
first workcard screen is the input manager the inspector/mechanic uses to enter data normally
found at the top of every page; the inspector/mechanic, the supervisor, and aircraft's
identification number. This information is then reproduced on all other documentation such as
the Accountability List and the Non-Routine Repair forms, relieving the inspector of repetitive
form filling. The global view displays all inspection tasks and highlights completed tasks,
serving as an external display to augment working memory. While performing the tasks, the
inspector/mechanic has direct access to both input and output information such as the general
maintenance manual, the airplane's manufacturer maintenance manual, engineering change repair
authorization(s), airworthiness directives, and attachments. This eliminates the need for the
inspector/mechanic to carry bulky attachments or to leave the inspection site to refer to a manual.
For each task, the inspector/mechanic has options of signing off, reporting a non-routine repair,
making a note on the writeup note feature, going to the home screen to show the signoffs
remaining for the task, going to the global screen, viewing an overview feature displaying the
number of completed signoffs, or using a help feature. All these features reduce memory and
information processing requirements on the inspector/mechanic. A continuously updated
Accountability List may also be viewed any time. This feature records the inspector/mechanic's
activity using the workcard such as signoffs done, notes made, and tasks previewed.
The system's outputs are the Accountability List and the Non-Routine repairs the
inspector/mechanic wrote up. An inspector/mechanic accesses these features by selecting icons
or radio buttons with pictures or labels designed for rapid learning. Links between these features
are explicit and always have a backtrack option. Information for performing the tasks was
categorized and layered to assist both experienced and inexperienced inspectors. General
information was separated from specific task-directive information. All spatial information was
conveyed through graphics. Thus, these features meet design requirements and address the issues
for developing workcards for aircraft inspection and the guidelines for human-computer
interfaces.
3.2.4 Usability Evaluation of the Computer-Based Workcard
3.2.4.1 Methodology
The computer-based workcard was compared against the current paper-based workcard and
against the proposed paper-based workcard designed in Phase III of this project. The comparison
was made using questions derived from the issues identified by the taxonomies in Tables 3.1 and
3.2. The evaluation and the specific questions were designed to be similar to the evaluation of
the C-check workcard performed in Phase III. Eight mechanics used all three designs of the
A-check workcards to perform a nose landing gear inspection with fifteen signoffs. They were
given an overall briefing as to the purpose of the study and general instructions, and they
answered a questionnaire on personal data. Before using the computer-based workcard,
mechanics were given a training session. A quiz on using the computer-based workcard ensured
that they understood how to use the workcard. After mechanics completed the inspection using
each form of the workcard, they were asked to complete a questionnaire evaluating that
workcard. The subjects rated their evaluation of the issues addressed by each question on a
9-point rating scale.
3.2.4.2 Results
Demographic data on the eight mechanics participating in the experiment are shown in Table
3.4. All values were reasonable for the mechanic population, including a large variability in
number of A-checks they perform each month.
Table 3.4 Personal data on mechanics used to evaluate workcards
Subject Characteristic
Mean
Standard Deviation
Age (years)
38.4
13.6
Years in civil aviation
9.9
8.8
Level of experience on A-checks (years)
4.6
1.7
Average number of A-checks performed every month
3.8
4.1
Years of computer experience
3.5
1.9
Two analyses of the evaluation response data are of interest:
1.
Whether the features of the computer-based workcard were judged better or worse than a
neutral rating.
2.
How the computer-based workcard was evaluated in comparison with the existing
paper-based workcard and the redesigned paper-based workcard.
Results of the first analysis are presented in Table 3.5. The three parts of this table identify
issues that were rated significantly better than neutral (A), not significantly different from neutral
(B), and significantly worse than neutral (C). Of the 39 issues, 25 are in (A); 13, in (B); and 1, in
(C), showing that mechanics were highly enthusiastic about most aspects of the system. Many
items judged better than neutral were overall evaluations such as the degree to which workcards
like those should be used, but some were for very specific features such as readability of buttons
and icons, both the overall concept and detailed design. Most of the neutral responses (B) were
for completeness and organization, or for features such as automatic generation of
Accountability list and Non-Routine Repair forms. The only feature mechanics significantly
disliked was one which showed what percentage of the standard time had been spent. As has
been found consistently in earlier phases of this project, mechanics strenuously resist
implications of time pressure in their jobs. The time feature has now been removed.
The computer-based workcard compared favorably against both the current and proposed
paper-based workcards. Tables 3.6A and 3.6B show the mean ratings and standard deviations
for the three workcards on each issue the computer- and the paper-based systems.
As in Table 3.5, results have been divided into those where there was a significant difference
among the three systems (Table 3.6A) and those where there was no difference (Table 3.6B).
The mechanics did not rate the computer-based system worse than the paper-based system on
any issue. Fourteen of the nineteen issues were judged significantly in favor of the
computer-based system, including all issues asking for an overall evaluation of the system,
overall ease of usability of workcard. The amount of information provided was judged almost the
same in all three systems. This result was expected since no information was added to or
subtracted from the original workcard to develop the two new systems.
Although the main comparison was between the original paper-based workcard and the
computer-based system, the inclusion of an improved paper-based workcard was instructive. In
addition to the omnibus test of difference among the three mean ratings used in Table 3.6, it is
possible to perform three pairwise tests of the three workcards:
•
Original paper-based versus computer-based
•
Original paper-based versus improved paper-based
•
Improved paper-based versus computer-based.
Table 3.5 Classification of evaluation factors as Better Than, Not Different From, and
Worse
Than Neutral Rating
A. Significantly Better Than Neutral Rating
p<0.01
p<0.05
•Readability of text
•Task of reading
•Readability of buttons and icons
•Information covered everything
•Readability of graphics
•Separating information by frequ
•Ease of understanding information
•Flexibility of use
•Ease of understanding symbols/icons
•Ease of referring to attachment
•Chance of missing information
•Often confused about location
•Degree of interest
•Often confused about how to re
location
•Degree to which rater would like to use workcard again
•Degree of fatigue after using th
•Degree to which workcards like these should be used
•Would rather rely on substituting computer for paper-based workcard
•Overall ease of usability
•Degree of simplicity
•Degree of tension while using system
•Usefulness of Global View feature
•Usefulness of Home View feature
•Usefulness of Automatic Non-Routine Writeup feature
•usefulness of direct access to all references
B. Not Significantly Better Than Neutral Rating
•Tasks were well organized
•Effort required in locating information
•Consistency of organization
•Ease of physical use
•Ease of writing up an Accountability List
•Ease of writing up a Non-Routine
•Ease of learning to use the computer-based workcard
•Need to refer to "Global View•
•Performance rating using the computer-base workcard
•Usefulness of Automatic Accountability List Generation feature
•Usefulness of Writeup Note feature
C. Significantly Worse Than Neutral Rating
•Usefulness of Time Overview feature
Table 3.6A Issues on which systems were significantly different; data is mean (SD)
Issue Addressed
9 Point Rating Scale End Points
Workcard System
Significance
0
8
Current
Improved
Computer
Ease of understanding
Very difficult
Very easy
4.4 (1.1)
6.25(1.7)
7.1(1.0)
0.02
Information covered everything
for task
Disagree fully
Agree fully
1.5(1.4)
4.4(2.4)
6.6(2.1)
0.01
Tasks were well organized
Disagree fully
Agree fully
1.9(1.6)
5.5(2.1)
6.1(2.4)
0.02
Effort required in locating
information
Very difficult
Very easy
1.8(1.4)
5.5(2.0)
5.8(2.0)
0.01
Consistency of organization
Terrible
Excellent
3.4(0.9)
5.3(1.0)
5.4(1.8)
0.05
Separating information by
frequency of use
Terrible
Excellent
3.3(1.6)
5.9(1.4)
6.1(1.6)
0.05
Chance of missing information
Always
Never
4.4(0.7)
6.5(1.7)
6.5(0.9)
0.01
Ease of physical use
Very difficult
Very easy
3.0(0.9)
5.5(2.1)
6.4(2.5)
0.05
Ease of referring to attachments
or manual
Very difficult
Very easy
1.8(1.7)
4.5(2.3)
7.0(1.9)
0.01
Ease of writing up an
Accountability List
Very difficult
Very easy
2.4(1.3)
4.8(2.3)
5.1(2.0)
0.05
Very interesting 2.3(1.7)
Degree of interest
4.8(1.0)
6.9(1.2)
0.01
Degree to which rater would
like to use W/C again
Definitely not
Very boring
Definitely yes
3.0(1.1)
5.8(1.3)
7.1(0.9)
0.01
Degree to which W/C like
these should be used
Definitely not
Definitely yes
3.1(1.0)
5.9(1.4)
6.3(1.2)
0.01
Overall ease of usability of W/C
Terrible
Excellent
2.5(0.9)
5.9(1.4)
6.5(1.4)
0.01
Table 3.6B Issues on which systems were non-significantly different; data is mean (SD)
Issues Addressed
9 Point Rating Scale End
Points
Workcard System
0
8
Current
Improved
Computer
Terrible
Excellent
4.0(2.1)
6.6(1.4)
6.5(0.76)
Very difficult
Very easy
3.9(2.0)
6.5(2.3)
6.6(1.8)
Amount of information
Too little
Too much
4.8(1.8)
4.0(1.1)
3.5(1.8)
Flexibility of use
Terrible
Excellent
3.5(1.4)
5.5(0.9)
5.6(1.8)
Ease of writing up a Non-RoutineVery difficult Very easy
2.9(2.4)
4.9(2.1)
5.4(2.2)
Readability of text
Task of reading
Table 3.7 shows comparisons for each of the 19 common questions made using the Wilcoxon
test. Note that 16 comparisons showed that the computer-based workcard better than the original
paper-based system, reflecting the results given in Table 3.6. The improved paper-based system
was better than the original paper-based system in 17 comparisons, and the computer-based
system was only rated higher than the improved paper-based system on 2 comparisons. It is
interesting that the two comparisons where the computer-based workcard was rated higher than
the improved paper-based workcard measured the inspector's degree of interest in the system and
in using the system again.
Improvement appears to better layout, organization, and presentation of information, whether on
hard-copy or on computer. The computer features add some benefit, but not much, to the
improved paper-based workcard. Indeed, of the total degree of improvement from the original
paper-based workcard to the computer-based workcard, an average of 81.6% across all rating
scales was due to the improved paper-based workcard. This re-emphasizes the benefits of
implementing good human factors principles in workcard design, whether or not the system is
computerized.
Our conclusion is that many improvement can be made without resorting to computer-based
systems. The text and graphics in our computer-based hypertext system were the same ones
used in the improved paper-based system. Thus, any company would be well-advised to modify
its paper-based system, as this completes most of the work needed to implement any future
computer-based system.
All mechanics quickly became familiar with the computer-based system; no mechanics took
more than one hour to learn the system well enough to go through the steps of single A-check
task. More time would obviously be required for mechanics to become fully adept at navigating
the system and using all of its features, but the time and cost overhead associated with
introducing this system is very low. This vindicates the design philosophy utilizes detailed task
analysis and human factors interpretation of the mechanics' jobs, and including feedback from
the mechanics themselves, to produce the final design.
Despite the good rating of ease of physical use (Tables 3.5 and 3.6), the computer-based system
will clearly benefit from improved hardware. Weighing 6 pounds and requiring both a keyboard
and a pointing device, the current system cannot be used as easily as, for example, a future
pen-based system. All features of the current hypercard system can be used directly on a
pen-based system, with the added advantage of bit-mapped storage of signatures. All that is
required is better screens for pen-based systems, and improved handwriting recognition for
filling out Non-Routine Repair forms rapidly. According to computer industry sources (see
Byte, October 1993) such systems should be fielded within a year.
Table 3.7 Pairwise comparisons among original paper-based, improved paper-based, and computer
Wilcoxon Test
Issue Addressed
9 point Rating Scale End Points
Significance of Current Paper-based
Workcard Versus
Significance o
vs. Compute
0
8
New
Paper
Workcard
Computer
Workcard
Terrible
Excellent
0.031
0.025
Task of reading
Very difficult
Very easy
n.s.
0.025
Ease of understanding
Very difficult
Very easy
0.025
0.01
Amount of information
Too little
Too much
n.s.
n.s.
Information covered everything
for task
Disagree fully
Agree fully
0.025
0.005
Tasks were well organized
Disagree fully
Agree fully
0.031
0.005
Effort required in locating
information
Very difficult
Very easy
0.005
0.005
Consistency of organization
Terrible
Excellent
0.025
0.025
Separating information by
frequency of use
Terrible
Excellent
0.025
0.025
Chance of missing information
Always
Never
0.025
0.005
Flexibility of use
Terrible
Excellent
0.031
n.s.
Ease of physical use
Very difficult
Very easy
0.025
0.01
Ease of referring to attachments
or manual
Very difficult
Very easy
0.005
0.005
Ease of writing up
an
Accountability List
Very difficult
Very easy
0.01
0.025
Ease of writing up a
Non-Routine
Very difficult
Very easy
0.025
n.s.
Very boring
Very interesting
0.01
0.005
Degree to which rater would
like to use W/C again
Definitely not
Definitely yes
0.01
0.01
Degree to which W/C like
these should be used
Definitely not
Definitely yes
0.01
0.025
Terrible
Excellent
0.025
0.005
Readability of text
Degree of interest
Overall ease of usability of W/C
3.3 CONCLUSIONS
A similar set of design guidelines to those used to improve paper-based workcards was
developed and used to design a portable computer-based workcard system for A-checks and
C-checks. An evaluation of this system against both the original and improved paper-based
workcards for one task of an A-check showed that the computer-based system is better than
either paper-based system.
Direct access to documentation reduced reliance on memory and waiting time to retrieve
information. Compared to the original paper-based workcard, the computer-based system was
easier to understand, reduced the effort to locate information, increased organization and
consistency of information, and increased overall workcard usability. Most of the improvements
from the computer-based system were also found for the improved paper-based system. It is
important to make human factors improvements to existing workcard systems even before they
are computerized. The mechanics found the computer-based workcards interesting and would
like to see them implemented at the workplace. The time necessary to become familiar with the
system was brief.
The next step in implementing the computer-based workcards is to update the system with future
hardware. Pen-based systems would assist in meeting the goals of hypertext better than lap-top
portable computers. The advantages of the computer-based workcards over their paper
counterparts make the implementation of the system into the workplace on future hardware well
worth the effort, but the usefulness of the improved paper-based system suggests that this aspect
should be implemented as a step towards a computer-based workcard.
3.4 REFERENCES
Berk, E. and Devlin, J. (1991). What is Hypertext? In Berk, E. and Devlin, J. (ed), In Hypertext
and Hypermedia H andbook, 285-297, NY: McGraw-Hill.
Brown, C.M. (1988). Human-Computer Interface Design Guidelines. Ablex Publishing
Corporation: Norwood, NJ. Byte, (October, 1993). PDAs arrive but aren't quite here yet. Vol.
18, No. 11, 66-86.
Conklin, J. (1987). Hypertext: An Introduction and Survey. (Report STP-356-86). Austin TX:
Microelectronics and Computer Technology Corp.
Galaxy Scientific Corporation (1993). Human Factors In Aviation Maintenance--Phase
Three, Volume 1 Progress Report, DOT/FAA/AM-93/15, Springfield, VA: National
Technical Information Service, 113-131.
Glushko, R.J. (1989). CD-ROM and Hypermedia for Maintenance Information. Proceedings
of the Second Federal Aviation Administration Meeting on Human Factors Issues in Aircraft
Maintenance and Inspection "Information Exchange and Communications," 121-140.
Higgins, R.G. (1989). Better Utilization of Aircraft Maintenance Manuals. Proceedings of the
Second Federal Aviation Administration Meeting on Human Factors Issues in Aircraft
Maintenance and Inspection "Information Exchange and Communications", 85-97.
Johnson, R.C. (1989). An Integrated Maintenance Information System (IMIS): An Update.
Proceedings of the Second Federal Aviation Administration Meeting on Human Factors Issues in
Aircraft Maintenance and Inspection "Information Exchange and Communications," 141-150.
Linderholm, O., Apiki, S., and Nadeau, M. (1992). The PC Gets More Personal. Byte, July,
128-133.
Meyrowitz, N. (1991). Hypertext and Pen Computing. Hypertext '91 Proceedings, 379.
Smith, S., and Mosier, J. (1986). Guidelines for Designing User Interface Software. Bedford,
MA: MITRE.
CHAPTER FOUR
ERGONOMIC AUDIT FOR VISUAL INSPECTION OF
AIRCRAFT
Sanjay Koli and Colin Drury
State University of New York at Buffalo
Department of Industrial Engineering
John Cuneo
National Helicopter
Jay Lofgren
Continental Airlines
4.0 Abstract
As more demonstrations of applying human factors interventions in aircraft inspection have been
completed, the need has arisen to give airlines a tool to determine which interventions are most
urgent in their own operations. An ergonomics audit was developed to provide a rapid evaluation
of potential human/machine mismatches in any inspection task. The audit consists of a method of
choosing tasks to be audited, an audit checklist, and a computer program evaluating checklist
responses against national and international standards to produce an audit report. An evaluation
of all three parts of the system showed that inspectors made consistent judgements for choice of
tasks, that the audit checklist gave consistent reliability among auditors, and that the computer
program produced valuable results for the airline partners cost-effectively.
4.1 INTRODUCTION
An aircraft's structure is designed to be used indefinitely, provided that any defects arising over
time are identified and repaired correctly. Most structural components do not have a design life
but rely on periodic inspection and repair for their integrity. The primary defects are cracks and
corrosion, resulting from the intermittent flexing of structures when in the air, from pressure
loads, and as a result of weathering or chemicals.
Inspection, like maintenance, is scheduled regularly for each aircraft. Each schedule is translated
into a set of workcards. Equipment impeding access to the inspected area is removed. The
aircraft is then cleaned, and the access hatches are opened. This is followed by the inspection
process. Inspection can be described as a complex socio-technical system exerting both mental
and physical stress on the inspectors and on other organizational players (Drury, 1985). At a
more detailed level, the inspection task can be broken into a set of subtasks which follow a
logical order (Table 4.1).
With these seven task steps, the complex problem of error control, design of equipment used,
and environmental issues become more manageable as specific human factors knowledge is
brought to bear on each issue in turn. Arising from human factors analyses of inspection tasks, a
number of studies have been completed under the auspices of the Federal Aviation
Administration, Office of Aviation Medicine (FAA/AAM). Projects with the airline industry
have considered improved lighting (Reynolds, Gramopadhye, and Drury, 1992), better
documentation design (Patel, Prabhu, and Drury 1992), revised training for visual inspection
(Gramopadhye, Drury, and Sharit, 1993) and the impact of posture and restricted space
(Eberhardt, Reynolds, and Drury, 1993). The aim of these studies has been to allow airlines to
benefit from ergonomics without their necessarily having trained ergonomists. There is now a
need to provide integrative tools enabling a maintenance organization to develop an overall
strategy for applying human factors principles systematically. The audit program developed in
this report is an essential step towards such integration.
Table 4.1 Generic task description of inspection with examples from visual and NDT inspection (Dr
TASK DESCRIPTION
VISUAL EXAMPLE
NDT EXAMPLE
1. Initiate
Get workcard. Read and understand area
to be covered.
Get workcard and eddy curre
Calibrate.
2. Access
Locate area on aircraft. Get into correct
position.
Locate area on aircraft. Posit
equipment.
3. Search
Move eyes across area systematically.
Move probe over each rivet h
any indication.
4. Decision-Making
Examine indication against remembered
standards.
Reprobe while closely watchi
current trace.
5. Respond
Mark defect. Write up repair sheet or if no Mark defect. Write up repair
defect, return to search.
no defect, return to search.
6. Repair
Drill out and replace rivet.
Drill out rivet. NDT on rivet
out for oversize rivet.
Visually inspect marked area.
Visually inspect marked
7. Buy-Back Inspect
area.
In order to know where to apply human factors, for example using the FAA/AAM-developed
Human Factors Handbook (Parker, 1992), it is first necessary to identify the mismatches
between the human (inspector) and the system (equipment, tools, environment). The audit
program provides a convenient, quantitative way to identify these mismatches. It starts from the
common ergonomics basis of inspection as a task/operator/machine/ environment system. The
audit's output can be used to focus design/redesign efforts where they will have the greatest
impact on reducing human/system mismatches which cause inspection and maintenance errors.
There have been previous ergonomics audit programs for manufacturing (Mir, 1982; Drury,
1988; Kittusway, Okogbaa, and Babu, 1992), but the problems of the aircraft hangar are different
from those of the factory floor. In inspection and maintenance, the workplace is rarely static;
task, equipment, and environment can change considerably throughout the course of a single
inspection task.
The original two-phase audit program (Mir, 1982) used outcome measures in Phase I to provide
an overall context of the plant, followed by a workplace survey (Phase II) of the departments
selected in Phase I. Information from first aid reports, medical records, OSHA reports of
accidents and injuries, workers' compensation payments, turnover rate, absenteeism frequency,
lateness reports, and productivity for the various departments were used to identify the most
representative departments for conducting the workplace survey.
Ergonomic Audit
The ergonomic audit developed here provides an overview of the inspection system's ergonomics
(human factors). It will not point out specific human errors that might result during the task;
rather, it indicates the important human factors issues that need to be addressed to improve the
performance of the operator doing the task. It compares the current conditions with the standards
prescribed by current human factors good practice, incorporating national and international
standards where appropriate. The report the computer program generates gives guidelines to
prioritize and systematize the application of human factors techniques, to improve and to achieve
the standards.
As with the previous audit programs for manufacturing (Mir, 1982), continuing observations of
the task specify a series of measurements that need to be made. Some are made with the help of
instruments such as light-meters or tape measures; others are answers to checklist questions. The
audit program is modular so that the auditor can apply the particular measurements needed for
each task.
4.2 REQUIREMENTS FOR AN AUDIT SYSTEM
4.2.1 Deciding Which Tasks to Audit
Every auditor has to use a sampling process. Any sampling strategy has to address the following
issues:
•
how to sample
•
how much to sample
•
how to appraise sample results (Hill, Roth, and Arkin, 1962).
For the ergonomics audit, how to sample is more important than how much to sample. The
mechanics of sampling may well decide the success or the failure of the test in providing the
auditor with valid, reliable information. First, the auditor needs to identify the basic unit to be
audited. In a manufacturing environment, the natural unit is the workplace. In inspection (or
maintenance) however, the task represented by the workcard is more appropriate since all job
and quality control procedures are already based on the task.
There are two possible sampling techniques: judgment sampling and statistical sampling
(Willingham and Carmichael, 1979). Judgment sampling selects items subjectively, without
statistical considerations for sample size, method of selection, or evaluation. Since selection
criteria are based on the auditor's subjective judgment, one obviously cannot project the sample
results to the entire population. Statistical sampling, in contrast, provides objective criteria for
sample selection and is more appropriate for quantitative ergonomics audit. Of the various
statistical sampling techniques available, only two can be effectively used to decide which task
to audit: random sampling and stratified random sampling (systematic sampling).
In random sampling, all tasks (workcards) have given an equal chance of being selected. While
ensuring that the sample selection is unbiased, random sampling may require larger sample sizes
to provide appropriate coverage.
However, an important additional consideration is the fact that all inspection tasks may not be
considered equally important. It may be more appropriate to concentrate on sampling those tasks
considered most critical. Stratification can be used to segregate items to be examined by
sampling within pre-determined groups, or strata, of tasks. Some care must be exercised while
establishing the strata. They should be determined so as to form a group having similar
characteristics. The methods discussed below provide one stratification strategy, although other
strategies can be adopted for screening tasks.
Parallel to the development of audit systems, there have been job analysis systems aimed at
evaluating the ergonomics and the technical design of working systems (Landau and Rohmert,
1989). The documentation and diagnosis of working system involves describing and quantifying
the system's elements and their characteristics, e.g., stresses they exert, deduction of design
needs, formation and verification of design properties, prevention of possible impairments by
detecting unsupportable stresses, and purposeful reduction of stresses. Thus, job analysis and
ergonomic auditing share many commonalities and have the same need to identify critical tasks.
The technique for selecting tasks (work-cards) in the ergonomics audit program used a points
system (Lanham, 1955) similar to those used in job evaluation systems. Any sampling system
must be:
•
able to provide a thorough study of all jobs to be evaluated
•
one which the supervisor and the employees can understand and are willing to
accept
•
easy to execute
•
able to produce a high degree of accuracy (Lanham, 1955).
A points system fulfills these requirements. The system uses judgements of inspectors and/or
management to determine which factors are important to error reduction.
The point system provides the rater with a scale or a "yardstick" to use in measuring the
differences among jobs. In designing a point scale, the following steps must be completed:
•
Select and define factors common to all the jobs to be evaluated
•
Allocate the number of degrees to each factor (length of the rating scale)
•
Weigh the factors, depending upon their relative importance
•
Assign point values to each degree of each factor.
The task to be rated is measured, factor by factor, against the scale. The degree on the scale most
nearly describing that factor's situation in that task is selected. The number of points which have
been assigned to that degree on the scale is assigned to the job. When the proper degree has been
selected for each job factor, the point values for the listed degrees are totaled. This sum
represents the final point value of the job in question.
In addition to the final point value, each task can also be judged, based upon the value of the
individual factors. For example, if one crucial factor of a generally low-rated task has been rated
exceptionally high, that task, too, will be audited.
4.2.2 The Ergonomics Audit System
After deciding which tasks to audit, the form and content of the audit system itself need to be
determined. Our audit was conceived as a two-part system. The first part is a checklist,
presenting the auditor with a set of ergonomic questions. Having answered the questions, the
auditor uses the second part, a computer program, to compare the answers against ergonomic
standards and to prepare an audit report detailing the inspector/system mismatches.
The audit's aim is to determine which aspects (task, operator, machine, environment) may impact
inspector-system mismatches. The content of the audit checklist could use any convenient
taxonomy of factors affecting human performance. Following Prabhu and Drury (1992) and
Latorella and Drury (1992), the following taxonomy:
•
Information Requirements - documents, communication
•
Equipment/Job Aids - design issues, availability, standards
•
Environment - visual, auditory, thermal
•
Physical Activity/Workspace - access, posture, safety.
Although this taxonomy defines factors affecting human/system mismatches, it is not in the most
convenient form for the auditor. To expedite auditing, it is preferable to turn to the generic task
description found in Table 4.1 and to restructure the audit to follow the sequence of inspection
tasks. These can be grouped into a pre-inspection phase (Initiate), an inspection phase (access,
search, decision, respond), and a post-inspection phase (repair, buy-back).
With this structure, it was possible to define more clearly the features necessary in the overall
audit system. An audit system must have the following features:
•
is modular, so as to include maximum coverage without unnecessary length.
Inserting new modules to modify the checklist and program for a particular
industry is easy
•
is self-explanatory, so as to minimize training time for auditors
•
is based on standards from ergonomics/human factors
•
has standards built into the analysis program, rather than into the checklist
questionnaire, to reduce any tendency to "bend" data in borderline cases
•
relies on measurements and easily observable conditions to reduce judgment
errors
•
is usable in different aviation environments, e.g., large fixed wing aircraft,
general aviation aircraft, or rotary wing aircraft.
With these features in mind we designed the audit system described in the following section.
4.2.3 The Audit System Development
4.2.3.1 Audit Checklist
A checklist was produced from the taxonomy of factors and the three phases of the audit. The
audit can be either a paper-based system or entered in the field on a portable computer,
whichever is more convenient. There are two versions of the paper-based system available: a
large version has detailed instructions and pictorial examples; a much shorter version is used
when the auditor is sufficiently experienced to be able to work without these aids. Figure 4.1
shows the checklist's structure. The four factors from the ergonomic taxonomy and the three
phases are overlaid on the detailed issues to be evaluated.
Figure 4.1 Structure of the Checklist, showing its relationship to the four groups of factors
and three phase defined in Section 4.2.1
A.
Pre-Inspection Phase
In this phase, the auditor collects information on the ergonomic aspects of the task that are not
expected to change during the task sequence. These are represented by questions on the
following:
•
documentation, communication during shift changes, etc.
•
visual and thermal characteristics of the environment
•
equipment design issues (NDT and access).
This information is gathered before the actual inspection to keep the auditor's effort (and any
interference with the inspector) to a minimum as the task progresses.
B.
Inspection Phase
During this phase, the auditor evaluates the main issues, i.e. information, environment,
equipment and physical activity. However, the auditor's focus is the task at hand and the way this
task is completed. The issues are the following:
•
usage of documentation, communication between workers/supervisor
•
task lighting, noise levels, operator perception of the thermal environment
•
equipment availability and standards
•
access, posture, safety.
C.
Post-Inspection Phase
This phase evaluates the maintenance activities, i.e. repair and buy-back. Although using the
same guidelines as the inspection task and following the same structure and sequence, some
additional modules have been included to address issues specific to maintenance activity.
4.2.3.2 The Computer Program (ERGO) for Audit Analysis
Turbo Pascal 6.0 was chosen as the language for developing the audit program. It is a structured,
high-level language with multiple overlapping windows, mouse support, a multifile editor, and
an enhanced debugging facility.
The audit analysis program has a data input module and a data analysis module. These are
further divided into several independent modules addressing specific issues of the preinspec-tion,
inspection and the post-inspection stages, e.g., documents, communication, visual characteristics,
access, and posture. The fundamental logic of both the programs is as follows:
•
opening the data file
•
accepting answers or values to the checklist questions
•
updating the counter
•
writing the answers to a data file
•
accessing the data file
•
comparing values with the correct value or answer
•
setting flags and proceeding to the next data set if the two answers are unequal
•
checking the position of all flags at the end of all data input
•
printing recommendations or prescribing guidelines for all the flags set.
A simple manual accompanies the program, showing how to
•
install the software onto a personal computer
•
run the program
•
create and view data files
•
access data files for analysis
•
create and view output files
•
print data and output files
•
abort from in within the program.
The manual has been written so that even novice computer users can install and run the program.
4.3 EVALUATION AND EVOLUTION
It is only possible to refine and develop a system such as this ergonomics audit program through
continual testing in operational environments. Two airline partners were involved in designing,
evaluating and developing this system. The first was a regional operation of passenger
helicopters; the second, a major national airline. The requirements were initially perceived to be
quite different for each environment, but a common audit system was eventually developed that
is applicable wherever aircraft inspection is performed. The only difference among the different
versions of the audit system is the choice of aircraft types in the examples and illustrations.
Versions exist for airline jets, regional turboprop airliners (or corporate aircraft), light aircraft
(general aviation), and rotary wing aircraft. It is worth repeating that the different versions exist
solely to make the auditors more comfortable by letting them see familiar aircraft illustrated: the
content of each checklist (and of the computer analysis program) is identical.
4.3.1 Sampling Plan Evaluation - The Point System
Before actually proceeding with the audit, it is imperative for the auditor to identify the
task/tasks to be audited. The criticality of a task does not necessarily indicate the magnitude of
its human factors mismatches. Those remain to be assessed by the audit checklist and the
program itself. The Point Rating scheme identifies tasks where the probability of error
occurrence is high and samples the likely problem areas.
4.3.1.1 Step 1. Selecting Factors
The basis of the sampling system developed was the experience and expertise of the employees
who rate these tasks. We want to know whether the component of the screening method reflects
the domain being tested and whether the components taken as a whole cover it in a
representative fashion.
We employed a method of "Multiple Judges" to enhance their confidence in judgments of
content validity. Eleven inspectors and three auditors were each asked to
•
study the definition of the aircraft inspection domain
•
generate a pool of possible factors influencing an inspection task
•
refine that pool.
As a result of a survey study, the factors listed below were identified:
•
Mental demands: the amount of information needed from documents, reference
manuals, and communication with the supervisor and co-worker
•
•
•
•
•
•
Physical demands: the amount of force/pressure to be exerted for task execution
Visual demands: illumination levels required for the complete inspection
Access demands: the space restrictions for carrying out the task
Postural demands: the awkward postures adopted to access and inspect)
Temporal demands: time stress during the inspection
Safety: how safe the inspector feels during the inspection.
4.3.1.2 Step 2. Ranking the Factors
After having identified the seven factors, the inspectors were asked to rank order these factors in
terms of their "degree of importance and criticality" with respect to the task. Ten inspectors with
three years or more experience on C-check inspections were asked to rank these factors. The
average ranking for the seven factors is as given below:
Most Important
Safety
Mental demands
Visual demands
Access demands
Physical demands
Temporal demands
Least Important Postural demands.
A correlation analysis was conducted of these ten inspectors' rankings. The correlations of the
individual subject readings with the average were relatively high, the lowest being 0.67. A
non-parametric measure of overall correlation, The Kendall Coefficient of Concordance (W),
measures the degree of association among inspectors had the value W = 0.674. This result was
highly significant (p < 0.001), showing considerable agreement among inspectors.
4.3.1.3 Step 3: Weighting the Factors
It is possible to use the ranking values obtained above to determine weightings for the seven
factors, using the Rank Order method (Guilford, 1954). In Table 4.2, the average ranks are
shown in the first column. The second column gives the normalized ranks, assuming an
underlying normal distribution of ranking responses by inspectors. Weights are then derived in
the third column by dividing all the normalized ranks by the largest one (6.5). Thus, according to
the inspectors' judgements, the least important factor (posture) should only receive just over half
of the weight (0.51) of the most important factor (safety).
Table 4.2 Development of factor weightings from average rank values
FACTORS
Safety
MEAN NORMALIZED
RANK
RANK
6.5
6.5
WEIGHTING
1.00
Mental
6.3
6.4
0.98
Visual
4.1
5.1
0.78
Access
4.0
4.9
0.75
Physical
2.8
4.6
0.71
Temporal
2.0
3.8
0.58
Posture
2.0
3.7
0.51
4.3.1.4 Step 4: Listing the Inspector Tasks
A comprehensive list of all the inspection tasks in a C-check were obtained from the airline
partners operating fixed-wing and rotary-wing aircraft. For the fixed-wing aircraft, the airframe
was segregated into six zones, depending upon the area under inspection:
•
Fuselage
•
Empennage
•
Wings
•
Wheel well and landing gear/cargo compartment
•
Power plant
•
Door and windows
A similar exercise was conducted for the rotary-wing aircraft's inspection tasks, where the
natural classification was into phase inspections (Phase I through Phase V).
4.3.1.5 Step 5. Rating Tasks
For a particular zone selected, e.g., power plant, experienced inspectors were asked to rate a list
of five tasks with respect to the seven factors indicated. For each task, the inspectors were asked
to rate the factors on a scale from 1 to 5 as follows:
|_____|_____|_____|_____|
1
2
very easy
3
4
5
very demanding
From these ratings and from the weights assigned earlier, sampling plans could be developed to
concentrate auditing effort onto the most critical tasks.
4.3.2 Results of Sampling Plan
Three inspectors with ten or more years of experience with C-checks were chosen to rate the
seven factors for each task listed under Power Plant Inspection and Wing Inspection. For each
task, each factor rating is multiplied by its respective weight, and the values were summed over
the seven factors to give one final score. The scores were then compared to each other to
estimate the degree of criticality of each task. The final ranking of the tasks is presented in Table
4.3.
For the rotary-wing airline partner, three inspectors with six or more years experience with Phase
inspections were chosen for a similar rating. The final ranking of the tasks is presented in Table
4.4.
From the data presented in Tables 4.3 and 4.4, it is apparent that differences among tasks are not
large. Thus, while some tasks were found to have more critical ergonomic needs than others,
none could be safely neglected.
Table 4.3 Final criticality ratings of power plant and wing inspection tasks
RANK
POWER PLANT TASKS
WING INSPECTION TASKS
1
Power plant inspection (15.04)
Tee Cap inspection (14.1)
2
Thruster-reverser drive link inspection (13.74)
3
Pylon inspection (13.17)
Aft spar wing control inspection (12.89)
4
Engine accessory inspection (12.16)
Flap hinge bracket penetrant inspection (10.97)
5
Power plant check (11.43)
Flap hinge bracket inspection (10.66)
Wing inspection (13.59)
Table 4.4 Final criticality ratings of inspection tasks on Sikorsky S58T and Bell 206L type aircraft
RANK SIKORSKY S58T
BELL 206L
1
Phase I (18.87)
Phase III (20.23)
2
Phase V (14.46)
Phase IV (15.49)
3
Phase IV (13.94)
Phase II (15.42)
4
Phase III (13.71)
Phase I (13.16)
5
Phase II (13.47)
The final result of these manipulations can again be tested for its reliability. If the inspectors are
indeed judging consistently, then there should be a high degree of agreement among the final
rankings of the tasks. Thus, the same inspectors were asked to rank the criticality of the tasks
within each of the four sets ("fixed wing power plant" to "Bell 2062"), and these rankings were
compared using the coefficient of concordance. All four values were significant at p < 0.01, with
values as follows:
Fixed Wing, Power Plant
0.913
Fixed Wing, Wing Inspection 0.813
Rotary Wing, Sikorsky S58T 0.910
Rotary Wing, Bell 2062
0.900
These results in fact do show a high and significant level of agreement.
4.3.3 Audit Checklist
The Audit checklist evolved over three different versions. Version 1.0 contained questions in 18
modules spread over the Pre-Inspection, Inspection, and Post-Inspection Phases. This version
was evaluated at the sites of both airline partners. The need for graphics was identified because
of their greater comprehension capabilities. Graphics were incorporated in Version 2.0. Version
2.0 retained the same structure as the previous checklist. A few questions were appended with
self-explanatory diagrams while others were rephrased to reduce ambiguity. This checklist was
then tested for reliability at two different sites.
4.3.3.1 Reliability of the Ergonomic Audit (Version 2.0)
The ergonomic audit was administered simultaneously by two trained auditors on the following
three tasks, spanning two aircraft types:
•
Audit 1 - Sikorsky S58T Phase III Main Rotor transmission inspection
•
Audit 2 - Wing Inspection on a DC-9
•
Audit 3 - Lavatory Inspection on a DC-9.
The differences between the two auditors were analyzed using the Cochran Q test, which is a
strong test to determine whether the same treatment generates different responses between
subjects. The value of the test statistic X2 for each test is shown in Table 4.5; all differences are
significant at p < 0.05.
Table 4.5 Test for significance of differences between auditors
TASK AUDITED
X2
1
Audit 1 S58T Phase III Main Rotor 7.14
inspection
2
Audit 2 DC-9 Wing inspection
3
Audit 3 DC-9 Lavatory inspection 5.00
5.00
Thus, results were different between the two auditors. Since the significant test did not
indicate which questions had different responses between the auditors, these had to be
determined by post-hoc investigations. As these differences were found, the audit program was
redesigned to provide a checklist giving identical results for each auditor.
There are two ways to compare differences between the auditors: by module and by question
type. First, the mismatches between the two auditors were determined for each of the 18
modules; these results are shown in Figure 4.2. The modules on Posture and Task Lighting
showed the greatest number mismatches, but examination of these modules did not reveal a trend
in the type or the number of mismatches.
In order to better understand these disparities, checklist questions were divided into three
categories, dependent upon the type of question and, hence, upon possible errors in answering
the question. Thus, any question on the checklist either result in either a Reading-Off Error, an
Operator Perception Error, or an Auditor Judgment Error. Overall, 54% of the questions were
reading-off type questions; 24% operator perception type; and 21% auditor judgement type.
Figure 4.3 shows the percentage of each error type inspectors made on each of the three tests.
As seen in Figure 4.3, most errors were due to auditor judgement, followed by operator
perception. Reading-off errors contributed a very small percentage to the total errors.
Thus, in order to reduce the mismatch between auditors, auditor judgement errors have to be
reduced to the minimum. This can be achieved by the following strategy:
•
Have more explicit instructions assigned to auditor judgement type questions
•
Reduce the number of "auditor judgement" type questions and increase the
number of "read-off" type questions.
•
Provide better training for auditors.
Figure 4.2 Frequency of mismatches for the three audits by modules
Figure 4.3 Percentage of each error type on each test
Version 3.0 of the audit checklist incorporated all of the above recommendations and was tested
for reliability by having two auditors administer audits simultaneously on the task (Audit 4) of
the Left Power Plant Inspection on a DC-9. The differences between the two auditors were
analyzed using the Cochran Q test, referenced earlier. The value of the test statistic X2 was now
not even significant at p < 0.10, showing that results did not change between the two auditors
(Table 4.6). Thus, Version 3.0 of the audit was deemed to have proven reliable.
Table 4.6 X2 Table to test for significance
AUDIT
4
TASK AUDITED
X2
Audit 4 - Left Power Plant 2.1
Inspection/DC-9
4.4 THE AUDIT SYSTEM IN PRACTICE
Both airline partners have used the training version of the checklist and the computer
documentation produced, although each partner has used the audit system in a rather different
way. The rotary-wing operation performed several audits, and the results were combined to
guide management in implementing changes. From this compilation, it was determined that the
major ergonomic needs were documentation redesign, task lighting, and access equipment
redesign. Steps have now been taken to begin implementing changes, based upon the findings.
The audit program will be used after implementation to measure the effectiveness of the changes.
Our other airline partner has incorporated the audit program into its on-going Quality Assurance
program. A single auditor has been trained, and regularly uses the system to produce audit
reports on specific inspection activities. An example of output from the program is Chapter 4
Appendix, obtained after an audit of a fixed-wing aircraft late in 1993. Names, dates, and
numbers have been changed to preserve anonymity.
The audit evaluation takes the form of an auditor's memo to a supervisor, using heading
information generated within the program. This format can readily be changed, as the output file
is a simple text file suitable for input into any word processor. Also, the output does not simply
identify a mismatch. It provides some guidance as to how corrections can be made, for example
by giving recommended illumination levels or recommended air temperatures. The audit
program is no substitute for a detailed ergonomic analysis, but it does provide a rapid tool for
identifying error-likely situations. For more detailed recommendations, the FAA/AAM Human
Factors Guide should be consulted.
Finally, the audit program takes about 30 minutes to administer. As this is less than the time
typically required to type an audit report, the system is time-saving and cost-effective in addition
to providing wider access to human factors techniques in aircraft inspection.
4.5 REFERENCES
Drury, C. G. (1985). Stress and quality control inspection. In Cooper, C. L. and Smith, M. J.
(Eds.), Job Stress and Blue Collar Work, 7, Chichester, UK: John Wiley and Sons, Inc.
Drury, C. G. (1988). Inspection performance and quality assurance: Job Analysis Handbook,
Chapter 65, New York: J. Wiley.
Drury, C. G. and Lock, M. W. B. (1992). Ergonomics in Civil aircraft inspection. In
Contemporary Ergonomics, London: Taylor & Francis, 116-123.
Eberhardt, S., Reynolds, J., and Drury, C. G. (1993). Effect of working postures in confined
areas. FAA/AAM 8th Meeting on Human Factors Issues in Aircraft Maintenance &
Inspection (in press).
Gramopadhye, A., Drury, C. G., and J. Sharit (1993). Training for decision making in aircraft
inspection. Proceedings of the 37th Annual Human Factors and Ergonomics Society Meeting,
Seattle, WA, 1267-1271.
Guilford, J. P. (1954). The method of rank order. Psychometric Methods, 8, New York:
McGraw-Hill, 178-196.
Hill, H. P., Roth, J. L., and Arkin, H. (1962). Why statistical sampling? Sampling in Auditing
-A Simplified Guide and Statistical Tables, 1, New York: The Ronald Press Company, 1-10.
Kittuswamy, N., Okogbaa, O. G., and Babu, A. J. G. (1992). A preliminary audit for
ergonomics design in manufacturing environments. Industrial Engineering, July 1992,
47-53.
Koli, S., Drury, C. G., Cuneo, J., and Lofgren, J. (in press). Ergonomic audit for visual
inspection of aircraft, Human Factors in Aviation Maintenance - Phase 4 Progress Report.
Lanham, E. (1955). Selection of the rating plan. Job Evaluation, 4, New York: McGraw-Hill
Book Company, 39-52.
Latorella, K. A. and Drury, C. G. (1992). A framework for human reliability in aircraft
inspection, In Meeting Proceedings of the Seventh Federal Aviation Administration Meeting on
Human Factors Issues in Aircraft Maintenance and Inspection, Atlanta, GA, 71-82.
Mir, A. H. (1982). Development of ergonomic audit system and training scheme, M.S. Thesis,
State University of New York at Buffalo.
Parker, J. (in press). Human Factors Guide, Bio-Technology, Inc.
Patel, S., Prabhu, P., and Drury, C. G. (1992). Design of work control cards. In Meeting
Proceedings of the Seventh Federal Aviation Administration Meeting on Human Factors
Issues in Aircraft Maintenance and Inspection, Atlanta, GA, 163-172.
Prabhu, P. and Drury, C. G. (1992). A framework for the design of the aircraft inspection
information environment. In Meeting Proceedings of the Seventh Federal Aviation
Administration Meeting on Human Factors Issues in Aircraft Maintenance and Inspection,
Atlanta, GA, 83-92.
Reynolds, J. and Drury, C. G. (1993). An evaluation of the visual environment in aircraft
inspection. Proceedings of the 37th Annual Human Factors and Ergonomics Society Meeting,
Seattle, WA, 34-38.
Reynolds, J. L., Gramopadhye, A., and Drury, C. G. (1992). Design of the aircraft
inspection/maintenance visual environment. In Meeting Proceedings of the Seventh Federal
Aviation Administration Meeting on Human Factors Issues in Aircraft Maintenance and
Inspection, Atlanta, GA, 151-162.
Rohmert, W. and Landau, K. (1989). Introduction to job analysis. A New Technique for Job
Analysis, Part 1, London: Taylor & Francis Ltd., 7-22.
Willingham, J. J. and Carmichael, P. R. (1979). Sampling for audit evidence, Auditing Concepts
and Methods, 6, New York, McGraw-Hill, 166-195.
CHAPTER FOUR APPENDIX - Example Output from
Ergonomic Audit
TO
:Ms Supervisor
FROM
:A.N. Auditor
Task Description :APU Compartment Inspection.
Date
:August 4, 1993
Time
:3:00 am
Station
:LHR
Hangar Bay
:
Aircraft No.
:A300
M/E No.
:87-1831-1-0001
Q/A No.
:24A76
HUMAN FACTORS MISMATCHES/RECOMMENDATIONS IN PRE-INSPECTION/DOCUMENTATION
A. Information readability
1. Typographic layout of the current workcard is inconsistent with other work cards. Maintain interdocument consistency in
terms of:
a: Spatial organization b: Font type, Font size
c: Typographic cues (e.g., boldfacing, italics, etc.)
2. Make use of typographic cues. For spatial layout use Primary type cues like:
a: Vertical spacing
b: Lateral positioning
c: Paragraphing
d: Heading positioning
Within the spatial layout use secondary type cues like:
a: Bold-facing
b: Italics
c: Capital cueing d: Underlining, etc
3. Dot matrix printers with a 5X7 matrix of dot characters is minimally acceptable for reading purposes. If used, check for
character specifications:
Minimum Character Height = 3.1mm to 4.2mm
Maximum Character Height = 4.5mm
Width/Height ratio
= 3:4 - 4:5
IMPORTANT: Do not use lower case letters, since features can get easily confused.
4. Graphics/attachments illegible. Likely causes:
a: Photocopy deterioration
b: Microfiche copy deterioration
c: Blueprint copy deterioration
5. Standards are not prescribed. State "TIME" and "QUALITY" standards to ensure consistent print quality.
B. Information Content
Text
6. Feedforward information not provided to the inspector. Present information on
a: previous faults detected b: locations of prior faults c: likely fault prone
areas for the specific task and current aircraft under inspection.
Graphics
7. Present information on body station positions in a graphical format. All spatial information should be presented in a
diagrammatic form.
C. Information Organization
8. Incorrect sequencing of tasks in the workcard. Tasks need to be sequenced in the natural order in which the task would be
carried out by MOST inspectors.
9. Avoid carryover of tasks across pages at ILLOGICAL points. Tasks should begin and end on the same page. For longer tasks,
break into several subtasks with multiple sign-offs. Each subtask, should then begin and end on the same page.
10. Excessive number of tasks per action statement. More than 3 actions/step increases the probability of action slips.
HUMAN FACTORS MISMATCHES/RECOMMENDATIONS IN PRE-INSPECTION/COMMUNICATION
HUMAN FACTORS MISMATCHES/RECOMMENDATIONS IN PRE-INSPECTION/VISUAL CHARACTERISTICS
1. Mercury Vapor lamps: "Poor" color rendition properties. Color rendition is the ability to distinguish true colors correctly. This
is especially useful in detecting corrosion faults. For best results consider incandescent bulbs.
2. No "shades/shields" on illumination sources. This may cause "direct" or "disability" glare.
HUMAN FACTORS MISMATCHES/RECOMMENDATIONS IN PRE-INSPECTION/ACCESS
ACCESS - STEP LADDERS
1. The height of the step ladder is 36.00 inches. The maximum height should be 27 inches.
ACCESS - TALL STEP LADDERS
HUMAN FACTORS MISMATCHES/RECOMMENDATIONS IN INSPECTION/DOCUMENTATION-PHYSICAL
HANDLING & ENVIRONMENT FACILITY
1. The inspector does not sign off workcard after each subtask. This may lead to errors of omission.
2. Writing tools do not facilitate writing in all positions. Consider providing a workcard holder.
3. The inspector does not fill out discrepancy sheets/Non-Routine Repair sheets as soon as fault is detected. This may lead to
errors of omission.
HUMAN FACTORS MISMATCHES/RECOMMENDATIONS IN INSPECTION/COMMUNICATION
1. The inspector felt that verbal instructions from the supervisor were not explicit.
2. No performance feedback was given to the inspector conducting the task. Consider intermittent supervision by the supervisors
to indicate when inspector was not performing up to standards.
3. The inspector was not encouraged to identify error likely situations in "Existing Designs".
4. The inspector was not encouraged to identify error likely situations in "Existing Procedures".
HUMAN FACTORS MISMATCHES/RECOMMENDATIONS IN INSPECTION/TASK LIGHTING
1. The average task illumination is 72.50 foot candle (fc) and the variance is 2718.75. The recommended task illumination
should be 100.00 fc. The variance is exceptionally high.
2. Hand lamps deliver a maximum of 85 fc. of light. This illumination level is inadequate for "Detailed Inspection". Hand lamps
also lack aiming control. Consider usage of Standing Lamps (Halogen 500 watts - 1200 fc.) or Portable lamps (Florescent 27
watts - 164 fc.).
3. Consider head lamp for hands free illumination; except in explosive environments. e.g., Fuel tank inspection.
HUMAN FACTORS MISMATCHES/RECOMMENDATIONS IN INSPECTION/THERMAL CHARACTERISTICS
1. The current DBT is 31.00 degrees centigrade. The recommended temperature is between 20-26 degrees centigrade.
2. The current task has been identified as having MODERATE physical workload. The current air velocity is LOW (less than 1.5
m/s), and the WBGT is 29.00 cent. The recommended WBGT values for MODERATE w/load and LOW air velocity is 30 de.g.,
or less.
3. The current task has been identified as having MODERATE physical workload. The DBT is 29.00 cent. and the clo value for
clothing is 0.58 clo. The recommended DBT values for MODERATE w/load and clo values between 0.5-0.75 are 18-22 degrees
centigrade. Consider change in clothing.
HUMAN FACTORS MISMATCHES/RECOMMENDATIONS IN INSPECTION/OPERATOR PERCEPTION OF
THERMAL ENV.
1. The operator found the current workplace temperature to be slightly warm.
2. Operator wanted the workplace temperature to be cooler than the current temp.
3. The operator found the summer temperature at the workplace to be warm.
4. Operator wanted the summer temperature at the workplace to be cooler than the current temperature.
5. The operator found the winter temperature at the workplace to be cool.
6. Operator wanted the winter temperature at the workplace to be warmer than the current temperature.
HUMAN FACTORS MISMATCHES/RECOMMENDATIONS IN INSPECTION/AUDITORY CHARACTERISTICS
1. The variance is high.
2. This task involves verbal communication. The average noise level is 65.00 dbA. The distance of communication is 20.00 feet.
The noise level for communication at a distance of 10-20 feet should not exceed 50 dbA.
HUMAN FACTORS MISMATCHES/RECOMMENDATIONS IN INSPECTION/ACCESS EQUIPMENT USAGE
1. Neither the correct access equipment nor the substitute access equipment was available.
HUMAN FACTORS MISMATCHES/RECOMMENDATIONS IN INSPECTION/ACCESS - ACTIVITY
1. The operator felt that access was difficult.
2. Access equipment was repositioned too frequently. This consumes a lot of operator effort. Consider using multiple access
equipments.
HUMAN FACTORS MISMATCHES/RECOMMENDATIONS IN INSPECTION/POSTURE
The following extreme postures were observed during the current inspection task:
Urgent intervention is requested.
1. Arms in air, back bent and loading on one leg.
2. Arms in air, back twisted and loading on one leg.
3. Back bent and twisted and loading on one leg.
HUMAN FACTORS MISMATCHES/RECOMMENDATIONS IN PRE-INSPECTION/SAFETY
1. No safety attachments provided when operator performs inspection at heights. Consider using safety screens on stair landings,
rails, cages etc.
HUMAN FACTORS MISMATCHES/RECOMMENDATIONS IN POST-INSPECTION/FEEDBACK
1. Consider inclusion of standard information like ATA codes, station #, sup.#, employee #, etc. in the workcard. This
considerably reduces the cognitive load on the inspector.
CHAPTER FIVE
INVESTIGATION OF ERGONOMIC FACTORS
RELATED TO POSTURE AND FATIGUE IN THE
INSPECTION ENVIRONMENT
Jacqueline L. Reynolds
and
Colin G. Drury
State University of New York at Buffalo
Department of Industrial Engineering
Steve Eberhardt
Northwest Airlines - Atlanta
5.0 Abstract
Aircraft inspection tasks are often performed under extreme conditions which may cause
increased operator stress, fatigue, and workload. Several factors, particularly restrictive spaces
that cause extreme postures, have been identified as possible contributors to stress and fatigue in
the aviation maintenance environment. These factors are dictated by design itself and by the
access equipment employed. Following the development of a methodology for studying fatigue
and restrictive spaces (Phase III), a set of four tasks from the C-check of a DC-9 were used to
evaluate these effects. Inspectors were observed performing each task to collect postural data,
and psychophysical scales were used to measure fatigue, postural discomfort, and workload. All
showed that the same tasks have the greatest impact on the inspector. On the basis of those
findings, improvements were generated and are now being implemented at the partner airline.
5.1 INTRODUCTION
Aircraft structures are designed as a compromise among aerodynamics, strength, weight, and
access. Optimum access must be conceded in order to meet other requirements, thus requiring
many aircraft inspection and maintenance tasks to be performed in non-optimum conditions
which may lead to fatigue.
Ergonomic factors in aircraft inspection and maintenance tasks may cause extreme working
conditions. One of the most noticeable deviations from ergonomically optimum conditions is
that tasks must be performed in restricted spaces that force awkward postures. Literature
reviewed during Phase III indicates that tasks possessing excessive postural demands, e.g.,
cramped positions and maintenance of awkward postures, can produce fatigue and ultimately
affect both performance and well-being (see Corlett, 1983; Corlett and Bishop, 1978; Hunting,
Grandjean, and Maeda, 1980; Van Wely, 1970; Westgaard and Aaras, 1984). The project
reported in this paper arose from a task statement to propose a methodology to study extreme
ergonomic conditions, particularly restrictive or confined spaces, and their effect(s) on human
posture, performance, and stress.
Characteristics of the environment, operator, and task may produce fatigue and stress. We model
to guide research in describing and predicting the effects of extreme ergonomic factors and
associated postural, fatigue, and stress effects on performance and workload. We undertook
on-site evaluation in order to 1) to measure and determine if increased stress and fatigue levels
exist in the aviation maintenance and inspection environment; 2) to determine if techniques and
methods used successfully to measure fatigue and workload in non-aviation environments could
be applied to this environment; and 3) if increased levels of stress, fatigue, and workload were
found, to provide ergonomic interventions to improve this environment.
5.2 RESTRICTIVE SPACE MODEL
The Restrictive Space Model (Figure 5.1) systematically describes a space or task area in terms
of inputs, or ergonomic factors defining a physical or perceived space, and outputs allowing the
effects of the space to be understood and predicted.
Figure 5.1 Restrictive Space Model
5.2.1 Ergonomic Factors
In order to describe and eventually to predict the effects of operator response on performance
and workload, we must understand the effects stress and fatigue have on the operator. During
Phase III, ergonomic factors which may produce fatigue and ultimately effect performance and
well-being were identified; these factors are listed in Table 5.1 (Galaxy Scientific Corporation,
1993). This compilation of factors is not exhaustive. There are a number of other (lesser)
environmental, task, and operator characteristics which could contribute to fatigue effects, e.g.,
temperature, gender, and age. However, the listed factors have been identified as being the most
salient and prominent possible contributors to fatigue in the aviation inspection/maintenance
environment. They provide a starting point to focus these investigations.
Table 5.1 Ergonomic Factors
Area/Volume of Workplace
Task Duration
Equipment/Tooling Used
Workplace Lighting
Social Factors, e.g., resource
availability
Surface Condition of Adjacent Surfaces
5.2.1.1 Area/Volume of Workplace
Confined spaces normally associated with whole-body restrictions occur when an inspector
enters an intervening structure or works within an area in which the entire body is confined to
that specific area, e.g., cargo hold. However, restrictive spaces are also created in areas where
the surrounding physical space is unlimited, but the immediate working area is restricted. These
partial-body restrictions result in limited movement of a specific body part. For example, tasks
aided by access devices such as steps or cherrypickers cause lower limb restriction, for the feet
must reside within a limited area. Other examples include reaching arms through access holes
and positioning various body parts in and around fixed aircraft components, e.g., inside a small
access panel. These partial-body restrictions may occur in addition to whole-body restrictions.
Interior inspection of the tail compartment demands that the inspector climb into the area
(whole-body restriction) place the head and arms through narrow confines to check components
(partial-body restriction).
Much research has examined the effects of restricted space on access tasks. Access consists of
physically reaching the area to be inspected. Access activities involve controlling the movement
of the body or body part(s) within a restrictive space. In aircraft maintenance/inspection this may
be an unaided human task (e.g., area inspection of lower fuselage skin), aided by access devices
(e.g., steps, scaffolding, cherrypickers), or require access through an intervening structure (e.g.,
inspection of wing fuel tank interiors through access holes). Normally, aircraft are designed to
the anthropometric boundary, i.e. to the minimum allowable requirements based upon human
body dimensions. However, designing to this boundary does not ensure (optimal) performance.
Mathematical models indicate that the amount of space defines the accuracy requirements of a
task. In turn, accuracy requirements may dictate the speed of performance.
Numerous investigations have found a speed/accuracy tradeoff in human performance; as
accuracy requirements increase because of decreased space, performance slows (see Bottoms,
1982; Drury, Montazer, and Karwan, 1987; Fitts in Wickens, 1992). For example, the speed a
hand can be moved through an access hole depends upon the hole's size. Further performance
changes may depend upon the posture adopted while the body part is restricted. Wiker, Langolf,
and Chaffin (1989) reviewed research which indicated that there are only minimal differences in
manual performance for work heights up to shoulder level. However, position and movement
performance decreased progressively when hands were used above shoulder level. The
production of movement with pre-tensed muscles may serve to increase tremor and decrease
maximum muscle contraction speed. Restricted entries and exits have been found to affect
whole-body ingress and egress times (Drury, 1985; Krenek and Purswell, 1972; Roebuck and
Levedahl, 1961), as well as subjective assessments of accessibility (Bottoms, Barber, and
Chisholm, 1979).
These models indicate that the speed an inspector chooses increases until it reaches some
limiting speed. The point at which increases in space no longer affect performance is the
performance boundary (Drury, 1985). However, designing to this boundary does not ensure that
increased operator stress, fatigue, or workload does not occur, merely that direct task
performance is not affected.
Along with access, other aspects of the actual inspection task may be affected by a restricted
space. Visual search requires the inspector's head to be at a certain location to control the eyes
and visual angle. Thus, restricted areas frequently force inspectors to adopt awkward head, neck,
and back angles induce stress and fatigue. Inspectors are forced to either search an area at
less-than-optimum viewing angles or work indirectly, using a mirror. Although both methods
can produce acceptable performance, inspector workload and stress are increased; performance
is less efficient than under unrestricted conditions.
Restricted areas may also prohibit inspections from having any extraneous material easily
accessible in the immediate working area (e.g., workcards on the illustration). This forces
inspectors to make decisions without comparison standards, increasing memory load, or
additional time to obtain information from the workcard, a manual, or a supervisor. Moreover,
less-than-optimum viewing angles may further decrease sensitivity and increase the difficulty of
decisions. Thus, restricted spaces can force the decision- making task to be more
memory-intensive, more length, and more difficult.
Conversely, pressures for cursory decision- making may encourage the inspector to get out of the
space quickly. Decision-making tasks exhibit a speed/accuracy tradeoff (SATO), with speedy
performance associated with inaccurate decision-making. However, inspectors are highly
motivated to perform accurately (Shepherd, Johnson, Drury, Taylor, and Berninger, 1991). Thus,
we predict that while accurate decision-making performance may not be compromised by even
the most extreme space conditions, workload and stress may increase.
The inspection task also requires that detected defects be marked and documented. As discussed
above, restricted areas may not allow additional material such as non-routine repair forms in the
workspace. The inspector must then remember all defects within an area, only later
documenting on the appropriate forms. This situation can add to the high memory load
requirements on inspectors and present the potential for an inspector to forget to note a defect.
Finally, extreme space conditions allow inspectors to adopt only a limited number of inefficient
postures. Thus, their physical working capacity may be reduced in restrictive spaces, as
indicated by research in the area of manual material handling (Davis and Ridd, 1981; Mital,
1986; Ridd, 1985; Rubin and Thompson, 1981; Stalhammer, Leskinen, Kuorink, Gautreau, and
Troup, 1986). Under unlimited space conditions, operators are able to adopt efficient postures or
switch postures and use other muscle groups, enabling primary muscle groups to be rested
(Drury, 1985). However, the frequent breaks from restrictive areas common during
maintenance/inspection activities allow relief from sustained task performance and allow the
primary muscle groups to be rested.
5.2.1.2 Task Duration
Some inspection tasks and many repair tasks require mechanics to be in a confined or restricted
area for prolonged periods. Increased task duration forces an inspector to spend longer periods of
time in a restrictive area and could psychologically affect his or her perception of space.
Habitability literature, concerned with the study of manned underwater vessels and space
vehicles, indicates that internal space requirements vary as a function of duration (Blair, 1969;
Price and Parker, 1971). Furthermore, Cameron (1973) indicates duration to be the primary
variable associated with fatigue effects.
5.2.1.3 Equipment/Tooling
The equipment and tooling utilized during access and task performance can contribute to stress
and fatigue effects and may further physically restrict the area. Furthermore, the equipment may
not be designed optimally for a given task. For example, ratchets used to loosen/tighten a bolt
may not have attachments which allow inspectors to reach an area without placing their arms in
an awkward position, forcing them to create torque in an inefficient posture. Similarly,
eddy-current devices used to inspect rivets have no convenient resting place, leading to a
less-than-optimal relationship among the inspector, the probe, and the eddy-current display.
5.2.1.4 Workplace Lighting
Studies in aircraft inspection have shown that poor illumination and other adverse lighting
conditions could be important reasons for eye strain or visual fatigue. Visual fatigue causes a
deterioration in the efficiency of human performance during prolonged work. Thus, an adequate
visual environment is crucial to ensure acceptable performance in aircraft inspection. In addition,
poor lighting demands that inspectors adopt a certain posture for task performance by forcing a
specific visual angle. Thus, restricted areas frequently force inspectors to adopt awkward head,
neck, and back angles induce stress and fatigue. In addition, inadequate lighting requires
inspectors always to hold their flashlight in one hand; likewise, awkward portable lighting forces
them continually to struggle with and reposition the lighting (Reynolds and Drury, 1993).
5.2.1.5 Social Factors
Social aspects of the environment may also increase fatigue. As the number of people within a
given area increases, the amount of space for any single person decreases. Uncomfortably close
spacing among individuals may limit their individual environmental tolerance. When many
individuals in the same area perform the same tasks, the available resources may become limited,
and people may become frustrated, e.g., when specialized/portable lighting is not available).
Also, when more people share the same space, there is an increased likelihood of physical
interference among tasks.
5.1.1.6 Surface Condition
The surface condition of many work areas in an aircraft hangar has been noted to be poor: dirty,
uneven, or rough. These surfaces cause inspectors either to limit the postures they are willing to
adopt or force them to adopt inefficient postures. For example, operators may not sit in a certain
area to avoid oil-soaked clothing; instead, they may stoop or crouch to perform the task. These
surfaces also present a safety concern, at times causing inspectors to slip or trip. Furthermore,
continued kneeling or laying on rough or uneven surfaces can cause recurring aches and pains.
In summary, the effects of restricted space and its associated posture effects have been
hypothesized to be the largest contributor produce a fatigue response, possibly also affecting
inspectors' workload and performance. The present evaluation focuses on this factor while
simultaneously considering other factors within the aviation environment.
5.2.2 Physical and Perceived Spaces
Note: Sections 5.2.2 to 5.2.7 are included from the Phase III Volume I progress report as they
form the basis for the studies undertaken.
The above factors can directly affect working conditions. The workspace has physical
characteristics which can be easily defined and investigated, but the operator also perceives the
physical space. Thus, the effective workspace is partially created by physical elements within a
fixed space and partially by perceived elements. It is not necessarily constant, but depends upon
an individual's constantly changing perceptions. The effects of this effective space must be
inferred, as direct observation is not logically possible.
5.2.3 Stress
It is logical to model inspector's working conditions within a traditional stress framework, where
extreme conditions act as a stressor. Context-dependent examination of the factors allows the
specific stress-inducing situation to be defined. Determining subjects' perceptions assists in
interpreting their behavior (Meister, 1981). Thus, field investigation is important for
understanding the specific response to aircraft maintenance/inspection activities. In an effort to
define stress operationally, the we employ the following definitions (Alluisi, 1982; Pratt and
Barling, 1988):
Stressor - The environmental, operator, and task characteristics comprising the work area and
impinging on the individual. In this context, both physical and perceived spaces are the stressors.
Stress - A state within the individual caused by the stressor's perceived magnitude. The existence
and interaction of various environmental, operator, and task characteristics dictate the intensity
of stress.
Aircraft inspection performance normally both physical and cognitive demands. Differentiating
the stress these demands induce helps more clearly to define and understand individual's various
stress responses. Physical stress is directly perceived by an individual's involved physical
subsystems, e.g., biomechanical or physiological, due to a discrepancy between the
environmental/task demands and the individual's physical ability to meet these demands. An
individual perceives this type of stress through a specific, or localized, experience of discomfort.
Thus, an individual's response can be specifically aimed at eliminating or alleviating the stressor,
when possible. There also is an overall physiological response to bodily requirements. For
example, space restriction may cause postural stress and discomfort in various muscle groups,
resulting in increases in heart rate and blood pressure (Astrand and Rodahl, 1986).
Cognitive stress results from an individual's perception of the discrepancy between perceived
environmental/task demands and the individual's perceived ability to meet those demands (Cox,
1990, 1985). Since this mismatch eventually determines the stress reaction, the operator's
perceptions play a key role. This stress is experienced as negative emotion and unpleasantness
(Cox, 1985; Sutherland and Cooper, 1988) and may be difficult to localize.
We hypothesize that whole-body confinements, as opposed to partial-body restrictions, are more
apt to produce cognitive stress effects. Inspectors may feel that they have less control to adapt or
to adapt to the perceived space. For example, when an inspector is totally enclosed in an area,
there may be fewer opportunities to eliminate the stressor, e.g., through frequent rest breaks
outside the space. Both whole-body and partial-body space restrictions are hypothesized to cause
physical stress effects, particularly postural, due to the body positions which these restrictions
demand. These physical stress effects most likely lead to cognitive stress effects if task
completion is compromised.
In summary, the effects of stress on human performance provide the basis for investigation.
These effects include increased arousal, increased processing speed, reductions in working
memory, reduced attentional capacity and attentional narrowing, and changes in the speed and
accuracy of performance (Hockey and Hamilton, 1983; Hockey, 1986; Reynolds and Drury,
1992; Wickens, 1992).
5.2.4 Fatigue
As discussed above, task performance under extreme conditions can result in both physical and
cognitive stress; in turn, it can induce physical or cognitive fatigue. Physical fatigue may be
defined as a state of reduced physical capacity (Kroemer, Kroemer, and Kroemer-Elbert, 1990).
An individual can no longer continue to work because the involved physical subsystems are not
capable of performing the necessary functions. For example, a posture can no longer be
maintained due to exceeding the endurance limit of the muscles (see Rohmert, 1973).
Cognitive fatigue is normally associated with stress and may be broadly defined as a generalized
response to stress over time. The effects may reside as a psychological state within the individual
or extend to affect performance. Symptoms of fatigue include restricted field of attention; slowed
or impaired perception; decreased motivation; cognitive subjective feelings of fatigue and task
aversion; and decreased performance in the form of irregularities in timing, speed, and accuracy
(Bartlett, 1953; Grandjean and Kogi, 1971).
5.2.5 Operator Response
An operator's response is a function of the perceived space and associated stress and fatigue
effects. Operator response cannot generally be described by one variable, as it is manifested in
various physiological, psychophysical, and behavioral patterns.
An individual may respond to or cope with a stressful situation in order to lessen the effect of or
eliminate the stressor (Cox, 1985). A dependency may exist among the different modes of
response: psychophysical, physiological, and behavioral. Any mode(s) of response may in turn
elicit another mode(s) of response (Meister, 1981). For example, while performing maintenance
or inspection in a cramped area of an aircraft, an initial physiological response to the postural
demands such as lack of blood flow to the leg muscles. In turn, this response causes a behavioral
response such as posture shifting and/or a subjective response perceived discomfort. A response
may alleviate one component of the stress response while causing another. Continuing the
example, while a change in posture may reduce the physiological response, the new posture may
make the task more difficult to perform, causing feelings of frustration.
5.2.6 Effects on Operator
In order to describe, or possibly to predict, the effects of operator response on performance and
workload, there is a need to understand the effects of stress and fatigue on the operator. These
effects were cited previously in their respective sections (Sections 5.2.3 and 5.2.4). If
performance is affected, it may be possible to specify the affected subsystem and why it is
affected. For example, perception may be affected by the inability to obtain an adequate visual
angle, attention may be distracted by discomfort due to postural stress, or decision-making may
be speeded up in an effort to finish the task and eliminate the stressor, i.e. to leave the
environment.
Table 5.2 Performance, workload, and stress defined within restrictive space framework
ZONE
PERFORMANCE
WORKLOAD
STRESS
0
None possible
W ....0
S ....0
1
Proportional to space
W task + compensation(s)
D task + compensation(s) > H
2
Acceptable
W task + compensation(s)
D task + compensation(s) > H
3
Acceptable
W task
D task <HOC
5.2.7 Framework to Measure the Effects on Performance/Workload
Performance and workload will ultimately be affected by any changes in operator function
forced by working conditions and associated stress and fatigue. Drury (1985) advances a
three-level framework attempt to describe task performance with respect to the working area.
The following proposed framework includes an additional zone to better predict inspector stress,
workload, and performance. This framework presents four zones that specifically define
performance, workload, and stress (Table 5.2).
5.2.7.1 Zone 0 - Anthropometrically Restricted Zone
The task cannot be accomplished in Zone 0 because the working conditions or postures are too
extreme for the operator to function. The boundary between Zone 0 and Zone 1 is normally
determined by anthropometric data, i.e. by human dimensions. These minimum criteria are only
used if space is a critical commodity such as in an aircraft. Under normal conditions, larger
spaces are recommended. These type of data are limited because they are normally based on
static sitting or standing. They do not account for normal working postures, do not allow for
special equipment, and represent a young population. Hence, anthropometrically defined spaces
underestimate minimum space requirements (Drury, 1985). There are computer-aided systems
such as CREWCHIEF (McDaniel and Hofmann, 1990) that account for some of these
limitations. However, Boeing, which has developed and utilizes a similar computer-aided human
modeling system, admits that, "[these] systems [have] limits, and some mock-ups still will be
required. `Human models...can't do all the interface work.'" (Underwood, 1993).
Even if `minimum allowance models' could ensure that individuals can work in a given space,
they do not account for fatigue, workload, or stress effects.
5.2.7.2 Zone 1 - Performance Restricted Zone
Task performance is possible, in Zone 1, but performance is not optimum because ergonomic
conditions still interfere with the task. This zone ranges from allowable access for task
performance up to acceptable task performance. As conditions improve, performance increases.
The total workload is equal to the workload associated with the task plus the workload
associated with the operator compensations caused by the workspace. There is increased stress
present in this zone, for the task demands exceed the operator capabilities. Workload and stress
most likely decrease within the zone, as ergonomic demands decrease, the compensations should
also decrease.
5.2.7.3 Zone 2 - Workload/Stress Restricted Zone
Task performance is acceptable, in Zone 2, at least in the short term. However, operators'
workload and stress are increased because compensate for ergonomic conditions and/or extreme
postures. As ergonomic conditions improve within this zone, operator compensation(s) or
responses should decrease, causing the total workload and stress to decrease.
5.2.7.4 Zone 3 - Unrestricted Zone
Zone 3 allows acceptable task performance without additional operator compensation; thus, there
is no additional workload or stress imposed by the working conditions.
5.3 ON-SITE EVALUATION AND ANALYSIS
Experimentation utilized the restrictive space model to assist in understanding and describing the
relationships between the task conditions and the operator's compensations, fatigue, stress, and
workload. The framework used categorizes the task spaces based upon the measured stress and
workload effects.
The knowledge of the effects ergonomic factors have on the operator was applied within the
methodology to develop the following:
1. A recognition guide, integrated within the ergonomic audit, allowing users to predict
which tasks will have a performance decrement and/or stress increase due to posture.
2. A set of interventions keyed to task, operator, and environment factors reduce stress and
fatigue.
The maintenance facility where data were obtained possesses four bays and services only DC-9's
on all three shifts, i.e. day, afternoon, night. On-site evaluation was two-pronged and included
analysis of 1) pre-existing conditions in terms of on-the-job injuries (OJI's) and 2) existing
conditions in terms of direct and indirect data collection techniques.
5.3.1 Evaluation of Pre-Existing Conditions
Evaluation of pre-existing conditions can assist in determining if there is any need for ergonomic
intervention and, if there is, to focus analysis towards the problem areas. In addition, it can guide
the implementation process by emphasizing and prioritizing interventions. OJI's were reviewed
in an effort to provide this information, as these data were already collected and thus easily
accessible. OJI's represent an extreme human/system mismatch leading to an error severe enough
to cause injury.
5.3.1.1 OJI Analysis
We reviewed OJI reports from 1/1/92 to 6/30/93. The procedure outlined by Drury and Brill
(1983) was employed to identify accident patterns. Accident/injury data were separated in order
to identify OJI's that occurred in the hangar and OJI's specifically related to restricted space. The
OJI's identified space-related were then grouped based upon age, job, years on the job, area,
activity being performed, days out, type of injury, and body part injured. Thus, we were able to
develop a small number of repetitive scenarios or patterns.
5.3.1.2 Results
The percentage of space-related OJI's in the hangar was 20.4% (Figure 5.2). This finding
indicates that ergonomic interventions, particularly those related to space, should be addressed.
Figure 5.2 also shows other data that were meaningful in this analysis. Most injuries were
sprains to the lower limbs or back/neck, primarily occurring during repositioning, working, and
access type activities, e.g., climbing and slip/trips. Table 5.3 presents a summary of the most
predominant scenarios.
Table 5.3 Summary of space-related hangar OJI's
•Repositioning in cramped or dirty places, e.g., the fuel tank, tail interior, and bag bin, often causes
sprains or
strains
•Head lacerations are associated with walking in the cabin or around the fuselage exterior
•Kneeling causes knee bruises or strains
•Lifting in confined spaces can result in back strain
•Falls on stairs and access stands are common
•Most injuries occur during access or maintenance subtasks
OJI's
Outside
Hangar
49.8%
OJI's in
Hangar
29.7%
Space
Related
20.4%
Back/Neck
30.3%
Head
12.1%
U Limbs
13.6%
L Limbs
36.4%
Other
7.6%
Body Part Injured
Slips/Trips
15.6%
Repositioning
Climbing
31.3%
29.7%
Working
23.4%
Bruise
21.9%
Other
4.7%
Cuts
12.5%
Sprains
60.9%
Type of Injury
Activity
Figure 5.2 OJI Report Summary
5.3.2 Evaluation of Existing Conditions
Four inspection tasks were selected for analysis: aft cargo compartment, horizontal/vertical
stabilizers, tail interior, and wheelwell/ main landing gear. These tasks provided a representative
sample of tasks with regard to varying environmental conditions such as the amount of space,
lighting. Both behavioral (direct recording) and psychophysical (indirect recording) data were
collected to assess the effect of the aviation maintenance and inspection environment on
inspector fatigue, discomfort, and workload.
5.3.2.1 Behavioral Measures
Whole-body postures were recorded through-out task performance. Positions of the upper limbs,
lower limbs, and trunk were recorded continuously for two inspectors performing each task. In
addition, detailed descriptions of each task. This included having human factors analysts work
with inspectors during the completion of workcards. While obtaining task descriptions, we
placed emphasis on documenting the ergonomic factors identified in Section 5.2 which create, or
exacerbateing stress and fatigue effects.
5.3.2.2 Psychophysical Measures
Psychophysical techniques were used to measure fatigue, physical discomfort, and workload.
These techniques are particularly attractive for field use because they are unrestrictive, require
minimal instrumentation, are easy to use/administer, and provide valid and reliable results.
The Feeling Tone Checklist (FTC), utilized to measure fatigue effects over time, is an interval
scale that has been found to be a valid and reliable measure of subjective feelings of fatigue
(Pearson, 1957). The Body Part Discomfort Chart (BPD) was utilized to obtain postural
discomfort data (Corlett and Bishop, 1976). This chart categorizes the body into a number of
functional areas to allow the assessment of individual body areas. A 5-point ordinal scale was
utilized to solicit operators' BPD ratings. The NASA - Task Load Index (TLX) is a
multi-dimensional rating scale measuring six workload-related factors (mental demand, physical
demand, temporal demand, performance, effort, and frustration) and their associated magnitudes
to form a sensitive and diagnostic workload measure (Hart and Staveland, 1988).
5.3.2.3 Experimental Protocol
Postures were sampled every 30 seconds throughout each task. Data were obtained on two
inspectors performing each task. The FTC and BPD was administered before and after task
performance. In addition, the TLX was administered after task performance. The FTC, BPD, and
TLX data were obtained on five experienced inspectors per task.
5.3.2.4 Results
An adapted version of the Ovako Working Posture Analyzing System (Louhevaara and
Suurnakki, 1992) postural recording scheme was utilized to classify whole body postures during
task performance. This system has been found to be valid and reliable (Karhu, Kansi, and
Kuorinka, 1977, 1981). It categorizes whole-body postures into action categories based upon the
severity of different postures, making it useful in determining which postures need to be
addressed by workplace changes. Table 5.4 lists the categorization scheme and corresponding
Action Categories (AC). The postural data were categorized by action categories and averaged
across inspectors for each task; results are presented in Figure 5.3. These data indicate that AC
frequency is dependent upon task type (2 = 140.23, p < 0.005) and that inspectors adopted the
largest percentage of extreme postures, i.e. AC2, AC3, and AC4, in the aft cargo and tail interior
areas. However, there is a large percentage of extreme postures in the other areas. The most
typical working postures for each task are listed in Table 5.5 and illustrated in Figures 5.4, 5.5,
5.6, 5.7.
Table 5.4 OWAS Classification Table
Upper
Trunk
Limbs
Lower Limbs
2S
1S
2B
1B
K
W
S
L
C
Straight
Bent
Twisted
2 Below
\\\\\\\
\\\\\\\
\\\\\\\
\\\\\\\
1 Above
\\\\\\\
\\\\\\\
\\\\\\\
\\\\\\\
2 Above
\\\\\\\
\\\\\\\
\\\\\\\
\\\\\\\
2 Below
\\\\\\\
\\\\\\\
\\\\\\\
kk
kk
kkkk
\\\\\\\
\\\\\\\
kk
kk
kk
kk
1 Above
\\\\\\\
\\\\\\\
\\\\\\\
kk
kk
kkkk
kk
kk
\\\\\\\
kk
kk
kk
kk
2 Above
kk
kk
\\\\\\\
kk
kk
kk
kk
2 Below
\\\\\\\
kk
kk
1 Above
\\\\\\\
2 Above
\\\\\\\
Bent &
2 Below
\\\\\\\
\\\\\\\
\\\\\\\
\\\\\\\
Twisted
1 Above
kk
kk
\\\\\\\
kk
kk
\\\\\\\
\\\\\\\
kk
\\\\\\\
2 Above
kk
kk
\\\\\\\
kk
S = Straight
B = Bent
K = Kneel
W = Walk
S = Sitting
L = Laying
C = Crawl
Action Category 1. The overall posture is ordinary and normal. No action is necessary.
These postures are marked with a blank square.
Action Category 2. The load imposed by the overall posture is of some significance and
slightly harmful. A better working posture should be sought in the near
future. These postures are shown with a \\\\\\\.
Action Category 3. The strain imposed by the overall posture is significant and distinctly
harmful. A better working posture should be sought as soon as
possible. These postures are marked with kkkk.
Action Category 4. The strain imposed by the overall posture is greatly significant and
extremely harmful. A better working posture should be sought
immediately. These postures are marked by shading.
Table 5.5 Typical working postures by task
Task
% of Working Time
Action
Categories
STABILIZERS
1.Legs Straight, Trunk Straight, 2 Arms Below Shoulders
2.Kneeling or Crouched, Truck Bent and Twisted, and/or Arms Above Shoulders
3.Leg(s) Straight, Trunk Straight, Arm(s) Above Shoulder
9.3%
14.1%
12.0%
AC1
AC4
AC1
4.Sitting or Laying, Trunk Bent and/or Twisted, Arms Below Shoulders
11.4%
AC2-AC4
21.1%
16.5%
21.9%
AC2
AC3
AC1-AC2
19.0%
24.7%
21.4%
4.5%
AC1-AC3
AC3-AC4
AC1
AC1-AC2
33.2%
11.3%
13.4%
AC3-AC4
AC3-AC4
AC1-AC2
TAIL INTERIOR
1.Sitting, Trunk Straight, Arms Below Shoulder
2.Sitting, Trunk Bent, Arms Below Shoulder
3.Legs Straight, Trunk Bent or Twisted, Arm(s) Above Shoulder
WHEELWELL/MAIN LANDING GEAR
1.Leg(s) Straight, Trunk Bent and/or Twisted, and/or Arm(s) Above
Shoulder
2.Kneeling/Crouched, Trunk Bent and/or Twisted, and/or Arm(s) Above Shoulder
3.Leg(s), Trunk, Arms Neutral
4.One Leg Straight, Trunk Bent and/or Twisted, and/or Arms(s) Above Shoulder
CARGO
1.Kneeling, Trunk Bent and/or Twisted, Arms Below Shoulder
2.Laying, Trunk Bent and/or Twisted, and/or Arm(s) Above Shoulder
3.Sitting, Trunk Bent and/or Twisted, and/or Arm(s) Above Shoulder
Figure 5.3 Posture Analysis
Figure 5.4 Stabilizer Postures
Figure 5.5 Tail Interior Postures
Figure 5.6 Wheelwell/Main Landing Gear
Figure 5.7 Cargo Postures
The BPD and FTC difference values (end of task - beginning of task) were averaged across
inspectors and are presented in Figures 5.8 and 5.9. Inspectors experienced significant increases
in body part discomfort in the tail interior (t = 2.35, p < 0.05). Likewise, inspectors indicated the
most fatigue after inspecting the tail interior (t = 3.17, p < 0.0.005). Body part discomfort and
fatigue were also judged as high in the aft cargo. The average fatigue value was skewed by one
inspector who rated his fatigue to be less (Figure 5.9). The TLX data averaged across inspectors;
results are presented in Figure 5.10. There was a significant difference among the overall
workload levels (F = 2.80, p = 0.074), with workload being significantly greater in the tail
interior. In addition, across all tasks, physical demand and performance were significantly
greater than the other components in contributing to the overall workload level (Tukey critical
value = 2.70__ = 0.05).
By Task
5
4
4
3
3.3
2
2.5
1.8
1
0
Aft Cargo
Stabilizers Tail Interior Wheel Well
BPDFS = Difference Values (End of Task - Beginning of Task)
Figure 5.8 Body Part Discomfort Over Time
By Task
5
4
4
3
2
2
1
2
1.6
0
Aft Cargo
Stabilizers Tail Interior Wheel Well
FTC = Difference Values (End of Task - Beginning of Task)
Figure 5.9 Fatigue Over Time
Figure 5.10 TLX Workload Data
5.4 FINDINGS
Although performance measures could not be obtained, as noted in previous work (Shepherd,
Johnson, Drury, Taylor, and Berninger, 1991) as well as in this work, inspectors are highly
motivated to perform accurately. We assume that inspectors were taking the steps necessary to
ensure that their performance was not affected by the conditions. However, the above analysis
and results indicate that inspectors often experience increased levels of stress, fatigue, and
workload. Based upon these data, inspection work in the tail interior can be classified within
Zone 2 of the framework (Section 5.2.7). That is, task performance is acceptable, but operators'
workload and stress are increased because of their compensating for extreme conditions.
Inspection of the stabilizers and wheelwell/MLG can be classified within Zone 3; acceptable task
performance can be obtained without any significant increases in workload or stress imposed by
the task conditions. Work in the aft cargo falls somewhere on the boundary between Zones 2 and
3. If more data were collected reduce variability in this real-world data, it is predicted that work
in this area would be found to be in Zone 2.
The psychophysical data shows a consistent pattern of stress experienced during task
performance in different areas. Generally, fatigue, body discomfort, and workload were judged
higher in the aft cargo and tail interior areas, as compared to the other areas. There was some
disassociation between the postural and the psychophysical data. The stabilizers and
wheelwell/MLG were not rated as extremely fatiguing, although many extreme postures (AC3
and AC4) were noted while inspectors worked in these areas. This indicates that posture may be
just one factor contributing to fatigue and that other factors such as space and lighting, in
combination with extreme postures, play a role in eliciting fatigue. These results are to be as
expected from the discussion in Section 5.2.1.
5.5 PRACTICAL INTERVENTIONS
Based upon the above evaluation, a posture/fatigue module has been developed and integrated
into the ergonomic audit program (Koli, Drury, Cuneo, and Lofgren, Chapter 4 of this report). In
addition, specific ergonomic interventions were provided for each task analyzed. These were
generated from a logical analysis of factors contributing to fatigue in each area and the possible
ergonomic interventions that could impact upon these factors. Furthermore, the techniques and
tools used for this analysis can be applied and used in developing and guiding a comprehensive
ergonomic program.
5.5.1 Ergonomic Audit Posture Module
A module has been developed and integrated into the ergonomic audit program that can be used
to recognize extreme postural and spatial demands possibly causing fatigue and discomfort. This
module should assist in eliminating mismatches, specifically these related to postural and spatial
requirements, between the inspector's capabilities and the task demands.
5.5.2 Design Requirements/ Interventions
For each task, design requirements were stated. They are presented in Table 5.6. Design
requirements are positive statements about what needs to be accomplished during redesign.
These design requirements were geared towards eliminating or reducing extreme working
postures (Table 5.5 and Figures 5.4, 5.5, 5.6, 5.7) and improving the overall inspection
environment. Notice that these are not solutions, but requirements. There may be several
alternative solutions for each requirement. Formally stating design requirements can assist in
generating solutions and reduce the probability of overlooking potential solutions (Drury, 1987).
In addition, design requirements were prioritized according to the OJI's that occurred in each
area. This assists in selecting interventions maximizing injury reduction for a given budget.
In the aft cargo area, due to the nature of the task, much of the kneeling and laying cannot be
reduced. However, equipment would reduce much of the stress caused by extreme postures. In
the stabilizers inspection task, the existing light levels (Table 5.6) should be increased to reduce
visual fatigue caused when visual inspection is performed in non-optimum conditions (Reynolds
and Drury, in press). In addition, the platform weight could be lowered so that the underside of
the horizontal stabilizer could be inspected without inspectors having to kneel or crouch (Table
5.5, Figure 5.4, posture 2). Due to aircraft constraints, there can be limited structural and access
changes in the tail interior. Thus, most of the solutions address the environment, in an attempt to
improve these conditions. Access to the wheelwell could be improved by a new step design and
eliminate the bending and reaching into the wheelwell (Table 5.5, and Figure 5.6, postures 1
and 4). Furthermore, a portable chair may be utilized to reduce crouching during MLG
inspection (Table 5.5, and Figure 5.6 posture 2).
5.5.3 Ergonomic Program
This evaluation has only addressed a small subset of ergonomic problems in the aviation
maintenance environment, particularly those related to restricted space and posture. However,
we also considered other factors during the evaluation and recommendation phases. This work
has revealed the need for a comprehensive ergonomic program addressing all components of the
aviation maintenance environment. Many issues were not addressed, e.g., safety concerns, but
these issues could be evaluated and improved using proven ergonomic techniques and tools. The
techniques applied in this project were found to be sensitive and could be adapted and utilized in
further investigations of the aviation maintenance environment.
Ergonomic programs have been developed for manufacturing environments with great success
(see, Reynolds and Drury, in press). These programs are based upon the idea of continuous
evaluation and intervention, using the tools and techniques applied above, to improve the fit
between human and system, and hence to reduce error-causing mismatches. In the 1994 plan,
such a program is being implemented as a SUNY/FAA demonstration project.
5.6 REFERENCES
Alluisi, E.A. (1982). Stress and stressors, commonplace and otherwise. In E.A. Alluisi, and
E.A. Fleishman (Ed.) Human Performance and Productivity, Vol 3: Stress and Performance
Effectiveness, Hillsdale, N.J.: Lawrence Erlbaum Associates.
Astrand, P. and Rodahl, K. (1986). Textbook of Work Physiology, New York: McGraw-Hill.
Bartlett, F. (1953). Psychological criteria of fatigue. In W.F. Floyd and A.T. Welford (Eds.)
Symposium on Fatigue, London: H.K. Lewis and Co.
Blair, W.C. (1969). Human factors in deep submergence vehicles. Marine Technology Society
Journal, 3(5), 37-46.
Bottoms, D.J. (1982). The tractor driver's steering control task. Ergonomics, 25, 31-39.
Bottoms, D.J., Barber, T.S. and Chisholm, C.J. (1979). Improving access to the tractor cab: An
experimental study. Journal of Agricultural Engineering Research, 24, 267-284.
Cameron, C. (1973). A theory of fatigue. Ergonomics, 16, 633-648.
Corlett, E. N. (1983). Analysis and evaluation of working posture. In Kvalseth, T. O. (Ed.)
Ergonomics of Workstation Design, London: Butterworths.
Corlett, E.N. and Bishop, R.P. (1978). The ergonomics of spot welders. Applied Ergonomics,
9, 23-32.
Corlett, E.N. and Bishop, R.P. (1976). A technique for assessing postural discomfort.
Ergonomics, 19, 175-182.
Cox, T. (1990). The recognition and measurement of stress: Conceptual and methodological
issues. In J.R. Wilson, and E.N. Corlett (Eds.) Evaluation of Human Work, London: Taylor and
Francis.
Cox, T. (1985). The nature and measurement of stress. Ergonomics, 28, 1155-1163.
Davis, P. R. and Ridd, J. E. (1981). The effect of headroom on acceptable lifting capacity,
Ergonomics, 24, 239.
Drury, C.G. (1987). The human as optimizer. In Megaw, E.D. (Ed.), Contemporary
Ergonomics, Ergonomics Society Proceedings, 1987, 19-29.
Drury, C.G. (1985). Influence of restricted space on manual materials handling. Ergonomics,
28, 167-175.
Drury, C.G. and Brill, M. (1983). New methods of consumer product accident investigation.
Human Factors and Industrial Design in Consumer Products, 196-229.
Drury, C.G., Montazer, M.A. and Karwan, M.H. (1987). Self-paced path control as an
optimization task. Systems, Man, and Cybernetics, 17, 455-464.
Galaxy Scientific Corporation. (1993). Human Factors in Aviation Maintenance - Phase
Three, Volume 1 Program Report. DOT/FAA/Am-93/15, Springfield, VA.: National
Technical Information Service.
Grandjean, E., and Kogi, K. (1971). Introductory remarks. In K. Hashimoto, K. Kogi, and E.
Grandjean (Eds.) Methodology in Human Fatigue Assessment, London: Taylor and Francis.
Hart, S.G, and Staveland, L.E. (1988). Development of NASA-TLX: Results and empirical and
theoretical research. In P.A. Hancock and N. Meshkati (Eds.) Human Mental Workload, North
Holland: Elsevier Science Publishers.
Hockey, G.R.J. (1986). Changes in operator efficiency as a function of environmental stress,
fatigue, and circadian rhythms. In K.R. Boff (Ed.) Handbook of Perception and Human
Performance, Vol 2., New York: Wiley and Sons.
Hockey, G.R.J. and Hamilton, P. (1983). The cognitive patterning of stress states. In R. Hockey
(Ed.) Stress and Fatigue in Human Performance, New York, NY: John Wiley and Sons.
Hunting, W., Grandjean, E. and Maeda, K. (1980). Constrained postures in accounting machine
operators. Applied Ergonomics, 11, 145-149.
Karhu, O., Kansi, P. and Kuorinka, I. (1977). Correcting working postures in industry: A
practical method for analysis. Applied Ergonomics 1977, 8.4, 199-201.
Karhu, O., Kansi, P. and Kuorinka, I. (1981). Observing working postures in industry:
Examples of OWAS application. Applied Ergonomics 1981, 12.1, 13-17.
Krenek, R. F. and Purswell, J. L. (1972). Automobile escape worthiness--an approach to a
predictive model. In Proceedings of the Human Factors Society's 16th Annual Meeting, Santa
Monica, CA, 46-57.
Kroemer, K.H.E., Kroemer, H.J. and Kroemer-Elbert, K.E. (1990). Engineering, Physiology, 2nd
Ed., New York: Van Nostrand Reinhold.
Louhevaara, V. and Suurnakki, T., (1992). OWAS: A method for the evaluation of postural
load during work (Training Publication 11). Helsinki, Finland: Institute of Occupational Health.
McDaniel, J.W., and Hofmann, M.A. (1990). Computer-aided ergonomic design tools. In H.R.
Booher (Ed.) MANPRINT: An Approach to Systems Integration, New York: Van Nostrand
Reinhold.
Meister, D. (1981). The problem of stress definition. In G. Salvendy and M.J. Smith (Ed.)
Machine Pacing and Occupational Stress, London: Taylor and Francis.
Mital, A., (1986). Subjective estimates of load carriage in confined and open spaces. In W.
Karwowski (Ed.) Trends in Ergonomics/Human Factors III, North Holland: Elsevier, 827-833.
Pearson, R.G. (1957). Scale analysis of a fatigue checklist. Journal of Applied Psychology, 41,
186-191.
Pratt, L.I., and Barling, J. (1988). Differing between daily events, acute and chronic stressors: A
framework and its implications. In J.J. Hurrell, L.R. Murphy, S.L. Sauter, C.L. Cooper (Eds.)
Occupational Stress, Issues and Developments in Research, London: Taylor and Francis.
Price, H. E. and Parker, J. F., Jr. (1971). Forecast of human factors technology issues and
requirements for advanced aero-hydro-space systems. Arlington, VA: Office of Naval Research
(Contract #N00014-69-C-0327).
Reynolds, J. and Drury, C. G. (1993). An evaluation of the visual environment in aircraft
inspection. Proceedings of the 37th Annual Human Factors and Ergonomics Society Meeting,
Seattle, WA, 34-38.
Reynolds, J.L., and Drury, C.G. (in press). A field methodology for the control of
musculoskeletal injuries. Applied Ergonomics.
Reynolds, J.L., and Drury, C.G. (1992). The effects of physical exertion on task performance in
modern manufacturing: A taxonomy, a review, and a model. Paper submitted for publication in
Ergonomics.
Ridd, J.E. (1985). Spatial restraints and intra-abdominal pressure. Ergonomics, 28, 149-166.
Roebuck, J.A., and Levedahl, B.H. (1961). Aircraft ground emergency exit design
considerations. Human Factors, 3, 174-209.
Rohmert, W. (1973). Problems in determining rest allowances. Applied Ergonomics, 4, 91-95.
Rubin, T. and Thompson, S. J. (1981). The effect of restricted workspaces upon maximal
exertions in the sagittal plane. Ergonomics, 24, 240.
Shepherd, W., Johnson, W. B., Drury, C. G., Taylor, J. C. and Berninger, D. (1991).
Human Factors in Aviation Maintenance Phase 1: Progress Report, DOT/FAA/AM-91/16,
Springfield, VA: National Technical Information Service.
Stalhammer, H. R., Leskinen, T. P. J., Kuorinka, I. A. A., Gautreau, M. H. J. and Troup, J.
D. G. (1986). Postural, epidemiological, and biomechanical analysis of luggage handling in
an aircraft luggage compartment. Applied Ergonomics, 17, 177-183.
Sutherland, V.J., and Cooper, C.L. (1988). Sources of work stress. In J.J. Hurrell, L.R. Murphy,
S.L. Sauter, C.L. Cooper, Occupational Stress - Issues and Developments in Research, London:
Taylor and Francis.
Underwood, C. (1993). Personal communication.
Van Wely, P. (1970). Design and disease. Applied Ergonomics, 1, 262-269.
Westgaard, R.H., and Aaraas, A. (1984). Postural muscle strain as a causal factor in the
development of musculoskeletal illnesses. Applied Ergonomics, 15, 162-174.
Wickens, C.D. (1992). Engineering Psychology and Human Performance, 2nd Edition., New
York, NY: Harper Collins.
Wiker, S.F., Langolf, G.D., and Chaffin, D.B. (1989). Arm posture and human movement
capability. Human Factors, 31(4), 421-441.
CHAPTER SIX
HYPERMEDIA INFORMATION SYSTEM
Karin M. Hartzell
and
Leo G. Utsman
Galaxy Scientific Corporation
6.0 INTRODUCTION
The aviation industry manages large quantities of documentation for purposes including training,
research, maintenance, and safety inspection. Paper or microfiche documents include fault
isolation manuals, maintenance manuals, federal aviation regulations, and research reports.
Timely and convenient access to these documents is important, but currently document access
can be quite cumbersome. For example, safety inspectors and aviation maintenance technicians
must carry literally stacks of documents to the flightline when they inspect or work on an
aircraft. Finding the desired information in cumbersome documents is not always easy; therefore,
the results are not always accurate. Improvements in the way aviation personnel access
information will lead to more reliable and more cost-effective aircraft maintenance.
Toward this end, the Federal Aviation Administration (FAA) Office of Aviation Medicine
(AAM) Human Factors in Aviation Maintenance research program is studying the challenges
associated with creating, accessing, and maintaining digital documentation using a Hypermedia
Information System (HIS). This paper discusses the current state of the HIS, including the
interface features, integration into a job aiding system, and future plans.
6.1 THE HYPERMEDIA INFORMATION SYSTEM FEATURES
The goal of the AAM Hypermedia Information System research program is to use hypermedia
technology to improve access to aviation information. Hypermedia technology makes it possible
to establish links between a document and other documents, graphics, animation, video, and
audio. This makes a hypermedia document far more powerful and meaningful than a digital
document that is strictly text. With hypermedia technology, information can be stored, searched,
and retrieved by referential links for fast and intuitive access. This reduces the time spent
looking for information and allows a more thorough, meaningful search. Hypermedia technology
allows users to make faster and more intelligent decisions. Naturally, the technology offers other
benefits such as reduced costs for inspecting and maintaining aircraft. For more information on
hypermedia, see Howell, 1992, and FAA/AAM & GSC, 1993b.
Initial research program efforts concentrated on demonstrating the feasibility of a hypermedia
system for aviation personnel. Team members designed a digital library system and implemented
rudimentary tools for storing the information. The bulk of the implementation effort was focused
on information retrieval tools and the hypermedia reader interface. Federal Aviation
Administration research reports were used as a testbed for creating the digital library. This
proof-of-concept hypermedia viewer (FAA/AAM & GSC, 1993b) proved to be a flexible,
powerful way for researchers to view hypermedia documents. The HIS can be used solely as a
tool to access information, as well as integrated with training and job-aiding systems (Johnson
and Norton, 1992).
Both the viewer and the library were distributed on compact disc, read-only memory (CD-ROM)
to the aviation maintenance community in early 1993. As with many proof-of-concept systems,
this one was geared toward a specific application area. The viewer interface was tailored to the
FAA research reports, making its broad-scale applicability limited. Over the last year, research
has continued to make the tools more generic and enhance their functionality. The digital library
containing FAA research reports was expanded to include new reports. Additionally, two new
libraries were created: one contains the Federal Aviation Regulations; the other, the Inspector's
Airworthiness Handbook. The work described in this chapter will be produced and distributed on
CD-ROM in early 1994.
The HIS reader interface maintains a book paradigm and consists a navigation component and a
viewing component. The navigation component combines the familiarity of traditional book
navigation, e.g., a table of contents, with the power of hypermedia searching. The viewing
component allows the reader1 to read, print, and manipulate the various media that make up the
library.
6.1.1 Navigation
A traditional paper book provides several navigation methods, including a table of contents, an
index, and simple page turning. Likewise, the HIS supports a variety of access paths into and
within a document. Some readers seek specific topics of interest and appreciate a powerful
method to browse through a complex document. These readers find the hierarchical Outline
Viewer and powerful searching capabilities useful. Other readers may seek quick references to
standard information. Hot Links and Bookmarks provide mechanisms for these readers to
quickly access frequently referenced places in a document.
6.1.1.1 The Bookshelf
The first HIS component the reader encounters is the Bookshelf (Figure 6.1). The Bookshelf
graphically depicts libraries available to the reader. The reader selects book icon to choose a
library. To change libraries, the reader returns to the Bookshelf and selects another book icon.
Bookshelf icons can be customized to fit a specific application.
6.1.1.2 The Outline Viewer
Figure 6.1 The HIS Bookshelf
Once a reader chooses a library from the Bookshelf, the Outline Viewer appears to display the
complete outline for the library. The outline is similar to a Table of Contents and contains the
Topics defined for the library's documents. A hypermedia author2 specifies Topics within the
original digital documents and assigns a hierarchical order to them. By using the HIS Outline
Viewer, a reader is able to browse the outline of all documents in the library and to expand and
collapse the Topics (Figure 6.2). Once a reader finds and selects a Topic of interest, the part of
the document associated with the Topic appears (Figure 6.3).
6.1.1.3 Hot Links
The HIS supports a variety of Hot Links a reader can use to navigate through the library. The
Hot Links include both inter- and intra-document links to text, as well as links to graphics,
animation, video, audio, definitions, and other executable programs. Hot Links are denoted by a
rectangular box surrounding red text (Figure 6.3)
.
Figure 6.2 Collapsed and Expanded Topics
Figure 6.3 The Outline and Document Viewers
6.1.1.4 Searching
One of the most powerful features of a hypermedia system is its ability to quickly locate specific
information in large amounts of text without forcing the reader to scan each line. A reader
searches by typing a query, as shown in Figure 6.4. The HIS then rapidly searches all documents
in the library. The HIS then displays a list of Topics satisfying the query, also shown in Figure
6.4. The reader can select one of the Topics to view. When the selected Topic's text is loaded, the
search hits are highlighted, as shown in Figure 6.5. To see other search hits, the reader can either
scroll through the text or use the magnifying glass icons in the icon bar (Figure 6.5) to go to the
previous or next occurrence.
The HIS supports four types of searching: term, wildcard, phrase, and Boolean. A term search is
a search for a specific word such as aviation that is not a stopword. A stopword is a word
occurring so frequently in the document that it is not important, such as the or and. Every Topic
containing the search term is listed in the Search Query Dialogue Box.
Figure 6.4 Search Query Dialogue Box
A wildcard search allows the reader to look for variations of a term such as administrate,
administration, administer. The reader can append a term or partial term with either an asterisk
(*) wildcard or a question mark (?) wildcard. The asterisk represents zero or more characters,
and the question mark represents zero or one character.
A phrase searching enables the reader to specify the order and adjacency of multiple search
terms. For example, phrase searching for "federal aviation administration" only displays places
where that exact phrase appears. The reader specifies a phrase search by placing quotes around
the target phrase.
A Boolean search combines any/all of the above types with Boolean operators (AND, OR,
NOT), as in "federal aviation administration" or faa not airplane. In this example, the search
would return a list of all Topics containing either federal aviation administration or faa, but not
containing airplane.
Figure 6.5 Search Hits
6.1.1.5 Bookmarks
It is sometimes desirable for a reader to mark a place in a document. The HIS provides a
bookmarking capability and enables a reader to create multiple Bookmarks for a document.
When creating a Bookmark, the HIS uses the current Topic as the Bookmark's target destination.
To use a previously created Bookmark, the reader chooses one from the list of active Bookmarks
(Figure 6.6). The Topic containing the Bookmark does not have to be in the current library; the
HIS automatically switches libraries, if necessary.
6.1.2 Viewing
The HIS provides three distinct tools viewing the various media comprising a hypermedia
library. The Document Viewer has multiple entry mechanisms: the Outline Viewer, the Search
Query Dialogue Box, Bookmarks, and Hot Links. The Graphics Viewer and the Multimedia
Viewer are accessible only through Hot Links.
6.1.2.1 The Document Viewer
The Document Viewer, shown in Figures 6.3 and 6.5, allows a reader to scroll through and read
a hypermedia document, as well as to investigate search hits. Text formatting such as boldface,
italics, underlining, and multiple font sizes and typefaces, enables the on-line document closely
to resemble the original. Any headers and footers are also displayed.
6.1.2.2 The Graphics Viewer
Readers use the Graphics Viewer to view and print graphics. It appears when a reader clicks on a
hot word that links to a static graphic image. Supported graphics formats include, among others,
bitmap (BMP), encapsulated postscript (EPS), graphics interchange file (GIF), target image file
format (TIFF), and Joint Photographic Experts Group (JPEG). The Graphics Viewer determines
the graphics file's format and displays it appropriately; it offers seamless incorporation.
Figure 6.6 Bookmarks
Figure 6.5 Search Hits
6.1.2.3 The Multimedia Viewer
More innovative types of media are now available for computer presentation (e.g., sound, video,
animation, etc.). The Multimedia Viewer is provided for such media. The Multimedia Viewer is
also seamless, determining the type of media when the reader selects a Hot Link to a media
source and playing it appropriately. The HIS currently supports all MCI-supported media,
including animation, video, cd-audio, and audio-video interleave.
6.2 HYPERMEDIA DOCUMENT CREATION
Because a hypermedia document is more than just a digital version of a paper document, it is
necessary to transform a document from its original form into a form containing information for
the HIS. This information runs the gamut from basic text format such as which font to use to
links to other documents, graphics, animation, or other software programs. The HIS currently
provides support for the following document types: WordPerfect, Standard Generalized Markup
Language (SGML) that conforms to the Air Transport Association (ATA) Specification 100, and
ANSI. The transformation process for each type is described briefly below.
For document types such as WordPerfect, the transformation process is partially automated. It is
possible to include WordPerfect formatting such as boldface, italics, fonts, headers, etc., with an
in-house filter that converts inherent WordPerfect commands into commands that the HIS
understands. A similar filter could be created for other word processor formats such as Microsoft
Word and would behave similarly. The hypermedia author then adds hypermedia-specific
information such as Topics and Hot Links.
The transformation process for SGML documents that conform to ATA Spec 100, such as the
Boeing 757 Aircraft Maintenance Manual, is completely automated. The SGML language is
used to mark up documents by inserting tags in the text. Basically, these tags describe the
document's structure, such as which text is chapter titles (Topics), which is references (Hot
Links), which is paragraphs, etc. The hypermedia research project has developed a translation
program to convert SGML tags into their HIS counterparts. This makes documentation
transformation a smooth process, with no need for intervention by an author.
An ANSI document requires the most cumbersome transformation process. Since an ANSI
document is flat text with no fonts, boldface, links, etc., it is the hypermedia author's
responsibility to provide these details. Fortunately, an authoring system is under development to
make this task intuitive. With this authoring system, a computer novice will be able to turn a
digital document into a hypermedia document easily. Once a document is displayed in the HIS,
an author can put the Document Viewer into "author mode." By using the mouse to highlight
text, the author can use menu options to specify the text's appearance (bold, italics, etc.) or
function (link to graphics, link to text, etc.). The information the author provides is part of the
hypermedia document, even after the author exits from the HIS.
6.3 REAL-WORLD HIS APPLICATION
Now that the HIS itself has been described in detail, it is beneficial to describe a situation in
which it is being used. The HIS has proven its ability to support all facets of the aviation
community. The previous version of the HIS on CD-ROM addressed the needs of researchers. It
was also successfully integrated into several maintenance training systems. During the last year,
the current HIS (described above) was incorporated into a job aid for Aviation Safety Inspectors.
The Performance Enhancement System (PENS) (see FAA/AAM & GSC, 1993a) applies pen
computer and hypermedia technology to provide real-time job aiding and information retrieval
for Aviation Safety Inspectors. Aviation Safety Inspectors must have access to large amounts of
information, including Federal Aviation Regulations, Airworthiness Directives, and Advisory
Circulars. The Federal Aviation Regulations and the Inspector's Airworthiness Handbook have
been put into a library for inspectors' use. As the inspectors use PENS, they can directly access
the HIS to reference and search for information. The initial PENS system is being distributed for
use and evaluation to Aviation Safety Inspectors in nine U.S. locations. During the formal
evaluation, feedback provided regarding the HIS will be used to make future PENS
enhancements. Initial, informal feedback indicates that inspectors find it extremely valuable to
have access to the documents through the HIS. Inspectors are looking forward to having other
documents such as the Airworthiness Directives incorporated into the system.
6.4 FUTURE DIRECTIONS
As demand continues to increase, the HIS will continue to evolve. Specifically, the goals for
developing the HIS further include the following:
•
Complete the development of easy-to-use authoring tools
•
Support a wider variety of document types
•
Increase the document base to include other aviation documents
•
Enhance the searching mechanism to provide "smarter" searching
•
Support embedded graphics and tables.
The following sections describe plans to enhance the HIS in support of these goals.
6.4.1 Authoring Tools
Given that it is necessary for an author to transform a digital document into a hypermedia
document, it is desirable to make the process for doing so as easy and intuitive as possible. As
mentioned previously, development is under way to provide such an authoring system. Anything
the author needs to add, such as Hot Links and Topics, will be added in a WYSIWYG ("what
you see is what you get") environment. The author will be able to modify text, e.g., to correct
spelling errors, and even to type a document from scratch. This powerful authoring environment
will enable virtually anyone to create a hypermedia document.
6.4.2 Extended Document Types
It is also necessary to provide up-front support for existing source documents in formats other
than WordPerfect, SGML, and ANSI. Another goal is to develop filters for other word
processing formats and documentation standards. These other formats and standards might
include Microsoft Word and Interactive Electronic Technical Manual (IETM) specifications.
6.4.3 Increased Document Base
This past year's work has already seen an increase in the supported document base for the HIS to
include the Federal Aviation Regulations (FARs), the Airworthiness Inspector's Handbook, and
recent research publications of the FAA/ AAM & GSC. This work is just the tip of the iceberg
so far as the HIS' documentation base is concerned. Next year, the Human Factors Guide that is
currently in development under the Human Factors in Aviation Maintenance research program
will be transformed into an HIS-accessible hypermedia document. Also, Aviation Safety
Inspectors participating in the PENS project are requesting Advisory Circulars and
Airworthiness Directives.
6.4.4 Enhanced Searching
Searching is a powerful means of navigating a hypermedia document, enabling a reader to access
interesting information directly. By combining terms and phrases with Boolean operators, a
reader can refine a search that is too broad. However, it is still possible for a reader to end up
with search hits that are irrelevant or only vaguely related to the actual topic(s) of interest. Future
research will investigate several potential solutions to this problem. A relevancy measure is one
way to prevent a reader from needlessly examining irrelevant hits by indicating the relative
relevance of a search hit to the topic in which it is found.
A relevancy measure may not always be useful, such as in situations when multiple hits have
similar relevance. A thesaurus will assist the reader to focus a search. The thesaurus can be
customized by library; "plane" may have "air-plane" as a synonym in an aviation library and
"shave" in a carpentry library.
6.4.5 Embedded Graphics
The HIS allows an author to present text to a reader in the Document Viewer and to provide Hot
Links to graphics. Graphics are then displayed via the Graphics Viewer. The Graphics Viewer
may not be desirable for some types of documents. For example, a document containing pages
with numerous icons, figures, or small tables might be clumsy if it requires frequent opening and
closing of graphics files via the Graphics Viewer. To accommodate this type of document, the
HIS will add support for scrollable embedded graphics and tables. This also allows a reader to
print text and graphics together, instead of having to print them from their separate viewers.
6.5 SUMMARY
The AAM Hypermedia Information System (HIS) research program continues to meet the
challenges of improving aviation information access successfully. The HIS that has been
developed allows a reader to navigate through huge amounts information quickly and easily. By
supporting projects such as PENS and by creating hypermedia documents such as the FARs, the
Airworthiness Inspector's Handbook, and research publications of the FAA/AAM & GSC, the
HIS has proven its ability to support all facets of the aviation community. The HIS is flexible in
its support of multiple document/graphic types and standards and in its ability to accommodate
new types of media. With the advent of an authoring system that will enable virtually anyone to
put documents into the HIS, demand for the HIS will only increase.
6.6 REFERENCES
Federal Aviation Administration, Office of Aviation Medicine (FAA/AAM) & Galaxy
Scientific Corporation (GSC). (1993a). Human factors in aviation maintenance - Phase
three, volume one progress report. (NTIS No. DOT/FAA/AM-93/15).
Federal Aviation Administration, Office of Aviation Medicine (FAA/AAM) & Galaxy
Scientific Corporation (GSC). (1993b). Human factors in aviation maintenance - Phase
three, volume two progress report.
Howell, G.T. (1992). Building Hypermedia Applications: A Software Development Guide.
McGraw Hill, Inc.
Johnson, W. B. & Norton, J. E. (1992). Integrated information for maintenance training, aiding,
and on-line documentation. Proceedings 36th Annual Meeting of the Human Factors Society.
Atlanta, GA: The Human Factors Society
CHAPTER SEVEN
CORRELATES OF INDIVIDUAL DIFFERENCES IN
NONDESTRUCTIVE INSPECTION PERFORMANCE
Richard I. Thackray, Ph.D.
Galaxy Scientific Corporation
7.0 INTRODUCTION
Aviation maintenance requires a high level of quality assurance, with reliable nondestructive
inspection (NDI) a critical component in this (FAA/ AAM & GSC, 1993). The Air Force and the
nuclear power industry conducted a recent review of studies and programs in the area of NDI
reliability. The review revealed a repeated finding: large individual differences existed among
inspectors in their NDI proficiency (FAA/AAM & GSC, 1993). The few studies the review cited
that attempted to determine possible reasons for differences in NDI proficiency were generally
unsuccessful.
The Sandia Corporation has recently completed an FAA-funded field study, somewhat
comparable to the Air Force's "Have Cracks, Will Travel" study, to provide information on the
mag-nitude of differences among NDI inspectors in commercial aviation (Spencer et al., 1992).
Although the results of this study have not been published, preliminary data suggest that sizable
individual differences exist in the commercial field as well (Schurman, 1994).
As noted in the above review report, laboratory and field studies of individual differences in the
areas of inspection and vigilance, opinions of experts in the NDI field, and interviews with NDI
inspectors and training supervisors have suggested a number of variables, measures of which
would appear to be potentially relevant to NDI selection and/or proficiency. A number of these
variables (e.g., concentration/attention, patience, temperament, motivation, mechanical aptitude)
also corresponded to those suggested by Southwest Research Institute in their recommendations
to the Air Force of selection measures to improve technician proficiency (Schroeder, Dunavant,
and Godwin, 1988). The variables suggested by these various sources can be roughly separated
into the following categories:
•
Boredom Susceptibility
•
Concentration/Attentiveness/Distractibility
•
Extroversion/Impulsivity
•
Motivation/Perseverance
•
Decision Making/Judgement
•
Mechanical/Electronics Aptitude
•
Need for Autonomy.
A principal intent of the study reported here was to determine the relationship between selected
tests and measures derived from the above categories and performance on an NDI task. A second
intent was to investigate whether sustained performance during a simulated one-day shift
resulted in any significant decline in performance and to examine possible interaction effects
between performance changes and the above-mentioned individual differences variables.
This study employed a computer-simulated NDI eddy-current task developed by Drury and his
colleagues at the State University of New York (SUNY) at Buffalo. The task is described in
studies by Drury, Prabhu, Gramopadhye, and Latorella, (1991) and Latorella, Gramopadhye,
Prabhu, Drury, Smith, and Shanahan, (1992). In essence, the task utilized a SUN SPARC
workstation and incorporated a standard keyboard and optical three-button mouse as input
devices. As Latorella et al. (1992) emphasized, the aim in developing this task was neither to
develop a simulator for training on actual NDI tasks nor to develop a task to measure absolute
values of the probability of detecting particular types and sizes of faults. Their aim was to devise
a task closely approximating the characteristics and requirements of eddy-current inspection
tasks to enable laboratory investigation of factors possibly influencing NDI performance.
Neither of the two previous studies using this task was concerned with extensive evaluation of
possible predictor measures or with possible fatigue effects resulting from sustained performance
over successive task sessions. Few studies of inspection have examined performance over a long
enough period of time to assess fatigue effects. Wiener (1984) concluded that the literature does
not allow conclusions as to whether or not there are time decrements in inspection performance.
An earlier review suggested such fatigue effects, but most, if not all, of the "inspection" studies
reviewed were actually vigilance studies using paced tasks, with brief stimuli presented over
relatively short sessions (Poulton, 1973). Drury (1992) found only one study of "shop"
inspection in which a gradual fall in performance was reported, and that occurred over a
two-hour period. There is little evidence relative to expected performance change over the
simulated day shift incorporated in the present study.
The total procedure of this study, including the test and selection measures used, was tested in a
pilot study reported on previously (FAA/AAM & GSC, in press). Since the purpose of the pilot
study was to examine the overall feasibility of the approach used and to identify possible
problems with the procedure, minimal reference will be made to this earlier study.
7.1 METHODOLOGY
7.1.1 Subjects
A total of 28 subjects, 15 males and 13 females, participated in the study. All were right-handed,
had normal near visual acuity (as determined from an Orthorater screening test), reported normal
hearing, and were between 18 to 29 years of age. All had graduated from high school, with most
being full- or part-time employees concurrently attending a community college, technical school,
or four-year college or university. Subjects were obtained through an existing Federal Aviation
Administration (FAA) subject contract and were paid $10.00 an hour for their participation.
No subject was an aircraft mechanic or inspector and none had prior training or experience in
aircraft maintenance or inspection. This ensured a wider range of individual differences than was
likely if subjects had been selected from the maintenance/inspection population. The inclusion of
college students appeared justifiable on the basis of several recent studies of inspection
performance using both students and inspectors (Gallway, 1982; Gallway and Drury, 1986). The
former study was reasonably similar to the present one in that it involved selection tests and
inspection performance. Neither study found any significant differences between students and
inspectors.
7.1.2 Apparatus
The basic apparatus for this study consisted of a SUN SPARC Model 4/50GX-16-P43
workstation, 19-inch color monitor, and a 3-button optical mouse. Since the nature of the task
and its physical characteristics have been described in detail previously (Drury et al., 1991;
Latorella et al., 1992), only aspects relevant to the present study will be reviewed here.
The display consisted of four basic task elements (windows). These are shown in Figure 7.1 and
are described below.
Figure 7.1 NDI Task Simulation (Drury et al., 1992)
7.1.2.1 Inspection Window
The lower left portion of the screen was the inspection window displaying the rivets to be
inspected. Although it is possible to present a subject with multiple six-rivet rows, this study
used a single row. The subject used the optical mouse to move the cursor around each rivet's
circumference. The subject could examine the rivet until deciding if it was cracked. When the
subject decided that a rivet was cracked, he or she pressed the right mouse button. A red cross
appeared over this rivet, and "rivet marked bad" appeared on the screen. If the subject decided
the rivet was not defective, he or she pressed the middle button. "Rivet marked good" then
appeared on the screen. A subject could correct a mistake by pressing the appropriate button.
When a subject had inspected all six rivets, he or she pressed the left mouse button on the
directional block labeled "right." A black marker ring circled the last rivet inspected, and the
next six rivets in the row appeared in the inspection window.
7.1.2.2 Macro-View and Directionals
A macro-view in the upper left portion of the screen displayed a side view of the aircraft
fuselage and the row of rivets being inspected. Since only a small portion of this row was being
inspected at any given time, the subject could move the cursor over the words "Where am I" and
a momentary circle then appeared over the portion of the rivet row currently being examined.
7.1.2.3 Eddy-Current Meter
The upper right portion of the screen contained a simulated analog meter serving as the
eddy-current output indicator. Meter deflections beyond a set point produced an audible alarm
and a red flash on an indicator light. The following actions caused meter deflections:
•
touching a rivet's edge with the cursor or moving the cursor onto a rivet
•
passing the cursor over a crack (All cracks were invisible and of varying length.)
•
passing the cursor over or near simulated corrosion, scratches, or paint chips
(These were simulated by 2 mm jagged lines at random locations adjacent to a
rivet. Not all rivets contained such "noise," and no rivet contained more than one
such noise spot.)
7.1.2.4 Lower Right Window
The subject could use this area of the display to exercise a number of options (e.g., to "zoom" for
a closer look at a rivet being inspected, to stop the task for a break, or to display elapsed time).
The only feature used in this study caused a number to appear on each rivet. The experimenter
only used this feature during training feedback sessions to enable subjects to locate and re-check
rivets incorrectly classified.
7.1.3 Predictors and/or Task Correlates
As previously noted, the earlier review report (FAA/AAM & GSC, 1993) identified a number of
variables, measures of which appear potentially relevant to NDI selection and/or proficiency.
These variables could be roughly separated into the following categories:
•
Boredom Susceptibility
•
Concentration/Attentiveness/Distractibi-lity
•
Extroversion/Impulsivity
•
Motivation/Perseverance
•
Decision Making/Judgement
•
Mechanical Aptitude
•
Need for Autonomy.
The following sections describe the tests and scales, derived from the above categories,
examined for their relationship to performance on the NDI task.
7.1.3.1 Subjective Rating Scale (SRS)
The Subjective Rating Scale (SRS) is a simple self-rating scale the author has used in several
previous studies (Thackray, Bailey, and Touchstone, 1977; Thackray and Touchstone, 1991) to
assess current feeling levels. Measures generally are taken before and after periods of task
performance. The basic instrument consists of five 9-point scales measuring the dimensions of
attentiveness, tiredness, strain, interest, and annoyance. Two additional scales measuring
perceived effort and perceived difficulty were used in the more recent study by Thackray and
Touchstone (1991) and included here as well. The SRS was extensively examined in the early
Thackray, Bailey, and Touchstone (1977) study. In that study, subjects falling at the extremes of
rated interest following performance of a simulated radar monitoring task were compared on
several performance and subjective variables. In general, those who rated the task as quite boring
showed the greatest decline in rated attentiveness and the largest performance decrement.
7.1.3.2 Bennett Mechanical Comprehension Test
One recommendation of the Southwest Research Institute study of ways to improve NDI
technician proficiency was to select individuals who score high on mechanical/electronics
aptitude (Schroeder, Dunavant, and Godwin, 1988). This recommendation is echoed by NDI
instructors who express their belief that individuals with above average mechanical aptitude
make better inspectors (FAA/AAM & GSC, 1993). For these reasons, the Bennett Mechanical
Comprehension Test was included in the test battery. This test measures ability to perceive and
understand relationships of physical forces and mechanical elements in practical situations. This
ability may be regarded as a measure of one aspect of intelligence, if intelligence is broadly
defined (Bennett, 1969). This test has been validated on various groups of aircraft employees
such as shop trainees and aircraft factory employees in mechanical jobs (Bennett, 1969). The
performance criteria for the validation studies were generally job ratings, with validity
coefficients (r's) ranging from .52 to .62.
7.1.3.3 Typical Experiences Inventory
The ability to resist distraction, if it can be measured, would appear to have at least face validity
in selecting inspectors (Wiener, 1975). The Typical Experiences Inventory was developed for
use in several previous studies (Pearson and Thackray, 1970; Thackray, Jones, and Touchstone,
1973). This scale consists of a series of statements designed to measure ability to work under
conditions of (a) time stress, (b) threat of failure, (c) distraction, (d) social stress, and (e)
physical stress. In Thackray et al. (1973), two groups of subjects were selected who scored either
high or low on the distractibility subscale of this inventory. High scorers showed significantly
greater lapses of attention during performance of a repetitive task than did low scorers. Because
of these findings, it was decided to examine the relationship of scores on this subscale to
possible performance decrement on the NDI task.
7.1.3.4 Arithmetic, Digit Span, and Digit Symbol Tests of the Wechsler
Adult Intelligence Scale (WAIS)
Scores on these three WAIS subtests have been shown in numerous factor analytic studies to
measure a factor that has been variously named "Freedom from Distractibility",
"Attention-Concentration", or "Concentration-Speed" (e.g., Goodenough and Karp, 1961; Karp,
1963). Some or all of these WAIS subtests have been found to relate significantly to inspection
performance (Gallwey, 1982; Wang and Drury, 1989). Consequently, these tests were included
as another measure of attention/concentration or, conversely, distractibility.
7.1.3.5 Eysenck Personality Inventory (EPI)
The Eysenck Personality Inventory (EPI) is a short inventory measuring extroversion and
neuroticism. The extroversion dimension has been studied extensively in the context of
vigilance research because of Eysenck's (1967) hypothesis that extroverts should have more
frequent lapses of attention and hence more omission errors than introverts. Reviews of the use
of this personality dimension in vigilance research (Berch and Kantor, 1984; Wiener, 1975) have
lent some support to the belief that extroverts generally do not perform as well on vigilance tasks
as do introverts. Much less research has been conducted on personality variables in the area of
inspection, and no studies of extroversion and inspection performance had been conducted at the
time of Wiener's 1975 review. Since then, the author is aware of only one inspection study that
has incorporated a measure of extroversion. Using a visual search task, Gallwey (1982) found
that introverts, as measured by the EPI scale, had fewer search errors.
Koelega (1992) conducted a recent meta-analysis of vigilance studies over a 30-year period and
concluded that evidence for the superiority of introverts is considerably less than previously
believed. Koelega feels that there is enough consistency in the findings to warrant continued
research. Because of this, it was decided to include extroversion as measured by the EPI in the
present study.
7.1.3.6 Boredom Proneness Scale (Life Experiences Scale)
NDI inspection is typically repetitive and frequently considered boring and monotonous
(Schroeder, Dunavant, and Godwin, 1988). While the evidence relating experienced boredom to
poor performance is somewhat tenuous, at least one study demonstrated a significant relationship
of reported boredom and monotony to vigilance performance. As noted earlier, subjects falling at
the extremes of rated boredom following a simulated radar monitoring task showed the greatest
decline in rated attentiveness and the largest decrement in performance (Thackray et al., 1977).
Boredom in the above study was measured following task performance and thus can be
considered a "state" assessment of boredom. Farmer and Sundberg (1986) developed the only
scale specifically developed to assess the general construct of boredom proneness (i.e. a "trait"
measure of boredom susceptibility). To the author's knowledge, this scale has not been used in
studies of inspection performance. For this reason, it was included in the present study. In order
to disguise the scale's intent, it was relabeled "Life Experiences Scale."
7.1.3.7 Matching Familiar Figures Test (MFFT)
The Matching Familiar Figures Test (MFFT), developed by Kagan and his associates (Kagan,
Rosman, Day, Albert and Phillips, 1964), consists of a series of 12 "stimulus" pictures, each of
which is associated with 8 "response" pictures. Except for one correct picture in each response
set, all differ from the stimulus picture in some minute detail. Subjects point to the picture they
believe to be correct in each set and continue until identifying the correct one. Both the time to
first response and the number of errors are scored. According to the test's authors, the MFFT
measures a cognitive style known as reflection-impulsivity. Those who make quick, inaccurate
decisions on the test are said to have an impulsive cognitive style; those who make slow,
accurate decisions are said to have a reflective cognitive style.
This test has been used to measure the tendency of subjects performing inspections tasks to opt
for speed or accuracy in their speed/accuracy tradeoff (Drury, Gramopadhye, Latorella, Patel,
Prabhu, and Reynolds, 1992). Presumably, impulsive subjects tend to opt for speed at the
expense of accuracy; conversely, reflective subjects would opt for accuracy at the expense of
speed. A recent study found scores on the MFFT to be significantly related to several measures
of inspection performance (Latorella et al., 1992). Since the task used in this latter study was the
NDI simulation developed by them and used in the present study, it seemed desirable to
investigate further the relationship of MFFT scores to performance on this task.
7.1.3.8 Internal-External Locus of Control Scale
Rotter's (1966) Internal-External (I-E) Locus of Control Scale was developed to measure
differences among individuals in the extent to which they believe that rewards and
reinforcements in life experiences are contingent on or independent of their own behavior. The
internal person believes that rewards are contingent on his or her own effort, attributes, or
capacities; the external person believes that life's rewards result largely from luck, chance, fate,
or forces outside of his or her control.
In a study of vigilance performance, Sanders, Halcomb, Fray, and Owen (1976) hypothesized
that "internals," constantly striving for mastery of a situation and exhibiting a belief in their own
ability to determine the outcome of their efforts, would perform better on a vigilance task than
would "externals." The results supported this hypothesis in that internals, relative to externals,
missed significantly fewer signals. Also, internals continued to progress in the monitoring task
with a very small decline in performance; externals showed a consistent performance
decrement.
Because the Rotter scale has apparently not been used previously in inspection research, it
seemed important to determine whether relationships similar to those found in vigilance would
apply to inspection performance.
7.1.3.9 Jackson Personality Research Form (PRF)
The Jackson Personality Research Form (Jackson, 1974) is a widely used test designed to yield a
set of scores for personality traits broadly relevant to the functioning of individuals in a wide
variety of situations. It is a personality test that focuses primarily upon normal functioning,
rather than psychopathology.
The Form E used in this study consists of sixteen scales, of which seven were employed in this
study. The included scales were (a) Achievement, (b) Endurance, (c) Understanding, (d)
Cognitive Structure, (e) Autonomy, (f) Change, and (g) Impulsivity. A brief description of each
scale and the reason(s) for its inclusion follows.
•
Achievement. A measure of the willingness to put forth considerable effort to
accomplish difficult tasks. This was included as a possible measure of intrinsic
motivation or perseverance in task performance, mentioned earlier in the review
report as a desirable quality for NDI technicians.
•
Endurance. A measure of the willingness to work long hours and to be patient and
unrelenting in work habits. This trait appears somewhat related to the above
measure, and, in fact, loads on the same factor in a factor analysis of the test. It
was included for the same reasons as the Achievement trait.
•
Understanding. A measure of intellectual curiosity and the desire to understand
many areas of knowledge. This was included because it was felt that it might
correlate negatively with performance on a task as constrained and repetitive as
eddy-current testing.
•
Cognitive Structure. A measure of the need to make meticulous decisions based
upon definite knowledge with a dislike of ambiguity and uncertainty. It was felt
that this trait might be positively related to search time, i.e. the time spent in
searching each rivet for possible faults.
•
Autonomy. A measure of the need to be independent and not to be tied down,
restrained, confined, or restricted in any way. This trait was mentioned in the
previous review report as characterizing the most proficient inspectors
(FAA/AAM & GSC, 1993). This trait was also identified by some NDI
instructors interviewed.
•
Change. A measure of liking for new and different experiences, with a dislike and
avoidance of routine activities. Inclusion of this trait is self-evident, since NDI
tasks are quite often referred to as boring and monotonous.
•
Impulsivity. A measure of the tendency to act on the "spur of the moment" and
without deliberation. This was included as an additional measure of impulsivity to
be compared with the impulsivity measure derived from the MFFT.
7.1.3.10 Figure Preference Test
The Figure Preference Test was a paired comparison version of the Munsinger and Kessen
(1964) test of preference for complex versus simple perceptual stimuli. Subjects chose which
figure of each pair they prefer from a set of 66 pairs of figure drawings differing in complexity.
A recent study of industrial workers determined that preference for simple stimuli on this test
was related to preference for repetitive, unchanging work requiring a constant focus of attention
(Rzepa, 1984). Because of the apparent similarity of NDI inspection to tasks of this type, it was
decided to add the Figure Preference Test to the battery of predictors.
7.1.3.11 Summary of Tests and Measures
The tests and measures described above were included because it was felt that each might serve
to measure some aspect of the variables mentioned under Section 7.1.3 as predictors and/or
correlates of NDI performance. A number of these tests and measures are similiar and may
indeed measure the same trait, aptitude, or ability. However, one cannot always tell from test
titles and descriptors whether they measure similar things; some were included to determine
empirically the extent of their interrelationships, or lack thereof.
7.1.4 Procedure
Each subject was tested over two successive days. The morning of the first day was devoted to
administration of the various tests and measures; during the afternoon, subjects practiced using
the mouse, were required to read and be tested on a document describing eddy-current testing
and the need for it, and practiced the NDI simulation task. Afternoon training procedures were
essentially the same as those used in the earlier pilot study.
Training in using the mouse was provided by a display program consisting of a enlarged picture
of a rivet head with a training circle surrounding it. The subject practiced using the mouse and
cursor to circle the rivet while staying within the circle. After each pre-selected block of training
trials, each subject received feedback on the average times required to circle the rivet and the
average number of times the cursor head touched the rivet or went outside the circle. Training
continued until the subject reached a consistent level of performance. This usually required 15 to
30 minutes of practice.
Task training began with a short (20-rivet) demonstration session in which the basic elements of
the NDI task were explained. This was followed by three training sessions each 60 rivets long.
Thirty percent of the rivets in each of the three training sessions contained faults (cracks). In
addition, the second and third sessions also contained small, but visible (2 mm), "noise" spots at
various locations at or near a rivet. The frequency of "noisy rivets" was also thirty percent. The
location of faults and noise was randomly assigned for each task session (both training and
subsequent test tasks). Performance feedback was automatically provided after each block of 10
rivets. In the first session, training circles around each rivet assisted the subject to keep the
cursor in the appropriate region while circling the rivets; no training circles were used in the
second and third sessions.
On the morning of the second day, subjects performed a short (20-rivet) "refresher" version of
the NDI task and then two lengthy (180-rivet) test sessions. These sessions were self-paced, and
test durations for each subject varied from a minimum of about 60 minutes to the maximum
allowable duration of 90 minutes. There was a fixed 15-minute rest break between sessions,
although subjects were told that they could take short (10-20 second) "stretch" breaks as needed
during any session. Following a 60-minute lunch break, this same procedure (two 180-rivet
sessions), minus the short practice session, was followed in the afternoon. No feedback was
provided following test sessions, and the frequency of both faults and noise was held at 30
percent each.
Subjective rating scales were administered at various times during the course of both days.
At the end of the second day, subjects were debriefed and questioned about their various
attitudes and approaches to the NDI task.
7.2 RESULTS
7.2.1 Task Performance
7.2.1.1 Performance Measures: Reliability, Intercorrelations, and
General Observations
As mentioned earlier, 30 percent of the rivets in each 180-rivet session contained cracks (faults).
Of the two types of error (failing to detect a faulty rivet or calling a good rivet bad), missed
faults were by far the most common. On the average, approximately 23 percent of faulty rivets
were missed, while only about 2 percent of good rivets were marked faulty. These mean error
rates, incidently, are remarkably close to those noted in preliminary analyses of the recently
completed Sandia/FAA field study (Schurman, 1993). Comparisons of the sum of the first two
sessions with the sum of the last two sessions yielded correlations (reliability estimates) of r=.84,
p<.01 and r=.82, p<.01 for false alarms and missed faults, respectively. Total errors (false alarms
plus missed faults) correlated r=.51, p<.01 with false alarms and r=.91, p<.01 with missed faults.
Since false alarms and missed faults were essentially uncorrelated (r=.09), missed faults
accounted for most of the variance in total errors.
The remaining measure of performance, mean time per rivet, measured speed of inspection; it
represented the mean time a subject examined rivet before arriving at a decision. A negative
correlation of missed faults with mean time per rivet would suggest that subjects traded speed for
accuracy. However, the obtained correlation of missed faults with speed, although negative,
failed to reach statistical significance (r= -.22, p>.05).
7.2.1.2 Performance Change Across Periods and Sessions
One of the purposes of this study was to examine the data for evidence of progressive changes
across periods and sessions. Such data might suggest a fatigue effect. Changes indicative of
fatigue were suggested from the findings of the earlier pilot study. Tables 7.1 and 7.2 show
mean percentages across sessions of missed faults and false alarms, respectively. To allow
intra-session comparisons of performance not separated by rest breaks, each session was divided
into two 90-rivet segments, referred to as periods in the tables. Although each session contained
an equal number of total faults, arbitrarily breaking each into halves resulted in slightly differing
proportions of faults in the first and second halves of the four sessions. Consequently, the data
shown in Tables 7.1 and 7.2 show percentage data, and all subsequent analyses of variance were
conducted on these data.
Table 7.1 Mean percent of faults missed across periods and sessions
Period
Session
1
2
Session
Means
1
15.4
23.8
19.6
2
25.0
24.4
24.7
3
24.0
25.3
24.6
4
19.6
28.6
24.1
Period Means 21.0
25.5
23.2
Table 7.2 Mean percent of false alarms across periods and sessions
Period
Session
1
2
Session
Mean
1
0.8
0.5
0.6
2
1.3
3.1
2.2
3
1.9
2.8
2.3
4
3.1
4.2
3.7
Period Means
1.8
2.7
2.2
Both tables reveal generally poorer performance in the second period of each session, but only
false alarms showed a systematic increase across sessions. Repeated measures of analyses of
variance (ANOVAs) conducted on the two error measures revealed the differences between
periods to be significant for both missed faults and false alarms (F(1/26)=9.88, p<.01 and
F(1/26)=7.29, p<.01), respectively. Differences between sessions were significant for false
alarms (F(3/78)=5.14, p<.01), but not significant at the .05 level for missed faults. The
interaction of session by period was significant for both missed faults (F(3/78)=4.43, p<.01) and
false alarms (F(3/78)=3.02, p<.05), although in neither case did the patterns of cell mean
differences lead to meaningful conclusions. Because the pilot study had suggested the possibility
of sex (gender) differences in performance, the analyses included gender as a between-subject
variable. Neither analysis revealed any significant main effects or interactions attributable to
gender. Consequently, the tables show only combined data of both sexes.
Mean times per rivet across the four sessions were 23.6, 21.9, 21.6, and 19.6 seconds,
respectively. Analysis of variance revealed this decline to be significant (F(3/78)=8.96, p<.01).
There were no significant differences between males and females, and the interaction of gender
and sessions was nonsignificant (p>.05). Comparisons of changes within sessions (periods) were
not considered to add any additional useful information, and none were made.
Some comments regarding the increase in false alarms both within and between sessions is in
order. A possible increase in fatigue within a session seems a plausible explanation for the
increase in missed faults. Subjects presumably became less attentive and more careless.
However, it is somewhat puzzling to see how increasing tiredness could also result in increases
in false alarms. False alarms should logically occur only when a meter indication resulting from
"noise" is wrongly attributed to a crack. In this task, however, most erroneous meter indications
seemed to result from a subject passing too close to a rivet's edge. The time spent examining
each rivet steadily decreased across sessions, and this could indicate less-careful examination of
individual rivets. Less-careful examination would likely increase the number of times a rivet was
touched, with the resulting meter deflections misinterpreted as faults.
7.2.2 Rating Scale Variables
7.2.2.1 Pre- to Post-Task Changes
Measures of attentiveness, tiredness, strain, interest, and annoyance were obtained for each
subject at the beginning and end of the morning and afternoon sessions of the second day. In
addition, items relating to perceived task difficulty and effort required to maintain alertness were
also administered at the end of the morning and afternoon sessions of this second day. Mean preand post-task values for each rating variable are shown in Table 7.3.
Table 7.3 Mean pre- and post-session ratings
Variable
Mn Pre-Session Ratings Mn Post-Session Ratings
Attentiveness
6.8
5.3
Tiredness
4.6
5.6
Strain
3.7
4.7
Interest
5.8
4.2
Annoyance
1.3
2.1
Effort
3.5
4.8
Difficulty
2.3
3.2
Separate ANOVAs revealed significant pre- to post-task decreases in attentiveness
(F(1/27)=37.15, p<.01) and interest (F(1/27)=48.83, p<.01), along with significant increases in
tiredness (F(1/27)=30.39, p<.01), strain (F(1/27)=15.75, p<.01), and annoyance (F(1/27)=11.77,
p<.01). Ratings of task difficulty increased significantly from the beginning to the end of the
sessions (F(1/27)=8.27, p<.01) as did the ratings of effort required to remain attentive
(F(1/27)=22.39, p<.01).
Verbal labels associated with numerical values on the rating scales revealed that none of the
feeling states represented extreme levels. Subjects typically began each session feeling
moderately attentive, moderately relaxed, moderately interested, not annoyed, and having about
their normal energy level. Each variable was rated on a 9-point scale, with 5 representing the
midpoint or middle value. Post-session levels for most variables were near this midpoint value.
Pre- to post-session changes for all variables were relatively small, representing minor shifts in
feeling state from pre-session levels. For difficulty and effort, subjects initially perceived the
task to be slightly difficult, requiring slight effort. Ratings of perceived difficulty and effort at
the end of the sessions, although increasing significantly for both variables, revealed relatively
minor changes in each variable.
7.2.2.2 Correlations of Rating Scale Data with Performance
To investigate the relationships, if any, between rating scale data and performance, difference
scores (post minus pre levels) were obtained for each subject for each rating scale variable.
These were separately correlated with missed faults, false alarms, and mean time/rivet. No
correlation reached significance (p>.05), with the exception of an association of attentiveness
change with missed faults (r=-.40, p<.05). This relationship, as explained in the next section,
was apparently the result of differences in initial rather than final levels of attentiveness.
7.2.2.3 Analyses of Variance of Rating Scale Data and Performance
In addition to the correlational analyses, separate ANOVAs were conducted to compare rating
scale changes for extreme groups of subjects (the best and the worst 9 subjects) formed on the
basis of total scores on each performance variable. It was felt that eliminating subjects in the
middle range of score distributions might provide a more sensitive approach to analyzing
relationships. Only one of the ANOVAs, however, suggested a possible relationship of
performance scores to ratings; this was an interaction between interest change and missed faults
(F(1/16)=3.88, p<.06). Examination of mean values revealed that subjects in the poorest group
showed a greater decline in interest during performance than did those in the better group. The
analysis comparing the best and worst groups' missed faults with attentiveness change yielded an
interaction effect that, like that shown above for interest change, approached significance
(F(1/16)=3.71, p<.07). Examination of the mean values, however, revealed the reason for the
significant correlation reported in Section 7.2.2.2. While the best and worst groups had similar
post-session ratings of attentiveness, better performers had a higher initial level of attentiveness,
thus showing a greater pre to post change than did the poorer performers.
7.2.3 Predictor Variables and Performance
A large number of exploratory analyses were conducted using discriminant function analysis and
factor analysis. In general, the clearest relationships were found using factor analysis. A
principal components analysis using varimax rotation and solved for four factors seemed to yield
the best, most interpretable relationships. Loadings of each predictor variable on the four factors
are shown in Table 7.4. A cut-off criterion of .60 was used to select those variables contributing
to factor interpretation.
This means that a variable would have to explain at least 36 percent of a factor's variance for it to
be included in a factor's interpretation. The factors were identified with the labels listed below.
Table 7.4 Loadings of each predictor variable on the four factors
Factor
Variable
1
2
3
4
Typ Exp Inventory
-0.046
0.473
-0.128 -0.276
Bennett Mech Test
-0.209
0.103
-0.257
LES Boredom Prone
0.358
0.378
-0.582 -0.052
Match Fam Fig Error
-0.257
-0.722
0.096 -0.291
Match Fam Fig Time
-0.075
-0.049
-0.639
0.222
Eysenck Extroversion
0.644
-0.398
0.222
0.203
WAIS Dig Symbol
0.208
0.175
0.697 -0.156
WAIS Dig Span
0.114
0.105
0.106
0.828
WAIS Arithmetic
0.057
0.600
0.129
0.500
PRF Achievement
-0.553
-0.308
-0.029
0.241
PRF Autonomy
0.059
0.738
0.213
0.028
PRF Change
0.075
0.073
0.754
0.296
PRF Cog Structure
-0.807
0.016
-0.186
0.051
PRF Endurance
-0.717
-0.282
0.055 -0.084
PRF Impulsivity
0.741
-0.250
0.170
0.074
-0.143
0.644
0.075
0.152
Rotter I-E Scale
0.584
0.085
Fig Preference
0.105
0.016
PRF Understanding
0.612
-0.491 -0.026
0.359
0.282
Factor 1 - Impulsive/Impatient: This is one of the easier factors to identify. The tests loading
positively on this factor (EPI Extroversion and PRF Impulsivity) suggest an impulsive
personality style, while tests loading negatively (PRF Endurance and PRF Cognitive
Structure) suggest impatience, unwillingness to work long hours, and a lack of
meticulousness.
Factor 2 - Reflective/Analytical: Kagan and associates (Kagan et al., 1964) report that low
scores on the MFFT error measure relate to a reflective personality style; high scores on the
PRF Understanding scale also suggest a reflective, analytical style. Positive loadings on the
WAIS Arithmetic scale are related to concentration/attentiveness (Goodenough and Karp,
1961; Karp, 1963), and high scores on the PRF Autonomy scale suggest self-reliance. While
not forming an entirely consistent pattern, this factor seems best to typify a
reflective/analytical dimension.
Factor 3 - Rapid/Adaptable: Positive loadings on the WAIS Digit Symbol and negative
loadings on the MFFT Time measure suggest an ability to perform new tasks rapidly. High
loadings on the PRF Change scale suggest a dislike of routine and an ability to adapt readily
to new and different experiences. While aspects of this factor may seem to resemble Factor 1,
the loadings are quite different. It appears that Factor 3 represents more of a risk-taking,
adventurous dimension than the impulsive, impatient dimension of Factor 1. Taken together,
Factor 3 appears to reflect a rapid/adaptable personality dimension.
Factor 4 - Mechanical Aptitude: This factor appears to stand alone as an ability factor; the
other factors represent personality dimensions. Only two tests load substantially on this
factor: the Bennett Mechanical Comprehension Test and the WAIS Digit Span scale. The
former seems to define the factor, while the latter suggests an important attentional
component.
Pearson product moment correlations between each factor score and the various performance
criterion measures, however, showed only two of the factors to be significantly related to
performance. Factor 4 was negatively correlated with missed faults (r=-.38, p<.05) and with false
alarms (r=-.51, p<.01). Factor 1 was negatively correlated with mean time/rivet (r=-.48, p<.05).
A summary interpretation of these relationships is that good task performance (low numbers of
missed faults and false alarms) is related to both mechanical aptitude and
concentration/atten-tiveness. Speed of inspection is related to both impulsivity/impatience and an
unwillingness to devote long periods of time to work.
7.2.4 Gender, Liking for Inspection, and Educational Level
At the end of the last performance session, each subject was debriefed and asked whether or not
he or she might like inspection work or could visualize himself or herself as an inspector. The
answers were coded "1" if inspection appealed to them and "2" if it did not. The number of males
and females in each category are shown in Table 7.5.
Table 7.5 Number of males and females expressing a liking for or dislike of the
inspection task
Gender
Like
Inspection
Dislike
Inspection
Males
10
5
Females
5
8
Although there is a suggestion of a gender difference in the data, with more males expressing a
liking for inspection, a chi-square test revealed this apparent gender difference to be
nonsignificant (p=.14). Liking for inspection, however, was found to be related to educational
level. As noted earlier, education levels of subjects in this sample ranged from high school to
graduate school. This range was dichotomized. High school graduates and those currently
attending a community college or technical school were placed in one category, and those
currently enrolled in a university with junior status or higher were placed in a second category.
The lower educational level was coded "1", while the higher level was coded "2." Subjects in
each category, along with their expressed liking (or disliking) of the inspection task, are shown
in Table 7.6.
Table 7.6 Number in each educational category expressing a liking for or a dislike of the inspection
Educational
Category
Like
Inspection
Dislike
Inspection
1
12
3
2
3
10
Ten out of 13 subjects (77 percent) who expressed a dislike of the inspection task or who could
not visualize themselves as inspectors were in the higher educational level category, while 80
percent of subjects in the lower educational category either liked the inspection task or could
visualize themselves as inspectors. A chi-square test of the data in this table revealed the
relationship between educational level and liking for inspection to be significant (p<.01).
Correlational analyses revealed that neither liking for inspection nor educational level were
significantly related (p>.05) to any performance measures.
Although gender was not related to liking for inspection and, as noted earlier, was not related to
any performance measures, gender was correlated significantly (r=-.58, p<.01) with scores on the
Bennett Mechanical Aptitude Test. Males performed better than females on this test. Because the
Bennett Test loaded substantially on Factor 4, which was significantly correlated with both
missed faults and false alarms, these data suggest an indirect relationship of gender to
performance.
7.3 DISCUSSION
The present study used a simulated eddy-current inspection task to address two questions, both
of which are of concern to aviation maintenance and inspection:
1.Does performance on this task over a period of time simulating an 8-hour shift show any
evidence of decline (fatigue)?
2.Can tests and measures be identified that will predict performance on this task?
7.3.1 Evidence of Fatigue Effects
Before considering possible fatigue effects, the experiment's procedure will be briefly reviewed.
The first day for each subject was devoted to administration of the psychometric test battery and
to training sessions on the NDI task. The second day simulated a work shift by having subjects
perform the NDI task over four successive sessions, two in the morning and two in the afternoon.
Each session was self-paced and lasted approximately 60 to 90 minutes. Fifteen-minute breaks
were given between the two morning and afternoon sessions along with a 60-minute lunch break.
Attempts were made to make each session as close to real life as possible by allowing subjects to
take brief "stretch" breaks as often as they desired.
For purposes of data analysis, each session was arbitrarily divided into a first and second half.
The results revealed a significant increase in the number of both missed faults and false alarms
from the first to the second half of the sessions. Further, while missed faults did not increase
over the four sessions, there was a significant increase in the number of false alarms from session
1 to session 4.
The increase in errors during sessions, where no rest periods were allowed except for brief
stretch breaks, suggests a decline in performance efficiency that may have been the result of a
progressive increase in tiredness and/or a decrease in attentiveness. Rating scale measures of
attentiveness and tiredness both showed significant changes from the beginning to the end of the
sessions, with attentiveness decreasing and tiredness increasing. However, individual differences
in the magnitude of change in tiredness or attentiveness were found to be unrelated to individual
levels of performance error (both missed faults and false alarms).
Changes in rating scale variables such as interest, strain, annoyance, task difficulty, and task
effort were significant from beginning to end of the sessions, and, except for change in interest,
were unrelated to performance error. With regard to the change in interest, subjects showing the
highest levels of missed faults showed a greater decline in interest during the sessions than did
subjects with the lowest numbers of missed faults.
In assessing the effects of sustained performance on error frequency, two aspects should be
emphasized. First, although significant performance declines occurred during the sessions, the
absolute magnitude of the increase in errors was relatively small. For missed faults, mean
percent error for the first half of the sessions was 21 percent, which increased to a mean percent
error of 25.5 percent during the second half. For false alarms, mean percentages of error for the
first and second half of the sessions were 1.8 percent and 2.2 percent, respectively. Also, the
mean percent error for false alarms during the first session was less than 1 percent which
increased to 3.7 percent by the last session. Although these increases in error were statistically
significant, they may not be large enough to be practically significant.
Second, the concomitant changes in such subjective measures as tiredness, attentiveness,
interest, and strain, although statistically significant, also represented relatively little absolute
change in feeling states from the beginning to the end of the sessions. As noted earlier, subjects
typically began each session feeling moderately attentive, moderately relaxed, moderately
interested, not annoyed, and having about their normal level of energy. Post-session ratings
deviated little from the initial feeling states. Except for change in interest, which, as discussed
above, was related to frequency of missed faults, none of the changes in feeling state was found
to be related to measures of performance error. Had the sessions been longer or had they been
conducted when subjects were tired initially, greater changes in both performance and feeling
states might have occurred, possibly resulting in significant relationships between subjective
measures and task performance.
7.3.2 Performance Predictors
A factor analysis of the various predictor variables employed yielded four factors: two correlated
significantly with performance. Factor 4 showed a significant negative correlation with both
missed faults and false alarms, while Factor 1 showed a significant negative correlation with the
performance speed measure (mean time/rivet).
Only two tests had substantial loadings (.60 or greater) on Factor 4. These were the Bennett
Mechanical Comprehension Test and WAIS Digit Span Test. As indicated earlier, mechanical
ability has been frequently mentioned as possibly related to inspection proficiency. Normative
data shows it to be significantly related to job performance of various groups of aircraft factory
employees (Bennett, 1969). As previously noted, the Digit Span Test appears to be a measure of
alertness or concentration. Several studies have shown it to be related to inspection proficiency
(Gallwey, 1982; Wang and Drury, 1989). Taken together, these two tests seem to tap specific
abilities relating to inspection errors the simulated NDI task measured. It is interesting to note
that while missed faults and false alarms were essentially uncorrelated, both were related to
Factor 4. In looking at individual Pearson correlations of each test loading on Factor 4, Digit
Span correlated higher with false alarms than with missed faults. The Bennett Test showed a
higher correlation with missed faults than with false alarms. This suggests that the two tests may
measure different aspects of task performance. A follow-up study will examine this possibility
further.
With regard to Factor 1, the tests loading substantially on this factor (e.g., EPI Extroversion, PRF
Impulsivity, PRF Endurance) suggest that this factor measures a rapid/impatient/impul-sive
cognitive style. It is not surprising that this factor correlated significantly with the measure of
time taken to inspect the rivets (mean time/rivet). The fact that mean time/rivet did not correlate
significantly with either of the two measures of inspection error would indicate that subjects did
not necessarily lose inspection accuracy with increased speed of inspection.
7.3.3 Gender, Liking for Inspection, and Education Level
The previous pilot study suggested a possible gender difference in inspection accuracy. For this
reason, this study examined possible male/female differences in performance. The results did not
show differences between males and females in either performance accuracy or in speed of
inspection. This lack of a gender effect is consistent with the findings of most previous studies of
vigilance and inspection (Wiener, 1975).
Liking for (or dislike of) inspection was related to educational level, but not to any performance
measures. Likewise, differences in subjects' educational levels was also unrelated to
performance. These findings are consistent with those of Summers (1984) in his follow-up study
of the early Air Force "Have Cracks, Will Travel" study (Lewis et al., 1978). The level of formal
education (from less than high school to more than 2 years of college) was unrelated to
technician performance, as was expressed liking for (or dislike of) inspection.
7.4 CONCLUSIONS
This experiment used a simulated eddy-current inspection task (a) to determine the extent of
performance change, if any, over a simulated day-shift work period and (b) to investigate the
relationships between various predictor variables and performance on the eddy-current task.
Many of the findings, such as the lack of any relationship among inspection performance and
gender, educational level, and expressed liking for inspection, were generally consistent with
previous studies. Other findings, such as the relationships between a number of psychometric
tests and task performance, are tentative and need to be validated with a different group of
subjects. This will be accomplished in a planned follow-up study. A summary of the major
findings of this study follows.
•
There were statistically significant increases in both missed faults and false
alarms during the 60-90 minute task sessions, but only false alarms showed any
tendency to increase across sessions. Increases in the percentages of missed faults
and false alarms, both within and between sessions, ranged from only 0.8 to 4.5
percent, however, and may not represent performance declines of practical
significance.
•
Accuracy of inspection (low numbers of missed faults and false alarms) was
found to be positively related to mechanical ability, as measured by the Bennett
Mechanical Comprehension Test, and concentration/attentiveness, as measured
by the WAIS Digit Span Test. Tests and scales measuring such traits as
extroversion, impulsivity, and lack of meticulousness (the Eysenck Extroversion
Scale and the PRF Impulsivity and Cognitive Structure Scales) were significantly
related to speed of inspection.
•
Speed of inspection was unrelated to errors (missed faults and false alarms).
•
There was a relationship between level of educational achievement and liking for
inspection. Subjects with higher educational levels expressed a dislike for
performing the inspection task, while those with lower educational levels tended
either to like the task or not to find it unpleasant.
•
Liking for inspection was unrelated to performance (missed faults, false alarms,
or speed) on the NDI task.
•
There were no differences between males and females in either task performance
or in liking for inspection.
7.5 REFERENCES
Bennett, G. K. (1069). Bennett Mechanical Comprehension Test - Manual Forms S and T. New
York: The Psychological Corporation.
Berch, D. B. & Kanter, D. R. (1984). Individual differences. In J. S. Warm (Ed.), Sustained
attention in human performance. New York: Wiley.
Drury, C. G. (1992). Inspection Performance. In G. Salvendy (Ed.), Handbook of industrial
engineering, second edition. New York: Wiley.
Drury, C. G., Gramopadhye, A., Latorella, K., Patel, S., Prabhu, P., & Reynolds, K. (1992).
Human reliability in aircraft inspection. Phase II Report on FAA Contract to Galaxy
Scientific Corporation, Atlanta, Georgia.
Drury, C. G., Prabhu, P., Gramopadhye, A., & Latorella, K. (1991). Nondestructive testing in
aircraft inspection. Report of a pilot study prepared under subcontract 89-1014-SC-3 to Galaxy
Scientific Corporation, Mays Landing, New Jersey.
Eysenck, H. J. (1967). The biological basis of personality. Springfield, Illinois: Thomas.
Farmer, R. & Sundberg, N. D. (1986). Boredom proneness - The development and correlates of a
new scale. Journal of Personality Assessment, 50, 4-17.
Federal Aviation Administration Office of Aviation Administration and Galaxy Scientific
Corporation (FAA/AAM & GSC). (1993). Human factors in aviation maintenance - Phase
Three, Volume I progress report. DOT/FAA/AM-93/15, Office of Aviation Medicine,
Washington, D. C.
Federal Aviation Administration Office of Aviation Administration and Galaxy Scientific
Corporation (FAA/AAM & GSC). (in press). Human factors in aviation maintenance Phase Three, Volume II progress report. Office of Aviation Medicine, Washington, D. C.
Gallwey, T. J. (1982). Selection of tests for visual inspection on a multiple fault type task.
Ergonomics, 25, 1077-1092.
Gallwey, T. J. & Drury, C. G. (1986). Task complexity in visual inspection. Human Factors, 28,
585-606.
Goodenough, D. R. & Karp, S. A. (1961). Field dependence and intellectual functioning.
Journal of Abnormal and Social Psychology, 63, 241-246.
Jackson, D. M. (1974). Personality Research Form Manual. New York: Goshen.
Kagan, J., Rosman, B., Day, D., Albert, J., & Phillips, W. (1964). Information processing in the
child: Significance of analytic and reflective attitudes. Psychological Monographs, 78, (1,
Whole No. 578).
Karp, S. A. (1963). Field dependence and overcoming embeddedness. Journal of Consulting
Psychology, 27, 294-302.
Koelega, H. S. (1992). Extraversion and vigilance performance: 30 years of inconsistencies.
Psychological Bulletin, 112, 239-258.
Latorella, K. A., Gramopadhye, A. K., Prabhu, P. V., Drury, C. C., Smith, M. A., & Shanahan,
D. E. (1992, October). Computer-simulated aircraft tasks for off-line experimentation. Paper
presented at the Annual Meeting of the Human Factors Society, Atlanta, Georgia.
Lewis, W. H., Pless, W, M. & Sproat, W. H. (1978). Reliability of nondestructive inspections Final report. Report No. SA-ALC/MME 76-6-38-1, Lockheed-Georgia Company, Marietta,
Georgia.
Munsinger, H. & Kessen, W. (1964). Uncertainty, structure and preference. Psychological
Monographs: General and Applied, 78, Whole No. 9.
Pearson, D. W. & Thackray, R. I. (1970). Consistency of performance change and autonomic
response as a function of expressed attitude toward a specific stress situation.
Psychophysiology, 6, 561-568.
Poulton, E. C. (1973). The effect of fatigue upon inspection work. Applied Ergonomics, 4.2,
73-83.
Rotter, J. B. (1966). Generalized expectancies for internal versus external control of
reinforcement. Psychological Monographs: General and Applied, 80, (1, Whole No. 609).
Rzepa, T. (1984). Typological determinants of operator functioning in monotonous work
conditions. Polish Psychological Bulletin, 15, 135-141.
Sanders, M. G., Halcomb, C. G., Fray, J. M., & Owens, J. M. (1976). Internal-external locus of
control and performance on a vigilance task. Perceptual and Motor Skills, 42, 939-943.
Schroeder, J. E., Dunavant, D. W., & Godwin, J. G. (1988). Recommendations for improving
Air Force nondestructive inspection technician proficiency. SwRI Project No. 17-7958-845, San
Antonio Air Logistics Center, Air Force Logistics Command, Kelly Air Force Base, Texas.
Schurman, D. L. Personal communication, September, 1993.
Schurman, D. L. Personal communication, March, 1994.
Spencer, F. Borgonovi, G., Schurman, D., & Smith, R. (1992). Proposed reliability assessment
for eddy current inspection of lap splice joints in airline maintenance and inspection facilities.
Final draft report prepared for the FAA Technical Center, Atlantic City, New Jersey.
Summers, R. H. (1984). Nondestructive inspection: Improved capabilities of technicians: Final
Report. AFHRL-TP-83-63, Training Systems Division, Air Force Human Resources
Laboratory, Lowry Air Force Base, Colorado.
Thackray, R. I., Bailey, J. P., & Touchstone, R. M. (1977). Physiological, subjective, and
performance correlates of reported boredom and monotony while performing a simulated radar
control task. In R. R. Mackie (Ed.), Vigilance: Theory, Operational Performance, and
Physiological Correlates. New York: Plenum.
Thackray, R. I., Jones, K. N., & Touchstone, R. M. (1973). Self-estimates of distractibility as
related to performance decrement on a task requiring sustained attention. Ergonomics, 16,
141-152.
Thackray, R. I. & Touchstone, R. M. (1991). Effects of monitoring under high and low taskload
on detection of flashing and coloured radar targets. Ergonomics, 34, 1065-1081.
Wang, M. J. & Drury, C. G. (1989). A method of evaluating inspector's performance differences
and job requirements. Applied Ergonomics, 20.3, 181-190.
Wiener, E. L. (1975). Individual and group differences in inspection. In C. G. Drury & J. G.
Fox (Eds.), Human reliability and quality control. New York: Taylor & Francis.
Wiener, E. L. (1984). Vigilance and inspection: In J. S. Warm (Ed.), Sustained attention in
human performance. New York: John Wiley, 1984.
CHAPTER EIGHT
RESULTS OF THE ENVIRONMENTAL CONTROL
SYSTEM TUTOR EXPERIMENT AT CLAYTON STATE
COLLEGE
Michael Pearce
Galaxy Scientific Corporation
William Beyer
Department of Aviation Maintenance Technology
Clayton State College
8.0 INTRODUCTION
The study described in this paper investigates the effect of an Intelligent Help Agent (IHA) on
the effectiveness of computer-based training. The experiment was conducted February 16-17,
1993, at the Aviation Maintenance Technology Department of Clayton State College in Morrow,
Georgia. Subjects used the Environmental Control System Tutor, a simulation-based trainer,
either with or without an error-driven IHA. There was no significant difference in overall
performance between the two groups; 80% of all subjects made two or less errors diagnosing ten
system malfunctions.
8.1 ENVIRONMENTAL CONTROL SYSTEM OVERVIEW
All modern airliners use the Environmental Control System (ECS) to control the aircraft's air
pressure and temperature. The ECS Tutor simulates an ECS with three control and display
panels in the cockpit, electronic modules in the avionics bay, and two cooling packs in the
fuselage. The ECS is a complex system. Electrical, mechanical, and airflow subsystems interact
to provide cool, pressurized air to the cabin and cockpit. We chose the ECS as the training
domain for the tutor because it is fairly similar across airliner types: ECS training would not be
specific to one airliner. Built-In Test Equipment (BITE) makes the technician's job easier since it
tests some components with the push of a button. However, BITE does not test all ECS'
components. A technician must know when and how to use external test equipment to isolate
malfunctions.
8.1.1 The Aviation Maintenance Technician
Aviation Maintenance Technicians (AMTs) must quickly diagnose and repair malfunctions on
the aircraft they are certified to work on. AMTs must know about the systems of several types
and models of aircraft. Their task is time-constrained since there is about 40 minutes between a
flight's landing and takeoff. Since some repairs require more than 40 minutes, AMTs must find
the faults quickly if they are to minimize delays in the flight schedules.
It is standard procedure for AMTs to use the Fault Isolation Manual (FIM), a logic tree used to
diagnose malfunctions. AMTs follow the FIM's "branches" based on outcomes of their tests and
inspections. The FIM specifies a "minimal path" of actions necessary to repair a failure, from a
high-level description of the malfunction to the malfunctioning component. Since it is sometimes
possible to diagnose malfunctions with a single test (for example, by operating the BITE), AMTs
do not always use the FIM.
8.1.2 Overview of ECS Tutor
The ECS Tutor is a intelligent tutoring system (ITS) that allows AMTs to improve their
diagnostic skills through simulated ECS' malfunctions of the Boeing 767. The ECS Tutor
contains a deep-simulation ECS model that allows users to see the consequences their actions
have on the simulated ECS. Users can change the switch settings and observe values of various
system parameters. The tutor is also highly graphical, allowing direct manipulation of ECS'
components, and contains realistic pictures and animation of system components and schematics.
Figure 8.1 is a sample screen from the ECS Tutor.
The tutor allows four types of actions on ECS components: operating, inspecting, testing, and
replacing. In operating ECS equipment, a user, for example, can change the switch settings for
the cockpit control panels. Inspecting a component includes reading display values on control
equipment or looking for visible failures in pack components. Testing differs from inspection
because an AMT has to perform some action; usually, it is to operate some internal or external
test equipment. One example of testing occurs when an AMT tests the pack controller by
operating the BITE. Replacing allows users to swap out Line Replaceable Units (LRUs) with
working components.
Figure 8.1 Sample screen from the ECS Tutor
8.1.3 Knowledge for Diagnosis
An AMT needs several types of knowledge to diagnose malfunctions. The ECS Tutor contains
knowledge about principles, systems, components, and procedures. Principles can be either
physical laws governing the behavior of systems or rules-of-thumb useful for diagnosing
malfunctions. Systems are groups of connected components that interact to perform some
function; a system can contain other subsystems. A component is a elementary part of a system
that transforms material or energy. Finally, procedures are lists of actions performed to achieve a
goal. For example, the troubleshooting steps a FIM explicate procedures for certain tasks.
Knowledge types differ in their levels of abstraction. Principles, the most abstract, apply to many
situations but may be difficult to apply to a specific situation. Procedures, the most concrete, are
used only in specific situations.
8.1.4 Intelligent Help Agent of the ECS Tutor
The ECS Tutor offers two ways for a user to get help. First, a user can ask for help by clicking
on one of the five help buttons on the bottom left side of the screen. This help is continually
available while the user is troubleshooting a malfunction. Four buttons providing help
correspond to the four types of knowledge used in troubleshooting, and one button explains how
to operate the tutor. The five help buttons are described in Table 8.1.
Second, a user gets help when he or she makes mistakes. The ECS Tutor contains a qualitative
model of ECS' components. The ECS Tutor's IHA can compare a user's actions with the model to
determine if the user is making progress toward a solution. If the user performs an action that
does not make sense, e.g., replacing a component that is working correctly, the IHA offers the
user some help. The type of help offered depends on several factors, including the following:
•
the type of error the user made
•
the instructional strategy the tutor is using
•
the number and type of mistakes the user previously made
•
the threshold for offering help when users make mistakes.
Table 8.1 Types of help available in the ECS Tutor
Button
Help Type
Purpose of Help
FIM
Procedures
Standard procedures for troubleshooting malfunctions
This Part
Component
Description of the components and their subcomponents
Systems
Systems
Schematic of either the ECS' control or pack systems
Advice
Principles
Suggestion of what to do next
How To
Operation
General help with using the tutor
When a user make a mistake, the tutor offers help that the user can either ignore or view. The
type of help offered will be one of the four knowledge types described above: principles,
systems, components, or procedures. Figure 8.2 offers an example of a principle. It shows a
generalized electrical control circuit and describes the "backtrack" and "divide and conquer"
strategies for troubleshooting electrical circuits. The user can click on a component to see how
the system behaves when that component malfunctions.
.
Figure 8.2 Example of a Principle
8.2 PURPOSES OF THE EXPERIMENT
One goal of our research is to evaluate the effectiveness of ITS technology as applied to AMT
training. We produced the ECS Tutor, an ITS that teaches troubleshooting skills in the context
of aviation maintenance. The research conducted so far has included several usability studies and
a small-scale evaluation (Pearce 1993a, Pearce 1993b).
The experiment described in this paper was designed to determine the effectiveness of an IHA in
a computer-based training system. Although much research has addressed designing and
implementing ITSs, little has evaluated ITS' effectiveness in a classroom setting. Researchers
often assume that adding intelligence to a computer-based training system will automatically
improve students' performance. Our experiment was specifically designed to allow quantitative
measurement of an IHA's effect.
We also wanted to determine which ITS issues are important for AMT training. Although many
issues are similar to those of other instructional settings, there are also specific aviation
maintenance issues. For example, the availability of BITE in newer commercial aircraft requires
the technician to understand the abilities and limitations of such equipment. By observing
students using the ECS Tutor in an aviation maintenance classroom setting, we examined how
they use the software to learn about troubleshooting. Data from these observations were used to
discern instructional, implementation, and pragmatic issues related to using the software in an
aviation maintenance classroom setting.
8.3 METHOD
The experiment was designed primarily to determine the effect of including an IHA in a CBT
program. We measured the performance difference between students using a tutor with an IHA
and students using a tutor without an IHA. The two ECS Tutor versions were identical except for
availability of an IHA. Therefore, students in both experimental groups could ask for help by
clicking on one of the help buttons, but students in the "without IHA" group did not get help
when they made mistakes. The subjects were not told that there were two ITS programs, and
none notified the experimenters of any difference between the two versions of the tutor.
8.3.1 Subjects
The subjects consisted of 15 A&P students in the Aviation Maintenance Technology Department
of Clayton State College. All subjects were enrolled in the Winter 1993 course "Cabin
Atmosphere" (AVMT203) and had been at Clayton State College for at least one year. The
"Cabin Atmosphere" course covers operation of the DC-9's ECS, which is less complicated
(because of the limited use of electronic control) than the B-767's ECS. Before participating in
the experiment, subjects had spent approximately seven hours of class time learning about the
DC-9's ECS. No subject had worked on the Boeing 767's ECS, or seen the ECS Tutor before the
experiment. No subject had used a FIM to troubleshoot aircraft malfunctions. The subjects'
computer experience ranged from none to 3 years. As shown in Figure 8.3, a poll given after the
tutor usage portion of the experiment indicated that while more than 80% of the subjects had
used a computer before the experiment, only about 20% had previously used a CBT system.
Figure 8.3 Computer Experience
8.3.2 Procedure
Subjects were randomly assigned to one of the two experimental groups. The experiment was
divided into three phases: introductory lesson, tutor usage, and testing (Figure 8.4) conducted
over two days. On the first day, all of the subjects participated in an introductory lesson covering
general B-767 ECS operation; ECS modes of operation; and functions of the ECS sensors,
valves, and electronics. The introduction covered material needed by the subjects to troubleshoot
malfunctions, including how to use the FIM for the B-767's ECS. Since some subjects had not
used a computer with a mouse before this experiment, the introduction also covered how to use
the mouse and a graphical user interface. The course instructor conducted the introductory
lesson, describing the ECS Tutor by projecting it on an overhead screen and then explaining the
various buttons and how to use the program. All subjects went through this two-hour
introductory lesson before participating in the troubleshooting portion of the experiment.
Figure 8.4 Experiment Design
On the experiment's second day, the researchers randomly split the subjects into a "with IHA"
group and a "without IHA" group for the troubleshooting portion of the experiment. The subjects
used the ECS Tutor on the school's training computers. Seven subjects used the ECS Tutor with
the IHA operational, and the remaining eight subjects had computers with the IHA turned off.
Help control was internal to the tutor, so there was no way to distinguish the two configurations,
and none of the subjects said that they noticed a difference. The subjects were allowed to finish
the simulated malfunctions at their own pace and were given a poll after they had finished.
8.3.3 Data
Two types of data were collected: traces of the subjects' actions and a poll the subjects completed
after finishing all simulated malfunctions. Each tutor had a mechanism for tracking each action a
user performed, including the following:
•
Going to a program screen
•
Inspecting/testing/replacing a component
•
Asking for help
•
Accepting or rejecting help when offered.
Along with recording each action, the tutor tracked the components that the user acted on and the
time. This data allows the researchers to recreate how each subject used the tutor and to
determine if subjects had any problems in using the tutor. The data from the traces for the last
problem was lost on some computers, so the researchers analyzed only the data for the first 9 of
10 problems.
The researchers collected users' opinions about the ECS Tutor by using a short poll. We also
administered a background poll to determine the distribution of skill levels for computer use and
ECS maintenance. After subjects finished the simulation and polls, we asked them to write any
impressions or observations they had concerning the tutor.
8.4 RESULTS
This section is divided into a trace analysis section covering analysis of profiles of how subjects
used the tutor, a poll results section describing the poll results, and a post-experiment comments
section discussing remarks subjects wrote on the poll forms.
8.4.1 Trace Analysis
A trace was kept for each malfunction problem the subjects worked on. The trace consisted of
records that described the following:
•
the action the user performed, e.g., an inspection of a component
•
the component that was acted on, e.g., the cockpit ECS control panel
•
whether this action was an error; if so, of what type, e.g., a procedural error
•
the time that the action was performed.
From this data, the researchers could recreate a user's responses to the ECS Tutor. More
importantly, we could infer some things about the user's mental processes. For example, if a user
completed a problem in a short time relative to other users' performance, we would infer that the
user has some knowledge about troubleshooting the ECS. If the trace indicated that a user
referred to the FIM during the simulation, we would infer that the subject used procedures
describing how to use the FIM. On the other hand, if a subject did not use the FIM all during
troubleshooting, we would infer that the subject knew how to apply troubleshooting principles to
the ECS configuration. The IHA performs similar inferences when it analyzes a user's actions
and calculates when to give help and what type of help to give.
From the raw tutor usage data, we collected data to measure subjects' performance: the time they
needed to solve a problem and the number of unnecessary part replacements. All data analyses
are either are either calculations of time subjects needed to perform an action or counts of the
number of times subjects performed a particular action (operate, inspect, test, or replace).
Although not done in this experiment, another type of data analysis would be to look at patterns
in the way subjects used the ECS Tutor. Such patterns could be measures of how quickly a user
narrowed down the possibilities of component failures or how long a user continued to work on a
problem after it was successfully solved.
A statistical analysis of the data did not indicate any significant difference in performance
between the two experimental groups. The types of analysis performed on the data traces and the
average values for the two groups are shown in Table 8.2.
Table 8.2 Average performance measures from the experiment
Measure
With IHA Without IHA
Time needed to solve a problem (secs.)
377
423
Problems completed (of the first 9)
8.7
8.8
Unnecessary part replacements
2.1
2.9
Component inspections per problem
6.7
10.4
Component tests per problem
62.4
62.6
Page navigations
122
120
Times help was asked for
0.4
4.8
Times the FIM was used
37
27
As shown in the performance measures, there was little difference between the two groups. The
last two measures seem to be statistically significant and require some explanation. The count of
the number of times that a subject asked for help by clicking on one of the help buttons is much
higher for the group without the IHA. This is because two subjects in this group each asked for
help 18 times, thus skewing the average. (These two subjects were sitting next to each other but
requested help mostly on different problems.) Of the other subjects in the non-IHA group, two
asked for help only one time each, and the remaining four subjects did not request any help.
Figure 8.5 is a graph presenting the average group time the two groups took to complete each of
the problems. Although the graph does not indicate whether the problem was solved correctly,
only four problems of the total 150 were solved incorrectly. This data and other analyses show
that the majority of students had little problem solving the problems. As would be expected, the
first few problems took the longest, since the students were getting familiar with using the ECS
Tutor. Similarly, for the measure of the number of times the FIM was used, two subjects in the
non-IHA group did not use the FIM at all to solve the problems, thus pulling down the average.
While the first anomaly in the data was probably due to personal cognitive styles, the second
anomaly was most likely the result of a misunderstanding of the tutor's features.
Figure 8.5 Average Group Time to Complete Each Problem
8.4.2 Poll Results
The poll contained nineteen questions about various aspects of the tutor. Questions were either
general questions dealing with the tutor's usability and general behavior of the tutor or questions
about several of the tutor's features of the tutor. Subjects were asked to rate their agreement with
each statement, using the scale "agree strongly," "agree," "no opinion," "disagree," and "disagree
strongly." The questions were equally mixed between positively and negatively phrased
sentences. Figure 8.6 shows the distribution of responses for the subjects in the individual-use
group.
1. The system commands are easy to use.
2. I feel competent with the system commands.
3. When I get an error message, it is not helpful in identifying the problem.
4. There are too many options and special cases.
5. The tutor behaved in ways that I didn’t expect.
6. I have trouble remembering the commands and options.
7. The system was not intimidating, I felt comfortable using it.
8. I often knew what to do, but I didn’t know how to do it.
9. The “hints” that suggested parts to test or replace were useful.
10. The help buttons provided useful information in solving the problems.
11. The lesson introductions/reviews helped me understand the malfunctions.
12. I did not know what to do after replacing a component.
13. The “Info” bar at the bottom of screen helped me understand the system.
14. The FIM tree was easy to use and helped in solving problems.
15. I could not tell what the pictures of ECS parts were supposed to be.
16. The computer’s mouse was easy to use.
17. The computer was slow in responding to my choices.
18. The feedback at the end helped me to understand the malfunctions.
19. The tutor was too complicated and I was never sure what to do.
Figure 8.6 Distribution of Poll Responses
Overall, subjects' satisfaction with the tutor was high. No statistic for any of the nineteen
questions indicated any weak points in the ECS Tutor. There were only two questions for which
responses were not closely clustered. Question 9 asked if hints the tutor provided were useful;
responses were spread between "strongly agree" and "no opinion." Question 15 concerned the
resolution of the tutor's component pictures; responses were also more varied than for other
questions. This issue is discussed in Sections 8.4.3.2 and 8.5.4.
These results can be compared with those from an earlier study done at Clayton State College. In
the earlier study, the first fifteen questions of the poll used in this experiment were given to six
subjects at Clayton State after they had solved two malfunction problems (Pearce 1993a). A
comparison between the two evaluations indicates a more positive response to the current
version of the ECS Tutor. This increased acceptance is most likely due to changes made in
response to problems users pointed out in the early usability studies.
8.4.3 Post-Experiment Comments
The poll asked subjects to write down any comments not covered by the multiple choice
questions. Only four subjects (of fifteen total) responded to this section. Table 8.3 lists all of the
subjects' written comments.
After the experiment was finished, several subjects told the instructor that their biggest problem
using the ECS Tutor was to decide how much time to spend on each problem. Even though
subjects knew that there were ten troubleshooting problems, the tutor gave no indication of how
much time each problem should take. Some subjects rushed through the problems without
spending much time to think about their actions. This comment and the written comments
highlight several important issues that the researchers discovered during the evaluation.
Table 8.3 Written comments from the poll
1.
Good training tool! I like it.
2.
With more experience on the computer, the problems would have been easy to
complete.
3.
[I could not tell what the pictures of ECS parts were supposed to be]
malfunctioned (damaged) HX was confused with dirty HX.
4.
[I could not tell what the pictures of ECS parts were supposed to be] in the case of
the heat exchanger problem.
8.4.3.1 Problems with Limited Computer Experience
Although there was only one written comment concerning confusion over how to use the ECS
Tutor (number 2), the researchers observed that several subjects took more time than others to
"become comfortable" with using the tutor. The subject who made the comment indicated that he
had never used any type of computer before. It is understandable that it takes some time to
acquire the hand/eye coordination necessary to use a mouse. The researchers did not have these
problems in an earlier evaluation using computers with touchscreens.
8.4.3.2 Problems with Graphics Resolution
Subjects did not have problems understanding what was being displayed in the majority of the
tutor graphics. However, as noted in comments 3 and 4, a graphic of one of the heat exchangers
(HXs) caused some confusion for some subjects. The problem required the subject to determine
if the HX was dirty and clogged. Since the tutor was designed to work on standard
PC-compatible hardware, graphics were limited to 16 colors. This was not an issue for most of
the equipment in the ECS Tutor, since the features that indicated the state of the components
were well-defined. However, a clogged HX requires close inspection for dirt and other foreign
objects and could not be adequately represented with the resolution used during the experiment.
8.4.3.3 Estimating Time Allocation
The ECS Tutor gives a user feedback on his or her performance on completed problems and also
tells him or her how many problems are left in the current lesson. However, it does not estimate
the time required to solve the remaining problems. Several students rushed through problems
because they were concerned that they might run out of time. This problem of allocating time
between problems is more pronounced in training than on the job. This arises in a simulated
training environment, but not in actual job performance, because of "compressed time" a
simulated environment presents to a user solving problems.
8.5 IMPLICATIONS AND RECOMMENDATIONS
This section covers the issues discovered during the ECS Tutor evaluation at Clayton State
College and makes recommendations for future ITSs for AMT training.
8.5.1 Use of Intelligent Help
Before this experiment, the researchers expected that the ITS' intelligent help component would
improve subjects' troubleshooting performance. This expectation was based on the assumption
that giving a subject more information and feedback would help him or her perform a
troubleshooting task. However, a statistical analysis of the data did not confirm this expectation,
and the researchers found no statistically significant difference in the two groups' performance.
There are several possible explanations for this finding. Because of the small sample size
involved in the experiment, individual differences were important in determining the average
performance of the groups. An experiment with a larger sample size may find a significant
difference in performance between the two groups.
Also, it may be that the troubleshooting task was not difficult enough for the intelligent help
component to play a part in determining performance. The traces of tutor usage indicated that
only four of the 150 problems (fifteen subjects with ten problems each) were not completed
correctly. Of these four problems, there were two uncompleted problems in each group. No
subject had more than one incomplete problem. These results may have been due to the large
amount of help available to the subjects during troubleshooting. For an ITS to be effective, the
problems have to be sufficiently hard for the users to make mistakes.
8.5.2 Ensuring Adequate Background Knowledge
The previous point highlights the importance of adequate background knowledge for
troubleshooting performance. The students were given a thorough introduction to ECS
configuration, function, and behavior and did not have to "hunt" for this information while using
the tutor. If the students had not been given such an in-depth introduction, it is likely that
error-driven help would have been activated more often and would have improved the
performance of the subjects in the "with IHA" group.
Although most subjects did not use the intelligent help component, the three subjects who made
enough mistakes to activate the IHA improved their performance as they gained experience in
solving problems. There was a wide range in problem-solving times for the first few problems,
but a much smaller range for the last few problems. Some of this variability is probably due to
differences in computer experience, but other data indicate that at least some performance
improvement was due to troubleshooting skills. For example, the number of unnecessary
component replacements (the most expensive action in terms of time and money) was fairly
constant as the students solved problems, even though the last few problems were more difficult
than the first few. Subjects did not make increasingly more mistakes as the problems became
harder; this result would indicate that they were improving their troubleshooting performance.
8.5.3 Usability of the ECS Tutor
Results of the post-experiment poll indicate that subjects had few problems using the ECS Tutor.
No problems previously pointed out were raised during this experiment because feedback from
previous usability studies led to improvements in the tutor's interface. For example, in the first
Clayton State usability study, several subjects were confused by the "radio button" control on
one of the screens used to select between the tutor's two modes of operation. Radio buttons are
commonly used in software with graphical user interface. However, subjects who have not used
such computers frequently do not understand what the radio buttons do until they have been
explained. Rather than have the instructor explain radio buttons, it was easier to replace them
with graphical toggle switches that the target audience easily recognizes and understands.
A user of a CBT program should be concentrating on the task, not on the actions required to
operate the interface. It is important that the interface be as "transparent" as possible. When a
user has to struggle to learn how to use a CBT program, it is unlikely that he or she will be able
to solve the target problem or, more importantly, to remember what he or she did during the
training session. Because we integrated the results of usability studies and user feedback, we
minimized the problems subjects had in using the ECS Tutor.
8.5.4 Graphical Resolution
In designing the ECS Tutor, there was a tradeoff between providing high-quality graphics and
producing a program that could function on a large number of computers. Because the number of
computers in the aviation industry that support high-resolution graphics is small, it would make
little sense to require that the tutor work only on high-end computers. The ECS Tutor was
designed to work in the standard VGA mode common on most business computers. Standard
VGA mode only supports 16 colors and is fine for displaying drawings and line art, but not good
for displaying recognizable photographs.
For the most part, subjects had little problem recognizing or understanding the systems and
components presented in ECS tutor pictures. Because the tutor concentrated on high-level
cognitive skills (troubleshooting) instead of low-level psychomotor skills (recognition,
coordination), few of the tasks required high-resolution graphics. However, in the case of the
heat exchanger (HX), subjects had recognize that the HX in the picture was damaged. The user
must be able to see fine irregularities in the component's structure, and it is difficult to show such
damage with a small number of display colors.
There are several ways to address the problem of limited computer display resolution. Since
recognition is not a major training goal of ECS Tutor, it is possible to add a text label saying that
there is damage to the component being shown. This solution applies wherever damage
recognition is not a problem with real components, as in the case of physical damage to a part.
However, for cases where recognition is an important part of the task being taught, it is
necessary to use higher-resolution graphics of the components with high-resolution computer
monitors or, when fine detail is required, through a computer-controlled videodisk.
8.5.5 Providing Adequate Feedback
Because the purpose of a training system is to improve performance in terms of time, accuracy,
cost savings, etc., for a particular task, it should be able to tell a user how well he or she is
performing, and how well he or she is expected to perform. This feedback is needed so that the
student can
•
regulate performance
•
make decisions about the need for further practice.
The ECS Tutor's IHA exists in part to support the second purpose; it tells a user when he or she
makes diagnostic reasoning errors. The tutor provides feedback for performance regulation by
telling users how many problems remain in each lesson and also approximately how much time
their actions would take were they actually repairing an ECS. However, ECS Tutor does not
estimate how much time a user should spend on each problem. Some subjects commented that
they rushed through the problems and made mistakes they would not have made had they
stopped to think about their actions.
Subjects' post-experiment comments point to the importance of providing users with adequate
feedback. A training system should give adequate feedback to users and should also provide an
estimate of how much time to spend on remaining problems. The consequences of not providing
adequate feedback include users who do not learn that they do not understand something about a
system and users who operate the training system improperly and do not learn what was
intended. On the other hand, it is important that users not be given too much information while
they are using an ITS because of problems of learning transfer from simple training tasks to
complex real world tasks.
Improved feedback in the ECS Tutor would be helpful to future users. This could be done by
providing an conservative estimate of how much time each problem should take (based on the
user's computer experience) and providing a clock counting the actual time. The feedback screen
should be designed so that the user does not confuse the real time with the simulated time. Since
the user is learning how to troubleshoot, feedback should stress accuracy over speed until the
user has learned enough to diagnose faults quickly. Several users also suggested that an
"estimated cost" evaluation be added to the performance measures so that the student can learn
about the costs of poor troubleshooting, e.g., replacing working parts.
8.6 CONCLUSION
One goal of this experiment was to measure the effectiveness of the ECS Tutor's Intelligent Help
Agent (IHA). Our evaluation of the data did not find any statistically significant difference in
performance between users with or without the IHA. The most likely explanation for this result
is the small number of mistakes subjects made during the experiment. Because the IHA is errordriven, it was not activated enough to have a significant effect on subjects' performance. If the
diagnostic task had been made more difficult (for example, by removing the FIM from the tutor),
then the IHA would probably have had a more significant impact on subjects' performance.
The results of the experiment, data from the poll, and researchers' observations of the subjects
point to significant issues for applying ITS to aviation maintenance training. The most
significant outcome of this study is that the use of an IHA in a computer training system should
be planned in the context of the rest of the training system. For example, subjects may not use an
IHA if the task is too simple or if there are job aids decreasing the number of mistakes. Another
finding is that subjects need adequate background knowledge both for the training task and the
training software before they begin using the training software.
Results of the polls given during the experiment indicate that the ECS Tutor has evolved into a
user-friendly training system. Through repeated usability studies with AMTs, we have been able
to identify problems in the user interface and to make improvements. We also discovered that
designers should consider the tradeoff between computer display resolution and system cost.
Choices should be made in the context of the training the ITS is intended to provide; the required
display resolution depends on how much picture detail is needed for adequate training. Finally,
our last finding was that adequate, but not excessive, feedback maximizes the quality of training
an ITS provides. Feedback should include how much time the student should spend on each
problem and how well the student has solved the problems in terms of mistakes, simulated time,
and cost.
8.7 References
Pearce, M., "Advanced Technology Training for Aviation Maintenance: An Evaluation,"
Human Factors in Aviation Maintenance - Phase Two Progress Report, Federal Aviation
Administration, DOT/FAA/AM-93/5, 1993, pp. 9-17.
Pearce, M., "Results of the Environmental Control System Tutor Experiment," Human
Factors in Aviation Maintenance - Phase Three, Volume 1 Progress Report, Federal
Aviation Administration, DOT/FAA/AM-93/15, August 1993, pp. 5-23.
CHAPTER NINE
RELIABILITY IN AIRCRAFT INSPECTION: UK AND
USA PERSPECTIVES
Dr. Colin G. Drury
State University of New York, Buffalo, USA
Department of Industrial Engineering
Dr. M. W. B. Lock
Cranfield Institute, UK
9.0 ABSTRACT
In response to recent concerns about the reliability of aircraft inspection and maintenance
procedures, the CAA and the FAA have been investigating human factors issues. Two
investigators who had separately studied human factors in civil aircraft inspection undertook to
study each others' jurisdictions to compare techniques and problems in the USA and UK.
Aircraft inspection sites were visited jointly and separately in both countries, with an analysis
made of the overall inspection/maintenance system and of larger floor operations.
The overall conclusion was that similarities were more common than differences due to the
technical specification of the tasks, the regulatory similarities and the skill and motivation of
inspectors. Differences between companies outweighed jurisdictional differences in many areas,
suggesting that a common policy can be followed to improve such areas as visual inspection
lighting, physical access to inspected areas, and the informational environment.
Larger differences were observed in the areas of work organisation and nondestructive testing
(NDT), with sharing of experiences in both areas being possible for improved inspection
reliability.
In the UK, the inspectors and maintenance technicians were closely integrated in the formal
organisation, with inspectors often acting as supervisors for a maintenance team which
performed the repair. In the USA, a more formal division existed between inspection and
maintenance, with coordination usually through the supervisory levels. While both approaches
are viable, both need better support for integration and communications. Training is needed in
supervisory skills, as well as management structures and documentation which allow all
concerned to obtain the information necessary to successful task completion.
In NDT operations there was a difference in emphasis between the two countries, with the USA
more concerned with rule-based performance and the UK with knowledge-based. In addition,
inspectors in the USA were less likely to be NDT specialists, performing both NDT and visual
inspection, although changes are now occurring in this. Although both jurisdictions require both
operating modes at different times, this fact is not well recognised. Hence, the training and
documentary support for both levels is lacking, as is a clear indication of switching rules
between the two.
With the increasing internationalisation of the aircraft maintenance industry, accelerated by
well-publicised events with aging aircraft, differences may be expected to disappear over time.
However, this should be a controlled process leading to utilisation of the best features of
different jurisdictions if the full potential of inspectors within the system is to continue to be
realised.
9.1 OBJECTIVES
The first objective of this study was to combine into a single concise document material
collected jointly and separately by the investigators so as to highlight the similarities and
differences in aircraft inspection between the UK and the USA.
The second objective was to draw any conclusions which would allow the transfer of techniques
or information relating to human factors in aircraft inspection between the two systems to the
benefit of airworthiness.
9.2 BACKGROUND
The application of Human Factors techniques to aircraft inspection is relatively recent on both
sides of the Atlantic. A major 1981 UK study (Lock and Strutt, 1985) was not complemented by
equivalent work in the USA until after the interest in continuing airworthiness spurred by the
Aloha incident in 1988. Because of the commonality of interest in improving inspection
reliability in the two jurisdictions, the FAA and the CAA signed a Memorandum of Cooperation
in April 1990 to cover joint work in this field. This would build on the then-current human
factors work in both countries, as well as various studies of structural mechanics and flight loads.
Since that date, M. W. B. Lock and C. G. Drury have been co-operating specifically on cross
comparisons of USA and UK practice as part of their contract work with the FAA and CAA
respectively. The aim was to take two scientists who had studied aircraft inspection from a
practical viewpoint, but from different academic backgrounds, and have them jointly observe a
number of inspection operations in both countries in addition to their other contractual
observations. The disciplines of the two participants were complementary in that Dr. Lock is an
applied physicist with a particular expertise in Non Destructive Testing (NDT) while Dr. Drury
is a Human Factors (HF) engineer with a particular expertise in industrial inspection.
This report is intended to be complementary to the reports issued by the two participants
separately as part of their contract work. These other reports are listed in Section 9.6. In
particular, the site visit - based work described here is also referred to in the following reports:
1.Human Factors in Aviation Maintenance: Phase One Progress Report. FAA Office of
Aviation Medicine, September 1991
2.Inspection Reliability for Transport Aircraft Structures: A Three-Part Study: Part 1
Initial Investigations. CAA Paper 90003, April 1990
3.Inspection Reliability for Transport Aircraft Structures: A Three-Part Study: Part 2 The
Current Situation. CAA Draft Paper, May 1991
9.3 METHODOLOGY
A number of visits were undertaken by each participant in each country, either separately or
together. There was no attempt at comprehensive sampling; rather the knowledge of each
participant was used to select sites which would be illustrative of various features. For example,
in the UK visits were made to specialist third-party NDT companies which serviced civil
aviation as they represent a major source of NDT expertise utilised by some airlines.
At each site, the visit was divided into two sections, although these often overlapped in
coverage:
Systems Overview: First the management of the maintenance of the site was probed in
management interviews. The structure of the maintenance and inspection organisation(s) was
elicited during discussions with managers, shift supervisors, foremen, and often with staff who
were outside the line management structure. These could include training personnel, archive
keepers, work card preparers, planners, and so on depending upon the initial discussions with
management. The aim was to be able to write a short description of how the system should
operate, and the management philosophy behind this system structure and functioning.
Hangar-Floor Operations: Detailed observations of the practice of inspection, and its
organisational constraints, were made by following an inspector for all or part of a shift. As the
inspector progressed through a job, questions were asked concerning the inspection itself and
ancillary operations, such as spares availability from stores, or time availability for training.
Thus a reasonably complete task description and analysis could be written on the inspection task
itself, while obtaining information on the wider context of the inspector's job. This technique
also allowed the collection of anecdotal recollections of previous jobs, and other events from the
past. While these had an obviously lower evidence value than direct observation of task
performance, they did provide a valuable adjunct to the data collection process.
Sites visited included major air carriers, regional or second-level airlines, repair stations and
NDT companies. In addition visits were made to FAA and CAA personnel and to a Royal Air
Force base where maintenance and inspection procedures are written.
9.4 RESULTS AND DISCUSSION
In this section points of difference between the two systems will be described for a number of
areas judged by the authors to represent potentially transferable ideas. No attempt is made to
compare the legal framework in the two countries, as this information is rather well known to the
two regulatory bodies, and to most airline managements, often from direct international
experience. Rather, the experiences and evaluations of the participants will be stressed to
determine how the systems worked in practice.
When an area is presented, the points of similarity are discussed first, including any observations
on the relative variability between and within countries. Next, the different features of each
country's practice are presented. These sections establish the factual basis for evaluation and
discussion of the importance of differences, needs for improvement in both countries, and any
transferable features which could improve airworthiness. Conclusions from all of the areas are
brought together in the final section.
9.4.1 Maintenance/Inspection Responsibilities
Both countries: Maintenance and inspection tasks are separated in a similar manner in both US
and UK, both within the maintenance schedule and on the task cards at hangar floor level. Task
cards are individually assigned to either maintenance technicians or licensed inspectors. Defects
arising from the inspection, also termed non-routine repair (NRR), squawks or snags, are the
subject of further cards which are raised by the inspector and, after rectification, signed off, or
stamped off, by an inspector.
UK variations: The management structure of maintenance and inspection is usually closely
intermeshed. In the past it was sometimes the case that the engineering manager and the quality
control chief were the same person and, although this is not the case in large transport aircraft it
can still be the case in smaller commuter airlines. Work arising from an inspection can be
allocated to maintenance technicians by the inspector who is often also a supervisor, or by a
senior person who has responsibility for both inspection and maintenance. The inspector is
frequently consulted during the defect rectification, in some cases is the actual supervisor of that
work, and will usually be the person to accept the repair.
US variations: The management structure of maintenance and inspection is separated up to a
level well beyond the hangar floor. A wide variation of management authority was found
whereby either of maintenance and inspection, or even planning, could dominate (Taylor, 1990).
In a few companies visited there was provision for some coordination between the two, by an
engineer whose job was to ensure some cross talk. This person could also serve the function of
shift change co-ordinator.
Work arising from an inspection is often allocated by a maintenance supervisor so that the
inspector who raised the defect has no responsibility for defect rectification and may not be the
inspector who does the buy-back inspection. Some airlines have an inspector specifically
assigned to perform only buy-back inspections.
Evaluation: The separating of the management structure in the USA is dictated largely by the
existing Federal Aviation Requirements. The notion of the need for checks and balances as an
error reduction mechanism is deeply felt. At the hangar floor level the general view is that repair
and maintenance would suffer if the maintenance technician knew that certain inspectors were
'buying back' the work, as some are thought to be less stringent than others.
The general view in the UK was that the system of having the same inspector responsible
throughout for any particular defect and its rectification was preferable as the repair could be
monitored at appropriate stages ensuring that the job had been performed correctly.
In the event of an inspection resulting in a significant repair being necessary, the supervisors of
both maintenance and inspection confer with the inspector while, for a small item, the inspector
alone assumes responsibility. There must be a point at which the inspector has to decide which
of these two courses is correct, although supervisors on their own initiate a review of NNR cards
with inspectors. The decision might depend variously on safety, cost, time etc. but the crossover
point does not seem to have been well defined and was seen to vary considerably between
companies.
9.4.2 The Supervisor/Inspection Dichotomy
Both Countries: The supervision of the aircraft maintenance technician (AMT) or mechanic is of
primary importance. There is always the need for monitoring their output whether for quality or
quantity. The responsibility for this supervision varies both from operator to operator and from
country to country.
UK Variations: There is a tendency for the supervision to come largely from the inspectorate
side in UK. Indeed, in many companies each inspector will be wholly responsible for a small
team of mechanics and the jobs to which they are allocated. In any case it is common for the
mechanic to be in close contact with an inspector during a job, especially if it is a defect arising
from inspection.
US Variations: Due to the way that accountabilities are allocated, the American system divorces
the inspection and maintenance responsibilities at hangar level although some coordination is
still maintained. The system involves inspectors locating defects and raising the appropriate
paperwork as in the UK, but then the responsibility for the job becomes that of the maintenance
organisation and it is only after the repair is complete that the inspectorate are asked to re-inspect
the area and 'buy-back' the completed job.
Evaluation: While the reasons for, and technical consequences of, the separation of
responsibilities were covered in 1 (above), there are still issues of management and
communications which need addressing. First it should be noted that the standards of repair
deemed acceptable by the inspectors did not appear to differ between the two countries. An
aircraft was judged safe when it not only met the written standards but also when, as many
expressed it "the plane is safe enough for my family to fly in".
There are two sides to the question of whether the inspector should act as supervisor or have a
team of mechanics. One has to weigh the advantages of having close communication between
the inspector and mechanic against the continual interruption of the inspector's train of thought
caused by requests to check current situation of a repair or for further work. Some companies use
a leading hand (an long-experience mechanic) as an intermediary and in a large company, where
there is sufficient work, this seems a good alternative.
It is rare for an inspector/supervisor to have any personnel-management training beyond a couple
of days. The tasks to be communicated are frequently complex: the difficulty of scheduling and
supervising several different simultaneous maintenance activities and the communication skills
required to secure proper repairs should not be underestimated.
Not all tasks are straightforward or even repeats of those previously performed so that it will
probably be quicker and more accurate for the mechanic to be informed directly by the
inspector/supervisor than by documentation and a third party. However, freedom from the
supervisory role enables the inspector to assume the role of final arbiter at buy-back.
If the potential difficulty with the UK system is in ensuring an ability to lead as well as inspect,
the potential difficulty in the US system is with communication.
There is a need to communicate both within a single shift and across shifts between the
following groups:
Inspectors
Maintenance technicians
Inspection management
Maintenance management
Quality control
Planning
Some of this communication is written, for example, in job cards and NRRs, and some is verbal.
The quality of written NNRs had considerable variability between inspectors, between
companies and between countries. In the US, this assumes more importance as not only the
maintainer has to understand the NRR to carry out the (often complex) repair, but so must the
buy-back inspector to ensure that the original fault has indeed been eliminated. Little formal
training in written or verbal communication was seen. While formal coordinators were seen at
some companies, and other companies were small enough that direct communication was
inevitable, there is still a need for formal training of inspectors and maintenance technicians.
Inter-shift communications varied widely by company. Some had an informal talk between
equivalent supervisors at shift change, some had a written checklist, while one company had a
formal half-hour combined written report and tour of the on-going jobs by both supervisors. At
the individual inspector and mechanic level, shift change ranged from merely receiving the
supervisors' instructions to formal start-of-shift meetings. With many maintenance operations,
and even some inspection jobs, covering multiple shifts, systems are needed to ensure that the
complex communications required do indeed take place. It is vitally important that the incoming
shift have complete information on the status of each repair/inspection. A failure of such
information flow was recently cited as being causal in a recent accident in the USA.
9.4.3 Non Destructive Testing
Both Countries: The 1980's saw a large increase in the application of NDT to aircraft inspection
practises and this rise has been continued. The situation is largely manufacturer-driven so that a
similar situation exists in all maintenance/inspection shops.
In many applications, the bulk and weight of the NDT electronics box is such as to make
location of it within easy visual range, difficult. More use of secondary visual or aural devices is
required. Such devices are small repeater screens, LEDs on probes, and earphone systems
(especially where the tone changes with the size of the ultrasonic or eddy current parameter).
UK Variations: Training is currently based on the PCN (Personnel Certification in NDT) scheme
monitored by the British Institute of NDT and the industries it serves.
In the aircraft industry, training corresponds, in the main to PCN level 2, with the necessary
endorsements, which allows the inspector to perform NDT tasks and to define new methods
which are used subject to manufacturer's approval. Training to this level can be done in-house or
through a registered and certified establishment specific to aircraft NDT. This is followed by a
period of about 6 months on-the-job instruction.
A further grade, level 1, is also common which qualifies the technician to make go/nogo
decisions. This is mostly used for simple MPI or Dye Penetrant examinations in the workshops.
Some effort is being made to ensure that the signatories for the operator under BCAR A8-6 are
level 3, a supervisory grade.
US Variations: Here the reliance is on task-specific instruction, being a combination of teaching
the techniques and general on-the-job training although some organisations do require ASNT
level II certification. In essence, the training schedules and content are similar to the UK but
without the outside qualifying body. This has resulted in widely differing depth and duration of
the training. An especial example is that of impedance plane eddy current methods where
training periods from a few hours to several days were reported to the authors by inspectors. In
addition, airlines in the USA have typically had NDT as part of regular inspection duties, rather
than having a specialist NDT department or section. This situation is now changing to some
extent, with many operators establishing new NDT sections and others reverting back in some
instances. There are regulatory moves towards creating uniform and separate NDT
qualifications.
Evaluation: There are fundamental differences between visual and NDT inspection techniques.
Foremost is the extra time spent setting up and calibrating the equipment, and the actual
inspection can take considerably longer. Then there is the problem of validation of the
techniques (i.e. do they find the defects as designed and with what reliability) as well as with
confirming the actual defect found by NDT, which may take considerable maintenance time to
uncover for visual confirmation. Also, NDT is used at times to confirm the extent of a
visually-discovered crack.
Between the UK and USA are two major differences in philosophy, which can affect the practice
of NDT. First, the UK assumes a what could be classified (Rassmussen, 1984) as a
knowledge-based inspector, i.e. one who has a considerable depth of knowledge in the subject
and who is expected to use such knowledge relatively frequently to solve problems from first
principles. The USA inspector is more frequently expected to rely on rule-based reasoning,
using well-learned and (reasonably) well- documented IF-THEN rules to complete the
inspection. The distinction is one of emphasis rather than bifurcation, with the UK inspector
having reasonable rules and the USA inspector having reasonable knowledge, but the difference
does exist. Inspectors have to switch between these two levels of abstraction at appropriate
times. Thus, both forms must be adequately supported by the system, for example by training,
clear documentation, and explicit switching rules between the two. Both operating philosophies
can be expected to produce reliable results under ideal conditions, but each has its characteristic
errors. Knowledge-based reasoning is difficult to reproduce in different inspectors, and in the
same inspector at different times, whereas rule-based reasoning can lead to inappropriate
decisions if the situation does not exactly match the rules. One observation was made of an
inspector mis-calibrating an eddy current device by setting the frequency in Mhz rather than in
Khz, an error extremely unlikely for a knowledge-based inspector. Rule-based reasoning in
complex systems is often characterised as "brittle", while knowledge-based reasoning allows
more discretion, which can lead to errors when the reasoning, or the perception of the situation,
is false.
Second in the differences of consequence is the distinction between specialist NDT inspectors
and generalists, who perform NDT activities along with visual inspection when needed. The
generalist has a broader knowledge of the particular aircraft and its recent history such as
indications of wear or unexpected service conditions. Such an inspector is also able, and
expected, to use well-practised visual inspection skills to observe areas around the site of the
NDT inspection for other, non-NDT, indications. The specialist, on the other hand, can be
expected to be recently practised in the NDT technique required at that instant, and also to have
a broader and deeper knowledge of NDT methods as well as specific techniques. Such an
inspector will have less of a problem of skill maintenance under long periods of disuse, and thus
be less prone to the errors associated with lack of recent practice. A number of occasions were
observed where a generalist inspector had to seek help from others who had performed the
particular NDT inspection recently, as the instructions on the work card or in the manuals were
ambiguous.
9.4.4 Bonding
Both Countries: In both countries there is a projected lack of trained inspection staff: indeed of
all maintenance staff, (Shepherd, 1991). It is inevitable that there will be some movement of staff
from one operator to another; this happens in all industries and is quite acceptable. However on
occasions, when a new repair station is set up or an operator expands quickly, there have been as
many as 100 maintenance staff 'poached' in a short time.
In an effort to stop this, many companies have implemented policies of bonding in one form or
another. This usually takes the form of requiring personnel who are taking a training course to
sign a declaration to the effect that they will not leave the company for a period of time, or that if
they do they will repay a proportion of the training costs. The repayment is usually scaled from
the full cost immediately following qualification and reducing, on a sliding scale, to zero after
1-3 years.
UK Variations: Only one company visited had a current bonding policy and that only asked for
proportional repayments for lodging and travel etc. when they were on a course at another site.
No training costs were included even though these could be as high as £40k. In only one case
had this policy been implemented in recent memory and that involved the sum of under £2k.
Many other companies had such a policy and the main reason that they had abandoned it was
that legal advice suggested it to be untenable and 'binding in honour only'.
USA Variations: In the USA, bonding is the rule rather than the exception at the engineering
sites visited. In one company, staff were even bonded for a first-aid course.
Evaluation: In any industry a pool of skilled personnel is necessary. The time for inspectors to
reach fruition is longer than for most skilled technicians and they therefore have a rarity value.
It is reasonable that employers should want to protect their investment in time and money.
However, it is also reasonable that any person should be able to sell themselves freely in the
market place.
Due to legal uncertainties, especially in the UK, it may no longer be realistic to bond employees
but the industry needs a stable work-force. One solution offered to some industries in the UK
was the government-sponsored training boards. Here, there was some sharing of training costs
by an industry-wide levy which was redistributed to companies who provided training
themselves.
It would act as a deterrent for mass poaching if the operators had a common agreement; perhaps
not to have a general levy but to repay training costs if personnel changed employment. This
could be done on a reducing scale, as in the bonding agreements.
It would do several things:
1. It would compensate the previous employer to some extent, and not penalise employers
who run extensive training programs.
2. It would act as a deterrent to large poaching operations.
3. It would not prevent staff movement completely but would act as a brake on the recently
qualified who are, as far as the operator is concerned, an important investment.
4. Abuse of the mutual repayment system might be thought to be a potential problem but
withdrawal of cooperation when the abuser has an aircraft on the ground in need of parts
could allay that.
Several managers with hangar responsibility have responded to this suggestion positively and
said that they certainly consider paying compensation to get the right employee.
Job advertisements in the aeronautical press frequently mention bonding as one of the condition
of employment. In view of the legal situation this should be discontinued.
The most appropriate source of actions on the above suggestions would be the representative
groups such as IATA and ATA, rather than the regulatory bodies.
9.4.5 Working Times
Both Countries: Because of airline flight schedules being confined largely to daytime operations,
it follows that much regular inspection and maintenance activity involves night work. Inspection
in particular must precede maintenance in heavy checks, so that there is considerable pressure on
the inspection department to complete the incoming inspection in a timely manner. This is
usually achieved by a mixture of shift work and overtime.
UK Variations: In many maintenance organisations, shift work is allocated generally across the
organisation, with rotating shifts and moderate use of overtime and weekend work, although
inspectors still voice complaints about shift lengths and allocations.
US Variations: In many airline maintenance operations, shift work is allocated on the basis of
seniority. Thus the bulk of the socially-unpopular night work is given to junior inspectors.
Relatively high amounts of overtime are worked whenever an aircraft arrives for maintenance.
At some sites an additional problem was caused by the maintenance site being located in an area
whose housing costs are too high for maintenance and inspection employees, leading to long
commutes, usually by private automobile due to the lack of public transport at shift change
times.
Evaluation: Inspection work can involve constant alertness in the face of little stimulation, with
some use of complex decision making. Both of these activities show degraded performance
under conditions of sleep loss or disrupted schedules. To mitigate these effects despite a
continuing requirement for night operations requires the detailed application of human factors
knowledge relating to shift work (e.g., Schwarzenau et al, 1986). Shift workers rarely invert their
body rhythms, so that a frequently-rotating system is to be preferred to one with long blocks of
time on each shift. Because organisation of working time is so heavily influenced by social
needs, the system used should be a simple as possible for predictability. Obviously, spreading
night work over a larger population, rather than having some groups bid out of it, will minimise
the overall effects of shift work, and prevent the concentration of experience onto the day shift.
As with considerations of overtime, there are historical reasons for the current systems, so that
any change will not be easy in organisational terms.
The situation is exacerbated by the lack of unanimity amongst workers: some preferring 12 hour
shifts; others, night work etc. A solution involving rotating shifts or, at least, volunteering for the
generally less popular shifts and some form of flexi-time might be attempted although the
problems at shift-change could be too complex.
Overtime for inspectors is, in general, not a good idea from a strictly technical, human factors
viewpoint. Data from laboratory studies shows decreased detection abilities with prolonged
work, although degradation of decision performance in job operations is more difficult to
document. When combined with long commutes involving active driving, there are also
implications for worker safety at the end of an overtime period as well as for job performance.
9.4.6 Demand and Supply of Mechanics/Inspectors
Both Countries: The typical progression to inspector is from mechanic, so that the supply of
inspectors is largely dependent upon the survivorship function of mechanics. With the increased
demands for inspection, caused in part by aging aircraft (or continuing airworthiness)
considerations, both supply of new inspectors and loss of existing inspectors are critical issues
for the present and the future. Recent studies in the USA and Canada (Shepherd, 1991) have
documented that a crisis may soon be reached.
UK Variations: Here the tradition has been to apprentice a school-leaver to a company to learn
the job of mechanic, with CAA examinations and company examinations both being given at
regular intervals throughout the apprenticeship. When mechanics are certified, after a certain
time, and more training, they can be recertified as inspectors. Not all who are qualified are given
inspection jobs, depending upon current employment opportunities within that company. Other
ways of entry are via the services (RAF, Army, Navy), which accounts for a large proportion in
some fields (e.g., up to half of NDT inspectors), and occasionally from the shop mechanics.
Leaving is often to other airline companies (see Bonding above), but does occur to other
industries at times. Pay is considered to be poor, but rarely poor enough to cause a move. The
typical grumble is that the job status is not perceived highly outside the aircraft industry.
US Variations: Most mechanics attend an A&P School after leaving high school, to be trained at
their own expense for approximately two years. The output from these schools has a high
wastage (perhaps up to 50%) to other industries, such as automobile mechanic or dental
equipment technician. There is some recruiting from the services, but the numbers are too small
to provide a large fraction of inductees. At the same time, retirements are increasing due to
previous cycles of hiring and freezing. Over the next ten years there is predicted to be a severe
shortfall between the demand for mechanics and the supply, even with relatively optimistic
assumptions about recruiting, retention, and productivity.
Evaluation: Apprenticeship schemes are starting in the USA after a considerable lapse, and are
being revitalised in the UK after considerable recent neglect. Such schemes hold promise for
increased supply, as trainees are paid during training, and have a strong company identity after
certification. However, they represent a considerable cost outlay for the company; an outlay
which may not always be repaid (see Bonding above). Joint ventures between companies, high
schools and junior colleges have been tried with some success both in USA and Europe as a way
to expose more people to careers in aviation. Similar schemes between companies and A&P
schools are now under way, with results which appear to be encouraging. Low pay and poor
working conditions must also be addressed. Pay rates in the starting jobs are particularly low.
This is even more of a factor at the second-level companies, who are often considered as 'holding
areas' for staff by the major carriers, leading again to a high rate of leaving in the industry.
Working conditions such as shift work, dirt, confined spaces, and lack of amenities can be
changed only by action on many of the human factors points made in this and previous reports.
Such conditions are not acceptable in the current market place, and indeed would not be tolerated
by most of the office staff in many of the companies visited. If the mechanics who will become
the inspectors are to be recruited and retained in sufficient numbers to ensure continued safety,
the conditions will have to improve.
When inspectors rather than mechanics are considered, there are additional problems. If a
mechanic chooses to become an inspector he will move from the top of the seniority levels in
one group to the bottom in another. This often entails a reversion to an unpopular shift, and more
isolation from the management function (who are often concentrated on the day shifts), before
seniority in the new occupation is established. The inspectors studied for this report had all, by
definition, survived these problems. Maintaining adequate future supplies requires similar
studies of those who chose not to continue to inspector level.
The route into civilian inspection, especially for NDT, from a military background is
unnecessarily difficult. A joint committee on training would benefit both parties: morale would
be boosted for those in a service environment and the civilian sector could have a ready supply
of personnel who would only need training in the company system.
9.4.7 Visual inspection and eye tests
Both Countries: Conditions for visual inspection varied greatly from operator to operator with a
similar variation of the good, the bad and the ugly in each country.
The provision of lighting varied widely with respect to both hangar fixtures and portable sources.
Provision for ensuring that an inspector could actually see differed widely.
UK Variations: No mandatory eyesight test is required for visual inspectors except as part of the
medical examination when entering the company. The situation varied from greatly from regular
two-yearly tests to none at all. There seems a great reluctance for operators to finance this
programme. NDT specialist inspectors are better served with mandatory examination being part
of the annual requirement.
US Variations: All inspectors have regular eye tests (??as part of the FAA requirement??).
Particular vision standards are defined, e.g., 20/25 Snellen (near) and 20/30 (distance). Colour
vision is handled as part of the physical requirements.
Operators generally finance these tests either in their own medical centres or out-of-house.
Evaluation: Lighting within the hangar together with supplementary sources on docking and
independent stands is usually sufficient to allow inspection of the outer surfaces of the aircraft.
However these lights are frequently bright point sources which also reflect off the bare r painted
metal surfaces of the aircraft. If an inspector glances at these, a mild form of arc eye may result
from the direct or reflected glare. This degrades the acuity of vision and can take several minutes
to revert to normal. Inspection quality during this time is greatly reduced. A greater number of
less bright sources such as daylight fluorescents is recommended.
It must be a universal requirement for an inspector to be able to see. Without regular testing, the
inspector may easily drift into inadequate vision. Gradual receding of the in-focus plane is all
part of the aging process. An elementary test in the UK, (Lock & Strutt, 1985) showed there to
be little or no correlation between the distance at which typescript could be read and whether an
inspector had had a recent eye test or whether he wore glasses.
There is a reluctance on the part of the operator to declare an inspector unfit to continue
inspection duties on the grounds of failing eyesight whereas they would not hesitate if the
inspector was otherwise medically unfit.
9.4.8 Reporting imminent indications
Both Countries: (This is not an area where there are transatlantic differences but, if taken up it
might have implications in both the UK and the USA.) During much inspection work there are
occasions when some indication of a possible defect is seen. For visual inspection this is not easy
to exemplify, but may take the form of incipient corrosion or slight rubbing. In NDT such an
indication is much easier to define. Most techniques have a calibration step which sets a
standard for defect reporting. In ultrasonics, for instance, this may be the height of the
oscilloscope signal or simply a measured skin thickness. There is usually a substantial difference
in these reportable indications and the perfect component or material appearance, in the visual
case, or the background electronic noise for ultrasonics or eddy currents etc.
Evaluation: It would not take a great deal of effort for the inspector to make an official note of
such a sub-reportable indication so that it could be appended to the task card on the next
inspection check.
With the solid establishment of computer-enhanced task card preparation, this should present
few problems. Corrosion initiation points might be detected early and the system would also
provide a useful source of fracture mechanics data if, on a subsequent inspection, a crack were
found.
Operators could utilise this information on all their aircraft and, if it proved useful in early
identification of future trouble, it might be even be made a fleet-wide index. For any form of
human inspection, feedforward information such as previously-reported sub-threshold defects,
can substantially improve defect detection performance (Prabhu and Drury, 1991).
9.4.9 Work Cards, Information and Automation
Both Countries: The Work Card (also called Job Card or Task Card) is the primary command
document for any inspection task. It is also the primary record of work performed, being signed
and dated by the inspector and used as a reference for all Non Routine Repair (NRR) cards
raised during its execution. As such, it must be well designed from the inspectors perspective if it
is to be used without error. In both countries, many types of card were seen, with differing
degrees of user-friendliness, and with differing levels of automation. Also the integration of the
work card with other tools used by the inspector varied widely. Further information on the
shortcomings of many work card systems can be found in Drury, Gramopadhye, and Prabhu,
1991 (see Appendix I). Hence specific instances are selected from our observations to show how
improvements may be possible, rather than contrasting systems between countries.
UK Variations: One airline visited had a computer assisted method of job control and defect
reporting which was of general interest. Work Cards had bar codes attached, as did inspectors
badges. Thus to register that a job has started, the inspector swipes the bar code reader across the
Work Card and across his badge. Then after inspection is completed, all defects arising are
entered with a swipe of the work card, a swipe of the badge, and swipes of each of a set of defect
bar codes located beside the reader. These defect bar codes have names and illustrations of the
possible defects attached to them, and lead directly to computer generated NRRs.
US Variations: In two sites, the work card was integrated into a carrying case which also held
the NRR forms, aircraft station diagrams, pens, and even mirrors. At one site the work cards
were full size, approximately A4, while at the other they were smaller, approximately A5, with
the carrying cases scaled appropriately.
Evaluation: Work cards will become more automated. Portable computers with multi-level task
information have been proposed already (Reference 1). The advantages of automation are
consistency, access to aircraft-specific information, and a less error-prone human interface. But
automation must be undertaken correctly, or errors and frustrations will result. For example,
work cards which were generated by early computer systems (still in use) have low quality
dot-matrix printing, even in all capitals in places, leading to low legibility. Moves towards
"good" automation need to be encouraged. Thus the use of named examples of defects on the bar
code cards has the effect of reinforcing correct naming of defects. NRRs are then raised with the
appropriate and correct names on them, reducing the possibilities of mis-interpretation by
mechanics and buy-back inspectors. One can foresee the use of a portable computer containing
the work card, with the ability to read bar codes from the aircraft structure to ensure correct
location of areas for inspection, and built in defect menus keyed to the defect types possible in
that inspection. Hypermedia formats can be applied to the presentation of knowledge and rules at
multiple levels.
An integrated solution to the clutter of carrying the work card, other paperwork, and small tools
is urgently required in many sites. Inspectors access the inspection area along ladders and
scaffolds with their hands full of equipment, adding to the hazard of the task. One inspector
entering a wing tank was observed as he removed items from his pockets, belt and hands to be
able to fit through the access cover. There was a considerable pile of equipment resting on the
wing after the removal was completed. New solutions need to be devised, of which the quoted
examples are best considered as early prototypes.
9.4.10 Access
Both Countries: The modes of access for inspection of aircraft have been greatly improved in
the past 10 years. This may be due to the fact that wide-bodied jets cannot be inspected standing
on an oil drum or the top of a step ladder and that custom built docking is more efficient.
Fortunately, this attitude has spread to smaller aircraft in a few companies although not down to
the older aging aircraft such as the 707s and BAC 111s where the extra heavy engineering
occasioned by the SSID programmes etc. render good docking most advantageous.
UK and US Variations: There are no essentially British or American variations although the
closer and more frequent contact with the government inspectorate (HSE) in the UK than with
the OSHA in the USA results in a safer environment with greater adherence to details such as
toe-boarding and plank ends in scaffolds, and toxicity levels in composite repair work.
Evaluation: There is still a need for improved access. All establishments visited had examples of
steps which were poorly designed or ed. Steps, mobile staircases and ladders vary enormously in
quality and safety. Most have wide bases to avoid tipping and many have hand rails but there are
still too many that tip easily, that are rickety with loose joints and that have wheels which do not
lock. One otherwise sturdy staircase had only one wheel that was lockable and so moved around
gradually during inspection; others could not be adjusted for foot height and rocked continually
during inspection. The worst case involved steps that were ten feet tall with a top barely large
enough for two feet so that the inspection of the fwd service door, an intricate enough task
involving much torso movement to enable a close scrutiny of a complicated structure,
necessitated one foot on the steps and the other on the aircraft.
On top of the wing, there is still an unwillingness to fence the perimeter yet the curve and
camber of the wing make it a genuine danger where each succeeding step becomes the more
hazardous.
Particular problems, such as production break inspection, can give rise to excellent access
solutions: the arced bridges used being perfect for that particular job. However, they were
extremely awkward when used subsequently for a horizontal lap joint.
The height of the platform is of some importance. The ideal eye position for visual inspection
and NDT probe manipulation are not the same nor is that required for engineering work. There is
also the need for a place to conveniently locate the NDT equipment itself. More adjustability in
heights is required, preferably power driven from on board. It is very time wasting for the worker
to demount to adjust the jack-up leading to the temptation to forego adjustment and work at a
non-optimal height. Tailplane vertical surfaces are a particular case where this is required e.g.,
for manipulation and alignment of an Xray set outboard of the rudder. The popularity of the
cherry-picker is due largely to the independence and variability of height and position even
though it is frequently far from being a stable platform.
The most frequent problem, however, was simply of an insufficient supply of access equipment
with inspectors and mechanics continually borrowing each others access stands. This wastes,
time and effort, suggests to an inspector the company's lack of concern for the importance of the
job, and may be the cause of an incomplete inspection due to either forgetfulness or
exasperation.
Despite the plethora of access aids, the inspector will still find himself in spaces where access is
difficult due to the overall aircraft design. Hatches can be too small to enter comfortably, internal
spaces too small to allow for the focusing distance of the eye: if one is already holding a torch
(flashlight) and a stick mirror then an additional magnifying lens becomes almost an
impossibility.
Finally, the general clutter beneath and around most aircraft needs eliminating. This is generally
a mix of portable work benches which can easily be moved or avoided and services such as air or
electricity supplies which cannot. These trailing services are especially hazardous when they
originate away from the aircraft bay e.g., the hangar walls and so hinder the movement of
wheeled equipment, e.g., staircases. In some hangars, the services come from a central line
below the aircraft belly and this is to be recommended as it alleviates much of the more
hazardous clutter; service lines tending to remain within the footprint of the aircraft.
9.5 CONCLUSIONS
In this study, as in the previous studies of Appendix I, it was apparent that all concerned with
civil aircraft inspection took their jobs most seriously, and had very high standards.
Nevertheless, there are still areas for system improvement which can fully capitalise upon this
highly motivated workforce.
Most of the system differences were found between individual companies rather than between
the two countries. In any case, technical differences were few, as these are dictated by written
regulations in each jurisdiction and circumscribed by the manufacturers' requirements for
inspection tasks.
The main points raised in each of the results sections follow, arranged in the order of occurrence
and not that of importance.
9.5.1 Maintenance/Inspection Responsibilities
The organisational position of inspectors could vary between the separation of inspectors from
maintainers in the USA to the inspector serving as a maintenance supervisor in some UK
companies. There are arguments in favour of each system with close integration of maintenance
and inspection, especially through long tasks with multiple buy-back stages, weighted against
perceived impartiality of a separate inspectorate.
9.5.2 The Supervisor/Inspection Dichotomy
Whether inspectors have supervisory responsibility or not, they require better support in the
areas of communications (written, verbal), the organisation to support these communications,
and, where appropriate, some interpersonal skills development. Training and systems
modifications are needed to fully support these activities.
9.5.3 Non-Destructive Testing
In the NDT area, there was a difference in the depth of training and degree of specialization
between the USA and the UK, with the UK inspectors required to have deeper knowledge and
more specialization. Both countries require inspectors to use rule-based and knowledge-based
behaviour, although to different extents. This should be realised and support in training,
hardware, and documentation provided in both countries to enable inspectors to move easily and
recognisably between the two modes.
With the advent of increased NDT use and much more complex systems, the current moves
towards NDT specialists with at ASNT level II or PCN level 2 should be encouraged.
Equipment should be made more portable with greater use of repeater units in the same visual
envelope as the probe elements in ultrasonic and eddy current techniques.
9.5.4 Bonding
In the UK, it is generally accepted that 'bonding' personnel to pay back all or part of their
training costs on leaving a company is untenable in law. The practice is endemic in the USA and
is universally disliked by the inspectorate force. The cost in terms of dissatisfaction probably
exceeds the monetary considerations.
A replacement system, involving mutual cooperation and compensation by participating aircraft
engineering companies could solve the major problems of poaching and uneven distribution of
training costs. IATA or ATA or a similar body would be the best source of such an agreement.
9.5.5 Working Times
There is a great difference in the length and rotation of shifts in both countries. In the USA there
is a greater tendency for the older inspectors to be given preference in a choice of shifts. The
effect of this in companies where no shift-rotation occurs is often to condemn the younger, less
experienced inspectors to nightwork with the concomitant difficulties of travel and social
problems. This is especially significant for the married inspector with a family who, due to the
high housing costs around many airport locations, has furthest to travel.
9.5.6 Demand and Supply of Mechanics/Inspectors
An upturn in demand caused both by expansion and retirement of the original generation of
aircraft maintenance personnel has resulted in a resurgence of apprenticeship schemes in both
countries. In the USA, the onus of training to AMT standard is on the worker whereas the UK
route has been predominantly based on day-release to training centre or technical college.
Attraction of the high-grade personnel required could be improved by improvements in low
starting pay, poor working conditions and a cessation of bonding.
An improved interface is recommended between military and civilian aircraft maintenance
employment.
9.5.7 Visual Inspection and Eye Tests
There are no mandatory requirements in the UK or in the USA for annual checks of visual
inspectors' eyesight to specified standards. USA operators tend to have an in-house requirement
and this is frequently financed by the company. UK operators rarely have tests other than on
initial entry into a company.
There is such a requirement for UK NDT personnel: there should be for all inspectors.
Hangar lighting is frequently insufficient, especially secondary, portable lighting. Fluorescent
sources are to be preferred to bright, point-source bulbs which can cause unnecessary glare either
directly or on reflection.
9.5.8 Reporting Imminent Indications
Where NRRs arise from a reportable level, there could exist a secondary reporting system for
sub-reportable, but still visible, indications. This might be incorporated within the task card or
some other computer system to act both as a highlight for future inspection, and a source of data
for fracture mechanics analysis.
9.5.9 Work Cards, Information and Automation
Increased use could be made of computer-technologies in the near future to provide the inspector
with enhanced on-line information of the task in hand. This might be implemented as a small
portable computer indirectly accessing a company mainframe. The information could consist of a
multiple choice level of presentation of the task description to suit the inspector's experience, the
past history of that particular aircraft or of the relevant fleet statistics.
9.5.10 Access
There are no great regional differences in access provision. The problem area is for the older
aging aircraft which is unlikely to have custom-built staging or docking and yet will be liable to
extended structural inspection. Indeed, even the access stairs etc. available are frequently in very
poor condition through age and neglect.
Services are centrally located under the fuselage more frequently in the USA, eliminating much
of the problem of trailing wires, cables and hoses which can be a source of hazard in the
movement of wheeled access platforms.
9.6 Bibliography of Complementary
(Reports by Participants)
Lock MWB. (CAA paper in draft, May.1991). Inspection Reliability for Transport Aircraft
Structures Pt 2 'The Current Situation'. This report is an update of a similar survey completed in
1981
(CAA Paper 85013 and in abbreviated form, CAA Paper 90003).
Drury, CG et al. (1991). Human Factors in Aviation Maintenance, Phase I: Progress
Report. Report No. DOT/FAA/AM-91/16. Springfield Va:National Technical Information
Service.
In association with Galaxy Scientific Corporation, Atlanta, GA.
Drury, CG (1991). Errors in aviation maintenance: taxonomy and control. In Proceedings of the
Human Factor Society 35th Annual Meeting, San Francisco, CA. pp42-46.
Drury, CG (1990). Design for inspectability. In Proceedings of the IEA Human Factors in
Design for Manufacturability and Process Planning Honolulu, HI.
Drury, CG (1990). Exploring search strategies in aircraft inspection. In Proceedings of the
Second International Conference on Visual Search
University of Durham, England.
Drury, CG, Prabhu P and Gramopadhye, A (1990). Task analysis of aircraft inspection activities:
methods and findings. In Proceedings of the Human Factors Society 34th Annual Conference,
Santa Monica, CA. pp.1181-1185.
Drury, CG and Gramopadhye, A (1990). Training for Visual Inspection. In Proceedings
of the Third Federal Aviation Administration Meeting on Human Factors in Aircraft
Maintenance and Inspection Training Issues. Atlantic City, NJ.
Additional References
Shepherd WT and Parker JF (1991). Future availability of aircraft maintenance personnel. In
Proceedings of the Human Factors Society 35th Annual Meeting, Volume 1, pp 33-36.
Taylor JC (1990). Organizational context for aircraft maintenance and inspection. In
Proceedings of the Human Factors Society 34th Annual Meeting, Volume 2, pp.1176-1180.
CHAPTER TEN
GUIDELINES FOR DESIGNING AND IMPLEMENTING
COMPUTER-BASED TRAINING FOR AVIATION
MAINTENANCE
Michael Pearce and Kiki Widjaja
Galaxy Scientific Corporation1
10.0 ABSTRACT
This report is an bibliographic overview of selected issues in designing computer-based training
(CBT) systems. It covers instructional design, information presentation formats, screen design
and layout, and hardware issues. This report in the form of a bibliography for each of the
relevant CBT design issues.
10.1 INTRODUCTION
Broadly defined, a computer-based training (CBT) system is a combination of computers and
special software for training and education. Within this broad definition, there are many different
approaches, systems, and technologies. Their common goal is to transfer skills and knowledge
from an expert to the student via a computer system in such a way that the knowledge will
develop and/or improve performance on a set of tasks. What differentiates a CBT system from
traditional teaching methods is that CBT can be interactive, dynamic, and individualized. CBT
does not require one-on-one interaction with an instructor. The computer program can be
designed to simulate a piece of equipment, to react to user actions, and to provide appropriate
feedback.
10.2 CBT SYSTEM DESIGN ISSUES
There are many decisions to make in designing and implementing a CBT system. The selection
of approaches and technologies should be based on the organization's instructional needs and
budget. This section describes factors that must be considered when creating CBT programs.
Bibliography:
Air Transport Association. (1991, October). Specification 104 - Guidelines for aircraft
maintenance training. Washington, DC: Air Transport Association.
Aviation Industry Computer Based Training Committee. (1992, draft). CBT
courseware/hardware matrix.
Eberts, R. E. & Brock, J. F. (1987). Computer-assisted and computer-managed instruction. In G.
Salvendy (Ed.), Handbook of Human Factors (pp. 963-975). New York: John Wiley & Sons.
Electric Power Research Institute. (1987, June). Guidelines for the application of
computer-based instruction (Research Project 2294-2 Interim Report).
Johnson, W.B. (1988). Pragmatic considerations in development and implementation of
intelligent tutoring systems. In J.R. Richardson and M.C. Polson (Eds.), Foundations of
intelligent tutoring systems (pp. 189-205). Hillsdale, NJ: Lawrence Erlbaum Associates, Inc.
10.2.1 Instructional Approach
Depending on the type of information and knowledge being taught to the student, there are
usually several appropriate instructional approaches. For example, to teach the rules of the road,
a standard present-and-test approach is appropriate. Actual driving (or a simulation) is
appropriate for teaching the physical and coordination skills necessary for safe driving. Note
that a CBT program may combine several of these elements.
Bibliography:
Cohen, V.B. (1985). A reexamination of feedback in computer-based instruction: Implications
for instructional design. Educational Technology, 25, 33-7.
Flexman, R. E. & Stark, E. (1987). Design of selection and training systems. In G. Salvendy
(Ed.) Handbook of Human Factors. New York: John Wiley & Sons, pp. 1012-1038.
Golas, K.C. Estimating time to develop interactive courseware in the 1990s (Technical Report).
Southwest Research Institute, San Antonio, TX.
Goldstein, I. L. (1987). The relationship of training goals and training systems. In G. Salvendy
(Ed.) Handbook of Human Factors. New York: John Wiley & Sons, pp. 963-975.
Reigeluth, C. (1983). Instructional design: What is it and why is it? In C. Reigeluth (Ed.),
Instructional Design Theories and Models: An Overview of their Current Status. Hillsdale, NJ:
Lawrence Erlbaum Associates.
10.2.1.1 Linear/Tutorial Training
The linear training method of CBT presents the material in much the same way as a book. Users
can "step" forward and backward through the material, and possibly jump to other topics and
subjects. Linear training differs from a book in that the program can use multiple types of
presentation methods, including graphics, audio, and video.
Bibliography:
Alessi, Stephen M., and Trollip, Stanley R. (1985). Computer-based instruction: Methods and
development. Prentice Hall, Inc: Englewood Cliffs, NJ.
Black, J., Bechtold, J., Mitrani, M., & Carroll, J. (1989). On-line tutorials: What kind of
inference leads to the most effective learning? ACM CHI 89 Proceedings.
Charney, D. H., and Reder, L. M. (1986). Designing interactive tutorials for computer users.
Human-Computer Interaction 2(4), pp. 297-317.
10.2.1.2 Simulation-based Training
A simulation-based CBT system simulates some type of task through dynamic interaction. The
software provides a realistic imitation of the necessary equipment and activities and behaves like
the "real" world. For example, the CBT may require the student to troubleshoot a piece of
equipment by inspecting, testing, and replacing its components.
Bibliography:
Harri-Augstein, S., and Thomas, L. F. (1984). Simulators which invite users into learning
conversations. Proceedings of IFIP INTERACT'84: Human-Computer Interaction, pp. 785-793.
Hollan, J. D., Hutchins, E. L., and Weitzman, L. (1984) STEAMER: An interactive inspectable
simulation-based training system. AI Magazine, 2.
Johnson, W.B. & Norton, J.E. (1991). Using intelligent simulation to enhance human
performance in aircraft maintenance. Proceedings of the 1991 International Conference on
Aging Aircraft and Structural Airworthiness (NASA Conference Publication 3160). Washington,
DC: Federal Aviation Administration and National Aeronautics and Space Administration,
305-313.
Wiederholt, B.J., Norton, J.E., Johnson, W.B., Browning, E.J. (1992). MITT writer and MITT
writer advanced development: developing authoring and training systems for complex technical
domains (AL-TR-1991-0122). Brooks AFB, Texas: Air Force Systems Command.
10.2.1.3 Intelligent Tutoring
An intelligent tutoring system (ITS) mimics the instructional strategies of an instructor or
domain expert. An ITS can give advice, provide feedback, and explain mistakes. By automating
some of the assistance that instructors usually have to repeat several times, ITS can provide
consistent training to a large number of students.
Bibliography:
Brown, J.S., Burton, R.R., and deKleer, J. (1982). Pedagogical, natural language, and knowledge
engineering techniques in SOPHIE I, II, and III. In D. H. Sleeman and J. S. Brown, (Eds.),
Intelligent Tutoring Systems.
Johnson, W.B. and Norton, J.E. (1992). Modeling student performance in diagnostic tasks:
A decade of evolution. In V. Shute and W. Regian (Eds.), Cognitive Approaches to
Automated Instruction. Hillsdale, NJ: Lawrence Erlbaum Associates, Inc., 195-216. Also
reprinted in Educational Technology Research and Development, 40(4), 81-93.
Norton, J.E., Wiederholt, B.J., and Johnson, B.J. (1991). Microcomputer intelligence for
technical training (MITT): The evolution of an intelligent tutoring system. In Proceedings of
Conference on Intelligent Computer-Aided Training.
Polson, M., and Richardson, J., (Eds.). (1988). Foundations of intelligent tutoring systems.
Hillsdale, New Jersey: Lawrence Erlbaum Associates.
10.2.1.4 Psychomotor Training
Psychomotor training is used to teach physical skills. The task being taught should require some
sort of perceptual (usually visual or auditory) or complex motor skills. For example, a CBT
system might be used to teach a technician how to operate NDI equipment. The limitations of
current computer interfaces may require that special equipment be used to provide a realistic
simulation of the actual environment.
Bibliography:
Gaines, B. R. (1972). The learning of perceptual-motor skills by man and machines and its
relationship to training. Instructional Science, 1, pp. 263-312.
Lintern, G. Augmentation feedback for perceptual-motor instruction. Paper presented at meeting
of the American Psychological Association, Montreal.
10.2.2 Information Presentation Formats
The training and instructional analysis provides a functional description of what information the
CBT must provide to users. Presentation media affects a CBT's cost so the media should be
selected based on instructional criteria, rather than any aesthetic judgements or preferences.
10.2.2.1 Text
Text is the most common CBT presentation format, since all computers support text. Text can be
used to identify and describe processes, objects, and procedures. Designer should:
•
Limit word use, be clear
•
Use large fonts and readable colors
Bibliography:
Bieger, G.R. and Glock, M.D. (1986). Comprehending spatial and contextual information in
picture-text instructions. The Journal of Experimental Education, 54, 181-8
McTyre, J.H., and Frommer, W.D. (1985). Effect of character/background color combination on
CRT character legibility. Proceedings of the Human Factors Society, 31st Annual Meeting,
779-781.
10.2.2.2 Graphics
When a CBT program needs to show what a piece of equipment looks like, or how a system is
organized, a graphic is the best presentation method. Graphics can be pictures or line drawings
of equipment or schematics showing connectivity and functionality of components. Designers of
CBT systems should:
•
Make as simple as possible and do not show unnecessary objects
•
Consider display resolution of computers
Bibliography:
Hovy, E. and Arens, Y. (1990). When is a picture worth a thousand words? - Allocation of
modalities in multimedia communication. AAAI Symposium on Interfaces at Stanford.
Meyer, G.W., Rushmeier, H.E., Cohen, M.F., Greenberg, D.P., Torrance, K.E. (1986). An
experimental evaluation of computer graphics imagery. Association of Computing Machinery
Transactions on Graphics, 5(1), pp. 30-50
Verplank,W.L. (1988). Graphics, challenges in designing object-oriented user interface. In
Handbook of Human Computer Interaction. North Holland: Elsevier Science Publisher B.V.,
New York, NY.
10.2.2.3 Animation
An animation can be used to explain a process or to demonstrate the steps of a procedure.
Examples include animations of flows in electrical and hydraulic systems and animations of the
installation procedure for an avionics component. Designers should:
•
Makes the program more engaging
•
Do not make longer than necessary
Bibliography:
Palmiter, S., Elkerton, J. and Bagget, P. (1991). Animated demonstrations vs. written
instructions for learning procedural tasks: A preliminary investigation. International Journal of
Man-Machine Studies, 34, 687-701.
Park, O. and Gittelman, S.S. (1992). Selective use of animation and feedback in computer-based
instruction. Educational Technology Research and Development, 40(4), 20-38.
Rieber, L.P. (1990). Animation in Computer-based instruction. Educational Technology
Research and Design, 38(1), 77-86.
10.2.2.4 Audio
Audio, including narration, equipment sounds, and musical accompaniment, is used to add
realism, increase entertainment factor, or communicate long text passages. Designers should:
•
Not overuse; have a reason for using it
•
Allow user to control volume, turn off
Bibliography:
Bly, S. (1982). Presenting Information in sound. In Proceedings of Human Factors in Computer
Systems, 371-375.
Sorkin, R.D. (1987). Design of Auditory and tactile displays. In G. Salvendy (Ed.) Handbook of
Human Factors. New York: John Wiley & Sons, 549-576.
10.2.2.5 Video
Like animation, video can be used to describe a process or to show a procedure. Video differs
from animation in that it is a more accurate representation of the "real world" and usually has an
accompanying soundtrack. Since video is more realistic than animation, it is usually better for
describing procedures such as test or installation steps that a technician will perform on the job.
Computer system designers should:
•
Give user control over playback
•
Match purpose with video quality
Bibliography:
Fritz, M. (1993, January). Is interactive videodisc dead yet? CBT Directions, pp. 24-32.
Pearce, M. (in press). How much is enough? Choosing a computer-based video technology. In
Proceedings of the Second Annual Conference on Multimedia in Education and Industry.
Silber, J. (1992, May/June) FlightSafety and the DVI medium. Instructional Delivery Systems,
pp. 9-13.
Singh, R. (1986). Interactive video in education and training. In K. S. Gill, (ed.) Artificial
Intelligence for Society. Chichester etc.: Wiley, pp. 229-234.
Swartz, M., Wallace, D., and Tkacz, S. (1992). The Influence of frame rate and resolution on
human performance. In Proceedings of the Human Factors Society 36th Annual Meeting, pp.
1440-1444.
10.2.3 Screen Design and Layout
This section describes the issues involved in designing and laying out information on the
computer display.
Bibliography:
Engel, S.E. and Granda, R.E (1975). Guidelines for man/display interfaces (Technical Report TR
00.2720). Poughkeepsie, NY: IBM
Helander, M. G. (1987). Design of visual displays. In G. Salvendy (Ed.) Handbook of Human
Factors. New York: John Wiley & Sons, pp. 507-548.
Sewell, D.R., Rouse, W.B., and Johnson, W.B. (1989). Initial evaluation of principles for
graphical displays in maintenance problem solving (Tech REpt. No. ST-TR-8817-001). Atlanta,
GA: Search Technology.
Smith, S.L. and Mosier, J.N. (1986). Guidelines for designing user interface software (Technical
Report ESD-TR-86-278). Hanscom Airforce Base, MA: USAF Electronic Systems Division.
Tullis, T.S. (1988). Screen design. In Handbook of Human Computer Interaction. North
Holland: Elsevier Science Publisher B.V., New York, NY, 377-407.
10.2.3.1 Screen Organization
Screen organization is important to the for the users to be able to quickly understand any
computer screen. There is no one "optimal" design for any particular tasks, although there are
many features that can decrease the quality of a screen. Designers should strive for consistency
within each program and between other programs.
Bibliography:
Galitz, W. O. (1985). Handbook of screen format design. Q. E. D. Information Sciences,
Wellesley, MA.
Helander, M. G. (1987). Design of visual displays. In G. Salvendy (Ed.) Handbook of Human
Factors. New York: John Wiley & Sons, pp. 507-548.
Tullis, T.S., and Helander, M. (1988). Screen design. Handbook of Human-Computer
Interaction. North-Holland, New York, NY, pp. 377-411.
10.2.3.2 Color
Color is extremely useful for dividing a display into separate regions. Also, color differences will
be useful in a visual search task for particular items, provided the user knows about the
differences in advance. A minimum number of colors should be used, because a large number of
colors for coding will increase the search time. Motivational effects of coloring display are
complex, no firm recommendations can be made. However, it is noticed that viewers do express
a preference for color even when it does not objectively improve their performance.
Bibliography:
Christ, R. E. (1975). Review and Analysis of color coding research for visual displays. Human
Factors, 17(6), 542-570.
Davidoff, J. (1987). The role of color in visual displays. In D.J. Osborne (Ed.), International
Reviews of Ergonomics, 1, 21-42.
Murch, M. M. (1984). Physiological principles for the effective use of color. IEEE CG & A,
November, 49-54.
Thorrel, L.G. and Smith, W.J., (1990). Using Computer Color Effectively. New Jersey: Prentice
Hall.
10.2.3.3 Typography
Typographic design has the goal of making text readable and understandable. When displaying
text on a computer, there is a tradeoff between limited screen space and legibility of the fonts.
Designers should consider the target users, computers, and environment when designing a text
display.
Bibliography:
Marcus, A., "Typographic Design for Interfaces of Information Systems, Proceedings of Human
Factors in Computer Systems, 1982, pp. 26-30.
Van Nes, F. L., (1986). Space, colour and typography on visual display terminals. Behaviour and
Information Technology, 5(2), pp. 99-118.
10.2.3.4 Evaluation and usability
Evaluations are necessary to determine if any changes are needed to fulfill the goals of the CBT
system, and to provide data for future CBT systems. In the first case, the evaluation examines the
instructional features of the CBT system and how the students use the system. In the second
case, the goal is to use what was learned during the design and implementation of one CBT
system to assist in the creation of other CBT systems.
Bibliography:
Jeffries, R., Miller, J. R., Wharton, C., and Uyeda, K. M. (1991). User interface evaluation in the
real world: A Comparison of four techniques: Practical design methods. In Proceedings of ACM
CHI'91 Conference on Human Factors in Computing Systems, pp. 119-124.
Kearsley, G. (1982). Costs, benefits, and productivity in training systems. Reading, MA:
Addison-Wesley Publishing Company, Inc.
Maddox, M.E., & Johnson, W.B. (1986). Can you see it? Can you understand it, does it work?
An evaluation plan for computer-based instruction. Proceedings of the International Topical
Meeting on Advances in Human Factors in Nuclear Power Systems (pp. 380-389). LaGrange, IL:
American Nuclear Society.
Sewell, D.R. and Johnson, W.B. (1990). The effects of rapid prototyping on user behavior in
systems design. Journal of the Washington Academy of Sciences, 80(2), 71-89.
10.3 HARDWARE ISSUES
This section describes some of the issues involved in choosing hardware to support CBT
hardware. The selection of hardware should be driven by the type, amount, and quality of media
necessary for instruction.
10.3.1 Computer Display Quality
The computer monitor and the video adapter card work together to display the text, graphics, and
video that the PC generates. There are several dimensions along which the adapter/monitor
combination can vary, including resolution of the video adapter, size of the monitor, and the
number of colors. The appropriate combination depends on the type of data the CBT displays.
For programs that display only text, the lower resolutions are appropriate. If a program displays
graphics, video, and animation, then higher-end equipment is necessary.
Bibliography:
Harpster, J. L., and Freivalds, A. (1984). VDT screen resolution and operator performance. In
Proceedings of IFIP INTERACT'84: Human-Computer Interaction, pp. 91-95.
Snyder, H. L. (1988). Image quality. In M. Helander, Handbook of Human-Computer
Interaction. New York: North-Holland, pp. 437-474.
10.3.2 Input Devices
An input device is a computer peripheral that allows users to enter data into the PC. The most
widely known input device is the keyboard which allows users to enter text. However, most
training approaches and tasks do not require users to enter large amounts of text. Keyboards are
not widely used in the newer CBT systems since it is easier to interact with the computer through
a "selection" device such as a mouse, touchscreen, or light pen.
Bibliography:
Card, S.K., English, W.K., and Burr, B.J. (1978). Evaluation of mouse, rate-controlled isometric
joystick, strap-keys, and text keys for text selection on a CRT. Ergonomics, 21, 601-613
Greenstein, J.S., and Arnaut, L.Y. (1988). Input devices. In Handbook of Human-Computer
Interaction. North-Holland, New York, NY, pp. 495-519.
Greenstein, J.S., and Arnaut, L.Y. (1987). Human factors aspects of manual computer input
devices. In G. Salvendy (Ed.) Handbook of Human Factors. John Wiley & Sons, New York, pp.
507-548.