1
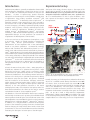
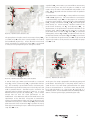
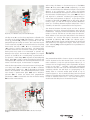
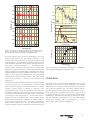
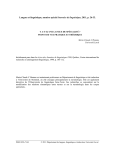
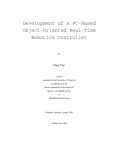
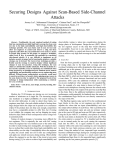
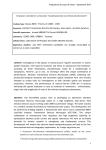
APPLICATION NOTE
Terahertz Spectrometer based on Generation
of Ultrafast Terahertz Pulses in Air Plasma
44
Technology and Applications Center
Newport Corporation
Introduction:
Experimental setup
Terahertz (THz) radiation, generally considered as electric fields
with wavelengths (frequencies) ranging from 30 µm to 3 mm
(0.1 to 10 THz), has attracted great attention in the past two
decades[1]. In terms of spectroscopy, specific molecular
absorptions in the THz region can be utilized in a wide range
of applications from probing crystalline structures[2,3] and
protein interactions[4-6], to discerning traces of explosives[7]. A
particular strength of THz spectroscopy is that it provides a
non-invasive tool to help in understanding physical science.
In terms of imaging[8], the ability to penetrate optically opaque
materials, such as plastics, clothing, and biological tissues,
makes it useful for applications including 2D and/or 3D
medical imaging[9], pharmaceutical sciences[3], and security
screening[10]. With all these fields burgeoning, novel and neat
experimental designs for THz generation are essential to
complement the development of THz research.
The layout of the setup is shown in figure 1. The output of the
Spectra-Physics Spitfire® Pro XP ultrafast amplifier is split (see
Multimodal Ultrafast Spectroscopy System Based on a 35 Femtosecond
Ti:Sapphire Chirped Pulse Amplification (CPA) Laser - application note
41 for a recommendation on how to split the beams), such
that a portion of the output (~300 µJ, P-polarized) is used for
the experiment.
In this note, we focus on the generation of THz pulses (<1 ps)
in air plasma. While it is already popular to generate THz
pulses using biased photoconductive antennas[11],
advancements in laser amplifiers offer a new methodology
based on air plasma generation. Pioneered by Hamster,
Sullivan and coworkers with unbiased air plasma in 1993[12],
and by Cook and Hochstrasser with AC-biased air plasma in
2000[13], further adoption of this method has taken place due to
several advantages, including straightforward implementation
of the setup, practically no damage threshold of the ambient
air, and strong field strength comparable with antenna-based
generation[14,15]. In this note, we basically follow the work done
by Cook and Hochstrasser to demonstrate the feasibility of
THz generation based on a sub-35 fs, 800 nm ultrafast laser
amplifier.
In brief, the 800 nm laser pulse (1 kHz, ~ 300 µJ per pulse) is
focused into ambient air to generate the air plasma. Right
before the focal point, a BBO crystal is inserted to create
second harmonic generated (SHG) 400 nm, converted from
the 800 nm fundamental. The oscillating 400 nm field acts as
AC-bias at the focal point to polarize the plasma by drifting
the electrons away from the nuclei. This process, combined
with the re-collision of the electrons collapsing toward the
nuclei, creates a transient current and as a result, a strong THz
field is generated. This highly nonlinear process makes the
efficiency of the THz generation sensitive to the carrier
envelope phase (CEP) of the ultrafast laser pulses and it has
been demonstrated that this effect can be used to monitor
and stabilize the CEP of a laser amplifier system[16].
The detection of the THz field utilizes electro-optic sampling
with the help of a ZnTe crystal. By mixing the THz field and the
800 nm probe in the ZnTe crystal, the time domain trace of the
THz amplitude is recovered directly from the signal (intensity
difference) from a balance detector[17] (New Focus™ Nirvana).
In addition, it is straightforward to measure the absorption
spectra of the materials by putting them into the beam path
without changing the setup, which means we also have a THz
spectrometer. In this note, we will demonstrate this feature by
measuring the absorption of water vapor in the THz region.
1
(a)
(b)
Figure 1. The experimental layout of the setup. (a) The schematic presentation.
(b) The working setup in Newport’s Technology and Applications Center.
Initially, the energy of the laser pulse is reduced to about 10 µJ
(by use of a variable neutral density filter before mirror M1,
not shown). Then, as shown in Figure 2(a), mirrors M1 and M2
are used to align the laser pulse parallel to the table and the
side of the breadboard. The laser pulse should be kept
parallel to the table at all times (5 inches in this setup). This
minimizes the aberration caused by other optics in the beam
path. An iris (I1) is used to help meet this requirement.
Subsequently, a beam sampler (BS1) is installed at a 45° angle
to the incoming beam passing through its center. The beam
sampler reflects 3% of the energy for use as the probe beam.
M2
M1
l1
BS1
Figure 2(a). Alignment of the beam into the setup.
The pump beam (the pulse train that transmits through BS1)
is folded 90° by M3 such that it travels parallel to the side of
the breadboard (Figure 2(b)). A lens (L1) with 125 mm focal
length, mounted on a translational stage (TS1), is positioned
in a way that the pump beam passes through its center.
A parabola (PB1, 50 mm EFL) is positioned about 50 mm away
from the focal point such that the pulse is folded 90° and
travels along the side of the breadboard and parallel to the
table. TS1 is adjusted such that the beam after the parabola
is collimated.
The probe beam is routed by M4 to a retro-reflector consisting
of M5 and M6 (figure 2(c)). This retro-reflector is mounted on
a motorized delay stage (MS1) for the purpose of controlling
the electro-optic sampling. The probe beam is then redirected
by M7. Initially, each mirror, from M4 to M7, will fold the probe
beam exactly 90°. When inserting a business card into the
probe beam bouncing off M7 and adjusting MS1, no
displacement of the probe beam should be observed on the
business card. Adjusting M4 may be necessary so that the
probe beam does not walk on M5 when MS1 is translated.
Subsequently, mirrors M5 and M6 are adjusted such that the
probe beam remains centered on M7 when MS1 is translated.
Also, the distance the probe travels from BS1 to flip mount S
(figure 2(d)) needs to closely match that traveled by the pump
from BS1 to S.
MS1
M5
M6
M4
M7
R1
L1
M3
TS1
BD1
PB1
TS2
Figure 2(c). Alignment of the probe beam.
Figure 2(b). Alignment of the pump beam to generate air plasma.
A 100 µm thick type I BBO crystal mounted in a rotational
stage (R1), and on a linear stage (TS2) is placed after the lens
(L1). This assembly is positioned normal to the beam path,
with the BBO crystal about 25 mm prior to the focal point, and
used to generate 400 nm. The BBO crystal is rotated to the
optimum angle for efficient generation of 400 nm. It is then
detuned from this position by adjusting R1 (~ 35°) to create
enough 400 nm with the same polarization as the
fundamental. This adjustment will be fine-tuned later for the
optimization of the THz field. The power is increased by
rotating the neutral density filter such that air plasma is just
observed at the focal point. A beam dump (BD1) with the back
plate removed is then mounted on TS2 to prevent the strong
white light from reaching the eyes. Reduce the power back to
10 µJ after BD1 is set.
At this point, the setup is prepared for recombining pump and
probe beams. The beam path of the pump will be used as a
guide for that of the THz beam generated when the pump
power is increased later on. The silicon wafer (400 µm thick,
both sides polished) is on a flip mount (S) and used as a
combining mirror. It is also utilized to filter out and dump 400 nm,
800 nm, and strong white light generated (figure 2(d)).
2
PB2
After routing the beams to the entrance ports of the balance
detector (D) using mirrors M8 and M9, respectively, a co-axial
cable is connected from the differential output of the balance
detector to an oscilloscope. At this point, the balance
detector should indicate null response since the intensities of
the two beams should be equal. If not, rotate QW such that a
null response is achieved. Increasing the pump energy to
around 150 µJ will generate air plasma. At this point, when
the delay is adjusted using MS1 within its full range, and the
timing is right, you will see the signal (intensity difference,
figure 3) is oscillating between negative and positive. This is
caused by the THz that is generated from the air plasma.
R2
TS3
l2
BD2
S
Figure 2(d). Recombination of the probe beam with THz field.
The flip mount S is set that the pump beam is allowed to hit
the center of the parabola PB2 and folded 90°. After inserting
an iris (I2) between PB2 and S, it is positioned so that the
pump beam passes through its center. The <110> ZnTe crystal
on the rotational stage R2 is positioned normal to the pump
beam and at the focus of PB2. R2 is on a translation stage
(TS3), which is used for fine positioning. The pump beam
should hit and focus onto the center of the crystal. The pump
beam power may need to be attenuated to prevent any
damage to the crystal. The mount (S) is flipped to its original
position (it should be 45° to either pump or probe beam at
this position). Beam dump (BD2) captures the rejected pump
beam. Mirror M7 is used to center the probe through I2, and
subsequently S is adjusted such that the probe beam hits the
center of the ZnTe crystal. Some iteration is required.
After the above procedure, a lens with 25 mm focal length (L2)
on a delay stage (TS4) is inserted right after R2 to collimate
the probe beam (figure 2(e)). TS4 is adjusted for the probe
beam to be collimated. The collimated probe beam is then
sent through a quarter-wave plate (QW) and a Wollaston
polarizer (WP) to create two beams with perpendicular
polarizations. QW is rotated such that the two beams exiting
WP have the same intensity.
QW
L2
M8
The distance between the BBO crystal and the air plasma
determines the phase relationship between SHG and the
fundamental. Changing the distance between them directly
relates to how far the 400 nm can drift away the electrons,
which relates to how strong the THz will be as the electrons
recombine. So, once the THz signal is observed, it can be
optimized by adjusting TS2 and R1 (the “detune angle”).
Tweaking S for better spatial overlap between the probe and
THz beams may also improve the signal. After any of these
steps, adjusting MS1 will be required for the optimization of
the THz signal.
Results
The generated THz field is shown in figure 3. Several features
can be observed in the time domain trace. First of all, the
main oscillation is only one cycle and spans about 1 ps. It
contains most of the THz energy, and is estimated to be about
0.1-0.3 nJ per pulse[14]. Secondly, small and complicated
oscillations after the main cycle are observed which indicate
something absorbs the THz while it is propagating in air.
Thirdly, there is a second, smaller peak around 11.5 ps as
shown in figure 3(a). This is actually resulting from the second
reflection of the THz within the Silicon wafer. Since it is about
0.4 mm in thickness and it has n ~ 3.4 in the THz region, it
would cause the delay that is observed in the plot.
M9
WP
TS4
D
Figure 2(e). Sending the probe beam into the balance detector for electro-optic
sampling.
3
10
Arrows Show the Absorption
of Water Vapor
1.0
1
THz's reflection within Si wafer
0.5
0.1
0.0
0.01
(a)
-1.0
0
2
4
6
8
10 12 14 16 18 20
1.0
0.5
Spectral Density (a.u.)
1E-3
1E-4
6
(a)
0
1
2
3
4
5
6
THz Power Spectrum
(with Water Vapor Absorption)
5
Reconstructed THz Power Spectrum
4
3
0.0
2
-0.5
1
0
(b)
0
1
2
3 4 5 6 7
Time Delay (ps)
8
9
10
Figure 3. The time trace of THz field collected by electro-optic sampling. (a) The
time trace of the first 20 ps of the THz field. (b) Zoomed view of the first 10 ps
shows the main cycle and the small complicated oscillations that follow.
The time domain trace is Fourier transformed to show the
frequency spectrum of the THz radiation (figure 4). The
spectrum spans from 0 to 3 THz. Some sharp absorption lines
corresponding to the complicated oscillations after the main
cycle are clearly resolved. These are the absorption lines of
water vapor’s rotational transitions [18,19]. This demonstrates
that the setup is actually a THz spectrometer. In addition, by
purging the system to remove the water vapor absorption and
putting samples into the beam path of the THz pulse, we can
actually measure the spectra of different molecules in the THz
region. A lot of explosives and drugs have strong and unique
THz absorptions and this feature makes a THz spectrometer
much more valuable in detection and spectroscopic
applications[21].
The amplitude of the THz field with respect to the input energy
is shown in figure 4(c). By extrapolation, the curve would
intersect with the positive x axis which means that a certain
amount of input energy is required to overcome some
threshold before the THz can be generated. This threshold is
the energy required to rip the electrons from the nuclei and
corroborates the statement that the generation of the plasma
is necessary for the THz generation. On the other hand, at
high pulse energies, the defocusing of the laser beam by the
plasma becomes important and limits the peak intensity of
the laser pulse at the focal point[21]. As a result, the efficiency
drops. From our design, it is seen that around 250 µJ input
energy is optimal in terms of efficiency and the THz intensity.
(b)
0
1
2
Frequency (THz)
3
4
6
Amplitude (a.u.)
-1.0
THz Amplitude (a.u.)
Amplitude (a.u.)
-0.5
5
4
3
2
(c)
1
0
50 100 150 200 250 300 350 400 450 500
Input Energy (µ J)
Figure 4. (a) and (b), The spectrum of the generated THz field. (c) The amplitude
of the generated THz field is plotted against the input energy.
Conclusion
The setup shows a straightforward implementation of a THz
generation tool based on a laser amplifier. The damage
threshold is not a concern based on this design and the fact
that air plasma generates THz. The strong strength and the
pulsed nature of the THz field make it applicable not only to
linear spectroscopy in THz domain, but also to time resolved
nonlinear experiments, such as optical pump and THz probe
experiments. Furthermore, being able to recover the phase
and the amplitude information of the THz field through
electro-optic sampling adds the functionality of a “THz
spectrometer” without further modification.
4
Newport Corporation
Worldwide Headquarters
1791 Deere Avenue
Irvine, CA 92606
(In U.S.): 800-222-6440
Tel: 949-863-3144
Fax: 949-253-1680
Email: [email protected]
Visit Newport Online at: www.newport.com
References:
1. Ferguson, B. and X.C. Zhang, Materials
for terahertz science and technology.
Nature Materials, 2002. 1(1): p. 26-33.
2. Strachan, C.J., et al., Using terahertz
pulsed spectroscopy to quantify
pharmaceutical polymorphism and
crystallinity. Journal of Pharmaceutical
Sciences, 2005. 94(4): p. 837-846.
3. Zeitler, J.A., et al., Terahertz pulsed
spectroscopy and imaging in the
pharmaceutical setting - a review.
Journal of Pharmacy and Pharmacology,
2007. 59(2): p. 209-223.
4. Ebbinghaus, S., et al., An extended
dynamical hydration shell around
proteins. Proceedings of the National
Academy of Sciences of the United
States of America, 2007. 104(52): p.
20749-20752.
5. Plusquellic, D.F., et al., Applications of
terahertz spectroscopy in biosystems.
Chemphyschem, 2007. 8(17): p. 24122431.
6. Xu, J., K.W. Plaxco, and S.J. Allen, Probing
the collective vibrational dynamics of a
protein in liquid water by terahertz
absorption spectroscopy. Protein
Science, 2006. 15(5): p. 1175-1181.
7. Shen, Y.C., et al., Detection and
identification of explosives using
terahertz pulsed spectroscopic imaging.
Applied Physics Letters, 2005. 86(24).
8. Chan, W.L., J. Deibel, and D.M.
Mittleman, Imaging with terahertz
radiation. Reports on Progress in
Physics, 2007. 70(8): p. 1325-1379.
9. Wallace, V.P., et al., Three-dimensional
imaging of optically opaque materials
using nonionizing terahertz radiation.
Journal of the Optical Society of America
a-Optics Image Science and Vision, 2008.
25(12): p. 3120-3133.
10.Kemp, M.C., et al., Security applications
of terahertz technology, in Terahertz for
Military and Security Applications, R.J.
Hwu and D.L. Woodlard, Editors. 2003.
p. 44-52.
11.Tani, M., et al., Emission characteristics
of photoconductive antennas based on
low-temperature-grown GaAs and semiinsulating GaAs. Applied Optics, 1997.
36(30): p. 7853-7859.
This Application Note has been prepared based on development activities and
experiments conducted in Newport’s Technology and Applications Center and the results
associated therewith. Actual results may vary based on laboratory environment and
setup conditions, the type and condition of actual components and instruments used
and user skills.
Nothing contained in this Application Note shall constitute any representation or
warranty by Newport, express or implied, regarding the information contained herein or
the products or software described herein.
Any and all representations,
warranties and obligations of Newport with respect to its products and software shall be
as set forth in Newport’s terms and conditions of sale in effect at the time of sale or
license of such products or software. Newport shall not be liable for any costs,
damages and expenses whatsoever (including, without limitation, incidental, special and
12.Hamster, H., et al., Subpicosecond,
electromagnetic pulses from intense
laser-plamsa interaction. Physical
Review Letters, 1993. 71(17): p. 27252728.
dependence of terahertz pulse detection
in ZnTe. Journal of the Optical Society of
America B-Optical Physics, 2001. 18(3):
p. 313-317.
13.Cook, D.J. and R.M. Hochstrasser, Intense
terahertz
pulses
by
four-wave
rectification in air. Optics Letters, 2000.
25(16): p. 1210-1212.
18.Xin, X., et al., Terahertz absorption
spectrum of para and ortho water vapors
at different humidities at room
temperature. Journal of Applied Physics,
2006. 100(9).
14.Loffler, T., et al., Comparative
performance of terahertz emitters in
amplifier-laser-based
systems.
Semiconductor Science and Technology,
2005. 20(7): p. S134-S141.
19.Zhou, Z., et al., Terahertz generation and
detection setup based on pump-probe
scheme. Microwave and Optical
Technology Letters, 2009. 51(7): p. 16171619.
15.Thomson, M.D., et al., Broadband THz
emission from gas plasmas induced by
femtosecond optical pulses: From
fundamentals to applications. Laser &
Photonics Reviews, 2007. 1(4): p. 349368.
20.Mlejnek, M., E.M. Wright, and J.V.
Moloney,
Femtosecond
pulse
propagation in argon: A pressure
dependence study. Physical Review E,
1998. 58(4): p. 4903-4910.
16.Kress, M., et al., Determination of the
carrier-envelope phase of few-cycle laser
pulses
with
terahertz-emission
spectroscopy. Nature Physics, 2006. 2(5):
p. 327-331.
21.Federici, J.F., et al., THz imaging and
sensing for security applications explosives, weapons and drugs.
Semiconductor Science and Technology,
2005. 20(7): p. S266-S280.
17.Planken, P.C.M., et al., Measurement and
calculation
of
the
orientation
consequential damages) resulting from any use of or reliance on the information
contained herein, whether based on warranty, contract, tort or any other legal theory, and
whether or not Newport has been advised of the possibility of such damages.
Newport does not guarantee the availability of any products or software and reserves the
right to discontinue or modify its products and software at any time. Users of the
products or software described herein should refer to the User’s Manual and other
documentation accompanying such products or software at the time of sale or license for
more detailed information regarding the handling, operation and use of such products
or software, including but not limited to important safety precautions.
This Application Note shall not be copied, reproduced, distributed or published, in
whole or in part, without the prior written consent of Newport Corporation.
Copyright ©2011 Newport Corporation. All Rights Reserved. Spectra-Physics®, the Spectra-Physics “S” logo, the Newport “N” logo,
are registered trademarks of Newport Corporation. Newport™ is a trademarks of Newport Corporation.
Newport Corporation, Irvine, California, has been certified
compliant with ISO 9001 by the British Standards Institution.
DS-011107