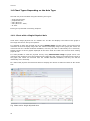
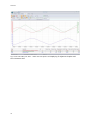
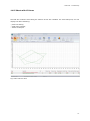
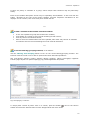
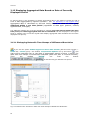
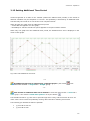
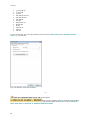
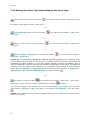
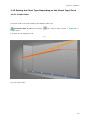
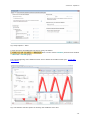
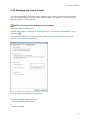
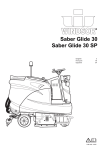
1
User’s Manual for Asix 7
www.asix.com.pl
AsTrend
Manual for operators
Doc. No ENP7025
Version: 2014-02-25
ASKOM® and Asix® are registered trademarks of ASKOM Spółka z o.o., Gliwice. Other brand names,
trademarks, and registered trademarks are the property of their respective holders.
All rights reserved including the right of reproduction in whole or in part in any form. No part of this
publication may be reproduced or transmitted in any form or by any means, electronic or mechanical, including
photocopying, recording, or by any information storage and retrieval system, without prior written permission
from the ASKOM.
ASKOM sp. z o. o. shall not be liable for any damages arising out of the use of information included in the
publication content.
Copyright © 2014, ASKOM Sp. z o. o., Gliwice
ASKOM Sp. z o. o., ul. Józefa Sowińskiego 13, 44-121 Gliwice,
tel. +48 32 3018100, fax +48 32 3018101,
http://www.askom.com.pl, e-mail: [email protected]
Table of Contents
Table of Contents
1 AsTrend - Functionality.....................................................................................................6
1.1 Operating Modes of AsTrend .......................................................................................6
1.2 Privilege System of AsTrend Run with an Asix Application...............................................6
1.3 Wersja internetowa programu AsTrend .........................................................................8
1.4 AsTrend Window ...................................................................................................8
1.4.1 Ribbon ..............................................................................................................9
1.4.1.1. Quick Access Toolbar ...................................................................................9
1.4.1.2 Commands of AsTrend Button Drop-Down List ..................................................9
1.4.1.3 'Home' Tab ................................................................................................ 11
1.4.1.4 'Data' Tab ................................................................................................. 12
1.4.1.5 'Chart' Tab ................................................................................................ 14
1.4.1.6 'Graph' Tab ............................................................................................... 16
1.4.1.7 'View' Tab ................................................................................................. 18
1.4.1.8 'Help' Tab .................................................................................................. 19
1.4.1.9 'Table' Tab ................................................................................................ 19
1.4.1.10 Ribbon Layout Management ....................................................................... 21
1.4.2 Chart Area ...................................................................................................... 22
1.4.3 Legend ............................................................................................................ 22
1.4.4 Pasek statusu ................................................................................................... 24
1.5 Data Types of Graphs .............................................................................................. 25
1.6 Chart Types Depending on the Axis Type .................................................................... 26
1.6.1
Chart with a Single Physical Axis ....................................................................... 26
1.6.2 Chart with Proportional Axis ............................................................................... 27
1.6.3 Chart with Many OY Axes ................................................................................... 28
1.6.4 Chart with Many OY Axes - Stack ........................................................................ 29
1.6.5 Chart with XY Axes ........................................................................................... 31
1.7 Chart Types Depending on the Type/Appearance of a Graph .......................................... 33
1.8 Aggregation of Asix System Data ............................................................................... 34
1.8.1 Aggregates - a New Source of Statistical Data Analysis........................................... 34
1.9 Mode of Historical Data Table .................................................................................... 36
2 AsTrend - Operation....................................................................................................... 37
2.1 Starting the Program ............................................................................................... 37
2.2 Help System ........................................................................................................... 39
2.3 Modification of the Ribbon Contents ........................................................................... 40
2.4 Trend Wizard .......................................................................................................... 43
2.5 Operations in the Chart Area..................................................................................... 44
2.6 Operations in the Legend Area .................................................................................. 45
2.7 Operations in the Status Bar ..................................................................................... 55
2.8 Selecting Variable Definition Database from the Asix System / OPC Server ...................... 56
2.9 Adding Graph Data to the Chart ................................................................................ 58
2.9.1 Adding Graph Data from the Asix System Application ............................................. 58
2.9.1.1 Adding a Raw Data ..................................................................................... 58
iii
AsTrend
2.9.1.2 Adding an Aggregated Data ......................................................................... 61
2.9.1.3 Adding a Bit of a Variable ............................................................................ 62
2.9.1.4 Adding an Alarm ........................................................................................ 63
2.9.1.5 Adding an SQL ALarm ................................................................................. 65
2.9.1.6 Adding a Graph from the Clipboard ............................................................... 65
2.9.1.7 Adding a Variable from the Asix Archive File ................................................... 66
2.9.1.8 Adding a Calculated Variable ........................................................................ 67
2.9.2 Adding a Constant ............................................................................................ 71
2.9.3 Adding a Variable from External Data Source ........................................................ 74
2.9.4 Adding a Data from OPC-HDA Server ................................................................... 75
2.9.5 Adding an Empty Graph ..................................................................................... 75
2.10 Selecting the Data Type (Genuine/Aggregated Data) .................................................. 76
2.10.1 Selecting the Aggregation Function for Data Reading ............................................ 78
2.11 Setting Time Period ............................................................................................... 79
2.11.1 Setting Time Period Using Trend Moving Buttons ................................................. 79
2.11.2 Setting Time Period Using Period Editor .............................................................. 79
2.11.3 Setting Time Period Using the Period Clipboard.................................................... 81
2.11.4 Setting Time Period Opening a Trend Definition ................................................... 81
2.11.5 Setting Time Period Using the Mouse ................................................................. 82
2.11.6 OPC Time Editor ............................................................................................. 82
2.12 Displaying Aggregated Data Based on Data of Currently Displayed Period ...................... 84
2.12.1 Dislapying Data with Time Stamps of Millisecond Resolution .................................. 84
2.13 Setting Additional Time Period ................................................................................. 85
2.14 Setting the Chart Type Depending on the Axes Type ................................................... 88
2.15 Setting the Chart Type Depending on the Graph Type/Form......................................... 89
2.15.1 Linear Chart ................................................................................................... 89
2.15.2 Bar Chart ....................................................................................................... 90
2.15.3 Area Chart ..................................................................................................... 91
2.15.4 Binary Variable Chart ....................................................................................... 92
2.16 Displaying Variable State Descriptions ...................................................................... 93
2.17 Operations on Variables.......................................................................................... 94
2.17.1 Selection of One or All Variables ........................................................................ 94
2.17.2 Removal of Variables ....................................................................................... 94
2.17.3 Displaying the Variable Metric ........................................................................... 94
2.17.4 Displaying Labels ............................................................................................ 95
2.17.5 Displaying Measurement Points ......................................................................... 96
2.17.6 Changing the Variable Range ............................................................................ 97
2.17.7 Replacing a Variable ........................................................................................ 99
2.17.8 Changing Interpolation .................................................................................. 100
2.17.9 Showing/Hiding a Variable Graph .................................................................... 101
2.17.10 Colour Change ............................................................................................ 101
2.18 Operations on Displayed Graphs ............................................................................ 103
2.18.1 Live Mode - Continuous Data Registration ......................................................... 103
2.18.2 Zooming ...................................................................................................... 103
iv
Table of Contents
2.18.3 Panning ....................................................................................................... 105
2.18.4 Readout of Variable Values ............................................................................. 105
2.18.5 Variable Selection ......................................................................................... 106
2.18.6 Restoring Original Appearance of the Window .................................................... 107
2.19 3D Chart Handling ............................................................................................... 108
2.20 Program Options ................................................................................................. 111
2.21 Trend Options ..................................................................................................... 121
2.21.1 Trend Period Options ..................................................................................... 121
2.21.2 Trend Input Data Options ............................................................................... 122
2.21.3 Trend Appearance Options.............................................................................. 124
2.21.3.1 Chart .................................................................................................... 125
2.21.3.2 Axes ..................................................................................................... 126
2.21.3.3 Legend .................................................................................................. 128
2.21.3.4 Appearance ........................................................................................... 129
2.21.3.5 Colour Palette ........................................................................................ 130
2.21.3.6 3D ........................................................................................................ 131
2.21.3.7 Printout ................................................................................................. 132
2.21.4 Trend Axes Options ....................................................................................... 134
2.21.4.1 Type and Look ....................................................................................... 134
2.21.4.2 Physical OY Axis ..................................................................................... 135
2.21.4.3 Time Axis .............................................................................................. 136
2.21.5 Trend Window Options ................................................................................... 138
2.22 Graph Options .................................................................................................... 139
2.23 Reading the Trend Definition ................................................................................. 148
2.24 Printing Trends ................................................................................................... 150
2.24.1 Print Preview ................................................................................................ 151
2.24.2 Printing ....................................................................................................... 152
2.24.3 Printing Trends with More than 8 Graphs .......................................................... 153
2.25 Closing a Displayed Trend / Creating a New Trend .................................................... 155
2.26 Saving the Trend Definition ................................................................................... 156
2.27 Exporting the Trend / Graph / Historical Data Table .................................................. 160
2.28 Context Menus .................................................................................................... 167
2.29. Period Clipboard ................................................................................................. 171
2.29.1 Clipboard Functions ....................................................................................... 171
2.30 0-100% Percent Scale .......................................................................................... 174
2.31 Handling the Table of Current Data ........................................................................ 175
2.32 Handling the Table of Historical Data ...................................................................... 177
2.33 Changing the Colour Palette .................................................................................. 179
v
AsTrend
1 AsTrend - Functionality
1.1 Operating Modes of AsTrend
The AsTrend program may operate in two modes: in conjunction with an Asix system application,
or alone.
In both modes the to-be-displayed data may be served by the same computer, on which the
AsTrend program runs, or else by any of the networked computers.
Details on how to start AsTrend are given in chapter 2.1 Starting the Program.
1.2 Privilege System of AsTrend Run with an Asix Application
Starting the Program with an Asix.Evo Application
While using Asix.Evo:
•
Users are defined in an Asixa.Evo application. Only a user with the Asix.Evo application
administrator role is automatically assigned with full permissions of AsTrend opperation.
Starting the Program with a Classical Asix Application
While operating in conjunction with Asix AsTrend has two modes of privileges:
•
•
privileges of users are defined in AsAudit module;
operator / administrator mode.
Privileges of Users are Defined in AsAudit Module
Privileges are defined in AsAudit. Full list of functions (associated with AsTrend) which depend on
privileges of the logged user includes:
•
•
•
•
•
•
administration of AsTrend (changing the AsTrend program settings),
creating new files,
modification of files,
modification of read-only files,
having own system of menus and toolbars,
modification of the common menus and toolbars.
Operator / Administrator Mode
Operator
Access control mechanism without the AsAudit module enables each user to log-in as an
Administrator or as an Operator only.
6
1 AsTrend - Functionality
Each time the program is started from an application of the asix system, it is set into the
operator mode.
Operator:
- create and modify .TRNX files with the „read-only" attribute (See: 2.26 Saving the Trend
Definition);
- can read trend patterns, change them and save them under new names, as well as create
completely new trend definitions (in working directory only).
Administrator
The mode it activated by the command Administrator Mode
from: AsTrend main
window > View tab > Security group. It demands the proper password to be entered,
except the first time AsTrend is run on the computer – it is enough then to press OK.
"Empty password" will be active till the administrator sets a new one.
Administrator can perform additional operations:
- open all files on computer disks,
- write trend files with the „read-only" attribute set – such files can not be modified by
operators,
- use the options: Window Size Block
(AsTrend main window > View tab >
Window group) and Stały układ okien (AsTrend main window > View tab > Window
group > window 'Trend Window Options' activated by the
- modify layout of menus/toolbars,
- export charts to . PDF or .BMP files
- export legend to text, HTML and XLS files.
button),
After 15 minutes the administrator mode will be automatically terminated and the program
will return to the operator mode.
If a trend definition is stored in the administrator mode with the window re-size function
enabled, the function will remain enabled after the definition is opened as a pattern in the
operator mode.
See also: 2.1 Starting the Program.
7
AsTrend
1.3 Wersja internetowa programu AsTrend
Since Asix 6 the Web version of AsTrend is available with full functionality of the standard
window version.
Configuration of AsTrend to work in a web browser is implemented by the Asix
application designer.
1.4 AsTrend Window
Main program window that appears as soon as the program has started includes the following
elements:
Ribbon
Chart area
Legend
Status bar
- collection of tabs with groupped commands;
- curves, coordinates;
- charted data descriptions;
- status of the displayed trends.
Fig. AsTrend Window.
Chart area and legend area remain empty if the program has been called without any parameter.
Just after starting the program most of its functions remains inactive.
Use the trend wizard to easily complete the entire procedure of defining a trend. The
wizard is recommended particularly for novice users.
8
1 AsTrend - Functionality
1.4.1 Ribbon
Access to particular AsTrend functions is performed through the ribbon placed at the top of the
AsTrend main window; commands are groupped on the tabs: Home, Data, Chart, Graph, View
and Help; and the list of commands on the drop down menu of the button
.
You can also define a quick access toolbar with the commands preferred.
1.4.1.1. Quick Access Toolbar
Quick access bar is the place prepared for adding buttons with the commands that are often used
by an operator or administrator. To put a new button onto the toolbar, you should select the
command by pressing the right mouse button and select Add to Quick Access Toolbar.
To remove a button from Quick Access Toolbar, select the button by the right mouse button and
use the command Remove from Quick Access Toolbar.
Fig. Quick Access Toolbar.
1.4.1.2 Commands of AsTrend Button Drop-Down List
There is the AsTrend button
in the upper left corner of the program, which displays the list of
commands related to opening, saving, sending, printing and closing trend files:
(some commands are available when AsTrend is run without Asix application)
New - open a new trend window;
New - Wizard... - run trend wizard;
Reopen Trend File - cancel modifications, restore the original trend;
Open... - open trend file;
Save - store the displayed trend;
9
AsTrend
Save As ... - store the displayed trend in another file;
Create Shortcut... - create shortcut that runs the AsTrend program; command is available
when AsTrend is run without Asix application;
Print Preview - display trend print-out preview;
Print - print the displayed trend;
Clear Printer Queue - clear printer queue;
Export To PDF - export trend data to a PDF file;
Export To BMP - export trend data to a BMP file;
Program Options - open ‘Program Options’ window;
Hide Main Window - minimize the program window to a tray icon;
Exit - shut down the program; command is available when AsTrend is run without Asix
application;
Recenlty Used Files - show the list of recently opened trend window;
Fig. Commands of AsTrend Button Drop-Down List.
10
1 AsTrend - Functionality
1.4.1.3 'Home' Tab
New Graph group:
Raw Data - add a graph of raw data from Asix application,
Aggregated Data - add a graph of aggregated data from Asix application,
Bits of Data - add a graph of bit value of a variable from Asix application,
Alarm - add a graph of the state of selected alarm form Asix application,
SQL Alarm - add a graph of the state of selected alarm the event archive of which is stored
in SQL database; mainly for Asix.Evo application,
Variable from Clipboard - add a variable form the clipboard,
Asix Archive File - add a graphs of variables exported withe the use of AspadTools;
Calculated - open the window that allows adding variable calculated on the basis of other
variables with use of a given expression;
Constant - open the window that allows adding a constant;
Empty - add an empty row to the legend and historical data table;
External Data - add a variable data from external files;
OPC-HDA Server - add a variable data from OPC-HDA server; the option available with
extended license of Asix HASP key;
Remove Selected - clear the currently selected variable.
***
Period group:
- set a period of charted data;
- set a previous period from periods history; remembered the 20 sequentially
displayed periods;
- set a next period from periods history; remembered the 20 sequentially displayed
periods;
Copy to Clipboard - copy a period to the period Clipboard;
Paste from Clipboard - insert a period from the period Clipboard;
Periods Clipboard - show/hide the window of the period Clipboard.
***
11
AsTrend
Time Move group:
Live Mode - start / stop the data logging mode;
Last Data - display the last data from a selected period;
Decrease Period - decrease period to the span determined by the consecutive default periods
defined in AsTrend;
Increase Period - increase period to the span determined by the consecutive default periods
defined in AsTrend;
To the Beginning of Data - move to the beginning of a data;
Backward by Period - move backward by a period;
Backward - move backward by 1/4 of a period;
Forward - move forward by 1/4 of a period;
Forward by Period - move forward by a current period;
To the End of Data - move to the end of a data (the last data).
1.4.1.4 'Data' Tab
Bonnection to Arhive group:
Asix - Variables and Alarms - open the variable and alarm definition database;
OPC HDA - Variables - open the window with parameters of connection with an
OPC HDA server;
***
Input Data group:
Genuine - set exactly the data defined in graph options (AsTrend window > Graph
tab > Graph group > 'Graph Options' activated by
> Data tab);
Uniform - receive aggregated data, where sampling rate is constant; allows setting
sampling rate;
12
1 AsTrend - Functionality
Averaged - receive averaged data; genuine data is received for short periods;
aggregates - averaged data is received for long periods; the moment of transition from
a genuine data to aggregates and the aggregation period is adjusted automatically;
Approximated - receive approximated data; genuine data is received for short
periods; aggregates - minimum and maximum values are received for long periods; the
moment of transition from a genuine data to aggregates and the aggregation period is
adjusted automatically.
Refresh Data - download data again and draw the chart;
Data Server - display information on the current data server of a taken graph;
- run the window 'Trend Input Data Options' with the possibility of defining selected
options.
***
Export of Data group:
Copy to Clipboard - copy data into Windows clipboard; sucha a data can be
directly pasted into Excel spreadsheet.
Export to CSV - export data in tabular form into a file;
- run the window 'Data Export Options' which allows setting the options of data
export into clipboard or text file;
- Header - declare one-line or two-line header and set units and aggregates near
variable names;
- Genuine Data - declare samples one-by-one or by timeline;
- Quality Columns - add the quality column and set its format;
- Uniform Data - set a common time column for uniform data.
13
AsTrend
Fig. Data Export Options.
1.4.1.5 'Chart' Tab
Chart type group:
XT Chart - draw charts which measurement values of the graph are drawn as a
function of time;
XY Chart - draw charts being a function of to variables;
- run the window 'Trend Options' with the possibility of defining trend options.
***
Axes group:
One OY Axis - display one OY Axis;
Many OY Axes - display separated OY Axes for each variable;
Many OY Axes - Stack - display separated OY Axies for each variable; axes are
arranged one above the other;
Proportional Axis - display proporcional axis;
Axes and Grid - display the list with the following parameters:
- set axes visible/invisible;
- set the axes colour (the same colour will be used for axes labels);
14
1 AsTrend - Functionality
-
set
set
set
set
fixed chart arrangement;
the grid visible/invisible;
the way the grid will be displayed: dots / lines;
dots / lines colour;
- run the window 'Trend Axes Options' with the possibility of defining options of
trend axes.
***
Zoom group:
Block Vertical Zoom - block the possibility of zooming vertically;
Without Zoom - back to the original size of the chart;
Zoom in Vertically - enlarge the chart;
Zoom out Vertically - reduce the chart;
Block Horizontal Zoom - block the possibility of zooming horizontally;
***
Read Lines group:
Main - display the single reading line;
Additional - display the additional reading line;
- run the window 'Read Lines Options';
***
Appearance group:
Legend - specify the colour of the legend;
Color Palette - select the colour palette for added graphs; the option provides: the
list of predefined palettes, user palette and default palette of the program;
Trend Background - specify the colour and gradient for the trend background
(chart area background and the background around it).
Chart Area Background - specify the colour and gradient for the chart
background; invisible background possible;
3D - activate 3D chart;
15
AsTrend
***
3D group (available if the command 3D is used):
3D Parameters - choose between orthogonal and 3D view;
- 3D view is subject to manipulation in space using parameters: rotation,
elevation, perspective, zoom, depth and view: front, right, left;
- orthogonal view is subject to manipulation using parameters: angle, depth and
view: orthogonal projection right (default), orthogonal projection left;
Left Wall - specify the colour, gradient and frame for the left wall in 3D/orthogonal
view; invisible left wall is also possible;
Right Wall - specify the colour, gradient and frame for the right wall in
3D/orthogonal view; invisible right wall is also possible;
Bottom Wall - specify the colour, gradient and frame for the bottom wall in
3D/orthogonal view; invisible bottom wall is also possible;
***
Chart Export group:
Copy to Clipboard - copy the graph and the legend to the clipboard; the legend is
included only if it is visible;
Save to BMP File - export the chart and the legend to the BMP file; the legend is
included only if it is visible;
Export Legend - export the legend to the file: XLS, HTML, text or insert the legend
in text form to the clipboard.
1.4.1.6 'Graph' Tab
Graph group:
Linear - set linear chart;
Bar - set bar chart;
Area - set area chart;
16
1 AsTrend - Functionality
Points - display measurement points for selected graphs; not available for the bar
chart;
Labels - display labels for selected graphs;
Stairs Interpolation - switch on stairs interpolation of selected graphs; not
available for the bar chart;
Line Width - set the line width of selected graph;
Transparency - set the transparency of selected graph;
Gradient Scale - set gradient scale for bar or area chart; range from -100 to 100;
values greater than 0 lighten the chart and values less than 0 darken the chart; 0
means no gradient;
Gradient Balance - set gradient balance for bar or area chart; range from 0 to
100; the option moves the graph gradient up or down; 50 means a steady gradient;
Gradient Upside-Down - swap the initial and final colour of the gradient; for bar
and area chart only;
Graph Depth - change the depth of the graph in the range from 5% to 100%; it
concerns the 3D chart;
Bar Width - change the width of the bar in the range from 5% to 100%; it
concerns the bar chart;
Bar Offset - move the bar horizontally in the range from -100% to 100%; it
concerns the bar chart;
Data from the Main Period of Time - set the option the graph contains the data
from the period specified by the main timeline;
Data from the Additional Period of Time - set the option the graph contains the
data from the period specified by the additional timeline;
Linear Axis Scale - use a linear scale for the vertical axis;
Logarithmic Axis Scale - use a logarithmic scale for the vertical axis; the axis
can be logarithmically scaled only if the range of the minimum and maximum is greater
than zero;
Vertical Axis on the Left Side of the Chart - set the OY axis on the left side of
the chart (for the Many OY Axes charts);
Vertical Axis on the Right Side of the Chart - set the OY axis on the right side
of the chart (for the Many OY Axes charts);
Vertical Axis Always on the Left Chart - set the OY axis on the left side of the chart (for
the Many OY Axes - Stack charts);
Vertical Axis on the Left or Right Side - set the OY axes on the left or right side of the
chart; the graph can be charted on the same chart with an adjacent graph - if they both have
applied the option. For example, if 8 graphs have applied this option, they will be charted in pairs
on one chart - in total it will be 4 charts (one above the other);
Range - set the range for selected variable;
Graph Attributes - display the current values of attributes from VarDef (variable
definition database);
17
AsTrend
- run the window 'Graph Options' with the possibility of defining graph options.
***
Graph Operations group:
Copy - do a copy of the graph;
Exchange - exchange the chart variable;
Hide - hide the graph of selected variable;
Replace with Empty - exchange selected in the legend graph line on a blank line;
Move Up - move the row of selected graph one up;
Move Down - move the row of selected graph one down;
Select All - select all graphs;
1.4.1.7 'View' Tab
Window group:
Window Size Block - block the ability to resize trend window,
Historical Data Table Mode - switch trend window to historical data table mode;
***
Panels group:
Chart - enable/disable to display the chart area in AsTrend window,
Legend - enable/disable to display the legend in AsTrend window,
Select Legend Columns - run the window 'Legend columns selection',
Restore Captions - restore default headers of attributes from the variable
definition database,
Data Table - call / hide the data table,
Periods Clipboard - display the period clipboard window,
***
18
1 AsTrend - Functionality
Style group:
Window and Controls - run the list of available AsTrend window styles: System,
Flat, UltraFlat, Standard, Office 2003,
Ribbon - run the list of available ribbon colour options and the option to reset the
button layout,
Buttons Layout of the Operator - run the button layout for the Operator; the
option is available when AsTrend is run with Asix application and the current user is
logged in with AsTrend administrator permissions.
***
Security group - available when AsTrend is run with Asix application:
Administrator Mode - switch to the administrator mode,
Administrator Password Change - run the window to change the administrator
pasword.
1.4.1.8 'Help' Tab
Help Topics - open help file,
About - display information on AsTrend.
1.4.1.9 'Table' Tab
The tab is available when you switch on (by the button
in tabular mode.
) displaying a current data
19
AsTrend
Columns group:
Single Time Column - switch on table view mode with one common time column
and many value columns.
Quality Columns - switch on table view mode with quality coumns;
***
Cursor Binding group:
No Binding - change of active row in the table will not change the position of read
line;
To Main Read Line - change of active row in the table will result in changing the
position of main read line; the option is relevant only if the main read line is active;
To Additional Read Line - change of active row in the table will result in changing
the position of additional read line; the option is relevant if the additional read line is
active.
***
Records group:
Samples by Timeline - activates a variant in which all the samples of graphs are
arranged according to the time axis;
Samples One by One - activates a variant in which all the sample of graphs are
arranged one after the other;
***
Informations group:
Data - display informations on data types in the table and how the data is
displayed;
20
1 AsTrend - Functionality
1.4.1.10 Ribbon Layout Management
While using Asix.Evo, AsTrend ribbon is fully configurable for users with the privilege
to own private menu and toolbar.
***
While using Asix in classical version, AsTrend ribbon is fully configurable separately
for Administrator an Operator.
Only Administrator can define its own ribbon layout and the layout for Operator.
***
While using Asix in classical version with user privileges defined in AsAudit
module, AsTrend ribbon is fully configurable for users with the privilege to own private
menu and toolbar.
***
While using AsTrend independently of Asix application, independent AsTrend
ribbon layout is defined for each user of operating system.
21
AsTrend
1.4.2 Chart Area
Chart area is located directly below the ribbon.
Fig. Chart Area.
Operations that may be performed directly within the chart area include:
•
•
•
•
•
•
•
change the period of displayed data,
read values and time,
drag-and-drop read line within the chart area,
drag a selected region boundary to grow the region,
select the variable,
change the OY axis display parameters,
call functions placed in the context menu.
1.4.3 Legend
Chart legend is located beneath the chart area.
When no variable is declared, the legend displays only heading with one row with the text; "<No
data to display>".
The height of the legend is rounded to the total rows. You have the possibility to change the
height of the legend.
The legend area can not exceed 3/4 of the main window area. If the legend is larger than 3/4 of
the main window - scroll bar appears.
The legend may include the following types of fields:
22
1 AsTrend - Functionality
1.
2.
3.
4.
5.
Aggregates
Trend
Read line
VarDef - standard
VarDef - non-standard (declared by the user)
By default, names and parameters of variables displayed in each row of the legend have colours
corresponding to the graph colours on the chart. (More in: 2.6 Operations in the Legend Area).
NOTICE: The legend with previously declared variables is displayed properly after AsTrend file
opening even if there is no access to the variable definition database. This is because during
adding a new variable to the chart, AsTrend reads all the attributes of the variable from the
variable definition database and stores them in the file.
Fig. Legend.
23
AsTrend
1.4.4 Pasek statusu
Status bar is located beneath the legend. It is always visible.
Fig. Status Bar.
24
1 AsTrend - Functionality
1.5 Data Types of Graphs
The maximum number of graphs added to the chart is 32.
The following data can be charted:
- Asix system application:
- row data of a process variable,
- aggregated data of a process variable,
- bit of a variable,
- alarm - alarm (from the application of classical version of Asix system) the event
archive of which is stored in binary files, and definition is stored in a text file or variable
definition database (mdb or MS SQL),
- SQL alarm - alarm (from the application of classical version of Asix or from Asix.Evo
system), the event archive of which is stored in MS SQL database, and definition in a
variable definition database (mdb or MS SQL),
- data from Asix archive file - variable data exported with the use of AspadTools
module,
- data calculated from values of other variables,
- external sources,
- OPC-HDA server,
- constant,
- empty - used as a separator in the legend and in the mode of historical data table.
Each variable can be treated as an analog or binary variable.
Each alarm is treated as a binary variable. It has a separate line in the legend and a separate OY
axis over the analoques chart.
An exemplary chart of alarms:
Fig. Chart o Alarms (red - alarm the event archive of which is stored in binary files; green - alarm
the events of which are stored in MS SQL database).
25
AsTrend
1.6 Chart Types Depending on the Axis Type
AsTrend may chart variables using the following axis types:
-
single physical axis,
proportional axis,
many OY axes,
many OY axes - stack,
XY axes.
Each type is presented in following chapters.
1.6.1 Chart with a Single Physical Axis
Chart with a single physical axis is a default one. The OY axis displays real values of the graph in
the range that can be set by the operator.
It is possible to scale the physical axis by using display range of graph values. The minimum and
maximum of OY axis display range take the values from display range of the graph (the values are
retrieved from the variable definition database, but they can also be individually set in AsTrend).
Display ranges of all the graphs displayed at the same chart are taken into account when scalling
physical axis.
It is also possible to scale the physical axis by using measurement range of graph values. The
minimum and maximum of OY axis measurement range take the values from measurement range of
the graph (the values are retrieved from the variable definition database, but they can also be
individually set in AsTrend).
For charts with physical axis AsTrend allows to display the names of states as labels of OY values
axis.
Fig. Chart with a Single Physical Axis.
26
1 AsTrend - Functionality
Fig. Names of States as Labels of OY Value Axis.
1.6.2 Chart with Proportional Axis
In charts with proportional axis the OY axis is on the right side and the proportional axis - on the
left side of the chart area.
Fig. Chart with Proportional Axis.
27
AsTrend
1.6.3 Chart with Many OY Axes
Wykres z wieloma osiami wartości OY pozwala wyświetlić indywidualną oś wartości dla każdego
przebiegu. Oś przyjmuje kolor danego przebiegu i może być wyświetlona po lewej lub prawej stronie
obszaru wykresu.
Fig. Chart with Many OY Axes.
28
1 AsTrend - Functionality
1.6.4 Chart with Many OY Axes - Stack
Chart with many OY axes in stack alows to display individual value axis for each graph. The axis
takes the colour of the graph and is located on the left side of the chart area.
Additionally, it is possible to display 2 adjacent graphs with one common axis. It is useful
when area of the chart should be organized for better legibility. This option is activated in
the options of adjacent graphs which are to be displayed on a common graph. Such a
graph has two OY axes displayed on the left and on the right side of the chart area.
Fig. Chart with Many OY Axes - Stack.
29
AsTrend
Fig. Chart with Many OY Axes - Stack with the Option of Displaying 2 Adjacent Graphs with
One Common Axis.
30
1 AsTrend - Functionality
1.6.5 Chart with XY Axes
AsTrend can create the chart being the function of two asix variables. For each chart point, one can
display the label containing:
- point time stamp,
- graph point number,
- values of samples.
Fig. Chart with XY Axes.
31
AsTrend
Fig. Window 'Trend Options' > 'Axes' Tab - Labels on XY Chart.
32
1 AsTrend - Functionality
1.7 Chart Types Depending on the Type/Appearance of a Graph
The following chart types due to the appearance of a graph are available in AsTrend:
•
•
•
•
linear,
bar,
area,
of binary variables.
One ot the chart type (linear, by default) is continupusly selected and is used while adding new
variables to che chart.
You can also change the existing chart type. To do this, first select a variable which type of chart
you want to change, then press one of the type changing buttons.
Each of chart types can be displayed in 3D version.
33
AsTrend
1.8 Aggregation of Asix System Data
Time of drawing the chart can be accelerated by the use of archiving of aggregated data, without
the need of changing any settings by the AsTrend operator. Charts are first drawn on the basis of
aggregated values retrieved from Asix server archive, and if no such an archive is available aggregated values are calculated on-line.
AsTrend selects the aggregation period and beginning of displaying data automatically according
to the horizon of displayed chart. For example, if archived aggregated values were calculated from
1.00 PM, and you declare the horizon of displaying data starting with 1.05 PM - then AsTrend will
use the aggregated values which are closest to the horizon set by you (data calculated since 1.00
PM).
Parameterization of calculating and archiving aggregated values is performed by the Asix
application designed in the Asix system configurator - Architect module.
1.8.1 Aggregates - a New Source of Statistical Data Analysis
AsTrend user has access to extensive set of values aggregated on-demand for all data from any
horizon
time - all this for the purpose of effective analysis:
The list of aggregation functions includes the following items:
- Start - value at the beginning of interval
- End - value at the end of interval
- Delta - difference between the value at the end and beginning of interval
- Min - minimal value in interval
- Max - maximal value in interval
- Range - difference between maximal and minimal value in interval
- Total - sum of time weighted values in interval (time integral)
- Average - average form time weighted values in interval
- Average0 - average from time weighted values in interval; for periods when value of
variables is not accessible; 0 value is used;
- Quality_Good - percentage of samples with good quality in interval
- Quality_Uncertain - percentage of samples with uncertain quality in interval
- Quality_Bad - percentage of samples with bad quality in interval
- Quality_Good_Duration - the duration (in seconds) of time in the interval during which
the data is of good quality
- Quality_Uncertain_Duration - the duration (in seconds) of time in the interval during
which the data is of uncertain quality
- Quality_Bad_Duration - the duration (in seconds) of time in the interval duing which
the data is of bad quality
- Sum_Up - the sum of positive value of changes from the last known value before the
beginning up to the last value before the end of the resample interval.
For the types FLOAT, DOUBLE and INT64 result is stored as FLOAT, for other types as
LONG.
34
1 AsTrend - Functionality
Sum_up can be used to calculate the number of starts. All you need in this case is to
aggregate a variable that takes the value of 0 when device is turned off, and the value of 1
when turned on.
- Sum_Down - the sum of negative value of changes from the last known value before
the beginning up to the last value before the end of the resample interval.
For the types FLOAT, DOUBLE and INT64 result is stored as FLOAT, for other types as
LONG.
Sum_up can be used to calculate the number of stops. All you need in this case is to
aggregate a variable that takes the value of 0 when device is turned off, and the value of 1
when turned on.
- Previous_Known - the last known value before the beginning of the resample interval.
For the types FLOAT, DOUBLE and INT64 result is stored as FLOAT, for other types as
LONG.
- Last - the last known value in the resample interval, not including the end of the interval.
For the types FLOAT, DOUBLE and INT64 result is stored as FLOAT, for other types as
LONG.
- Standard_Deviation - time weighted standard deviation of the data over the resample
interval. The result is always FLOAT.
- Root_Mean_Square - time weighted rms of data over the resample interval. The result
is always FLOAT.
- Average_Last_Known - time weighted average data over the resample interval; treat
bad values as continuation of last known value. The result is always FLOAT.
Average_Last_Known is a better solution for variables which have constant value in long
periods, e.g. device operation signal, than Average is.
- Total_Last_Known - totalized value (time integral) of the data over the resample
interval; treat bad value as continuation of last known value
One of the way of using Total_Last_Known is calculation of the time of device operation. All
you need is to aggregate a variable that takes the value of 0 when device is turned off, and
the value of 1 when turned on. The result will be the operation time in seconds.
The aggregates can be used for two purposes:
1. to calculate and display the graph values aggregated in a given time horizon;
2. to calculate aggregated values on the basis of data from the time period currently displayed on
the chart and display these values in the fields of the legend.
•
in the first case, the user determines oneself the type of aggregation function used to read
the data (regardless of the chart data type: genuine, uniform, approximated, averaged) as
well as the period (interval) of aggregation function, which is the basis for calculating the
successive aggregated values. With Aggregator (the Asix system module to calculate and
archive statistical data), the data is calculated by the Asix server, where calculated by the
•
in the second case, the aggregated values are calculated locally by the Astrend program for
the values displayed on the graph over a given time horizon (regardless of the chart data
type: genuine, uniform, approximated, averaged). Aggregated values are displayed in the
legend fields.
35
AsTrend
1.9 Mode of Historical Data Table
AsTrend allows you to view historical data in a tabular mode as well. It is run with one button that
allows you to switch the program to interface designed to support the table.
Mode of historical data table is saved in the *.trnx file by the person logged in as an Administrator
of AsTrend. Opening the file by the person with the privileges of Operator of AsTrend switches
AsTrend into the mode of historical data table and displayes Administrator-defined variables and
columns.
Each table record presents the values of selected attributes of a variable and the variable value
from a given point of time. Navigation between the variable values from different points of time is
performed with the use of navigation buttons.
Fig. AsTrend - Mode of Historical Data Table.
36
2 AsTrend - Operation
2 AsTrend - Operation
The program may be used very easily. Typical activities include:
•
•
•
•
display the defined trends
perform some operations on the trends
print the displayed charts
define new trends.
Defining new trends can be performed with the built-in wizard.
2.1 Starting the Program
Starting the Program with the Asix Application
In the former mode the program is started by the Asix system. The apllication designer
designs the set of predefined trends and database of variable definitions. The users may
browse the pre-defined trends, perform operations on them, and define own trends in
the directory defined by the application designer.
The program may be started (while the application is loaded) with the use of a special
parameter that the application developer puts in the application configuration file.
The way you open the AsTrend file from the running application is executing the
following operator action:
- ASTREND, parameterized by the application designer (in classical Asix);
- AstrendDisplay, parameterized by the application designer (in Asix.Evo).
Uruchamianie programu AsTrend bez aplikacji systemu Asix
In the second mode, it is assumed that AsTrend is used alone and started at any time
by the user.
It is possible to run more instances of AsTrend program.
The user decides which trends are to be displayed and usually defines them by oneself.
Use the following command to start the program alone:
37
AsTrend
Astrend.exe [trend_definition] [-iMDBdatabase_filename] [iMSSQL_database_servername / MSSQL_database_name]
where:
trend_definition
- optional pathname to a file (*.TRN or *.TRNX extension)
that contains trend definition to be displayed once the
program starts;
-iMDBdatabase_filename
- optional pathname to a file with database of variable
definitions (in the Jet format);
-iMSSQL_database_servername / MSSQL_database_name - optional pathname to a file
with database of variable definitions in the MSSQL format;
The trend_definition filename may be appended by a list of names of variables that
are to be displayed along with the variables declared in the trend definition (.trnx, .trn).
Names on the list must be separated by the ‘ # ’ or ‘ < ’ character.
There is no need to open the database of variable definitions in order to browse predefined trends.
38
2 AsTrend - Operation
2.2 Help System
Help system is available in the following location:
AsTrend main window > Help tab > Help Topics command.
39
AsTrend
2.3 Modification of the Ribbon Contents
It is possible to modify the ribbon. By default, the Operator does not have such
privileges, but there is a possibility to give him the privilege to have own menu layout.
When you start the program by the first time the default ribbon layout will load:
Fig. Default Ribbon Layout.
To change the main ribbon layout:
1. Righr-click in the tab, and then select the command More Commands...;
2. The window 'Customize' will appear - it allows to select commands:
40
2 AsTrend - Operation
Fig. The Window 'Customize'.
3. When you open the window 'Customize', it is possible to configure any content of the
AsTrend main window tabs. In the Categories group search the command you need and
'drag' it to the tab of AsTrend window:
Fig. Configuration of the AsTrend Main Window Tab.
41
AsTrend
4. You can restore the default layout of buttonf with the use oc the command Reset
the Layout of the Buttons.
Fig. Commands to Manage the Ribbon.
42
2 AsTrend - Operation
2.4 Trend Wizard
Kreator trendów jest funkcją skierowaną do osób, które chciałyby zdefiniować trend,
a nigdy wcześniej tego nie robiły.
Trend wizard can be run by the command New - Wizard...
button
from the AsTrend
list.
Obligatory steps must be performed to go to next step.
43
AsTrend
2.5 Operations in the Chart Area
Operations that may be performed directly within the chart area include:
•
•
drag-and-drop the time axis and change the data display period;
point with the mouse to a chart point to display the point data (time, value) in the
status bar;
•
drag-and-drop the read line (use the button
•
•
•
•
to display one read line; use the
butoon
to display two read lines);
drag a selected region boundary by the left button of the mouse to grow the
region;
click a variable graph to select the variable;
click an OY axis to modify its parameters;
click by the right mouse button a point within chart area to display context menu.
Fig. Context Menu in the Chart Area.
•
the function Show Chart Even Outside the Axis (main AsTrend window >
Chart tab > Chart Type group > window 'Trend Options' run with the button
> Axes tab) causes the graphs and labels are not cut to the chart size. It is
useful when the graph line coincides with the OY axis or is located at the upper
boundary line of the graph. Also 3D chart looks better with attached option of
drawing outside the axes of the graph.
44
2 AsTrend - Operation
2.6 Operations in the Legend Area
Operations available directly within the legend area include:
•
Display the legend using the button Legend located in: AsTrend main window >
Chart tab > Appearance group.
•
Change the legend height by grabbing by the cursor the edge separating the
legend from the chart area; the height of the legend is rounded to the whole
number of rows.
•
Point by the mouse a field to display the entire field contents (displayed until
mouse pointer is moved away):
Fig. Displaying the entire field contents.
•
Open the window by double click in the range field to change the variable range:
45
AsTrend
Fig. Graph Options - Ranges.
•
Display context menu by double click in the legend area:
Fig. Context Menu in the Legend.
46
2 AsTrend - Operation
Raw Data - add a graph of raw data from Asix application;
Copy - do a copy of the graph;
Remove Selected - clear the currently selected variable;
Replace with Empty - exchange selected in the legend graph line on a blank
line;
Hide - hide the graph of selected variable;
Select All - select all graphs;
Move Up - move the row of selected graph one up;
Move Down - move the row of selected graph one down;
Graph Attributes - display the current values of attributes from VarDef
(variable definition database);
Exchange - exchange the chart variable;
Range - set the range for selected variable;
Points - display measurement points for selected graphs; not available for the
bar chart;
Labels - display labels for selected graphs;
Select Legend Columns - run the window 'Legend Column Selection';
Kolor tła - uruchamia okno 'Opcje trendu' z możliwością zdefiniowania własnej
palety kolorów dla trendu;
Legend Options... - run the window 'Trend Options' with the possibility of
defining the legend appearance.
•
Change caption text (right clicl in the caption of celected legend column):
Fig. Changing the Caption Text.
47
AsTrend
•
Change the colour of variable names and parameters in each legend row. By
default, the data displayed in raws have the colours.
•
The user can select which fields are to be displayed in the legend, using the list
box dropped down by the button . When you press the button , the window
'Legend Column Selection' will appear. You can remove fields using the method
'Drag-and-Drop'.
Legend fields:
•
Data aggregated by the following functions:
Start - value at the beginning of interval
End - value at the end of interval
Delta - difference between the value at the end and beginning of interval
Min - minimal value in interval
Max - maximal value in interval
Range - difference between maximal and minimal value in interval
Total - sum of time weighted values in interval (time integral)
Average - average form time weighted values in interval
Average0 - average from time weighted values in interval; for periods when value of
variables is not accessible; 0 value is used;
Quality_Good - percentage of samples with good quality in interval
Quality_Uncertain - percentage of samples with uncertain quality in interval
Quality_Bad - percentage of samples with bad quality in interval
Quality_Good_Duration - the duration (in seconds) of time in the interval during which
the data is of good quality
Quality_Uncertain_Duration - the duration (in seconds) of time in the interval during
which the data is of uncertain quality
Quality_Bad_Duration - the duration (in seconds) of time in the interval duing which the
data is of bad quality
Sum_Up - the sum of positive value of changes from the last known value before the
beginning up to the last value before the end of the resample interval.
For the types FLOAT, DOUBLE and INT64 result is stored as FLOAT, for other types as
LONG.
Sum_up can be used to calculate the number of starts. All you need in this case is to
aggregate a variable that takes the value of 0 when device is turned off, and the value of 1
when turned on.
Sum_Down - the sum of negative value of changes from the last known value before the
beginning up to the last value before the end of the resample interval.
For the types FLOAT, DOUBLE and INT64 result is stored as FLOAT, for other types as
LONG.
Sum_up can be used to calculate the number of stops. All you need in this case is to
aggregate a variable that takes the value of 0 when device is turned off, and the value of 1
when turned on.
Previous_Known - the last known value before the beginning of the resample interval.
For the types FLOAT, DOUBLE and INT64 result is stored as FLOAT, for other types as
LONG.
Last - the last known value in the resample interval, not including the end of the interval.
For the types FLOAT, DOUBLE and INT64 result is stored as FLOAT, for other types as
LONG.
48
2 AsTrend - Operation
Standard_Deviation - time weighted standard deviation of the data over the resample
interval. The result is always FLOAT.
Root_Mean_Square - time weighted rms of data over the resample interval. The result is
always FLOAT.
Average_Last_Known - time weighted average data over the resample interval; treat
bad values as continuation of last known value. The result is always FLOAT.
Average_Last_Known is a better solution for variables which have constant value in long
periods, e.g. device operation signal, than Average is.
Total_Last_Known - totalized value (time integral) of the data over the resample
interval; treat bad value as continuation of last known value
One of the way of using Total_Last_Known is calculation of the time of device operation. All
you need is to aggregate a variable that takes the value of 0 when device is turned off, and
the value of 1 when turned on. The result will be the operation time in seconds.
•
Trend:
Measurement Range - graph display range.
Precision - precision of graph values displayed in the legend.
Graph Colour - graph colour used in the chart and legend.
Sample Count - number of samples read.
Data Type - sampling interval and mode.
•
Read line:
Time of Read Line 1 - main read line position at time axis.
Time of Read Line 2 - additional read line position at time axis.
Sample Time of Read Line 1 - timestamp of the first sample on the left from
the main read line.
Sample Time of Read Line 2 - timestamp of the first sample on the left from
the additional read line.
Sample Quality of Read Line 1 - quality of the first sample on the left from
the main read line.
Sample Quality of Read Line 2 - quality of the first sample on the left from
the additional read line.
Read Line Distance - distance between two read lines.
Sample Value of Read Line 1 - value of the first sample on the left from the
main read line.
Sample Value of Read Line 2 - value of the first sample on the left from the
additional read line.
Approximate Value of Read Line 1 - estimated graph value at main read
line position.
Approximate Value of Read Line 2 - estimated graph value at additional
read line position.
•
VarDef - non-standard: variable definition database fields declared by the
application designer.
•
VarDef - standard: pre-defined variable definition database fields.
Table 1. List of System Attributes of the Vvariable Definitions Database (for
the applications of Asix.Evo and classical Asix).
NOTICE: Differences in interpretation of the attributes for the Asix.Evo
application you can find in the table 1a (following the table 1).
49
Table 1. List of System Attributes of the Vvariable Definitions Database (for the applications of Asix.Evo and classical Asix)
Internal name of the
variable attribute (PL)
Attribute type
Nazwa
mandatory
Opis
mandatory
Kanał
Default name
displayed in the
header (PL)
Nazwa
Internal name of the
variable attribute (EN)
Default name displayed
in the header (EN)
Type
Name
Name
T
Opis
Description
Description
T
mandatory
Kanał
Channel
Channel
T
Adres
mandatory
Adres
Address
Address
T
LiczbaElementow
mandatory
Liczba elementów
ElementsCount
Elements count
N
OkresProbkowania
mandatory
Okres próbkowania
SampleRate
Sample rate
N
FunkcjaPrzeliczajaca
mandatory
Funkcja przeliczająca
ConversionFunction
Conversion function
T
Archiwum
mandatory
Archiwum
Archive
Archive
T
ParametryArchiwizacji
mandatory
Parametry archiwizacji
ArchivingParameters
Archiving parameters
T
Grupa1
optional
Grupa1
Group1
Group1
T
Format
optional
Format
Format
Format
T
Jednostka
ZakresPomiarowyOd
optional
optional
Jednostka
Zakres pomiarowy od
ZakresPomiarowyHi
optional
Zakres pomiarowy do
Unit
Unit
MeasurementRangeFrom Measurement range from
MeasurementRangeTo
Measurement range to
T
N
N
Description
Unique symbolic name of the
process variable univocally
identifying the variable for all
asix system components
A custom text e.g. containing the
technological description of
process variable
Logical name of the transmission
channel (one of the names given
in the transmission channel
declaration)
Symbolic address, whose form is
specific for each asix system
driver
Number of elements included in
the process variable (variable can
be an array)
Period of process variable value
updating (in seconds)
Name of conversion function used
to convert the value received
from the controller to the value
fed to asix system components
Name of ASPAD resource (logical
name of archive resource)
Parameters of archiving of the
given variable
Grouping attribute, generated by
default
Format of the number, used for
displaying in asix system; the
format is given in the manner
required by C language (e.g.
%4t2f is 4 digits, including 2
decimal digits
Physical variable unit
Maximum range, which can be
used – minimal value
Maximum range, which can be
used – maximal value
50
2 AsTrend - Operation
ZakresSurowyOd
optional
Zakres surowy od
RawRangeFrom
Raw range from
N
ZakresSurowyDo
optional
Zakres surowy do
RawRangeTo
Raw range to
N
ZakresPrzetwornikaOd
optional
Zakres przetwornika od
TransducerRangeFrom
Transducer range from
N
ZakresPrzetwornikaDo
optional
Zakres przetwornika do
TransducerRangeTo
Transducer range to
N
ZakresWyswietlaniaOd
optional
Zakres wyświetlania od
DisplayRangeFrom
Display range from
N
ZakresWyswietlaniaDo
optional
Zakres wyświetlania do
DisplayRangeTo
Display range to
N
ZakresSterowaniaOd
optional
Zakres sterowania od
SteeringRangeFrom
Steering range from
N
ZakresSterowaniaDo
optional
Zakres sterowania do
SteeringRangeTo
Steering range to
N
BazaSlupka
optional
Baza słupka
BarBase
Bar base
T
NazwyStanow
optional
Nazwy stanów
StateNames
State names
T
ZestawStanow
optional
Zestaw stanów
StateSet
State set
T
WartoscStanu
optional
Wartość stanu
StateValue
State value
T
MaskaZmiennejKontrolnej
optional
Maska zmiennej
kontrolnej
ControlVariableMask
Control Variable mask
T
ZmiennaKontrolna
optional
Zmienna kontrolna
ControlVariable
Control variable
T
LimitLoLo
optional
Minimum krytyczne
LimitLoLo
Limit LoLo
T
LimitLo
optional
Minimum
LimitLo
Limit Lo
T
Conversion function parameter –
input range from …
Conversion function parameter –
input range to …
Transducer range – minimal
value
Transducer range – maximal
value
Lower range limit for displaying
the given variable – for asix
objects
Upper range limit for displaying
the given variable – for asix
objects
Lower range limit for the value of
the given variable set from asix
Upper range limit for the value of
the given variable set from asix
Size loaded from the database by
the BAR object
Name of the set of texts or
directly - the set of description of
variable states (specific full
values)
Name of the set of state
descriptions, where the current
line belongs to. Attribute used
only for lines including the state
description set element.
Number of state, whose
description is used in the current
line. Attribute used only for lines
including the state description set
element.
Indicator of the status bit
signaled by the control variable
Name of variable representing
the measurement variable status
Name of asix system variable
containing the critical minimal
value for the measurement
variable
Name of asix system variable
containing the minimal value for
the measurement variable
51
AsTrend
LimitHi
optional
Maksimum
LimitHi
Limit Hi
T
LimitHiHi
optional
Maksimum krytyczne
LimitHiHi
Limit HiHi
T
ZakresWyswietlaniaKrok
optional
Zakres wyświetlania
krok
DisplayRangeStep
Display range step
L
ZakresWyswietlaniaSzer
optional
Zakres wyświetlania
szerokość
DisplayRangeWidth
Display range width
L
ZakresWyswietlaniaPodzia
l
optional
Zakres wyświetlania
podział
DisplayRangeDivision
Display range division
L
Dokladnosc
optional
Dokładność
Precision
Precision
T
PolozenieSuwaka
optional
Położenie suwaka
SliderPosition
Slider position
T
RejestracjaSterowania
optional
Rejestracja sterowania
ControlLogging
Control logging
Logical
value
ZmiennaNieaktywna
optional
Zmienna nieaktywna
ItemNotActive
Item not active
Logical
value
WykresTytul
optional
Tytuł wykresu
ChartTitle
Chart title
T
ZakresSlupkaOd
optional
Zakres słupka od
BarRangeFrom
Bar range from
T
52
Name of asix system variable
containing the maximal value for
the measurement variable
Name of asix system variable
containing the critical maximal
value for the measurement
variable
It is used by CHART object. It
means span of units of main
scale on OY axis (at how many
unit intervals the label will be
displayed on OY axis)
It is used by CHART object. It
means the width of value label
displayed on 0Y axis
It is used by CHART object. It
determines the segmentation of
main scale units defined by
DisplayRangeStep attribute into
smaller ones on 0Y axis
Rounding precision for the
NUMBER object. E.g. , if 10 is
given in this field, the number
will be rounded to full tens. By
default, rounding is disabled.
Name of variable, where the
values representing the position
of the SLIDER object during
moving of such slider will be
entered.
Value 1 means that control
actions of the variable are
registered in AsAudit module
If the attribute value is 1, the
variable is not visible in asix
system for Asmen and Aspad
It is used by CHART object. It is
used for object parameterization
– while defining the parameters
in CHART parameterization
window, the title of the chart is
retrieved from VarBase, from
definition of variable added to the
chart as first
It is used by BAR object. Lower
2 AsTrend - Operation
ZakresSlupkaDo
optional
Zakres słupka do
BarRangeTo
Bar range to
T
SzybkieOdswiezanie
optional
Szybkie odświeżanie
FastRefresh
Fast refresh
Logical
value
SprawdzanieZakresuPomiar
owego
optional
Sprawdzanie zakresu
pomiarowego
MeasurementRangeChe
ck
Measurement range
check
Logical
value
range limit for the value of the
given variable
It is used by BAR object. Upper
range limit for the value of the
given variable
It is used by CtTwinCATTcpip
driver from the version 1.3.5. The
variables with this parameter
declared have the possibility of
fast refresh with maksimal speed
of a link (it doesn't influence
archiving time)
The value of 1 menas that
overflows of measurement range
will be detected and signalled by
the special OPC status for specified
variable.
T –text, N – 64-bit floating point number
53
AsTrend
Tabela 1a. List of System Attributes of the Vvariable Definitions Database (for the applications of Asix.Evo)
Name
Value Type
Format
Readout conversion function
Record conversion function
54
Description
Specifies the variable value type in the Net. Convention. If the MDB
database without this attribute is used, it is virtually created based on the
converting function used in the variable definition and based on the
format.
The value text formatting method in the .Net Convention. A brief
description of the .Net format can be found in the
AsixEvo_Techniques_of_Diagram_Creation.pdf/chm manual.
In the case of MDB databases, the attribute is virtually created according
to the following principles:
a. If the database has the FormatEvo attribute, it is directly treated
as the Asix.Evo Format attribute definition.
b. If the database does not have the FormatEvo attribute, the
Format attribute of the MDB database (specified in the
convention of classic application formats) is translated into the
corresponding .Net format when loaded.
The attribute has the form of an expression that pre-calculates the
variable raw value loaded from a driver. The reference to the raw value is
performed in the expression contents using the RawValue function.
If the data server (Asix6 channel) is used, regardless of the attribute
definition of the function converting a readout, the variable value is
subject to the Asmen standard conversion, based on the
ConversionFunction attribute.
If the MDB database without the ReadConvertingFunction attribute is
used, it is virtually created based on the format used in the variable
definition.
The attribute has the form of an expression that calculates the control
value before sending it to the driver.
The rest of the rules are the same as for the ReadConvertingFunction
attribute.
2 AsTrend - Operation
2.7 Operations in the Status Bar
In individual fields of the status bar may apppear:
•
•
•
name of selected variable - in the field Selected Graph;
value of the time period to display values of variables - in the field Period;
number of measurements points displayed currently in the chart area - in the field
Points.
In status bar it is possible the following operation:
- click in the field Period opens the window of setting periods.
55
AsTrend
2.8 Selecting Variable Definition Database from the Asix System /
OPC Server
To select a variable definition database of the Asix system, press the button Asix Variables and Alarms
Archive group.
, available in: AsTrend main window > Data tab > Connection to
To select a database from the OPC server, press the button OPC HDA - Variables
available in: AsTrend main window > Data tab > Connection to Archive group.
The following windows will appear when pressing the above commands.
NOTICE: At AsTrend start-up the last used variable definition database opens.
Fig. Selection of Variable Definition Database.
56
,
2 AsTrend - Operation
Fig. Connection with OPC HDA Server.
57
AsTrend
2.9 Adding Graph Data to the Chart
2.9.1 Adding Graph Data from the Asix System Application
2.9.1.1 Adding a Raw Data
Name of the to-be-added variable may be selected in the variable selection window. To
open the window you may:
•
press the button
from: AsTrend main window > Home tab > New Graph tab;
•
press the button
or legend area.
from context menu called by click of right mouse button in the chart
Neither of the above listed capabilities is available unless a database of variable definitions is
open.
It is possible to add the same variable to one trend many times. It may have a sense, for
example, if we want to see the graph of a variable and the variable average, or the variable graph
in two time periods simultaneously.
Pressing the button
run the window 'Select Items’:
Fig. Variable Selection Window.
To select some variables in the ‘Select item’ window, first expand the group that contains that
variables on tree in the left segment of the window. List of all variables belonging to that group
appears in the right window segment.
To select some of them, highlight them on the list (hold down Ctrl key and click each of the tobe-selected variable), then click the OK button. Alternatively you may subsequently double click
each of the to-be-selected variables on the list.
58
2 AsTrend - Operation
If there are plenty of variables in a group, search and/or filter functions may be particularly
handy.
Each of the variable description column may be separately shown/hidden. To this end click the
button
located to the left of the column headers, set/clear respective checkboxes on the
displayed list of columns, then click some point outside the list.
***
To find a variable in the variable selection window:
•
•
•
•
on the tree expand the group that contains the variable;
click header of a column to sort records according to that column;
click any field in the selected column;
start to enter the variable name from the keyboard; after each entry the list of variables
is scrolled to the first record matching the so-far entered characters.
***
To use the filtering/grouping function, do as follows:
Use the Filtering and Grouping button to turn on the record filtering/grouping function. The
function must be turned on to be able to perform the below described operations.
Aby pogrupować zmienne według wartości danego atrybutu, należy przeciągnąć nagłówek
kolumny tego atrybutu na pasek znajdujący się ponad nagłówkami atrybutów.
Fig. Grouping by a Column.
To simply filter records by some value in a column, press the button
next to the column
header and select the desired value from the dropped down list of all values.
59
AsTrend
Fig. Filtering by a Column.
Use the button
located at the left bottom side of the value table to run filter wizard that
facilitates defining more complicated filters.
Fig. Filter Wizard.
60
2 AsTrend - Operation
2.9.1.2 Adding an Aggregated Data
Aggregated variable is a raw variable converted by an aggregation function. The period of time
between samples is constant and equal to the period of aggregation for the aggregated variable.
If the trend uses an uniform data, the period between the samples is as defined in the trend
configuration.
If your application has aggregates archiving engaged, using the interval of multiple minute may
significantly speed up data retrieval.
Adding an aggregated data to the AsTrend window is realized with the use of the button
Aggregated Data
the button
activated from: AsTrend main window > Home tab > New Graph group >
.
Parameterization includes:
-
Variable Name;
Aggregate Name;
IAggregate Interval;
Aggregate Timestamp (Beginning of interval, End of interval).
Fig. The Window 'Add Aggregated Graph.
61
AsTrend
2.9.1.3 Adding a Bit of a Variable
To add a bit of a variable, use the button
New Graph group > the button
The button
from: AsTrend main window > Home tab >
.
runs the window in which you have to determine:
- Variable name,
- Attributes Retrieved from Bit Definition which are to be displayed in the legend:
- Only Description - in the legend, in the description column the description of the
variable bit will be displayed; in other attribute columns the variable attribute values will be
displayed;
- Only Description Merged with Variable Description - in the legend, in the description
column the description of the variable bit merged with the variable description will be
displayed; in other attribute columns the variable attribute values will be displayed;
- All - in the legend, in the columns of all attributes the values of variable attributes will be
displayed; the ability to retrieve all the attributes from a bit definition is blocked if the
database does not have the attribute State Names defined.
Fig. The Window 'Add Bits of Status Variable'.
62
2 AsTrend - Operation
Fig. Chart of Variable Bits.
2.9.1.4 Adding an Alarm
AsTrend can retrieve alarm definitions directly from the Asix application or variable definition
database (in MS SQL or MDB). It is recommended to store alarm definitions in the variable
definition database - it makes it much easier to identify the alarm the graph of which is to be
displayed in AsTrend.
NOTICE: Adding an alarm by the button
application.
referres only to the alarms of classical Asix
NOTICE: For alarms of Asix.Evo applications use the option of adding alarms that are stored in
the SQL database - see: the chapter 2.9.1.5 Adding an SQL Alarm.
***
If the variable definition database does not contain alarm definitions, the alarms
are added to the trend by the windows 'Add Alarm' called by the button
main window > Home tab > New Graph group.
from: AsTrend
63
AsTrend
Fig. The Window 'Add Alarm'.
***
If the variable definition database contains alarm definitions, the alarms are added
to the trend by the windows 'Select Alarms' called by the button
window > Home tab > New Graph group.
Fig. The Window 'Select Alarms'.
64
from: AsTrend main
2 AsTrend - Operation
2.9.1.5 Adding an SQL ALarm
NOTICE:
Adding SQL alarms applies only to alarms the event archives of which are stored in SQL database
(of classical as well as Asix.Evo applications). This requires that in addition to archiving in disk files
the alarm events will archive in an SQL database.
If the variable definition database contains alarm definitions, the SQL alarms are
added to the trend by the windows 'Select Alarms’ run by the button
window > Home tab > New Graph group > Asix button.
from: AsTrend main
Fig. Adding SQL Alarms.
2.9.1.6 Adding a Graph from the Clipboard
To make possible to add variables from the clipboard, it must contain the names of the variables in
text format. Allowable separators of variable names there are: newline character, tab, comma,
semicolon and the system list separator. Added variables must be defined in the currently opened
variable definition database.
65
AsTrend
Variable names can be added to the clipboard as follows
- setting the mouse cursor over any object on the Asix application diagram and then press Ctrl + C
(applies to the classic version of Asix; in the case of Asix.Evo you have to define the shortcut key,
in particular Ctrl+C, performing the operator action GetVarNames),
- by selecting the command Add Variable Names to Clipboard from the variable selection
window of the Architect program, in the local menu,
- by selecting the variable name from any text document and copying it to the clipboard.
The variable names stored in the variable definition database are added to the trend
from the clipboard by using the command
New Graph group > the button
from: AsTrend main window > Home tab >
.
2.9.1.7 Adding a Variable from the Asix Archive File
To add a variable from the Asix archive file is to read the variable data exported in the AspadTools
program into the AsTrend.
The Asix archive data are loaded into AsTrend by using the window 'Add Variables
from an Asix archive file' loaded by the command
> New Graph group > the button
from: AsTrend main window > Home tab
.
Description of the use of AspadTools is available by pressing the Info button in the window 'Add
Variables from an Asix archive file'.
Fig. The Window 'Add Variables from an Asix Archive File'.
66
2 AsTrend - Operation
2.9.1.8 Adding a Calculated Variable
Graphs of data calculated from values of variables using specified expressions are
added by the window 'Add Calculated Graph' run by the command
window > Home tab > New Graph group.
from: AsTrend main
The window contains tabs, so that the user can declare attributes of calculated graph and
construct expression, according to which the variable data will be calculated.
The tab Attributes allows you to declare:
- Name, Description, Unit.
Fig. The Window 'Add Calculated Graph' - 'Attributes' Tab.
***
The tab Calculated Expression includes:
- Expression - expression to calculate the variable; to faciliate the construction of expressions,
use the window activated by the button Insert;
- Parameters - declare the result as a Boolean variable and specify the interval for the input
variables;
- Expression Test - verify the correctness of the expression by pressing the button Chect; if the
expression is correct, the window with the message "Correct" appears;
- Input Graphs - enter the variables of variable definition database used to calculate the value
points of calculated graph; the button
run the window 'Select Items’; the button
67
AsTrend
displays the metric of selected variable; maximum number of variables used to calculate a graph
eguals 50.
Fig. The Window 'Add Calculated Graph' - 'Calculated Expression' Tab.
***
The tab Ranges includes the fields for declaring the measurement and display ranges of
calculated variable:
Fig. The Window 'Add Calculated Graph' - 'Ranges' Tab.
68
2 AsTrend - Operation
***
The tab Data includes:
- Period of Time from Which Data Is Displayed - use an additional period of time - then one
can simultaneously display data from two different periods of time; if one or more graphs use an
additional period of time: the second axis of time is displayed above the chart, possibility of
editing additional period appears in the period editor; if only one graph uses an additional period
of time, second axis of time is in the colour of this graph.
- Graph Data Type: Aggregated Data:
- Aggregate Name;
- Aggregate Calculating Interval;
- Aggregate Timestamp.
Fig. The Window 'Add Calculated Graph' - 'Data' Tab.
***
The tab Value Format:
- is used during formatting floating point values displayed in the legend, table and exported to a
text file; the option doesn't apply to attributes: Total Value, Gradient Value, Value Range, Delta
Value, Quality Good, Quality Uncertain and Quality Bad which are always rounded to four
significant digits;
- allows to display the aggregate 'total' using the format d h:mm:ss.
69
AsTrend
Fig. The Window 'Add Calculated Graph' - 'Value Format' Tab.
***
The tab Value Labels includes the editor that allows to define text labels of values; this
labels are used instead of numeric values:
- in the chart: hints and labels of points;
- in the legend: Sample Value of Read Line 1 / Sample Value of Read Line 2 columns;
- in vertical axis: in case of many OY axes or percentage chart; in case of physical axis the labels
will be displayed only if they are identical for all graphs.
Fig. The Window 'Add Calculated Graph' - 'Value Labels' Tab.
70
2 AsTrend - Operation
2.9.2 Adding a Constant
It is possible to put into the chart constant value displayed as a horizontal line or an
area.
The constant is added by the command
Home tab > New Graph group.
from: AsTrend main windows >
The window 'Add Constant Graph' includes the following tabs with constant
atributes:
The tab Attributes allows you to specify basic attributes of a constant:
- Name - name of a constant;
- Description - description of a constant;
- Unit - unit of a constant;
Fig. The Window 'Add Constant Graph' - the 'Attributes' Tab.
***
71
AsTrend
The tab Value allows you to declare a constant value:
- Expression - expression to calculate the value of a constant; to make it easier use
the window of the library with functions, operators and constants, activated by the
button Insert...;
- Expression Test - check expression syntax by pressing the button Check; if the
syntax is correct, the window with the message "Correct" will appear;
***
Fig. The Window 'Add Constant Graph' - the 'Value' Tab.
***
The Ranges tab includes the fields for determining the measurement and display
ranges for a calculated variable:
- Display Range - display range is used for scalling the physical axis and the axis of
individual graph on Many OY Axes chart (notice: you have to set the options Minimal
Displaying Range and Maximal Display Range as the minimum and maximum in
the physical OY axis settings: AsTrend main window > Chart tab > Axes group >
'Trend Axes Options' window activated by the button
> Physical OY Axis tab).
The range 0-0 means the absence of display range - then the physical axis range will
be calculated based on the current values of the samples.
Notice: for scaling physical axis the display ranges of all the graphs are taken into
account, for example: minimum can be set on the basis of the least one from minimal
values defined for graphs and maximum on the basis of the highest one from maximal
72
2 AsTrend - Operation
values. If not all of the graphs have ranges defined, the range is determined
automatically.
- Measurement Range - measurement range is used for checking correctness of
graph sample values; the values of samples that exceed the graph range by the
number equal to the graph range are cut off. The range 0-1 for total value Asix system
variable means that the variable is treated as a binary value.
The measurement range may also be used for scaling the physical axis (notice: you
have to set the options Minimal Measurement Range and Maximal Measurement
Range as the minimum and maximum in the physical OY axis settings: AsTrend main
window > Chart tab > Axes group > 'Trend Axes Options' window activated by the
button
> Physical OY Axis tab).
Notice: for scaling physical axis the measurement ranges of all the graphs are taken
into account, for example: minimum can be set on the basis of the least one from
minimal values defined for graphs and maximum on the basis of the highest one from
maximal values. If not all of the graphs have ranges defined, the range is determined
automatically.
When no range is declared for the constant graph, the range is set to +/- 10% around
the constant value.
Fig. The Window 'Add Constant Graph' - the 'Ranges' Tab.
***
The tab Value Labels includes the editor that allows to define text labels of
values; this labels are used instead of numeric values:
73
AsTrend
- in the chart: hints and labels of points;
- in the legend: Sample Value of Read Line 1 / Sample Value of Read Line 2 columns;
- in vertical axis: in case of many OY axes or percentage chart; in cae of physical axis the labels
will be displayed only if they are identical for all graphs.
Fig. The Window 'Add Constant Graph' - the 'Value Labels' Tab.
2.9.3 Adding a Variable from External Data Source
In AsTrend, there is the possibility to display charts of variables the values of which are retrieved
from external data source (CSV, XLS files, as well as resources accessible by OLE DB: MSSQL,
Access databases), on condition the database structure allows readout of all data in systematic
manner.
You can add variables form external source with use of the command
Data from:
- Format - format zewnętrznego źródła danych:
- Plik tekstowy,
- plik programu Microsoft Excel,
- OLE DB.
74
External
2 AsTrend - Operation
Fig. The Window 'Add Variables from External Data Source'.
Description of external source data format is available by pressing the button Help from the
window 'Add Variables from External Data Source'.
2.9.4 Adding a Data from OPC-HDA Server
Add a data from OPC-HDA server by the command
main window > Home tab > New Graph group.
OPC-HDA Server from: AsTrend
2.9.5 Adding an Empty Graph
Add an empty grapg by the command
Home tab > New Graph group.
Empty from: AsTrend main window >
An empty graph is used as a separator in the legend and in the table of historical data.
75
AsTrend
2.10 Selecting the Data Type (Genuine/Aggregated Data)
AsTrend provides the following types of data:
•
•
•
intervals between measurements are the same as in the archive (imposed by the backup
program) - genuine data;
data is always aggregated and the time intervals between successive samples are
identical (enforced by AsTrend) - uniform data;
intervals between measurements are enforced automatically by AsTrend depending on the
length of the period for which averaged data and approximated data (minimum and
maximum values) are calculated.
The default type is - genuine data. The genuine data is switched on by the button
from: AsTrend main window > Data tab > Input Data group.
The advantage of this type is that for row data the chart points have time moments of real
measurements.
***
The uniform data is switched on by the button
from: AsTrend main window > Data
tab > Input Data group. This type forces constant distance between points on the graph - it may
result in adding or removing certain measurements. As the result, however, you receive the same
sampling times for all variables, which faciliates comparison of variables and is particularly
valuable when displaying the trend in the form of a table of values (all graphs in the table have
the same number of rows).
To set own sampling period (interval between successive samples) use the option Uniform Data
- Sampling Period from: AsTrend main window > Data tab > Input Data group > 'Trend
Input Data Options' window run by the button
> Data tab.
Fig. Thw Window 'Trend Input Data Options' - 'Data' Tab.
76
2 AsTrend - Operation
***
The approximated data
Averaged or
or averaged data are switched on by the buttons:
Approximated (AsTrend main window > Data tab > Input Data group, or in
the window 'Trend Input Data Options' run by the button
group.
from: Data tab > Input Data
Averaged data:
For short periods of time genuine data is retrieved, for long periods aggregated data (averaged
data) is retrieved.
The moment of change-over from genuine data to aggregated data as well as aggregation period
(sampling period) are adjusted automatically.
This mode is mainly used to view data from a long time period. The archive should store precalculated averaged values of measurements to ensure their quick retrieval.
Approximated data:
For short periods of time genuine data is retrieved, for long periods two aggregated data sets (of
minimum and maximum values) are retrieved.
The moment of change-over from genuine data to aggregated data as well as aggregation period
(sampling period) are adjusted automatically.
This mode is mainly used to view data from a long time period. The archive should store precalculated values of aggregated data (minimum and maximum) to ensure their quick retrieval.
Approximated values are plotted as a HighLow graph, which consists of two curves representing
the minimum and maximum values. The area between the curves is filled with a graph colour.
Thanks to that all the extreme values of measurements are always visible on the chart.
***
The uniform, averaged and approximated data are calculated by the Asix system server with
the use of the Aggregator module. Thus AsTrend reads the aggregated data rather than calculate
it from raw values.
77
AsTrend
2.10.1 Selecting the Aggregation Function for Data Reading
You can select the aggregation function for data reading.
The choice of the aggregation function for data reading can be performed in
the window 'Graph Options' (AsTrend main window > Graph tab > Graph group > run
the window 'Graph Options' pressing the button
).
Aggregated data can be calculated by the Asix system server with the use of the Aggregator
module. Thus AsTrend can read the aggregated data rather than calculate it from raw values thanks to this solution the aggregated data - which the user is interested in - is delivered in a timely
and efficient manner. (See: 1.8 Aggregation of Asix System Data).
Fig. The Window 'Graph Options' - the 'Data' Tab.
78
2 AsTrend - Operation
2.11 Setting Time Period
2.11.1 Setting Time Period Using Trend Moving Buttons
Trend moving buttons:
Backward/Forward By Period - move horizontally by one current period,
Backward/Forward - move horizontally by quarter of the current period,
Decrease/Increase Period - reduce / enlarge a period by the successive predefined AsTrend periods,
To the Beginning of Data - move up to the beginning of data,
To the End of Data - move up to the current time data or the end of external data,
and
Live Mode – start the data logging mode,
automatically change trend period.
2.11.2 Setting Time Period Using Period Editor
You can set a time period with use of period editor activated from: AsTrend main window >
Home tab > Period group > the field
.
The user can:
- select pre-defined period,
- set own period.
Setting the base date needs: a data, period length and "data position" in relation to the period.
The ‘Period’ window supply the user with pre-defined period lengths:
1 minute,
2 minutes,
5 inutes,
10 minutes,
15 minutes,
79
AsTrend
30 minutes,
1 hour,
2 hours,
4 hours,
8 hours,
12 hours,
1 day,
2 days,
4 days,
7 days,
14 days,
1 month,
2 months,
3 months,
6 months,
1 year.
Fig. The Window of Time Period Editor.
80
2 AsTrend - Operation
2.11.3 Setting Time Period Using the Period Clipboard
Trend period may also be retrieved from any trend stored in the Period Clipboard. See the 2.29
Period Clipboard section for description of the Periods Clipboard.
2.11.4 Setting Time Period Opening a Trend Definition
Each time a trend definition is loaded, trend period is changed to the one stored within the
definition in accordance with the following option:
AsTrend main window > Home tab > Period group > the window 'Trend Period Options' run
by the button
.
Possible settings of automated period loading:
- Like during write,
- Period end equals now,
- Current day, time without change,
- Last used,
- Set in OPC format,
- Ask me.
Fig. The Window 'Trend Period Options'.
81
AsTrend
2.11.5 Setting Time Period Using the Mouse
Movement of mouse roller causes moving the period forward/backward.
Movement of mouse roller with pressed Ctrl key causes changing the period span.
Movement of mouse roller with pressed Shift key causes fast movement of the period.
It is also possible to change a time period if you drag and drop the time axis by the mouse.
Fig. Setting a Time Period by the 'Drag & Drop' Method.
2.11.6 OPC Time Editor
The time period after opening the trend file can be expressed in OPC format, defined in:
AsTrend main window > Home tab > Period group > the window 'Trend Period Options' run by
the button
.
Clicking on the button
in fields: Begin, End run the editor.
Beginning of relative time has the following pre-defined items:
-
Current moment;
Beginning of the current
Beginning of the current
Beginning of the current
Beginning of the current
Beginning of the current
82
second;
minute;
hour;
day;
week;
2 AsTrend - Operation
- Beginning of the current month;
- Beginning of the current year;
- Beginning of the current shift;
'Beginning of the current shift' referres to shifts beginning at 6:00 AM or 2:00 PM or 10:00 PM.
Fig. OPC Time Editor.
83
AsTrend
2.12 Displaying Aggregated Data Based on Data of Currently
Displayed Period
In AsTrend there is the possibility to display aggregated data in the fields of legend (the list of
fields of data aggregated by specific functions - see: 2.6 Operations in the Legend Area).
Aggregated data is calculated by AsTrend locally based on data of chart graph
displayed within a set time period (regardless of data type: genuine, uniform,
approximated, averaged).
The additional reading line gives the possibility to separate any time interval within the chart
time period, for which aggregeted data will be calculated and then displayed in the legend
fileds (if reading lines are off the legend fields display aggregeted data calculated for the whole
displayed time period).
2.12.1 Dislapying Data with Time Stamps of Millisecond Resolution
If you use the option Enable Support of Short Time Periods (AsTrend main window >
) the
chart will be switched over to raw data (if aggregation period is below 1 minute) for
data with time stamps of millisecond resolution (data from Asix or external sources).
Then,
the
window
'Period'
run
from
the
button
Home tab > Period group > the window 'Trend Period Options' run by the button
has the following pre-defined time period:
Fig. Pre-Defined Time Periods for Data with Time Stamps of Millisecond Resolution.
84
2 AsTrend - Operation
2.13 Setting Additional Time Period
Various fragments of a chart of one variable (charted for different time periods) or the charts of
different variables may be compared on a screen. This possibility is achieved by an additional time
axis that may be turned on for one of the to-be-compared charts.
When at least one graph uses an additional time period:
- second OX axis appears over the graph;
- the abbility to edit the second time period appears in the period editor window.
When only one graph uses the additional time period, the additional time axis is displayed in the
colour of this graph.
Fig. Chart with Additional Time Axis.
***
An additional time axis is activated for a selected graph by the button
from:
AsTrend main window > Graph tab > Graph group.
***
Time format of additional time axis is defined in: AsTrend main window > Chart tab >
Axes group > the window 'Trend Axes Options' run by the button
.
The standard format is ”yy-mm-dd" for periods longer than a day; and the format ”hh:mm" for
other cases. There is also the possibility of using other formats or defining own format.
The following pre-defined formats are possible:
•
•
yy-mm-dd hh:mm:ss
yy-mm-dd hh:mm
85
AsTrend
•
•
•
•
•
•
•
•
•
•
•
•
•
yy-mm-dd hh
yy-mm-dd
yy-mm
mm-dd hh:mm:ss
mm-dd hh:mm
mm-dd hh
mm-dd
dd hh:mm:ss
dd hh:mm
dd hh
hh:mm:ss
hh:mm
mm:ss
Its own format the user can enter directly into the fields: Main Time Axis or Additional Time
Axis, e.g. yy*mm*dd.
Fig. The Window 'Time Axes Options'.
***
Time for additional time axis is set by the button
which run the window 'Period' (AsTrend main window
> Home tab > Period group). The beginning of period of additional time axis is set by Offset to
Main Time Axis or Absolute or Relative Moment of Time.
86
2 AsTrend - Operation
Fig. The Window for Setting Time Period for Main and Additional Time Axis.
.
87
AsTrend
2.14 Setting the Chart Type Depending on the Axes Type
One OY Axis chart is set by the button
group.
from: AsTrend main window > Chart tab > Axes
By default, a trend has One OY Axis chart set up.
***
Proportional Axis chart is set by the button
Axes group.
from: AsTrend main window > Chart tab >
***
Many OY Axes chart is set by the button
Axes group.
from: AsTrend main window > Chart tab >
***
Many OY Axes - Stack chart is set by the button
Chart tab > Axes group.
from: AsTrend main window >
Additionally, it is possible to display two adjacent variables (graphs) on one common chart
(with common OX axis and two OY axes). It is useful when area of the chart should be
organized for better legibility or when two graphs should be quickly correlated. Such a
chart is described by two OY axes put on the left and right side of the chart. Two adjacent
variables from the legend are charted on one common chart if each of them has the
option Axis on the lefr or right side turned on (AsTrend main window > Graph tab >
Graph group > the window 'Graph Options' run by the button
).
***
XY Chart is set by the button
from: AsTrend main window > Chart tab > Axes group.
Switching to a chart with time OX axis is performed by the button
XT Chart.
The contents of labels on the XY Chart is set by the option Labels on XY Chart from: AsTrend
main window > Chart tab > Chart Type group > the window 'Trend Options' run by the button
.
NOTICE: The parameter for the content of displayed labels has to be defined for a variable which
is first in the legend.
88
2 AsTrend - Operation
2.15 Setting the Chart Type Depending on the Graph Type/Form
2.15.1 Linear Chart
The linear chart is the most common (and default) chart type.
The linear chart is set by the button
Graph group.
from: AsTrend main window > Graph tab >
The chart can be displayed in 3D.
***
Fig. The Linear Chart.
89
AsTrend
2.15.2 Bar Chart
The bar chart is often used type of chart.
The bar chart is set by the button
from: AsTrend main window > Graph tab >
Graph group..
The chart can be displayed in 3D.
***
Fig. The Bar Chart.
90
2 AsTrend - Operation
2.15.3 Area Chart
The area chart is set by the button
> Graph group.
from: AsTrend main window > Graph tab
The chart can be displayed in 3D.
Fig. The Area Chart.
91
AsTrend
2.15.4 Binary Variable Chart
The binary variable charts are charted on separate axes for all types of graphs and all types of trend
axes.
The variable is treated as a binary one in AsTrend if it has the range 0-1 and can take only
integer values.
Binary value charts have the possibility to display variable state descriptions (see: 2.16 Displaying
Variable State Descriptions).
Fig. The Binary Variable Chart.
92
2 AsTrend - Operation
2.16 Displaying Variable State Descriptions
There is the possibility to display names of variable states as labels of value axis for physical charts.
When displaying charts of many variables - the necessary condition is that all variables have
identical names of states.
The mechanism of displaying the names of states needs to declare variables that will correspond to
states of the monitored variables. The definitions of variables serving the definitions of states are
prepared by the Asix application designer.
NOTICE:
When you add Asix variables or external variables AsTrend checks whether a variable has state
descriptions defined - and, if so, a stepped interpolation is turned on.
zoom >>
Fig. Names of States as Labels of OY Value Axis.
93
AsTrend
2.17 Operations on Variables
If neither any individual graph nor any group of graphs displayed within the chart area is selected,
the commanded operation will concern all variables of the trend. Operations may be commanded
by ribbon buttons or context menu.
2.17.1 Selection of One or All Variables
To perform any operation on one or all graphs it must be variable selection made.
To select a graph:
•
•
click the graph by the left mouse button;
click the variable row in the legend by the left mouse button.
Selecting all variables occurs by double-clicking the left mouse button on the chart area outside
the graphs.
2.17.2 Removal of Variables
To remove a variable:
•
click the button
•
•
use ontext menu displayed in the chart area - the button
click the key DEL.
from: AsTrend main window > Home tab > New Graph group;
If all variables are selected, the button
;
removes all variables.
Deleting a selected variable causes the next variable in the legend becomes a selected variable.
2.17.3 Displaying the Variable Metric
To display the variable metric (variable attributes):
•
•
click the button
from: asTrend main window > Graph tab > Graph group;
use the button Graph Atttibutes from the chart context menu.
The above methods are available when the variable has been previously selected. Othervise,
these functions are inactive.
There is an example of the metric window.
94
2 AsTrend - Operation
Fig. The Variable Metric.
The above data is retrieved from the variable definition database.
2.17.4 Displaying Labels
Labels are small boxes displayed above curve points, in which values of the points are shown.
To display lables, use the button
group;
from: AsTrend main widnow > Graph tab > Graph
95
AsTrend
Fig. The Chart with Displayed Labels.
The highlited button corresponds to the situation of displaying labels. The function is dependent
on the context. If at the time you press the button
any variable is selected, the labels will be
displayed or removed only for the graph corresponding to a selected variable - otherwise the
labels will be displayed or removed on all the graphs.
For the graph (variable) for which names of states are defined in the variable definition database,
when the option of displaying labels is turned on - the names of the variable states will be
displayed in the labels.
2.17.5 Displaying Measurement Points
Squares representing measurement points may be displayed only within line and area charts.
They are located in places corresponding to the point values.
To display measurement points, use the button
Graph tab > Graph group.
96
from: AsTrend main window >
2 AsTrend - Operation
Fig. The Chart with Measurement Points Displayed.
The function is dependent on the context. If at the time you press the button
any variable is
selected, the points will be displayed or removed only for the graph corresponding to a selected
variable - otherwise the points will be displayed or removed on all the graphs.
2.17.6 Changing the Variable Range
This function applies to a selected variable.
To change the graph range (minimum and maximum):
•
•
use the button
from: AsTrend main window > Graph tab > Graph group.;
double-click in the fields: Minimum / Maximum Value fields in the legend.
The window 'Graph Options' will be displayed with the possibility of changing Display
Range and Measurement Range.
97
AsTrend
Fig. The Window 'Graph Options' - the Tab 'Ranges'.
- Display Range - display range is used for scalling the physical axis and the axis of
individual graph on Many OY Axes chart (notice: you have to set the options Minimal
Displaying Range and Maximal Display Range as the minimum and maximum in
the physical OY axis settings: AsTrend main window > Chart tab > Axes group >
'Trend Axes Options' window activated by the button
> Physical OY Axis tab).
The range 0-0 means the absence of display range - then the physical axis range will
be calculated based on the current values of the samples.
Notice: for scaling physical axis the display ranges of all the graphs are taken into
account, for example: minimum can be set on the basis of the least one from minimal
values defined for graphs and maximum on the basis of the highest one from maximal
values. If not all of the graphs have ranges defined, the range is determined
automatically.
- Measurement Range - measurement range is used for checking correctness of
graph sample values; the values of samples that exceed the graph range by the
number equal to the graph range are cut off. The range 0-1 for total value Asix system
variable means that the variable is treated as a binary value.
The measurement range may also be used for scaling the physical axis (notice: you
have to set the options Minimal Measurement Range and Maximal Measurement
Range as the minimum and maximum in the physical OY axis settings: AsTrend main
window > Chart tab > Axes group > 'Trend Axes Options' window activated by the
button
> Physical OY Axis tab).
Notice: for scaling physical axis the measurement ranges of all the graphs are taken
into account, for example: minimum can be set on the basis of the least one from
minimal values defined for graphs and maximum on the basis of the highest one from
maximal values. If not all of the graphs have ranges defined, the range is determined
automatically.
98
2 AsTrend - Operation
By default, the chart has a range determined on the basis of the variable definition
database, e.g. 0-10000.
2.17.7 Replacing a Variable
To replace a variable (preserving attributes such as a colour etc.), use:
•
the button
•
use the button
from: AsTrend main window > Graph tab > Graph Operations group;
from the legend context menu;
Neither of the above listed option is available unless a database of variable definitions is openand
and the variable is selected (clicking a Name field within the legend automatically selects the
variable).
Fig. The Window for Replacing a Variable.
Enter new variable name. If the checkbox Keep Value of Displayed Range is set, the variable
range will be taken from the legend, otherwise – from the variable definition database. Confirm
with the OK button (or press the ENTER key). The entered variable name appears next to the
text box in the color assigned to its graph. This way one can easily check whether the entered
variable is correct (if more instances of the same variable is on the chart).
Funkcja ta przydatna jest wtedy, jeśli nazwy zmiennych oznaczane są według jakiejś jednolitej
konwencji (przykładowo rozpoczynają się od określonych znaków, np. "B1") i chcemy szybko
zmienić definicję trendu w taki sposób, aby na wykresie pojawiły się wartości zmiennych, których
nazwa rozpoczyna się od znaków "B2". Można to oczywiście zrobić przy pomocy innych funkcji,
kolejno usuwając określoną zmienną, następnie dodając zmienną o nowej nazwie i przydzielając
jej atrybuty zmiennej usuniętej. Jednak szybsze i prostsze jest użycie funkcji zmieniającej nazwę.
The replace function is particularly handy if names of variables are systematically assigned
according to some convention. Suppose for example that names of all variables of some category
start with “B1” and names of all variables of another category start with “B2”. Suppose that a
trend presents some B1-category variables and you want to quickly re-define it so that equivalent
B2-category variables are charted instead. Of course you might manually remove a variable B1,
add a variable B2, assign to it the removed B1 variable attributes, an so on for the whole group of
variables. However, it is much simpler and quicker to just use the replace function.
Jeśli otworzymy okienko zmiany nazwy zmiennej i klikniemy na klawisz OK, wówczas zostanie
dokonana aktualizacja danej zmiennej. Do definicji trendu zostanie wpisana nowa definicja
zmiennej, zgodnie z jej bieżącą deklaracją w bazie.
If the window 'Variable Name' will be closed with its OK button without any editing action
performed, definition of that variable within the trend will be updated with definition retrieved
from the variable definition database.
99
AsTrend
2.17.8 Changing Interpolation
By default, linear interpolation is used. However, step-wise interpolation may also be used (in
particular well suited for multi-state variables).
This function applies to a selected variable.
To change interpolation, use:
•
the button
from: AsTrend main window > Graph tab > Graph group.
The differences between the methods of interpolation are illustrated in the following figure.
The function affects only the selected variable(s).
NOTICE:
When you add the Asix variables or external variables, AsTrend checks whether a variable has
names of states defined - and, if so, step-wise interpolation is turned on automatically.
Fig. Linear and Step-Wise Interpolation.
100
2 AsTrend - Operation
2.17.9 Showing/Hiding a Variable Graph
By default, each variable graph is shown.
The function affects only the selected variable(s).
To show/hide a variable graph, use:
•
the button
from: AsTrend main window > Graph tab > Graph Operations group;
•
the button
from the legend context menu.
The highlited button means a variable graph hidden.
2.17.10 Colour Change
The program automatically assigns colors to different variables according to a pre-defined
sequence (red, green, yellow…). However, color of each variable may be changed manually.
Firstly select a variable, secondly change the colour using:
the option Use custom colour from: AsTrend main window > Graph tab > Graph group >
•
the window 'Graph Options' run by the button
.
Fig. Graph Options - Defining a Custom Colour.
101
AsTrend
You can also:
•
use pre-defined colour palettes from: AsTrend main window > Chart tab > Appearance
•
group > Colour Palette
option;
define own colour palette in: AsTrend main window > Chart tab > Appearance group >
the window 'Trend Options' run by the button
> Appearance tab > Use the
Colour Palette from Trend Options option > Colour Palette tab > <trend own
palette>. Coloured squares correspond to the appropriate graphs - if you want to change
the colour, double-click a suitable square.
Switching over: program palette, pre-defined palettes and user custom palette is performed
by the option
from: AsTrend main window > Chart tab > Appearance group.
Fig. Switching over Colour Palettes.
102
2 AsTrend - Operation
2.18 Operations on Displayed Graphs
Once a trend is charted, usually some adjustments of the displayed graphs are necessary to
optimize the view to the current needs.
Some operations may exclude some other operations. For example, if the data logging mode is
activated, panning function is disabled.
2.18.1 Live Mode - Continuous Data Registration
Each trend may be switched over to the data logging mode.
'Live mode' can be turned on/off by:
•
the button
from: AsTrend main window > Home tab > Time Move group.
This mode is basically used to continuously monitor freshly acquired data. Charts are re-drawn
every 2 seconds provided the new data has appeared.
While logging is suspended, trend is immobilized, but all regular trend operations become
available.
2.18.2 Zooming
Use the following method to zoom in a graph (horizontal zooming):
•
Each trend fragment inside the chart area may be zoomed. Drag the mouse cursor (with
mouse button pushed) from the left to right to select the to-be-zoomed rectangular area.
As soon as the mouse button is released, the selected rectangle is zoomed. The upper left
corner of the area can not coincide with the graph, because then click is treated as a
selection.
Use the following method to zoom out a graph (horizontal zooming):
•
Selecting the area of chart from the right to left gives the reverse result (than described
in the previous point) - the chart returnes to the previous time period (operation can be
repeated until you see the listed period remembered in the history of changes).
103
AsTrend
Fig. Zooming the Graph.
Vertical zooming:
•
By default, trends have enabled vertical zoom lock, which makes zooming with the mouse
only with respect to the time axis (horizontal) available. If you want to zoom OY axis, click
the button
to make it unhighlighted to enable vertical zooming (AsTrend main
window > Chart tab > Zoom group). Then vertical zooming is performed by the buttons:
Zoom in Vertical - (50% increase) available from: AsTrend main window > Chart
tab > Zoom group.
Zoom out Vertical - (50% decrease) available from: AsTrend main window >
Chart tab > Zoom group.
..
To enable/disable zooming with respect to horizontal/vertical axis, use:
104
•
the button
which enables (when unhighlighted) or disables (when highlighted)
horizontal zooming (AsTrend main window > Chart tab > Zoom group);
•
the button
which enables (when unhighlighted) or disables (when highlighted)
vertical zooming (AsTrend main window > Chart tab > Zoom group);
2 AsTrend - Operation
2.18.3 Panning
The charted fragment of the archived data may be moved forward or backward along the time
axis.
To pan the chart, use the following buttons from: AsTrend main window > Home tab >
Time Move group:
Backward/Forward By Period - move horizontally by one current period,
Backward/Forward - move horizontally by quarter of the current period,
Decrease/Increase Period - reduce / enlarge a period by the successive predefined AsTrend periods,
To the Beginning of Data - move up to the beginning of data,
To the End of Data - move up to the current time data or the end of external data,
2.18.4 Readout of Variable Values
You can indicate with the mouse any graph point in order to read out the variable value
(value, time and status). The mouse cursor overlapping a displayed graph changes its shape
from an arrow into a cross. If you click the mouse button while the mouse cursor is a cross, a
small box pops up next to the cross. The value data of the indicated graph point is displayed
within the box till you move the cursor.
The operation of reading out values has a side effect: the indicated variable becomes selected.
You can read larger blocks of data from the table of values.
105
AsTrend
Fig. Value Readout.
2.18.5 Variable Selection
Many operations can be performed only if some variable is selected. You can select a
variable in two ways:
•
point with the mouse the displayed graph of that variable (the mouse cursor should
change its shape from an arrow into a cross) and click;
•
click in the legend in the variable raw.
Name of that variable will appear in the status bar.
The operation of selecting a variable has a side effect: some ribbon buttons and some menu
options become enabled.
106
2 AsTrend - Operation
2.18.6 Restoring Original Appearance of the Window
All modifications introduced to the trend window can always be restored to the initial state.
Restore original appearance of the trend window by the button Reopen Trend File
from:
drop-down menu.
107
AsTrend
2.19 3D Chart Handling
AsTrend gives you the opportunity of displaying graphs in 3D - there are two types of 3D charts:
1. 3D chart with the possibility of spatial manipulation of the chart area in three dimensions;
2. orthogonal chart.
3D with full spatial manipulation of the chart area in three dimensions:
3D is a recommended form of 3D chart presentation. Tl allows manipulation of: rotation, elevation,
perspective, zoom and depth.
To switch the chart to 3D version, use the button
Appearance group.
from: AsTrend main window > Chart tab >
The full 3D type is activated and parameterized using the button
that starts the list of
available parameters of the 3D view (AsTrend main window > Chart tab > 3D group available
when
is pressed):
Rotation - rotate the chart area around the vertical axis;
Elevation - rotate the chart area around the horizontal axis;
Perspective - turn on perspective;
Zoom - specify the size of the chart area;
Depth - deepen perspective;
Select View - select pre-defined 3D view:
- 3D View Right;
- 3D View Front;
- 3D View Left;
Fig. The Bar Chart in the Full 3D.
108
2 AsTrend - Operation
Orthogonal chart:
The orthogonal view is by far the simpler form for presentation of 3D charts. It only enables
manipulation of angle and depth of the chart area.
It is not recommended to use this type to line charts. Much better visualize effects for line charts
are obtained by using the full 3D variant.
To switch the chart to 3D version, use the button
Appearance group.
from: AsTrend main window > Chart tab >
The orthogonal type is activated and parameterized using the button
that starts the list of
available parameters of the orthogonal view (AsTrend main window > Chart tab > 3D group
available when
is pressed):
Angle - specify the angle between the edge at the junction of left / bottom wall and the edge of
the horizontal bottom wall;
Depth - specify the length of the edge at the junction of left / bottom wall; the longer the edge
the greater sense of depth;
Select View select pre-defined 3D view:
- Orthogonal Projection Right (default);
- Orthogonal Projection Left;
Fig. The Part of the Orthogonal Chart - Angle.
109
AsTrend
Fig. The Bar Chart in the Orthogonal 3D.
110
2 AsTrend - Operation
2.20 Program Options
The window "Program Options" is run by the command Program Options from a drop-down
menu of the button
. The options included in the window allow you to make settings for
AsTrend in the following areas (most of the options have already been discussed in previous
chapters referred to particular aspects of using the AsTrend program):
- main window position;
- data servers;
- diagnostic information on the license of data server access, parameters passed form the Asix
application (if you start AsTrend with your Asix application), communication with the data
source (when AsTrend run in web browser);
- trend printout format;
- saving the current trend configuration and current legend configuration as default configuration
for new trend files;
- colour palette;
- selection of available warnings;
- reading lines;
- trend file open window.
The window "Program Options" includes the following tabs described below.
***
The tab Main Window allows you to specify whether during the AsTrend operation wihout
the Asix application the information on the AsTrend main window location and the window resize
lock will be ignored.
There is also the possibility of declaring the automatic activation of the ribbon tab of AsTrend data
table (of current data) and the ribbon tab of AsTrend period clipboard at the moment you open
the current data table or the period clipboard. Additionally, if you check the option Active Ribbon
Tab on Window Activation the ribbon tab: Table (of current data) or Period Clipboard will be
automatically active when the corresponding window will become active: 'Table' or 'Period
Clipboard'.
111
AsTrend
Fig. The Window 'Program Options' - the 'Main Window' Tab.
Fig. The 'Period Clipboard' Tab Activation While the 'Period Clipboard' Window Activation.
112
2 AsTrend - Operation
***
The tab Network allows you to declare the names of servers from which the data for
displaying trend charts will be retrieved as well as the maximum timeout for the server and the
maximum server response time.
If AsTrend was started without starting the Asix application and the Asix server uses
only TCP/IP protocol or is located in a different subnet, you have to configure the TCP/IP
connection to the server using the command: Tools menu > Network Module - Options from
the Architect program.
Fig. The Window 'Program Options' - the 'Network' Tab.
***
The tab Diagnostics provides information on the license of data server access.
When starting AsTrend with an Asix application, the tab Diagnostics additionally includes the
data on parameters passed from the Asix application:
- Don't Allow Writing Trend Files;
- Grant AsTrend Administrator Rights to Operator;
- Working Directory;
- Variable Definition Database;
When starting AsTrend in a web browser, the tab Diagnostics additionally includes the
following data:
- data server addresses;
- variable definition database location;
- license server initialization status;
- license server connection status.
113
AsTrend
Additionally, the tab Diagnostics includes the data on Aslink (if it is).
Fig. The Window 'Program Options' - the 'Diagnostics' Tab.
Fig. The Window 'Program Options' - the 'Diagnostics' Tab - Parameters Passed from the Asix
Application.
114
2 AsTrend - Operation
Fig. The Window 'Program Options' - the 'Diagnostics' Tab - Parameters Pased of Web AsTrend.
***
The tab Wydruk PDF allows you to specify the paper size when exporting to PDF.
115
AsTrend
Fig. The Window 'Program Options' - the 'Print/PDF' Tab.
***
The tab New Trends allows you to set current trend options as default ones for newly
created trend files. The mechanism works not only during the continuous operation of AsTrend. If
AsTrend starts with the application - the further application restart (and thus AsTrend restart) will
recall the default trend options.
To save individual trend options, you have to define these options, then press the button Use
Current Trend Options from the window 'Program Options' > New Trend tab. The message
'Current trend options have been stored for new trend files" will appear.
In a similar way, you can save the current layout of the legend as a default one for newly created
trend files.
The option Use Built-in Trend Options will activate default built-in AsTrend options.
116
2 AsTrend - Operation
Fig. The Window 'Program Options' - the 'New Trends' Tab.
***
The tab Colour Palette allows you to compose a default colour palette, according to which
the successive graphs will be added to the chart.
117
AsTrend
Fig. The Window 'Program Options' - the 'Colour Palette' Tab.
***
The tab Warnings includes the list of warnings possible to display - check the warning type
you want to display during AsTrend operation.
Fig. The Window 'Program Options' - the 'Warnings' Tab.
118
2 AsTrend - Operation
***
The tab Read Lines allows you to set the thickness of reading lines (main and additional).
Fig. The Window 'Program Options' - the 'Read Lines' Tab.
***
The tab Trend File Open Window is available when starting AsTrend without an Asix
application. It allows you to specify the type of dialog window used to open a trend file (with or
without viewing the list of trend variables).
119
AsTrend
Fig. The Window 'Program Options' - the 'Trend File Open Window' Tab.
120
2 AsTrend - Operation
2.21 Trend Options
2.21.1 Trend Period Options
To define trend period options, use:
AsTrend main window > Home tab > Period group > the window 'Trend Period Options' run
by the button
.
The window allows you to freely adjust the time period that will be loaded at trend opening.
Fig. Trend Period Options.
There are the following variants of the period loaded during trend opening available:
- Like during write,
- Period end equals now,
- Current day, time without change,
- Last used,
- Set in OPC format - the use of OPC format makes it possible to define very precisely
the time interval for which you want the data graphs to be charted at trend opening. Both
the beginning and end of the period is defined with the use of the editor run by the button
. The time can be absolute one ar relative one referring to the current second, minute,
hour etc.
121
AsTrend
Fig. OPC Time Editor.
- Support of Short Time Periods - this option allows you to enter the time with
milliseconds. The data with time stamps of milliseconds precision can be retrieved from
the Asix alarm system or external resources like a text file. If this option is enabled, some
aggregated data are not calculated if the aggregation interval is less than 1 minute - the
chart will be switched over to genuine data.
2.21.2 Trend Input Data Options
Trend input data options can be defined in:
AsTrend main window > Data tab > Input Data group > the window 'Trend Input Data
Options' run by the button
.
***
The tab Data allows you to set: data type, sampling period for uniform data as well as round
mode of the period beginning for aggregated data:
- Data Type (see: 2.10 Selecting the Data Type (Genuine/Aggregated Data));
- Uniform Data - Sampling Period - the option specifies the length of intervals between points
on the chart. If there is the aggregator enabled in the Asix application, then using the interval
being multiplication of one minute may considerably improve speed of data collection.
122
2 AsTrend - Operation
- Round Mode of the Period Beginning for Aggregated Data - rounding to a multiple of the
aggregatiorn interval causes, if necessary, the beginning of the data reading period will be shifted
so as to be always at the same time. For example, for 15-minute aggregation interval and the
period from 0:22:00 to 1:22:0 the period beginning will be withdrawn to 0:15:00. No aggregation
causes the aggregated data will be slower displayed - it because they usually will be calculated
instead of retreaving from the server and the time stamps of aggregated samples will change
when time period shifting or in live mode.
Fig. Trend Input Data Options - Shift Period.
***
The tab Aggregates allow you to set quality thresholds for aggregated data displayed by
AsTrend:
- Quality Thresholds for Data:
Good Quality Threshold - an aggregated data has a good quality if the number of good
samples in the interval is equal to or exceeds the given threshold of good quality.
Bad Quality Threshold - an aggregated data has a bad quality if the number of bad
samples in the interval is equal to or exceeds the given threshold of bad quality.
- Quality Threshold for Calculated Attributes:
Good Quality Threshold - an aggregated data has a good quality if the number of good
samples in the interval is equal to or exceeds the given threshold of good quality.
123
AsTrend
Bad Quality Threshold - an aggregated data has a bad quality if the number of bad
samples in the interval is equal to or exceeds the given threshold of bad quality.
Fig. Trend Input Data Options - Aggregates.
2.21.3 Trend Appearance Options
The AsTrend window has a group of attributes that affect its appearance. They can
be enabled/disabled and parameterized by corresponding buttons on the ribbon tabs or
in the following window:
AsTrend main window > Chart tab > Chart Type or Appearance gruop > the window
'Trend Options' run by the button
.
Groups of trend appearance options:
•
•
•
•
•
124
chart type: XT <-> XY;
margins (top, bottom);
labels on XY chart;
drawing outside chart axis;
legend options: visibility, legend background colour, legend font, column width,
short names of calculated attributes, height of the legend;
2 AsTrend - Operation
•
•
•
•
•
•
•
graph colour palette: palette from program options <-> palette from trend
options;
variables custom colours for added variables;
background colours;
3D mode;
trend own palette (the parameter of using the palette from trend options has to
be selected);
3D parameters (the parameter of 3D mode has to be selected;
additional parameters of a trend printout;
These parameters are described in following chapters according to the 'Trend Options'
window tabs.
2.21.3.1 Chart
The tab Chart (AsTrend main window > Chart tab > Chart Type group > the window
'Trend Options' run by the button
> Chart tab) allows you to set:
- Chart Type:
- Draw XT Chart;
- Draw XY Chart - for XY chart the data is retrieved from the archive as uniform data. It is
possible to create a chart XY for two types of OY axis: One OY Axis and Many OY Axes. If
you choose One OY Axis, the data from first two graphs will be used to create an XY chart.
These graphs can not include binary data.
- Margins: distance between the label of a maximum graph value and the top edge of the chart
area as well as the distance between the label of a minimum graph value and the bottom edge of
the chart.
125
AsTrend
Fig. Trend Options - Chart.
2.21.3.2 Axes
The tab Axes (AsTrend main window > Chart tab > Chart Type group > the window 'Trend
Options' run by the button
> Chart tab) includes:
- Labels on XY Chart - select the content of labels.
- Show Chart Even Outside Axis - drawing graphs outside the chart area.
126
2 AsTrend - Operation
Fig. Trend Options - Axes.
Fig. Example of Before and After Enabling the Drawing Outside the Axes.
127
AsTrend
2.21.3.3 Legend
The tab Legend (AsTrend main window > Chart tab > Chart Type group > the window
'Trend Options' run by the button
> Chart tab) includes:
- Legend Visibility - show the legend in a trend.
- Legend Background Colour - select a colour from the standard palette or compose your own
one.
- Legend Font - select a font and the font format (bold, italic, underline).
- Legend Column Width - set automatic fitting of the width of legend columns.
- Column Headers - enable the option of displaying shortened names of calculated attributes.
- Height of the Legend on the Screen - enable the option of automatic legend height
calculation depending on the number of graphs or defining the legend height individually by the
user with the use of division belt or direct declaration of visible graphs in the legend.
Fig. Trend Options - Legend.
128
2 AsTrend - Operation
2.21.3.4 Appearance
The tab Appearance (AsTrend main window > Chart tab > Chart Type group > the window
'Trend Options' run by the button
> Chart tab) includes:
- Graph Colour Palette - define colours of graphs with the use of:
- variable colour palette built in the AsTrend program;
- colour palette defined in trend options (one of several pre-defined palettes) or a palette
defined by the user.
- Variable Custom Colours - use own colours for variables. If the option is enabled, the newly
added graph will remember its colour. Changing the order of graphs in the legend will not change
their colours.
- Background Colours - specify the colour and gradient for a trend background and a chart area
background.
- Chart in 3D Mode - enable 3D view.
Fig. Trend Options - Appearance.
129
AsTrend
2.21.3.5 Colour Palette
The tab Colour Palette (AsTrend main window > Chart tab > Chart Type group > the
window 'Trend Options' run by the button
> Chart tab) includes:
- pre-defined colour palettes
or
- possibility of customer palette creation using the option <Trend Own Palette> i definiując
kolejne okna podglądu kolorów.
The tab available when the option Use the Colour Palette from Trend Options is setected.
Fig. Trend Options - Colour Palette.
130
2 AsTrend - Operation
2.21.3.6 3D
To switch the chart to 3D version, use the button
AsTrend main window > Chart tab > Appearance group.
from:
The tab 3D (AsTrend main window > Chart tab > Chart Type group > the window 'Trend
Options' run by the button
following options:
) - available when the button
is pressed - includes the
- use orthogonal mode with the possilibity to define: angle and depth of the chart;
- 3D with full spatial manipulation of the chart area in three dimensions with the
possibility to defne
- rotation,
- elevation,
- perspective,
- zoom,
- depth.
- 3D Chart - Colours of Walls - click in the fields: Left Wall, Right Wall or Bottom Wall to
edit the colour.
Fig. Trend Options - 3D.
131
AsTrend
Fig. Trend Options - 3D.
2.21.3.7 Printout
The tab Printout (AsTrend main window > Chart tab > Chart Type group > the window
'Trend Options' run by the button
> Chart tab) includes:
Information
- Title - define the title content of the printout.
- Header - define the header content of the printout.
- Footer - define the footer content of the printout.
- Print Trend File Name - enclose the trend file name to the printout.
132
2 AsTrend - Operation
Legend Layout
- Legend on Separate Page - when the option is enabled, the legend is printed on a separate
page.
- Two Column Legend - when the option is enabled, the legend is divided into two columns on
the printout.
Fig. Trend Options - Printout.
133
AsTrend
2.21.4 Trend Axes Options
Trend axes options are defined in: AsTrend main window > Chart tab > Axes group > the
window 'Trend Axes Options' run by the button
.
The window 'Trend Axes Options' includes the tabs described in the following chapters.
2.21.4.1 Type and Look
The tab Type and Look (AsTrend main window > Chart tab > Axes group > the window
'Trend Axes Options' run by the button
) includes:
- Vertical Axis Type:
-
Vertical Axis - Physical
Vertical Axis - 0-100%
Many Vertical Axes
Many Vertical Axes - Stack
- Axes:
- Axes Visible - switch on the axes: OX and OY.
- colour box - declare the axes colour (this is also the label text colour for both axes).
- Fixed Chart Arrangement - set the axes always visible, the width of labels of left /
right axis to be fixed (except for multiaxial chart) and the space for a trend title to be
always reserved on the prinout. Fixed chart arrangement faciliates comparison of graph
printouts. To enable fixed chart arrangement, the option Axes Visible must be selected.
- Grid - switch on the grid on the chart and declare the grid format: dotted or solid line as well as
the grid collour.
134
2 AsTrend - Operation
Fig. Trend Axes Options - Type and Look.
2.21.4.2 Physical OY Axis
The physical OY axis options are set in:
AsTrend main window > Chart tab > Axes group > the window 'Trend Axes Options' run by
the button
> Physical OY Axis tab.
Each trend when opened has the axis set in the range consistent with the display range of all
graphs. The minimum is the lowest value of minima and the maximum is the highest value of
maxima.
You can specify the minimum and maximum:
•
•
•
•
on the basis of the display range,
on the basis of the measurement range,
on the basis of the lowest/highest,
as given arbitrary by the user.
Manually set range will be in force until the next change.
135
AsTrend
The range calculation consists in determination of the lowest value of minima and the highest
value of maxima for all graphs.
In addition, the window allows you to modify the way the labels describing the OY axis are
displayed. By editting the default format, you can specify: the number of decimal positions, the
number of outputted positions, the character that separates the integers from decimals.
Fig. Trend Axes Options - Physical OY Axis.
2.21.4.3 Time Axis
The time axis options are set in:
AsTrend main window > Chart tab > Axes group > the window 'Trend Axes Options' run by
the button
> Time Axis tab.
You can modify the way the time axis description is displayed. By default, an automatic mode is
used (default format): "yy-mm-dd" if the period is longer than a day; "yy:mm" for other cases.
Such a solution although convenient, because when you zoom in/out the way the axis is described
changes automatically, it may not always answer the user's needs. It is therefore possible to
choose another way of description, or define your own format.
136
2 AsTrend - Operation
Choose from the following formats:
•
•
•
•
•
•
•
•
•
•
•
•
•
•
•
yy-mm-dd hh:mm:ss
yy-mm-dd hh:mm
yy-mm-dd hh
yy-mm-dd
yy-mm
mm-dd hh:mm:ss
mm-dd hh:mm
mm-dd hh
mm-dd
dd hh:mm:ss
dd hh:mm
dd hh
hh:mm:ss
hh:mm
mm:ss
Define your format by entering an appriopriate string in the adequate edition field.
Fig. Trend Axes Options - Time Axis.
137
AsTrend
2.21.5 Trend Window Options
Trend windwo options are defined in:
AsTrend main window > View tab > Window group > the window 'Trend Window Options' run
by the button
.
Trend window options includes: window size and position, window size block and storing window
layout.
- Window Size Block - option used when creating trend files mainly for the Asix application.
When the option is enabled, the window size and position are stored in trnx file. While opening
the file, the window size and position are restored.
- Window Size and Position - the option is in force when you blocked the window size
(Window Size Block).
NOTICE: Window size and position are ignored - if the option of ignoring the window size is
enabled in program options and the trend file is opened in AsTrend started without the Asix
application.
- Storing Window Layout - if the option is enabled, the window size and position are stored in
the trend file and restored while trend opening.
Fig. Trend Window Options.
138
2 AsTrend - Operation
2.22 Graph Options
The graph options are specified using:
AsTrend main window > Graph tab > Graph group > the window 'Graph Options' run by the
button
.
NOTICE: Tabs of the window may vary slightly depending on the data types of graphs (see: 1.5
Data Types of Graphs).
***
The tab Ranges allows you to specify:
- Display Range,
- Measurement Range;
NOTICE: The tab is not available for the bits of a status variable as well as for alarms.
Fig. Graph Options - Ranges.
- Display Range - display range is used for scalling the physical axis and the axis of
individual graph on Many OY Axes chart (notice: you have to set the options Minimal
Displaying Range and Maximal Display Range as the minimum and maximum in
the physical OY axis settings: AsTrend main window > Chart tab > Axes group >
'Trend Axes Options' window activated by the button
> Physical OY Axis tab).
139
AsTrend
The range 0-0 means the absence of display range - then the physical axis range will
be calculated based on the current values of the samples.
Notice: for scaling physical axis the display ranges of all the graphs are taken into
account, for example: minimum can be set on the basis of the least one from minimal
values defined for graphs and maximum on the basis of the highest one from maximal
values. If not all of the graphs have ranges defined, the range is determined
automatically.
- Measurement Range - measurement range is used for checking correctness of
graph sample values; the values of samples that exceed the graph range by the
number equal to the graph range are cut off. The range 0-1 for total value Asix system
variable means that the variable is treated as a binary value.
The measurement range may also be used for scaling the physical axis (notice: you
have to set the options Minimal Measurement Range and Maximal Measurement
Range as the minimum and maximum in the physical OY axis settings: AsTrend main
window > Chart tab > Axes group > 'Trend Axes Options' window activated by the
button
> Physical OY Axis tab).
Notice: for scaling physical axis the measurement ranges of all the graphs are taken
into account, for example: minimum can be set on the basis of the least one from
minimal values defined for graphs and maximum on the basis of the highest one from
maximal values. If not all of the graphs have ranges defined, the range is determined
automatically.
***
The tab Data allows you to:
- enable the additional time axis connected with the specified variable; if one or more graphs use
the additional period of time: the second axis of time is displayed above the chart, possibility of
editing additional period appears in the period editor;
- select the graph data type;
- select the type of aggregation function used to calculate raw data;
- set the measure period used to calculate data by Total(value divisor) and Gradient(value
multiplier);
- select the Asix application archive, from which data is retrieved to be displayed in AsTrend;
- declare the way the data (points) with uncertain quality are treated (as points with good quality
or as points with bad quality).
140
2 AsTrend - Operation
Fig. Graph Options - Data.
A time period for the additional time axis is set by the button
which run the window 'Period' (AsTrend main window
> Home tab > Period group).
The period beginning of the additional time axis is defined in the OPC format (see: 2.11.6 OPC
Time Editor).
Fig. The Window with the Option for Defining the Additional Time Axis.
141
AsTrend
To compare graphs of the same variable from two different time periods, add the variable to the
chart twice, assign the additional time axis to one of the graphs and declare a time period for the
additional OX axis. When only one graph uses the additional time period, the additional OX axis is
drawn in the colour of the graph.
***
The tab Chart enables:
- chart type selection: line, bar or area;
- setting stairs interpolation (with the possibility of reverse charting - the option Interpolate with
Value on the Left From the Point) - for line and area charts;
- setting the width and offset of bar - for bar charts;
- setting graph limit lines;
Fig. Graph Options - Chart.
The option For All Grpahs allows you to apply settings for all graphs displayed on the chart.
***
The way the vertical axis is displayed on the chart, you can define on the tab Vertical
Axis (for charts with many OY axes) - the parameters are set for one selected variable or for all
the variables simultaneously:
- Vertical Axis Position - Chart with Many OY Axes:
142
2 AsTrend - Operation
- On the Left Side of the Chart - axis can be positioned on the left side of the chart;
- On the Right Side of the Chart - axis can be positioned on the right side of the chart;
- Vertical Axis Position Chart with Many OY Axes - Stack:
- Axis Always on the Left Side - axes can be positioned always on the left side of the
chart, separately for each graph;
- Axis on the Left or Right Side - axes can be positioned on the left or right side of the
chart; graphs of variables adjacent in the legend can be charted two on a single chart then one graph will have the axis on the left side and the second graph on the right side.
For example, if 8 graphs have the option checked, it will be 4 charts (one above the other).
- Axis Scale Type:
- Linear,
- Logarithmic - axis can be logarithmic only when the minimum and maximum is greater
or equal to zero..
- Inverted Vertical Axis - option has a sens only for charts with the proportional axis or with
many OY axes,
- Labels Format (charts with the proportional axis or with many OY axes).
Fig. Graph Options - Vertical Axis.
***
The tab Graph Options includes:
143
AsTrend
- Appearance - show points, labels; set line width; set transparency; hide graph on the chart; use
custom colour for a graph; set 3D graph depth;
- Gradient - set gradient scale (it darkens or lightens the gradient); set gradient balance (it shifts
ht ebalance up or down).
- Font Options - set custom forn in the legend.
Fig. Graph Options - Appearance.
***
The tab Value Format includes:
- Values Format - set values format as calculated on the basis of display range or as the custom
one.
- Display Aggregate Total as Time - data aggregated by the function 'Total' is displayed using
the time format: d h:mm:ss
144
2 AsTrend - Operation
Fig. Graph Options - Value Format.
***
The tab Value Labels includes the editor to define text labels of values. These labels are used
instead of numeric values:
- on the chart: hints and point labels;
- in the legend: Sample Value of Read Line 1/2 columns;
- on the vertical axis in case of 'Proportional Axis' and 'Many OY Axes' charts; for physical axis the
labels are displayed only if they are the same for all the graphs;
For floating-point values the labels corresponding to the rounded integer values are displayed.
145
AsTrend
Fig. Graph Options - Value Labels.
***
The tab Pattern Graphs allows you to add one or two pattern graphs to the chart for the
displayed analysed graph. Adding two pattern graphs gives the effect of 'band chart' - useful to
show the operator the expected shape of the graph.
Pattern graphs can be added from:
- Asix application: pattern graphs are defined using the PEdit program and stored in an SQL
archive; see more information: PatternTrends.CHM/PDF
- external sources: pattern graphs are defined in text files, spreadsheets or database; the format
of patterns is the same as for external data; see information on external data format pressing the
button Add Pattern Graph from External Source - the dialog window will appear.
146
2 AsTrend - Operation
Fig. Graph Options - Pattern Graphs.
147
AsTrend
2.23 Reading the Trend Definition
To read trend definition:
•
use the button Open
from drop-down menu of the button
definition. The read definition replaces the so-far used one.
to read a stored trend
The trend definition contains:
•
•
•
•
•
names of the charted variables
trend period
curve attributes (colors, chart types, labels etc.)
window attributes (window appearance)
print-out parameters (title, header, footer).
Fig. The Window for Trend Definition Reading.
The period displayed on the screen may be modified in relation to a period stored in a trend
definition. If you set the mode with asking the user for the to-be-displayed period - each time a
new trend definition is open, the dialog window will be displayed.
Trend definitions are stored in XML files. Trend definition may be read-in automatically during the
program startup if name of such a file will appear as argument of the program calling command.
The window 'Opening' displays in the administrator or operator mode as well (for AsTrend
started with the Asix application). Please note that the user with operator privilege can read trend
148
2 AsTrend - Operation
files only if the directory for trend definition files is declared in the operator action opening
AsTrend - it is because the operator can open the files only from a given directory and its
subdirectories.
For classical Asix application you can set the option starting AsTrend with the Asix application,
including indication of a directory with trend definition files (without using the operator action
ASTREND):
Architekt > Start Parameters > Programs > AsTrend > Start AsTrend
***
In the operator window it is not possible to go to any directory in the field Search in: as well as
to delete the file of read-only type.
Both the administrator and operator do not have the ability to delete files when write lock was
imposed on these files (the option set in the Architect module: Fields and Computers > Start
Parameters > Programs > AsTrend > Do not allow saving any files).
149
AsTrend
2.24 Printing Trends
The trend displayed in the AsTrend window can be printed. There are some functions
run form a drop-down list of the button
•
Print Preview
•
Print
related to printing trends:
;
.
Printouts include:
•
•
•
•
•
chart area;
legend;
title,
header,
footer.
All these parameters are visible in print preview and can be set in the trend parameter window:
AsTrend main window > Chart tab > Chart Type group > the window 'Trend Options' run by
the button
> Printout tab.
Print Trend File Name - print the file name in the footer of a trend; by default, the option
enabled.
150
2 AsTrend - Operation
Fig. Trend Options - Printout.
2.24.1 Print Preview
To pre-view printout on the screen before printing, use:
•
the command Print Preview
from the drop-down list of the button
.
Depending on the selected printer, the printout will be black&white or colored. In the former case
all colors will be automatically translated into a gray scale. Buttons in the preview window make
possible to scale the printout in several different ways (fit to window, 100% size as on the printer,
fit to page width etc.), to configure some printer options, as well as to start printing.
151
AsTrend
Fig. Print Preview.
2.24.2 Printing
To start printing, use:
•
the command Print
from the drop-down list of the button
.
In the operator mode - after the command is called, the simplified window of printer selection
opens.
152
2 AsTrend - Operation
2.24.3 Printing Trends with More than 8 Graphs
In the case when more than 8 graphs are to be printed in one trend, the option Two Column
Legend should be set:
AsTrend main window > Chart tab > Chart Type group > the window 'Trend Options' run by
the button
> Printout tab
Fig. Print Printout.
When printing a chart of more than 8 graphs with the one column legend, the following message
will display:
153
AsTrend
Fig. Warning When Printing a Chart of 8 Graphs with the One Column Legend.
154
2 AsTrend - Operation
2.25 Closing a Displayed Trend / Creating a New Trend
To close the currently displayed trend, use:
•
the command New from the drop-down list of the button
;
It removes from the scrren an old trend and displays a blank area of a trend to be edited.
.
155
AsTrend
2.26 Saving the Trend Definition
A trend definition can be saved using:
•
the button Save
and Save As...
from the AsTrend drop-down list.
The save function works differently in the Operator mode than in Administrator/Full modes.
***
When AsTrend is started without the Asix application, TRNX files are stored in the user's
document directory.
In Operator Mode
Trends qualified by an Administrator as read-only can not be modified by Operators. An attempt
to do so will generate warning message:
Fig. The Error When Trying to Write a Read-Only Trend By the Operator.
However, Operator may save the trend under a new filename or save a new trend.
156
2 AsTrend - Operation
Fig. The Window 'Saving As' for the Operator.
Trends are stored in TRNX files.
When AsTrend is started with the Asix application, it should be called from the application
menu instead of from the Windows system bar. AsTrend run from the tray has limits on the file
operations: the Operator can not save files, becaus there is no directory declared, where the file
could be saved.
In Administrator Mode
The administrator can create new trends with Read_only status.
157
AsTrend
Fig. The Window 'Saving As' for the Operator.
Administrator may also modify each existing trend definition regardless of its status. Each attempt
to overwrite any existing trend file will generate the following warning message:
Fig. The Error When Trying to Modify an Existing Trend File by the Administrator.
If the to-be-overwritten file is read-only, another warning message will follow:
158
2 AsTrend - Operation
Fig. The Message When Trying to Modify an Existing Trend File with the Status Read_Only by the
Administrator.
The read_only status means that the trend definition is a pattern trend that should not be
modified.
159
AsTrend
2.27 Exporting the Trend / Graph / Historical Data Table
AsTrend allows you to export:
-
whole trend (the chart with the legend and printout informations) to PDF file,
chart with the legend to BMP file / Clipboard,
only the legend to Clipboard, text, HTML or XLS file,
data of selected graph/graphs to CSV file, Clipboard,
historical data table to Clipboard, text, HTML or XLS file
***
The whole trend export (chart, legend and printout data) to PDF file is
performed with the use of: Export To PDF
from the drop-down list of the button
.
The additional information (title, header, footer, print trend file name as well as legend
layout) are set in:
AsTrend main window > Chart tab > Chart Type group > the window 'Trend Options'
run by the button
> Printout tab.
160
2 AsTrend - Operation
Fig. The Trend Exported to PDF File.
***
The chart export with the legend to clipboard / BMP file is performed with the
use of: Copy to Clipboard
, Save to BMP File
from:
AsTrend main window > Chart tab > Chart Export group.
161
AsTrend
Fig. The Chart Exported to BMP File.
***
The legend export to clipboard / text, HTML, XLS file is performed with the
use of: Copy to Clipboard, Export to Text File, Export to HTML File, Export to
XLS File from:
AsTrend main window > Chart tab > Chart Export group > the button Export Legend
(the drop-down list allows you to select the format you want the legend to be
exported to)
162
2 AsTrend - Operation
Fig. The Legend Exported to HTML File.
Fig. The Legend Exported to XLS File.
***
The selected graph/graphs export to CSV file, Clipboard is performed with the
use of: Copy to Clipboard
, Export to CSV
from:
AsTrend main window > Data tab > Export of Data group.
The window 'Data Export Options' allows you to specify the data export parameters. The
window is available from:
163
AsTrend
AsTrend main window > Data tab > Export of Data group > the window 'Data Export
Options' run by the button
.
The data export parameters:
- Header - declare one or two line header and place units / aggregates near variable
names;
- Genuine Data - arrange samples of each graph according to its own timeline or a
common timeline;
- Quality Columns - add quality columns and set their format;
- Uniform Data - declare common time column for uniform data.
Fig. Data Report Options.
Fig. The Data Exported to the CSV Format (Samples One-by-One).
164
2 AsTrend - Operation
***
The historical data table export to Clipboard, text, HTML or XLS file is
performed with the use of: Copy to Clipboard, Export to Text File, Export to HTML
File, Export to XLS File from:
AsTrend main window > table view of historical data > Home tab > Table of
Historical Data group > the button Table Export
Fig. The Historical Data Table Exported to a HTML File.
Fig. The Historical Data Table Exported to an XLS File.
165
AsTrend
***
Export to .txt, .csv files or a clipboard is realized in the form of values separated
by separator characters (but, tab delimiters are used for the clipboard). The data are
arranged in columns containing successively: time, variable value. Each variable has
its time/value columns - except in the case of uniform data (constant time interval
between successive samples) - for which it is possible to set a common column of
time. Time is exported in the system format (’2008-02-20 16:48:22’). Additionally, for
alarm graphs and external values the time column contains milliseconds.
.
166
2 AsTrend - Operation
2.28 Context Menus
You can right-click the chart area, legend, table of values and clipboard window to display a
context menu.
The chart area context menu options include:
•
•
•
•
•
Raw Data - add a new raw variable to the chart,
Remove Selected - remove a selected variable from the chart,
Graph Attributes - display a variable card with all attributes declared,
Select All - select all the graphs in the chart,
Copy to Clipboard - copy a current time period to the clipboard,
Fig. The Chart Area Context Menu.
The legend context menu options include:
•
•
•
•
•
•
•
•
•
•
•
•
•
•
•
Raw Data - add a new raw variable to the chart/legend,
Copy - copy a selected variable raw and then paste a copied variable raw,
Remove Selected - remove a selected variable from the chart/legend,
Replace with Empty - remove a selected variable from the chart/legend and enter an
empty raw to the legend instead,
Hide - hide a graph,
Select All - select all the graphs in the chart/legend,
Move Up - move one variable line up,
Move Down - move one variable line down,
Graph Attributes - display a variable card with all attributes declared,
Exchange - exchange a variable to another,
Range - set a measurement and display range,
Points - enable displaying measurement points on the chart,
Labels - enable displaying labels of measurement points on the chart,
Select Legend Columns - select a legend column,
Legend Options - set legend options;
167
AsTrend
Fig. The Legend Context Menu.
The legend caption context menu options include:
•
•
•
•
Show Description - display the window with the attribute description,
Change Caption - change the text of the caption,
Select Legend Columns - select the legend columns to be displayed,
Legend Options - run the window with the legend option parameterization,
Fig. The Legend Caption Context Menu.
The context menu options for the table of current values include:
•
•
168
Single Time Column - display a single time column,
Quality Columns - display a quality column,
2 AsTrend - Operation
•
•
•
•
•
•
No Cursor Binding - activate the option thanks to which changing the active raw in the
table will not change the read line position,
Bind Cursor to Main Read Line - activate the option thanks to which changing the
active raw in the table will change the main read line position,
Bind Cursor to Additional Read Line - activate the option thanks to which changing
the active raw in the table will change the additional read line position,
Samples by Timeline - range the samples by timeline,
Samples One by One - range the samples one by one,
Data Table - close the table of current values;
Fig. The Context Menu for the Table of Current Values.
The context menu options of period clipboard include:
•
•
•
•
Copy to Clipboard - copy a current time period to the clipboard,
Paste form Clipboard - paste a time period from the clipboard,
Empty Clipboard - delete all the time periods saved in the clipboard,
Periods Clipboard - close the period clipboard window.
169
AsTrend
Fig. The Period Clipboard Context Menu.
170
2 AsTrend - Operation
2.29. Period Clipboard
Periods Clipboard is a very useful tool that helps to analyze trends. It is particularly handy if a
user wants to compare the analyzed trend with another one (perhaps somehow related) without
storing the first one. Clipboard is a kind of cache memory, in which various interesting periods
may be stored to be later used. Clipboard capacity is limited by the system memory only.
Clipboard contents may be browsed in the Periods Clipboard window shown below. Each stored
period is described with: Period Start, Period End, Main Read Line, Additional Read Line
and Description parameters.
Period Clipboard is run by the button
from:
AsTrend main window > Home tab > Period group
Fig. Period Clipboard.
2.29.1 Clipboard Functions
Run Period Clipboard
Use:
AsTrend main window > Home tab > Period group > the button
or
AsTrend main window > View tab > Panels group > the button
171
AsTrend
The period clipboard window is always displayed on top. Its closure does not delete the contents
of the clipboard. Storage capacity is not limited. In the case of large contents one can enlarge the
window or move along its content using the slider.
Savie a time period
An interesting period is saved when you click on the button Copy to Clipbard
from:
AsTrend main window > Home tab > Period group
The second way is to use the command Copy to Clipbard
from the context tab Period
Clipboard displayed in the main AsTrend window when the clipboard window is opened.
Paste a time period from the clipboard
An interesting period is pasting to the chart when you click on the button Paste from Clipboard
from:
AsTrend main window > Home tab > Period group
The command inserts the last saved time period or the period selected in the period clipboard
window (in the second case the period clipboard has to be opened at the moment of pasting
operation).
The second way to paste a time period from the clipboard is to double-click on an interesting
period in the period clipboard window.
The third way to paste a time period from the clipboard is to use the command Paste from
Clipboard
from the context tab Period Clipboard displayed in the main AsTrend window
when the clipboard window is opened.
Delete a time period from the clipboard
The period can be removed from the clipboard window by pressing the button
key, after the period is to be deleted has been previously selected in the window.
or Delete
Empty the period clipboard
Clear the entire Period Clipboard contents using the button Empty Clipboard
from the
context tab Period Clipboard displayed in the main AsTrend window when the clipboard window
is opened.
172
2 AsTrend - Operation
Edit the period description
You can edit the description field of a selected time period by click in the field. After entering the
description text, press Enter key.
Other fields can not be modified.
Anchor the period clipboard window in the trend window
The clipboard window can be anchored in the trend window. That means fitting into the chart
area, in such a way that instead of chart area the clipboard window is visible. The chart area is
then covered by the clipboard, but you can switch over two viewes using the tabs Chart/Period
Clipboard.
You can anchor the clipboard window by dragging the window into the chart area.
You can back to independent shape of the clipboard window by dragging the Period Clipboard
tab over the legend area.
You can back to independent shape of the clipboard window placed over the chart area by
dragging the Period Clipboard tab over the chart area while pressing Ctrl key.
zoom in>>
Fig. The Anchored Period Clipboard Window.
173
AsTrend
2.30 0-100% Percent Scale
To facilitate comparing of variables of different value ranges, all variables may be charted at the
chart vertical axis expressed in percents. 0% corresponds to the lowest value of the variable,
100% - to the highest value. The appropiriate range should be set individually or retrieved from
database of variable definitions. Otherwise the axis percents will correspond to the range of
displayed values.
To enable the percent scale, use:
•
the button
from:
AsTrend main window > Chart tab > Axes group
In this mode:
- the variable selection results in charting the value axis appropriate for the specified variable in
the colour of the variable on the right side of the chart;
- the proportional / percent axis is drawn on the left side of the chart;
- reading values by the read line or mouse cursor indicates genuine data, not percent values;
- when more than a single curve is charted with percent axis turned on, the regular axis for the
selected curve is displayed in the color of that curve;
- double-click oudside the chart area removes the regular axis form the chart area;
Fig. The chart with Two OY Axes.
174
2 AsTrend - Operation
2.31 Handling the Table of Current Data
The table of current data is a collection of coordinates of points charted within the
chart area. The table is activated with the use of the button Data Table
from:
AsTrend main window > View tab > Panels group
All measurement points corresponding to variables of the chart are displayed in table
lines. If the number of rows exceeds the number possible to display in the window, the
right side slider appears sampling method.
If the sampling method available with a fixed sampling period has been chosen, the
number of measurement points is the same for each variable.
After opening the table of current values in the AsTrend main window, the additional
context tab with commands is available:
- Single Time Column
and many value columns.
- Quality Columns
- No Binding
read line;
- switch on table view mode with one common time column
- switch on table view mode with quality coumns;
- change of active row in the table will not change the position of
- To Main Read Line
- change of active row in the table will result in changing the
position of main read line; the option is relevant only if the main read line is active;
- To Additional Read Line
- change of active row in the table will result in
changing the position of additional read line; the option is relevant if the additional read
line is active.
- Samples by Timeline
- activates a variant in which all the samples of graphs are
arranged according to the time axis;
- Samples One by One
- activates a variant in which all the sample of graphs are
arranged one after the other;
- Data
- display informations on data types in the table and how the data is
displayed;
175
AsTrend
Fig. The Table of Current Values.
Shifting the read line in the chart area causes the selection of corresponding row in the
table of current values (with possible additional moving the window slider, so that a
selected row is always visible). Adequately, changing the position of selected row causes
a corresponding change in the position of read line.
The table of current values can be saved to a CSV file with the use of the command
Export to CSV
from:
AsTrend main window > Data tab > Export of Data group
The table can be anchored in the trend window. That means fitting into the chart area, in such a
way that instead of chart area the table of current values is visible. The chart area is then covered
by the table, but you can switch over two viewes using the tabs Chart/Table Clipboard.
You can anchor the table by dragging the table into the chart area.
You can back to independent shape of the table by dragging the Table tab over the legend area.
You can back to independent shape of the table placed over the chart area by dragging the Table
tab over the chart area while pressing Ctrl key.
176
2 AsTrend - Operation
2.32 Handling the Table of Historical Data
The mode of historical data table is run by the command Historical Data Table Mode
from:
AsTrend main window > View tab > Window group.
You can back to the standard view by the same command Historical Data Table Mode
context tab View of historical data table mode.
from
The mode of AsTrend operation is saved in a *.trnx file by the administrator. When the file is
opened by the operator, AsTrend will be run in the table view with all the variables and columns
defined.
To create the file with the table of historical data defined, you have to log in as the
AsTrend administrator, activate the mode of historical data table, open the variable definition
database and add variables. Use empty rows for more transparency. You can change the sequence
of variables by drag-and-drop operation. The administrator selects columns to be desplayed in the
table with the use of the button
.
To export the table of historical data to clipboard, text/HTML/XLS file, you have to use
the commands: Copt to Clipboard, Export to Text File, Export o HTML File, Export to XLS
File from:
AsTrend main window > Home tab > Table of Historical Data group in historical data table
mode.
Fig. The Table of Historical Data - Home Tab.
***
177
AsTrend
To change view options, you have to use the context tab View from AsTrend main window
in historical data table mode. The tab allows you to specify the colours of the table and the table
font size.
Fig. The Table of Historical Data - View Tab.
178
2 AsTrend - Operation
2.33 Changing the Colour Palette
There is the possibility in AsTrend to define a default colour palette. Successive curves added to
the trend will be assigned successive colors from the palette. The palette can be defined in the
program options or in trend options.
Define your own colour palette in trend options
Use the tab Colour Palette from:
AsTrend main window > Chart tab > Chart Type group > the window 'Trend Options' run by
the button
.
The tab Colour Palette is available when the option Use the colour palette from trend
options is set on the tab Appearance.
Fig. The Window 'Trend Options' - Appearance.
The Colour Palette tab allows you to:
- select a predefined colour palette
or
- create own palette.
179
AsTrend
Fig. The Window 'Trend Options' - Colour Palette.
Define your own colour palette in program options
Use the tab Colour Palette from:
the button
menu > Program Options command > Program Options window.
The Colour Palette tab allows you to:
- select a predefined colour palette
or
- create own palette.
180
2 AsTrend - Operation
Fig. The Window 'Program Options' - Colour Palette.
181