1
STATA TUTORIAL
B. Rabin with modifications by T. Marsh 5.2.05
(content
also from http://www.ats.ucla.edu/stat/spss/faq/compare_packages.htm)
Why choose Stata?
Stata has a wide array of pre-defined statistical commands, but also allows for
programming flexibility. For memory and data management capabilities, Stata may not
be quite as extensive as SAS, however Stata has numerous powerful yet very simple data
management commands.
Stata performs most general statistical analyses (regression, logistic regression,
survival analysis, analysis of variance, factor analysis, and some multivariate analysis).
The greatest strengths of Stata are probably in regression (easy to use regression
diagnostic tools), logistic regression, (add on programs are available that greatly simplify
the interpretation of logistic regression results, and ordinal logistic and multinomial
logistic regressions are easy to perform). An array of robust methods are easy to use
(robust regression, regression with robust standard errors, and many other estimation
commands include robust standard errors as well). Stata also excels in survey data
analysis, with the ability to analyze survey data for regression, logistic regression,
poisson regression, probit regression, etc. The greatest weaknesses in this area would
probably be in the area of analysis of variance and traditional multivariate methods (e.g.,
manova, discriminant analysis, etc.).
What if this tutorial doesn’t have what I’m looking for?
The Stata manuals and in-program help are extremely helpful. To find the command you
want, try searching using the help pull down menu in Stata. If you already know the
command, but not how to execute it, look in the manuals, which give more detailed
explanations and more examples. Both help options offer a “Complementary” and
“Related” section for commands that might be closer to what you’re looking for. The
commands are in alphabetical order in the manuals. To figure out which reference book
your command is in from the computer-based help look in the upper right hand corner
after manual: the large alphabetized reference manuals are referenced by [R] (whether or
not the command starts with an R), the User’s Guide is [U], Time-Series manual is [TS],
Graphics is [G], plus other specialized manuals also exist.
To learn how to read the manual entries, here is an example:
Linear Regression
regress depvar [varlist] [weight] [if exp] [in range] [, level(#) beta robust
cluster(varname) score(newvar) hc2 hc3 hascons noconstant tsscons noheader
eform(string) depname(varname) mse1 plus ]
Things to note above:
The underlines are the minimum of the command section that must be written. regress
can be written as reg or regre but not as re.
Anything in [ ] does not have to be specified for the command to be complete. I.e. the
command above could actually be written just as regress var1
Anything in italics is the general word, you must supply the appropriate insertion from
your own data. (i.e. varname will become var1 etc.)
If there is no space between the specification (i.e. cluster(varname)) then make sure you
don’t insert one! (i.e. WRONG cluster (varname) )
Varlist means as many variables as you want to specify, varname means only one
variable can be inserted into that part of the command, newvar means a new variable will
be created and you can specify how it will be named.
Exp means a logic equation like var1>=100 or varname==”yellow”
# means insert a number
weights means insert the variable that contains your weighting scheme. Look in the
User’s manual at the weight instructions.
Anything that comes after the comma (here it begins with _level(#)) is an option. Look
below the command for explanations of all the options that are listed.
Description
regress fits a model of depvar on varlist using linear regression.
Here they will give you a brief detailing of what the command does.
by ... : may be used with regress; see help by.
This specification is placed before the command (i.e. by var1: regress) and allows the
command to be executed separately over several categories, with output listed for each of
the separate categories.
aweights, fweights, iweights, and pweights are allowed; see help weights.
depvar and the varlist following depvar may contain time-series operators; see help
varlist.
regress shares the features of all estimation commands; see help estcom.
regress may be used with sw to perform stepwise estimation; see help sw.
Look how helpful they are, if you need more help, you can always look up these
commands!
Later, the manual entry will specify examples of this command’s common uses, how
outputs (like the regression coefficients, standard errors, etc) are stored in memory, and
the formulas used in the command if you are in a mathematical mood.
I. Getting Started
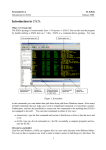
A. The Stata Main Screen:
1) Results Window – where results are printed to the screen
2) Review Window – keeps a review of recent commands (click on a
command to insert it again into the command window)
3) Command Window – where you issue Stata commands, similar to
Gauss, for easy programming
4) Variables Window – list variables in the current dataset (click on a
variable name to insert it into the command window)
B. Other Screens:
1) Data Browser – view your data. Best for everyday use. The browser
(or editor) need to be closed to run any commands.
2) Data Editor - view and edit your data. Use only when you need to
manually change the data (this shouldn’t happen often).
3) Do File – text editor to write and run programs. Highlight a portion of
the file and run only that section.
4) Graph- where graphs are displayed. (I am not going to go into graphs
in this tutorial)
C. Other Notes:
1) Stata is case sensitive! (regress and Regress are not the same thing!)
2) You do not have to put a ; at the end of the line. Therefore a line
ends when you press <Enter>. If you have a command that you
want to extend over 2 or more lines, place /// at the end of any
line you want to continue onto the next to tell Stata to keep reading
before executing.
a) a side note: * will comment out an entire line. /* and */
will comment out words between them.
3) You can abbreviate Stata commands. The shortest unique name is
sufficient. i.e. reg for regress, sum for summarize, des for
describe, g for generate
4) Stata simulates a Unix shell environment, thus you can use Unix
Commands such as cd, mv, cp, etc.
5) Logic Symbols
== - equal
~= - not equal
!= - not equal (either will work)
< - less than
> - greater than
<= - less than or equal to
>= - greater than or equal to
& - and
| - or
= - this is for assigning a value, not for the logic “equal to”
II. Data in Stata
A) Getting data into Stata
1) enter it by hand into data editor
.
2) cut and paste into data editor
3) import using the file, import menu option
4) use Stat-Transfer
5) insheet (formatted text data from spreadsheet), infile (unformatted data
in raw from)
a) note you can have variable names specified in file or can have them
specified in command
b) variables can be text or numeric
c) EXAMPLE: insheet pce year quarter using///
c:/stata101/pce.txt
B) Useful commands to look at data
1) summarize – gives summary stats. Example: sum pce
a) if you use sum pce, d you will get more detailed results with
percentiles.
b) by year: sum pce. This will give you separate summary
statistics for each year
c) sum pce in 1/50: this sums pce in observations 1-50
2) describe - displays variables and data types in memory
3) list – shows observations (convenient when used with if or by. i.e.
list if pce>100 )
4) label - attaches a note to the variable. Example: label variable
pce “personal consumption expenditure”
5) tabulate – shows frequency table
6) sort – example - sort year quarter
7) count – gives you number of observations
8) order- changes the order of the variables in your data browser/editor.
9) correlate – gives you the correlation matrix for the variables specified.
Example: corr pce year
III. Programming in Stata
A) 3 ways to program
1) menu driven – you can do most anything through the menus and
options, not the best way, but good if you want to know what
options are available on command or figuring syntax. Importing
data may be easier this way.
2) command line- best for quick and dirty checks
3) BEST WAY!- DO-File. It provides documentation and replication
B) Getting Started on Do-Files
1) Suggested commands at the start of every program
clear
(clears the data viewer, you cannot open a new file unless the
previous one is cleared or saved)
set more off (allows
the screen to scroll without the
"more" command)
set mem 100m (allocates
cd h:/
memory)
(sets the working directory)
capture log close (capture
"eats" error messages)
log using log.log, replace
use dataset1 (use
calls files that are stored in stata formats)
.
.
.
log close
If you want to have your commands delimited, that is you have to tell the computer when
the end of the line is, like so; Then enter also in the heading commands #delimit;
C) Basic Command Syntax
1) [by: varlist] [=exp][if exp][in range][weighttype=weight][, options]
2) Example:
by year: sum pce if year>1990, d
sum pce if (quarter==1 | quarter==2) in 1/50, d
D) Useful Commands
1) generate and replace
a) generate is used to create the most basic variables.
b) replace recomputes an existing variable and replaces its values
(you can’t generate a variable twice.)
c) examples:
gen dom=0 if manuf== ”toyota” | manuf== ”honda”
replace dom=1 if manuf== ”gm” in 1/20 (this
only
replaces dom in observations 1-20
generate pce_100=pce/100
generate yryr=100*(pce/pce[_n-4]-1)
- note
_n refers to the observation number. _N refers to
the total number of observations
generate present=”yes” if yryr~=.
replace present=”no” if yryr==.
2) egen- Extensions to generate
a) extremely useful!!!
b) this is used for generating a more complicated variable, i.e. if
you want to create a variable but need to look across
observations or variables to do so)
c) examples:
bysort year: egen mean=mean(pce)
bysort year: egen sd=sd(pce)
egen mean=rmean( pce_q1 pce_q2 pce_q3 pce_q4)
3) keep and drop
a) examples
drop pce_100 mean sd present
keep if yryr~=.
drop if (year<=1975 & quarter==3) | year>2000
(note that
you can drop variables and observations)
4) merge
a) merge joins corresponding observations from the dataset that is
currently in memory (called the master dataset) with those
from another stored as filename (called the using
dataset(s)) into single observations.
b) Example: Assume I have a file that has cpi data and pce data in
2 different datasets for various years
Here is an example command sequence:
use cpi
sort year quarter
save cpi, replace
use pce
sort year quarter
merge year quarter using cpi
assert _merge==3;
drop _merge
c) Notes on this sequence:
i) make sure that the master data and the using data are both
sorted the same. (in this case the master data is the
pce data and the cpi data is the using data)
ii) when merging, a new variable is created called _merge.
This will take a value 1 if the observation is found
only in the master dataset, 2 if the observation is
found only in the using dataset and 3 if the
observation is found in both. Assert is a command
that will stop the do file if the logic statement is not
true. Thus, if all the _merge values were not 3, then
some didn’t merge correctly. Or perhaps you know
that one dataset has more years than the other. In
any case, assert is a good command to insert what
you think should have happened, to make sure that
the do file will stop if something went wrong.
I then dropped the _merge variable in case I want
to merge anything again. (as with generate and
replace, I cannot regenerate the _merge variable if
there is one already present in the dataset). You can
also rename the merge variable (rename merge
pce_cpi)
5) collapse
a) converts the data in memory into a dataset of means, sums,
medians, etc.
b) Example: Using the above data, assume that I am only
interested in the mean of the year, not in quarterly
observations. I can collapse the dataset by year.
collapse (mean) pce cpi, by (year)
c) Notes on this command:
i) you can use mean, median, count, sum, max, min, etc.
ii) you will drop any variables not collapsed and not in the
“by” statement
6) reshape
a) This is basically the pivot table in excel.
b) You can reshape wide (table) or reshape long (list)
c) examples:
reshape wide pce, i(year) j(quarter)
7) assert
a) this verifies that a statement is true and if it is not true stops the
program – good check
b) example:
assert pce<110
8) notea) THIS IS VERY IMPORTANT! -if you want other people (and
you!) to know how you constructed something a month
from now. this attaches a note to a dataset
b) note with TS will attach a time stamp
c) to read the notes attached with a dataset, type “notes” in the
command line
c) example creating a note
note: this dataset was created with –create.do- by Bess on TS
9) foreach
a) this is the looping method that I find most useful
b) example 1:
foreach i of numlist 1 4/8 13(2)21 103 {
display `i'
}
c) notes on this example:
i) This will display 1 4 5 6 7 8 13 15 17 19 21 103
ii) This example demonstrates how to use the counting
numbers in a numlist
d) example 2:
foreach j of varlist pce1 pce2 pce3 pce4 {
foreach i in 1 2 3 4 {
gen `j'_cpi`i'= `j'*cpi`i'
}
}
e) notes on this example
i) This will generate a series of variables named
“pce1_cpi1” or “pce3_cpi1” that take the value
pce1*cpi1 and pce3*cpi1, respectively
ii) This example shows a nested loop and introduces local
macros, which we will get to in the next major
section. (however, note the apostrophes! They are
very important!)
10) while
a) this is a different type of looping method
b) example
local i = 1
while `i' < 40 {
display `i’
local i = `i' + 1
}
B) Programs and procedures
1) here is how to set up a procedure to be called from a main
program file
capture program drop myprog (get
rid of other versions of prog)
program define myprog
args var1 var2 var3
(the args are the arguments for
your program)
.
.
.
end program
i) Just as in Gauss, you must save and run your procedure
in order to initialize it. If the procedure is not
initialized it will not be recognized by the main
program
b) calling the procedure from the main program file
myprog var1 var2 var3
V. Saving files
A) Saving files in Stata format
1) Stata data files are dta, do files are .do and log files are .log or .smcl.
2) Stata will not let you save over another file of the same name, so must
use “, replace” option. (example save pce, replace). There is
also an append option which is good for appending to a log file.
B) outfile – saving datasets in txt files
1) You can save the current dataset in Stata memory using the outfile
command. (or the “export” option under the “File” menu)
2) Example using outfile.
outfile using pce.txt, replace
VI. Regressions in Stata (because what would an economist be without regressions?)
A) Basic linear regression syntax:
regress depvar [varlist][weight][if exp][in range][, options]
1) Some examples of options are noconstant or robust
2) Some examples of simple regressions
reg dep ind1 ind2 ind3
by year quarter: reg dep ind1 ind2 ind3
reg dep ind2 ind3 if year==1973 | year==1982
reg dep ind1 ind2 ind3 [aweight=var4]
3) Predicting resultsa) The “predict” calculates predictions, residuals, influence
statistics, and the like after estimation
i) Typing "predict newvarname" creates newvarname
containing "predicted values" . There are many
options that can be added to predict, i.e. resid (for
residuals) or stdp (for standard error)
ii) example
regress pce cpi
predict pcehat
predict pceresid, resid
4) Obtaining saved predefined results and matricies- There are many
matrices, vectors, and scalars you can obtain, here are some helpful
ones.
a) the coefficient vector is stored as e(b)
b) individual variable coefficients are stored as _b[varname] or
_b[#], where the # is based on the order in the regression.
c) individual variables s.e. are stored as _se[varname]
d) the model R2 is stored as e(r2)
e) the variance-covariance matrix of the estimators is stored as
e(V)
f) remember each time a new regression is run, the stored results
are replaced!
B) creating dummies in regressions
a) if you already have your dummies created, you can run the
regression in the normal way
b)easy way to create them: xi - expands terms containing
categorical variables into dummy variable sets by creating
new variables
c) example:
xi: regress weight age height i.sex i.county
i) here the sex and the county dummy variables are created
from the categorical variables already in your
dataset
C) other types of regressions
1) ivreg – instrument regression
2) xtreg – cross sectional time series (you can add in fe)
3) xtivreg – cross sectional time series, instruments
4) logit or probit
etc.
VII. Matrices and Graphs
A) Things that I am not going to cover but are possible!
VIII. Help
A) For additional help, you can type “help <command name>” in the command
window for help on a particular command, or “search <command name>”
to find related commands
B) You can use the help menu
Good luck and enjoy!