1
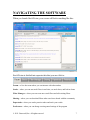
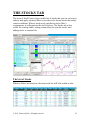
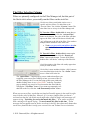
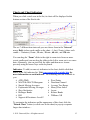
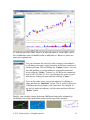
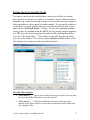
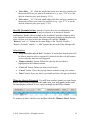
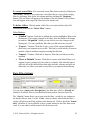
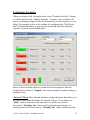
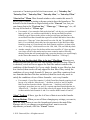
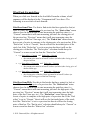
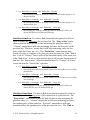
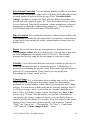
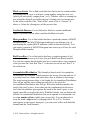
User Manual © 2011 Garsworld, Inc. All rights reserved. v.22111 INTRODUCTION StockVision PowerScan (“StockVision”) is a one-of-a-kind stock-screening program that utilizes advanced technical analysis and proprietary formulas to help traders of all styles and abilities find better stocks to trade and better places to enter & exit. StockVision performs real-time intraday scans in addition to end-of-day scans, and you can create your own unique custom scans that contain advanced formulas. StockVision also includes lots of effective pre-made scans and chart indicators, and has a built-in sharing system where you can download scans that other traders have chosen to share with the community. StockVision also has a paper trading system where you can safely test out new trading strategies and track the results before you trade them with real money. Another useful feature of StockVision is its built-in live chat room where you can talk to traders from around the world, share trading ideas and market predictions, ask experienced traders questions you have, and be able to adapt more easily to changing market conditions. With all of these features available to you at a bargain price, we believe that StockVision is the best deal in the industry! Whether you are an experienced trader, or brand new to trading, be sure to take our FREE trial so you can discover for yourself how StockVision can help improve your trading. © 2011 Garsworld, Inc. All rights reserved. 2 BACKGROUND A stock’s price moves up or down by virtue of a continuous auction, with the price determined by how high of price someone is willing to pay to buy the stock or how low of a price someone is willing to sell the stock for. Over the short-term, a stock’s price is not driven too much by the fundamental value of the underlying company but is instead controlled by speculators (who are often investors) and the prices at which they are willing to trade. For example, when a very large fund really wants to buy a lot of shares of a stock because it’s speculating that its price will eventually go up a lot, it will be willing to pay moderately higher prices in order to be sure to buy all of the shares it desires fast enough (at what it considers to be a reasonably ‘good’ price). Therefore, the stock’s price will likely go up significantly unless there is also another large market participant that really wants to sell a lot of shares in that same price range. Likewise, if a very large fund really wants to sell a lot of shares of a stock because it’s speculating that its price will eventually go down a lot, it will be willing to sell at moderately lower prices in order to be sure to sell all of the shares it wants to fast enough (at what it considers to be a reasonably ‘good’ price). Therefore, the stock’s price will likely go down significantly unless there is also another large market participant that really wants to buy a lot of shares in that same price range. Trading is thus all about supply & demand and speculating on what the larger speculators will do. Although some large market participants may be speculating based on the company’s fundamentals, it is important for you to understand that most everything there is know about a company is already reflected in its chart (i.e., in its price movement and volume). The movement of a stock is the result of thousands of investors placing their © 2011 Garsworld, Inc. All rights reserved. 3 ‘bets,’ so the stock’s chart is essentially a giant opinion poll containing far more useful information than you could ever learn by studying the company yourself. The stock’s chart will already reflect every piece of relevant knowledge and news about the company because the large market participants that drive the price movement have huge research departments that can quickly interpret news about it as it breaks and that constantly follow every single aspect of the company (including going out in person to investigate and personally interviewing the entities that do business with the company). There isn’t anything you can learn about a publicly-traded company that is not already known by lots of other people. The good news is that you can get a powerful edge if you can properly interpret a stock chart and be alerted to the presence of reliable patterns in a timely fashion. Because a stock chart produces a picture of the price and volume action of that stock, it can reveal footprints that the ‘smart money’ is leaving behind while placing their bets, as well as reveal when ‘aggressive funds’ and ‘momentum traders’ have likely over-reacted during the shortterm. Furthermore, as of the last couple of years, the majority of trades in most stocks are made automatically by computer algorithms, and how these algorithms are designed to act and interact with each other can further contribute to commonlyrecurring chart patterns on an intraday basis too. Moreover, because lots of traders rely on technical analysis itself, certain chart setups tend to be partly self-fulfilling. Real-time stock screening software that has powerful and customizable technical analysis capabilities can enable you to find and profit from all kinds of these recurring patterns, as well as help you adapt as the patterns evolve. That’s where StockVision comes in and why it is a must-have for serious traders and aspiring traders! © 2011 Garsworld, Inc. All rights reserved. 4 © 2011 Garsworld, Inc. All rights reserved. 5 TABLE OF CONTENTS Navigating The Software . . . . . . . . . . . . . . . . . . . . . . . . . . . . . . . . . . . 7 The Top Data Bar . . . . . . . . . . . . . . . . . . . . . . . . . . . . . . . . . . . . . . . . . 8 The Stocks Tab . . . . . . . . . . . . . . . . . . . . . . . . . . . . . . . . . . . . . . . . . . 10 Charts and Chart Indicators . . . . . . . . . . . . . . . . . . . . . . . . . . . . . . . 15 The Filter Manager Tab . . . . . . . . . . . . . . . . . . . . . . . . . . . . . . . . . . . 19 What Each Formula Does . . . . . . . . . . . . . . . . . . . . . . . . . . . . . . . . . 23 The Sharing Tab . . . . . . . . . . . . . . . . . . . . . . . . . . . . . . . . . . . . . . . . . 33 The Papertrade Tab . . . . . . . . . . . . . . . . . . . . . . . . . . . . . . . . . . . . . . 34 The Forum Tab . . . . . . . . . . . . . . . . . . . . . . . . . . . . . . . . . . . . . . . . . . 36 The Preferences Tab . . . . . . . . . . . . . . . . . . . . . . . . . . . . . . . . . . . . . . 38 Feedback / Tech Support . . . . . . . . . . . . . . . . . . . . . . . . . . . . . . . . . . 39 Testimonials / Reviews . . . . . . . . . . . . . . . . . . . . . . . . . . . . . . . . . . . . 39 © 2011 Garsworld, Inc. All rights reserved. 6 NAVIGATING THE SOFTWARE When you launch StockVision, your screen will look something like this: StockVision is divided into separate tabs that you can click to: Forum = a live chat room where you can interact with other traders Stocks = where you can run stock filters in real-time, set stock alerts, and look at charts Filter Manager = where you can create new stock filters and edit existing filters Sharing = where you can download filters other users have shared with the community Papertrade = where you can do practice trades and track your results Preferences = where you can change certain general settings of the program © 2011 Garsworld, Inc. All rights reserved. 7 Switching between the U.S. Market and the U.K. Market: StockVision can be used for U.K. stocks as well as U.S. stocks. To switch to the U.K. Market, click near the British flag at the top of the screen. To switch to the U.S. Market, click near the American flag. The Top Data Bar: StockVision’s top data bar shows lots of general market data that updates in close to real-time. The far left section shows the value of the most popular stock indexes and how many points they have gained/lost that day as well as the percentage gained/lost that day. The number of stocks that have gone up compared to the previous day’s close (“Advancers”) and the number that have gone down compared to the previous day’s close (“Decliners”) are also shown in the top data bar. The “A/D Ratio” calculates the Advancers divided by the Decliners to provide a rough gauge of the market’s underlying strength/weakness that day. The right section contains the following information: Volume Change: shows the % volume increase (green) or decrease (red) for the current day’s trading volume compared to the recent normal average volume. Market moves on very high volume tend to be more trustworthy; market moves on very low volume tend to be more tenuous. Note that this number is not useful during pre-market. TICK: During regular trading hours this shows the number of stocks that just traded higher than their previous last price minus the number of stocks that just traded lower than their previous last price. If the net result is a very large green number then this often suggests that conditions are getting temporarily overbought and there might be some kind of (short-term) pullback soon. If the net result is a very large red number then conditions may be temporarily getting oversold so there could be a (short-term) bounce soon. © 2011 Garsworld, Inc. All rights reserved. 8 EMini Futures [U.S. Market only]: After regular trading hours end (from about 4:00pm to 6:30pm), and then the next day before regular trading hours begin (from about Midnight to 9:30am), this shows how much higher/lower the E-mini S&P 500 futures contract is trading. If this number is at least a +500 green number just before 9:30am, then the stock market will usually have a decent-sized ‘gap up’ (i.e., most stocks will open a bit higher than the price they closed at the previous day). Likewise, if this number is at least a -500 red number just before 9:30am, then the stock market will usually have a decent-sized ‘gap down’ (i.e., most stocks will open a bit lower than the price they closed at the previous day). Bear/Bull: This calculates the composite sum of the five best-rated and five worst-rated stocks according to their “SV Score.” This Bear/Bull meter is a general gauge of market sentiment and tends to be more reliable in periods of higher volume and less reliable in periods of lower volume. The SV Score is a unique proprietary indicator in StockVision that ranks each stock based on its recent strength/weakness according to several different technical analysis criteria (e.g., accumulation/distribution, above/below a key moving average, breakout/breakdown, overbought/oversold, in an uptrend/downtrend, MACD crossover, MACD curve, presence of a reversal pattern, etc.). Greater weight is given to the criteria that have been more accurate lately so the SV Scores have the ability to self-adjust as market patterns change. Oil & Gold: shows how many points the relevant oil and gold ETFs have gained or lost compared to the previous day’s closing prices for them. Other popular market indicators active traders trading the U.S. Market sometimes watch: Charts of the major index ETFs, such as SPY, QQQQ, DIA, and IWM. Charts of the U.S. Dollar ETF (UUP) and/or the Euro ETF (FXE). o Throughout 2010 into 2011 a very common pattern was that the U.S. stock market would usually go the opposite direction that UUP was going. The VIX Market Volatility Index for the S&P 500 (or an ETF of it such as VXX). The financial sector ETF (XLF) became especially relevant during 2008-2010. © 2011 Garsworld, Inc. All rights reserved. 9 THE STOCKS TAB The heart of StockVision is the sortable list of stocks that you can view in its entirety and apply advanced filters to in order to be shown stocks that satisfy certain conditions. When a stock newly satisfies an active filter’s requirements, it will appear in the stock list here. The Stocks tab is also useful for viewing charts, setting custom alerts for specific stocks, and adding stocks to custom lists. The List of Stocks: When no filters are turned on, the main stock list will look similar to this: © 2011 Garsworld, Inc. All rights reserved. 10 You can click a column heading to re-sort the list by that column and click again to toggle between descending/ascending order. These are the columns: T-stamp: shows what time the stock satisfied the filter condition(s) and appeared in the list. When you first turn on a new filter any stocks that appear will have the current time displayed in this column. When no filter is turned on and all stocks are displayed, the T-stamp will usually show as “N/A.” During regular trading hours when having one of more filters turned on, it can be useful to sort the stock list by the T-stamp column so that each new stock that satisfies a filter will appear in real-time at the top of the list. Filter: shows the color of the filter that found that stock – just match the color in this column to the color of an active filter in the Filter Selection list on the left. When no filters are turned on, the Filter column will usually be blank. If an alert you previously set for a specific stock was triggered, however, the Filter column will be gray and have an X in it. Sym: shows the stock symbol. NYSE stocks usually have a 3-letter symbol and NASDAQ stocks usually have a 4-letter (or 5-letter) symbol. The full company name is displayed at the top of the chart when you click the stock’s row. SV Score: a unique proprietary indicator in StockVision that ranks each stock based on its recent strength/weakness according to several different technical analysis criteria (e.g., accumulation/distribution, above/below a key moving average, breakout/breakdown, overbought/oversold, in an uptrend/downtrend, MACD crossover, MACD curve, presence of a reversal pattern, etc.). Greater weight is given to the criteria that have been more accurate lately so the SV Scores have the ability to self-adjust as market patterns change. % Chg: the % gained or lost from the previous day’s closing price. %-Open: the % gained or lost from the current day’s opening price. Beta: shows how volatile a stock has been over the past month or so. The higher the number, the more volatile the stock. Aggressive traders often like trading more volatile stocks. Note that this StockVision Beta measurement is not related to the market as a whole and differs from how the term “beta” is often used in other contexts. Streak: shows how many days in a row a stock has gone up or down (based in relation to the previous day’s closing price). % Gap: what % the stock is expected to open above (‘gap up’) or below (‘gap down’) its previous closing price based on where the stock is trading during pre-market. For the U.S. Market, this number will start updating © 2011 Garsworld, Inc. All rights reserved. 11 around 8:30am, and traders often sort by this column a little bit before regular trading hours begin to identify very strong/weak stocks. Stocks with extreme gaps often reverse sometime during the first hour of trading. Note that after regular trading hours end (i.e., 4:00pm for the U.S. Market), the % Gap column will switch over to showing approximately how far above/below its closing price the stock is trading in after-hours. $Ave: shows the average price the stock has been trading at recently. In general, lower-priced stocks tend to be more volatile than higher-priced stocks. Higher-priced stocks can often be cheaper to trade, though, if your broker offers a per-share commission plan and you are allocating a fixed amount of money for each trade. Volume: shows how many shares a stock has traded in the current session (or the previous session if it’s before regular trading hours have begun and the stock has not traded any shares during pre-market). % Vol Chg: shows the stock’s % change in volume compared to its average volume for that time of the day over the past month or so. Stocks trading on large volume often make nice intraday moves and can sometimes be effective swing trades as well. Note that this column is not useful during pre-market. Elements Above the Stock List: There are lots of useful features located above the stock list: Price and Volume Screen: Here you can specify a minimum & maximum price and/or a minimum average daily volume amount that stocks must satisfy in order to appear in the stock list. Press TAB after typing in the numbers to update the stock list. The minimum volume amount must be entered in thousands of shares (K) without using commas (e.g., 500 would mean 500,000 shares and 2500 would mean 2,500,000 shares). Note that individual filters can optionally override these settings if they contain the “Price/Volume Constraint” formula. Stock List Selection menu: Here you can choose to show another list of stocks to view and apply filters to besides the “Master List.” The menu will always contain a list called “My Watchlist” and you can add stocks to this © 2011 Garsworld, Inc. All rights reserved. 12 list by clicking on their row(s) and then clicking the “Add to Watchlist” button. You can also click on and highlight multiple stock rows at once and then click the “Create List” button in order to add those stocks to another separate custom list. To delete a custom list you created, choose that list from the menu and click the “Delete” button. Additionally, you can import a plain-text file containing a custom list of symbols (one-per-line) by clicking the “Import...” button. Note that symbols in your imported list that are not also contained in the Master List will not appear in the software. Sector and Industry menu: Here you can choose to display stocks only from a specific industry. The sectors are ranked according to how much accumulation/distribution they have experienced in the current (or most recent) session. Show stocks checkbox: When this is checked, regular stocks will be shown in the stock list. Show ETFs (bull) checkbox: When this is checked, bull ETFs will also be shown in the stock list. Bull ETFs are exchange-traded funds for a particular index, market sector, commodity, or currency that go UP when the price of their underlying component(s) INCREASES. Certain bull ETFs (‘ultra’ and ‘3X’ ETFs) incorporate leverage, which makes their price movements more volatile. Note that ‘3X’ ETFs are only intended to be daytraded and are prone to gradually decaying when held overnight (especially for long periods of time). Show ETFs (bear) checkbox: When this is checked, bear ETFs (aka ‘inverse’ ETFs) will also be shown in the stock list. Bear ETFs are exchange-traded funds for a particular index, market sector, commodity, or currency that go UP when the price of their underlying component(s) DECREASES. Certain bear ETFs (‘ultra short’ and ‘3X’ ETFs) also incorporate leverage, which makes their price movements more volatile. Once again, note that ‘3X’ ETFs are only intended to be day-traded and are prone to gradually decaying when held overnight (especially for long periods of time). Active traders commonly use bear ETFs to be able to profit from down-days in the market, and these ETFs can sometimes be a safer alternative to short-selling individual stocks. Find textbox: Use to search for a certain symbol and jump to it in the list. Export button: Click to save the current list of stocks to your computer. News button: Click the stock row you want to see news for and then click this button to pop up a window containing recent news stories mentioning the stock. © 2011 Garsworld, Inc. All rights reserved. 13 The Filter Selection Column: Filters are primarily configured via the Filter Manager tab, but this part of the Stocks tab is where you actually run the filters on the stock list: Click in one of these small white circles to see a specific sub-list of filters. To add a filter to the “Favorite Filters” list, click the “Favorite” button. The other filter lists are set-up via the Filter Manager tab. To Turn On a Filter: double-click its name here or click its name and then click the “Activate Filter” button at the bottom. The color of the filter will then appear, the filter’s title will be shown in bold, and “on” will appear to the left of the filter. You can have multiple filters turned on at the same time. Visit www.garsworld.com/psfilters.htm for more information on the various default filters. To Turn Off a Filter: double-click its name again or click its name and then click the “Deactivate Filter” button at the bottom. To turn off all filters, double-click “All Stocks” at the top of the filter list. A brief description of the filter will usually appear here when you click its name. Click a filter’s name and then click the “+Up” button to move that filter higher in the list. The “-Down” button moves a filter lower in the list. The “Quick Filter...” button pops up a new window that allows you to quickly create a new filter similarly to how you create a filter in the Filter Manager tab. You can also bring up this same window by double-clicking where it says “Quick Filter” in the list. From that pop-up window you can test to see what stocks that filter finds by clicking the “Test Filter” button. If you want to permanently save that filter to the list, click the “Add Permanently to List” button. When you turn on a filter, stocks that are found will usually appear in the stock list right away with the color of that filter. However, if it’s a more complex filter you haven’t activated yet that day, the initial search might take a little bit longer and a message will appear saying, “Searching for stocks that match this filter...” If no stocks are found, then a message will appear saying, “No stocks match this filter at this time.” If that message does not appear and no stocks are shown in the list, then that usually means that stocks were found but don’t satisfy your current Price and Volume Screen restrictions. © 2011 Garsworld, Inc. All rights reserved. 14 Charts and Chart Indicators: When you click a stock row in the list, its chart will be displayed in this bottom section of the Stocks tab: The are 7 different time intervals you can choose from in the “Interval” menu: Daily (where each candle on the chart = 1 day), 2-min. (where each candle = 2 minutes), 5-min., 15-min., 30-min., 60-min., and 120-min. You can drag the “Zoom” slider to the right to zoom in to focus on more recent candles and you can drag the slider to the left to zoom out to see more data. Alternately, you can just click the slider and then move it more precisely using the arrow keys on the keyboard. Indicators: To add (or remove) indicators to the chart, double-click their names in the left indicator list. Visit www.garsworld.com/adx.htm for more information on each indicator. The following ones are available to you: ADX (DMI) MACD & MACD Histogram Simple Moving Averages Exponential Moving Averages Slow Stochastics Bollinger Bands RSI Support & Resistance Levels!! Pivot Points Donchian Channel Average True Range Money Flow Index Aroon Keltner Bands Williams %R To customize the indicators and the appearance of this chart, click the “Detach Chart” button (or click once in the chart) to pop up a separate larger chart window… © 2011 Garsworld, Inc. All rights reserved. 15 As with the previous chart, there is an interval menu, a zoom slider, and a list of indicators you can double-click to add/remove. However, there are many new options too: You can customize the period (or other settings) of an indicator by clicking on its name, typing a number in the lower textbox(es), and then pressing TAB or clicking the “Update” button. You can also add gridlines to certain indicators at particular numerical levels using the “Grids...” button (e.g., for RSI at the commonlyused levels of 70 and 30). You can customize the colors of each indicator by clicking its name and then clicking “Colors...” You can also make a new copy of an indicator by clicking its name and then the “Duplicate” button. This is useful to show lots of different moving averages at the same time, for example. To get rid of a duplicate indicator, click its name and then click the “Delete” button. Finally, you can also choose between 4 different chart color schemes by clicking in one of the small white circles at the top of the window: © 2011 Garsworld, Inc. All rights reserved. 16 Setting Alerts for Specific Stocks: You can set an alert to be notified when a stock rises or falls to a certain price, goes up or down by a certain %, or satisfies certain technical analysis formulas (e.g., when one moving average crosses another moving average or when an indicator value reaches a certain number). To pop up the window to set an alert for a stock, double-click its row in the stock list or click it once and click the “Set Stock Alerts...” button. You can also highlight multiple stocks at once by holding down the SHIFT key (for stocks grouped together) or CTRL key (for stocks not grouped together) while clicking them before you click “Set Stock Alerts...” The window below will then pop up where you can set the alert(s). You can once again highlight multiple stocks, in the left column, if you want to set the same alert for them. Alert By Price Section: “Price falls to __”: Type a price number in the upper textbox to set an alert for when the stock reaches that exact (lower) price. “Price rises to __”: Click the small white circle here and type a price number in the upper textbox to set an alert for when the stock reaches that exact (higher) price. © 2011 Garsworld, Inc. All rights reserved. 17 “Price falls: __%”: Click the small white circle here and type a number for the percent decrease you want to be notified of (e.g., type “1.50” to set the alert for when the price goes down by 1.5%). “Price rises: __%”: Click the small white circle here and type a number for the percent increase you want to be notified of (e.g., type “2.75” to set the alert for when the price goes up by 2.75%). Alert By Formula Section: Instead of a price alert you can alternately set an alert based on a simple technical analysis formula or an advanced formula combination. Double-click a formula in the Available Formulas column to add it to the Applied Formulas column. Note that configuring formulas works about the same way here as it does in the Filter Manager tab (and the “Modify...,” “Remove,” and “<<” buttons do the same things as the “Modify Formula...,” “Remove Formula,” and the “<< Add” buttons that are in the Filter Manager tab). Other Buttons: “Keep alert alive after it fires” checkbox: If unchecked, then the alert will be deleted when the alert is triggered. If checked, the alert will still remain set even after the alert has been triggered. “Remove Stock(s)” button: Deletes the alert for the stock that is highlighted in the lefthand column. “Clear All” button: Deletes the alerts for all stocks. “Cancel” button: Closes the pop-up window without saving your actions. “Done” button: Saves any alert(s) you made and closes the pop-up window. When An Alert is Triggered: You will hear an alert sound (you can choose which sound in the Preferences tab) and a new row will appear in the stock list that displays a black X over a gray rectangle in the Filter column: To remove an alert, click its row and then click the “Remove Alert” button. © 2011 Garsworld, Inc. All rights reserved. 18 THE FILTER MANAGER TAB This tab is primarily for creating new filters or editing existing filters. A ‘filter’ is simply a group of individual ‘formulas’ that represent certain conditions –– all (or some) of which a stock must satisfy in order to appear in the stock list (in the Stocks tab) when the filter is turned on. To edit a filter: Click its name in the left column. The middle column displays the formulas currently in that filter, and the right column shows all of the available formulas that you can add to the filter. Note that as you edit your filter the changes will be saved automatically (but you can also optionally click the “Save Changes” button too). To add a new formula to the filter: Double-click the formula in the right column or click it once and then click the “<< Add” button. To configure a formula in the filter: Double-click the formula in the center column or click it once and then click the “Modify Formula...” button. To remove a formula from the filter: Click the formula in the center column and then click the “Remove Formula” button. © 2011 Garsworld, Inc. All rights reserved. 19 To create a new filter: You can create a new filter from scratch by clicking the “New Filter” button, or you can create a new filter that is a copy of an existing filter by clicking a filter in the left column and then clicking the “Duplicate” button. The new filter will appear at the bottom of the left column’s list of filters (but will appear at the top of the filter list in the Stocks tab). To delete a filter: Click the name of the filter you want to delete in the left column and then click the “Delete Filter” button. Other Buttons: “Publish” button: Click this to publish the current highlighted filter in the Sharing tab. If you make changes to the filter, then this button will change its name to “Re-publish” which you can click to save the changes to the Sharing tab. You can’t publish a filter that you did not create yourself. “Export...” button: Click this to save a copy of the current highlighted filter onto your computer as a text file. This can be useful when you want to transfer a filter to another computer running StockVision. “Import...” button: Click this to import a filter that you had previously exported. “Reset to Defaults” button: Click this to restore each default filter to its original version, getting rid of any edit(s) you made. Note that this button will only affect the default filters that came with the software and will not affect any new filters you made or any filters you imported from Sharing. Basic Filter Settings: You can type a name and a description for the filter here. Click a “Classify as” checkbox to add the filter to your Bullish, Bearish, and/or Favorite filters list. The “Sort by” menu allows you to auto-sort the filter’s results by any column in the Stocks tab you want. Use the “Color” menu to choose what color the filter’s results will show in the Filter column of the Stocks tab. Click to check the “Sound alert” checkbox if you would like to hear a sound whenever the filter finds a new stock. You can choose which sound in the Preferences tab. © 2011 Garsworld, Inc. All rights reserved. 20 Configuring Formulas: When you double-click a formula in the center “Formulas in Filter” column (or click it and click the “Modify Formula...” button), a new window will pop up containing settings for that formula which you can customize to your liking. For example, below is the window for configuring the “Red/Green Bars” formula that allows you to scan for stocks that have had a specific sequence of green and red candlesticks: Many of these formula windows contain a brief description of what the formula does and have a “Sample” area representing the formula settings in graphical form. “Interval” Menu: Most formula windows contain this menu that allows you to choose which chart timeframe the formula will use. Your options are: “Daily” (where each bar/period represents one whole day of stock movement), “Intraday 1m” (where each bar/period represents just a 1minute period of stock movement), “Intraday 2m” (where each bar/period © 2011 Garsworld, Inc. All rights reserved. 21 represents a 2-minute period of stock movement, etc.), “Intraday 5m,” “Intraday 15m,” “Intraday 30m,” “Intraday 60m,” or “Intraday 120m.” “Start at bar” Menu: Most formula windows also contain this menu. It allows you to choose a starting reference point to base the formula on. The default is for the formulas to begin looking at the “Current” bar, but you can change that to the “Previous bar,” “2 bars ago,” “3 bars ago,” etc., all the way as far back as “15 bars ago.” For example, if you wanted to find stocks that had 7 red days in a row and then 1 larger green day, you could accomplish this by having one Red/Green Bars formula set up as shown in the picture on the previous page and then have a second Red/Green Bars formula that required 4 red bars and had its Start at Bar menu set to “5 bars ago” (since that would cover the 5th, 6th, 7th, and 8th days back). You could thus conceivably have bar sequences for the Red/Green Bars formulas as long as 18 bars because the final formula could have its Start at Bar set to “15 bars ago,” which would cover the 15th, 16th, 17th, and 18th days back. Another example of a use for the Start at Bar menu would be if 3 days ago there was a huge sell-off in the market and you now wanted to make a filter only showing stocks that still wound up having a green day that day (you would simply set the Start at Bar menu for a Red/Green Bars formula to “3 bars ago”). “Must be true for the whole filter to be true” Checkbox: Almost every formula in your filter will have its own separate checkbox for this. When it is checked, a stock will never appear for that filter unless it satisfies the conditions of that formula. So if every single formula in your filter has that box checked, then stocks will only appear for that filter if they satisfy the conditions of every single formula. If, however, your filter contains at least two formulas that have this box unchecked, then the stock only needs to satisfy the conditions of one of those formulas – not every formula. For example, if your filter contains (1) a Red/Green Bars formula requiring 4 red bars in a row with the “Must be true...” checkbox unchecked, and (2) another Red/Green Bars formula with the “Must be true...” checkbox unchecked but requiring 4 green bars in a row, and (3) a separate unrelated formula that has its “Must be true...” checkbox checked, then a stock will appear for the filter only if it either satisfies both Formula #1 and #3 or satisfies both Formula #2 and #3. “Step” Textbox: If there, type the # of bars of data to use in the formula. Bottom Buttons: When you are all done changing any settings you want to, click the “OK” button to save the formula and return to the main Filter Manager tab. If you change your mind and don’t want to save the adjustments you made, click the “Cancel” button. © 2011 Garsworld, Inc. All rights reserved. 22 What Each Formula Does: When you click on a formula in the Available Formulas column, a brief summary will be displayed in the “Component info” box above. The following is an overview of each formula: G Gaaiinn//L Loossss ffrroom mC Clloossee: Use this to find stocks that have gained (or lost) at least X% since the closing price of a previous bar. The “Start at bar” menu chooses how far back in time to start measuring the gain/loss since (i.e., “Current” means that it will start measuring just since the closing price of the previous bar, “Previous” means that it will start measuring since the closing price of the bar 2 bars ago, etc.). The “End at bar” menu chooses how recent of a price to compare to the closing price of a previous bar. If the “End at bar” is set to “Current,” then it will use the last-traded price of the stock, but if the “End at bar” is set to a previous bar then it will use the closing price of that bar. The “End at price” selection should always be “Current” or a more recent bar than the “Start at bar” selection. e.g., Start at bar = Current and End at bar = Current: o the current price must be at least X% above (or below) the closing price of the previous bar e.g., Start at bar = 8 bars ago and End at bar = Current: o the current price must be at least X% above (or below) the closing price of the bar 9 bars ago e.g., Start at bar = 8 bars ago and End at bar = 5 bars ago: o the closing price of the bar 5 bars ago must be at least X% above (or below) the closing price of the bar 9 bars ago G Gaaiinn//L Loossss ffrroom mH Hiigghh: Use this to find stocks that have gained (or lost) at least X% since the high price of a previous bar. The “Start at bar” menu chooses how far back in time to start measuring the gain/loss since (i.e., “Current” means that it will start measuring just since the high price of the previous bar, “Previous” means that it will start measuring since the high price of the bar 2 bars ago, etc.). The “End at bar” menu chooses how recent of a price to compare to the high price of a previous bar. If the “End at bar” is set to “Current,” then it will use the last-traded price of the stock, but if the “End at bar” is set to a previous bar then it will use the closing price of that bar. The “End at price” selection should always be “Current” or a more recent bar than the “Start at bar” selection. © 2011 Garsworld, Inc. All rights reserved. 23 e.g., Start at bar = Current and End at bar = Current: o the current price must be at least X% above (or below) the high price of the previous bar e.g., Start at bar = 8 bars ago and End at bar = Current: o the current price must be at least X% above (or below) the high price of the bar 9 bars ago e.g., Start at bar = 8 bars ago and End at bar = 5 bars ago: o the closing price of the bar 5 bars ago must be at least X% above (or below) the high price of the bar 9 bars ago G Gaaiinn//L Loossss ffrroom mL Loow w: Use this to find stocks that have gained (or lost) at least X% since the low price of a previous bar. The “Start at bar” menu chooses how far back in time to start measuring the gain/loss since (i.e., “Current” means that it will start measuring just since the low price of the previous bar, “Previous” means that it will start measuring since the low price of the bar 2 bars ago, etc.). The “End at bar” menu chooses how recent of a price to compare to the low price of a previous bar. If the “End at bar” is set to “Current,” then it will use the last-traded price of the stock, but if the “End at bar” is set to a previous bar then it will use the closing price of that bar. The “End at price” selection should always be “Current” or a more recent bar than the “Start at bar” selection. e.g., Start at bar = Current and End at bar = Current: o the current price must be at least X% above (or below) the low price of the previous bar e.g., Start at bar = 8 bars ago and End at bar = Current: o the current price must be at least X% above (or below) the low price of the bar 9 bars ago e.g., Start at bar = 8 bars ago and End at bar = 5 bars ago: o the closing price of the bar 5 bars ago must be at least X% above (or below) the low price of the bar 9 bars ago G Gaaiinn//L Loossss ffrroom mO Oppeenn: Use this to find stocks that have gained (or lost) at least X% since the opening price of the current bar or a previous bar. The “Start at bar” menu chooses how far back in time to start measuring the gain/loss since (i.e., “Current” means that it will start measuring just since the opening price of that same bar, “Previous” means that it will start measuring since the opening price of the previous bar, etc.). The “End at © 2011 Garsworld, Inc. All rights reserved. 24 bar” menu chooses how recent of a price to compare to the opening price of the current bar or a previous bar. If the “End at bar” is set to “Current,” then it will use the last-traded price of the stock, but if the “End at bar” is set to a previous bar then it will use the closing price of that bar. The “End at price” selection should always be “Current” or a more recent bar than the “Start at bar” selection. e.g., Start at bar = Current and End at bar = Current: o the current price must be at least X% above (or below) the opening price of the current bar e.g., Start at bar = 8 bars ago and End at bar = Current: o the current price must be at least X% above (or below) the opening price of the bar 8 bars ago e.g., Start at bar = 8 bars ago and End at bar = 5 bars ago: o the closing price of the bar 5 bars ago must be at least X% above (or below) the opening price of the bar 8 bars ago G Gaapp U Upp//D Doow wnn: Use to find stocks that have either gapped up by at least X% or gapped down by at least X%. This gap percentage compares a stock’s current anticipated opening price (based on pre-market trades) to its previous closing price. H Hiigghh//L Loow wD Diissttaannccee: Use to find stocks that are no more than X% below a key high or at least X% below a key high; or stocks that are no more than X% above a key low or at least X% above a key low. For the key high/low you can choose the stock’s 52-week high/low, the 3-month high/low, the 15day high/low, or the high/low of the current day. M Maarrkkeett C Coonnddiittiioonn: You can add this formula to a filter to add in an additional requirement that an ETF for the S&P 500, the Nasdaq 100, the Dow Jones 30 (for the U.S. Market only), or the FTSE 250 (for the U.K. Market only) must satisfy a certain condition. The conditions you can choose from are: in an Uptrend, in a Downtrend, Oversold, Overbought, positive MACD, or negative MACD. The MACD choices use a proprietary method to predict likely market direction. The “Step” number determines how many bars to use to measure the existence of the market condition. © 2011 Garsworld, Inc. All rights reserved. 25 PPrriiccee//V Voolluum mee C Coonnssttrraaiinntt: You can add this formula to a filter to only show stocks within a certain price range and/or only those stocks that trade at least a certain number of shares a day on average. If the “Override default settings” checkbox is checked, the filter will only follow the numbers you put here and will completely ignore the “Price and Volume Screen” settings in your Stocks tab. Note that the minimum volume amount must be entered in thousands of shares (K) without using commas (e.g., 500 would mean 500,000 shares and 2500 would mean 2,500,000 shares). T Tiim mee C Coonnssttrraaiinntt: You can add this formula to a filter to have the filter only start scanning for stocks after the market has been open for a certain amount of time and/or stop scanning for stocks a certain amount of time before the market closes. T Trreenndd: Use to find stocks that are in an uptrend or a downtrend over a certain number of bars (which you can specify). You can choose how steep the trend’s slope must be (ranging from 0.5% to 10%). This formula measures the trend by using the percent change of a moving average. V Voollaattiilliittyy: Use to find stocks that have an average volatility per bar above a minimum amount and/or below a maximum amount. Volatility here is measured by calculating the percent ‘swing’ between the high and the low of each bar for a certain number of bars (which you can specify) and determining the average ‘swing’ per bar. V Voolluum mee C Chhaannggee: Use to find stocks that are trading more (or less) volume in the current bar compared to the average amount of volume per bar measured for a certain number of bars (which you can specify in the “Step” textbox). You can choose to find stocks that are currently trading a least 1X to 10X their average volume or stocks that are currently trading no more than 0.75X to 0.25X their average volume. Note that if the “Start at bar” menu is set to “Current” then the number you type here will include the current bar in the average volume calculation, so it can often be better to start at a previous bar instead. For example, if you just wanted to find stocks trading at least 5 times their volume yesterday, you would do: “Interval” = “Daily,” the “Start at bar” = “Previous Bar,” the “Step” = 1, and choose “5.00” from the “Volume change at least...” menu. © 2011 Garsworld, Inc. All rights reserved. 26 W Wiinn//L Loossss SSttrreeaakk: Use to find stocks that have had at least a certain number of winning bars in a row or at least a certain number losing bars in a row (which you can specify, ranging from 1 to 9). Whether a bar is a winning bar or a losing bar depends on whether the bar’s closing price (or current price for the most recent bar if the “Start at Bar” menu is set to “Current”) is above vs. below the closing price of the previous bar. C Caannddlleessttiicckk PPaatttteerrnnss: Use to find stocks that have certain candlestick shapes or patterns that are often considered bullish or bearish. H Hiissttooggrraam mB Baarrss: Use to find stocks that have a particular pattern of MACD Histogram bars. The MACD Histogram indicator is an alternate way of representing the regular MACD indicator (which is described below). You can require a pattern of MACD Histogram bars across up to 6 bars (for each Histogram Bars formula). R Reedd//G Grreeeenn B Baarrss: Use to find stocks that have a certain sequence of red and/or green bars across up to 4 bars (for each Red/Green Bars Formula). You can also require that particular bars have certain relative size compared to the previous bar. Note that “Bar 1” is the most recent bar and “Bar 4” is the earliest bar. A Accccuum muullaattiioonn//D Diissttrriibbuuttiioonn: This formula is based on the Accumulation Distribution Line indicator, which measures the money flow into and out of a security based on volume and where bars close in relation to their range. The more buying pressure there is, the higher the Accumulation Distribution Line will go, and the more selling pressure this is, the lower the Accumulation Distribution Line will go. When this indicator matches the trend of the stock’s price, it can often provide confirmation for the move. And when the indicator goes against the trend of the stock’s price, it can signal a possible reversal in the stock. With the formula, you can find stocks with the Accumulation Distribution Line in an uptrend or a downtrend over a certain number of bars (which you can specify). You can choose how steep the trend’s slope must be (ranging from 0.5% to 5%). To detect convergence or divergence from price, you can create a filter with both this formula and the Trend formula. © 2011 Garsworld, Inc. All rights reserved. 27 A AD DX X ((D DM MII)): This formula is based on the Average Directional Index (ADX) and the positive and negative Directional Indexes (+DI and -DI). The combined indicator is commonly used to measure the strength of a stock’s trend. It plots each line on a scale between 0 and 100, with the +DI representing the upward pressure and the -DI representing the downward pressure; the higher the ADX, the stronger the trend. With the formula, you can find stocks with the +DI above/below the -DI, with the ADX above/below the DIs, or with the ADX above/below a certain number. If “Report only on crossover” is checked, then the formula will just look for the exact moment of that relevant crossover above/below. A Arroooonn: This formula is based on the Aroon indicator, which also can be used for measuring trend strength. It contains an Up-Aroon line and a DownAroon line, which are both plotted on a scale between 0 and 100; the higher the number, the stronger the trend. With the formula, you can find stocks with the Up-Aroon or Down-Arron above/below a certain number, or with the Up-Aroon above/below the Down-Aroon. If “Report only on crossover” is checked, then the formula will just look for the exact moment of that relevant crossover above/below. B Boolllliinnggeerr B Baannddss: This formula is based on the Bollinger Bands indicator, which plots a moving average in between an upper and a lower band based on a standard deviation number (which you can specify). The indicator can help show the changing volatility of a stock, the strength of a trend, and potential tops and bottoms. With the formula, you can find stocks with certain Bollinger Band characteristics. D Doonncchhiiaann C Chhaannnneell: This formula is based on the Donchian Channel indicator, which plots the highest and the lowest closing prices of the recent trading range and is useful to spot breakouts and breakouts. With the formula, you can find stocks that break out above the upper Donchian Channel line or break down below the lower Donchian Channel line. © 2011 Garsworld, Inc. All rights reserved. 28 E EM MA A: This formula is based on the Exponential Moving Average indicator, which measures the average price of a stock over a certain number of bars while giving more recent data more weight in the calculation. With the formula, you can find stocks with a price above/below the EMA by a certain %, with the EMA above/below another EMA, or with the EMA sloping up/down by a certain %. If “Report only on first occurrence” is checked, then the formula will just look for the exact moment the specified condition is satisfied. K Keellttnneerr C Chhaannnneellss: This formula is based on the Keltner Channel indicator (aka Keltner Bands), which is similar to the Bollinger Bands indicator (described above) but sets the upper and lower bands using ATR (average true range) instead of the more volatile pure standard deviation. With the formula, you can find stocks with a price that goes above the upper band or below the lower band. If “Report only on crossover” is checked, then the formula will just look for the exact moment of that relevant crossover above/below. M MA AC CD D: This formula is based on the popular Moving Average Convergence Divergence indicator, which is often used as a trend-following momentum indicator. The MACD line (which is the difference between the “Short-step” EMA and the “Long-step” EMA) crossing up above the Signal line (which is the “Signal” EMA) is a common buy signal, and the MACD line crossing down below the Signal line is a common sell signal. The MACD line crossing above zero is a bullish signal (because it represents when the Short-step EMA is crossing above the Long-step EMA), and the MACD line crossing below zero is a bearish signal (because it represents when the Short-step EMA is crossing below the Long-step EMA). With the formula, you can find stocks with the MACD line above/below the Signal line, with the MACD line above/below zero, or with the Signal line above/below zero. If “Report only on first occurrence” is checked, then the formula will just look for the exact moment of that relevant crossover above/below. © 2011 Garsworld, Inc. All rights reserved. 29 M Moonneeyy FFlloow w IInnddeexx: This formula is based on the Money Flow Index (MFI) indicator, which is used to measure the strength of money flowing into or out of a stock. It is similar to RSI (described on the next page) but also takes volume into account. A MFI above 80 is usually considered ‘overbought’ and a MFI below 20 is usually considered ‘oversold.’ When stocks are overbought they are more likely to have some kind of pullback (at least in the short term), and when stocks are oversold they are more likely to have some kind of bounce (at least in the short term). However, keep in mind that when a stock has very powerful momentum higher/lower, it can often stay overbought/oversold for a very long time. With the formula, you can find stocks with a MFI above or below a certain number (in increments of 5). If “Report only on crossover” is checked, then the formula will just look for the exact moment the MFI crosses above/below that number. PPiivvoott PPooiinnttss: This formula is based on the Pivot Points indicator, which identifies levels of likely support and resistance each day for the current day (based on the stock’s movement the previous day). There are 3 levels of potential support below the previous day’s closing price (called S1, S2, and S3 respectively), there are 3 levels of potential resistance above the previous day’s closing price (called R1, R2, and R3 respectively), and there is one level in between called the Pivot Point (aka “Pivot” or PP). If a stock starts holding right above a R-level (or the Pivot Point) then that level can also turn into a support level, and if a stock starts holding right below a S-level (or the Pivot Point) then that level can also turn into a resistance level. With the formula, you can find stocks that are within X% of a particular pivot point level (either above or below) using the “Near and within X%” option. You can also find stocks that are currently above/below a particular pivot point level by using the “Has crossed above” or “Has crossed below” option with the “Interval” menu set to “Daily.” Finally, you can find stocks that have just now crossed above/below a particular pivot point level in the most recent bar by using the “Has crossed above” or “Has crossed below” option with the “Interval” menu set to “Intraday 1m” (or another intraday interval). © 2011 Garsworld, Inc. All rights reserved. 30 RSI: This formula is based on the Relative Strength Index indicator, which is commonly used to measure ‘overbought’ and ‘oversold’ conditions by comparing the magnitude of recent positive bars to the magnitude of recent negative bars. RSI is on scale from 0 to 100 with a RSI above 70 usually considered overbought and a RSI below 30 usually considered oversold. When stocks are overbought they are more likely to have some kind of pullback (at least in the short term), and when stocks are oversold they are more likely to have some kind of bounce (at least in the short term). But keep in mind that when a stock has very powerful momentum higher/lower, it can often stay overbought/oversold for a very long time. With the formula, you can find stocks with a RSI above or below a certain number (in increments of 5). If “Report only on crossover” is checked, then the formula will just look for the exact moment RSI crosses above/below that number. SSlloow w SSttoocchhaassttiicc: This formula is based on the Slow Stochastics indicator, which (like the Williams %R indicator described below) compares the closing price of a bar to where it is in relation to the highest high and lowest low in the look-back period. The Stochastic line (aka ‘Slow %K’) is plotted on a scale from 0 to 100, along with an even slower-moving 3-period moving average of the Slow %K (called the “%D” line). If %D is above 80 then the stock is typically considered overbought, and if %D is below 20 then the stock is typically considered oversold. Once again, keep in mind that when a stock has very powerful momentum higher/lower, it can often stay overbought/oversold for a very long time. The Stochastic line crossing above the %D line is sometimes used as a buy signal, and the Stochastic line crossing below the %D line is sometimes used as a sell signal. Furthermore, a significant divergence between a stock’s price and the stochastics can often indicate a future reversal. For example, it can be a bearish signal if a stock’s price makes a lower high but the stochastics makes a higher high (or if the price makes a higher high but the stochastics makes a lower high). Likewise, it can be a bullish signal if the price makes a higher low but the stochastics makes a lower low (or if the price makes a lower low but the stochastics makes a higher low). With the formula, you can directly find stocks with a %D above/below a certain number (in increments of 5) or with the Stochastic line above/below the %D line. If “Report only on first occurrence” is checked, then the formula will just look for the exact moment of that relevant crossover above/below. © 2011 Garsworld, Inc. All rights reserved. 31 SSM MA A: This formula is based on the Simple Moving Average indicator, which measures the average price of a stock over a certain number of bars (and unlike the EMA, the SMA does not give more recent data extra weight in the calculation). With the formula, you can find stocks with a price above/below the SMA by a certain %, with the SMA above/below another SMA, or with the SMA sloping up/down by a certain %. If “Report only on first occurrence” is checked, then the formula will just look for the exact moment the specified condition is satisfied. SSuuppppoorrtt//R Reessiissttaannccee: This formula uses a proprietary method to identify levels of support and levels of resistance for each individual stock. Increasing the “Sensitivity” number moves the support/resistance levels away from the precise extreme prices of prior support/resistance to more nearby levels that can be thought of as wider (less precise) areas of likely support/resistance. With the formula, you can find stocks no more than X % above support, at least X% below support, no more than X% below resistance, or at least X% above resistance. W Wiilllliiaam mss % %R R: This formula is based on the Williams %R indicator, which compares the closing price of a bar to the highest high and lowest low in the look-back period. It is plotted on a scale from -100 to 0, with -100 signifying that the stock is at its lowest low and 0 signifying it is at its highest high. A Williams %R above -20 is considered overbought, and a Williams %R below -80 is considered oversold. Once again, keep in mind that when a stock has very powerful momentum higher/lower, it can often stay overbought/oversold for a very long time. With the formula, you can find stocks with a Williams %R above or below a certain number (in increments of 5). If “Report only on crossover” is checked, then the formula will just look for the exact moment the Williams %R crosses above/below that number. © 2011 Garsworld, Inc. All rights reserved. 32 THE SHARING TAB The Sharing tab shows filters that other StockVision users have chosen to publish and share with the community: To download a filter in the list, click its row and then click the “Import Filter” button at the bottom of the screen. The filter will then appear in your Filter Manager tab and its name will appear in a red color in the Stocks tab’s filter selection list. To stop sharing a filter you previously published, click its row and then click the “Un-publish” button. © 2011 Garsworld, Inc. All rights reserved. 33 THE PAPERTRADE TAB StockVision’s Papertrade tab allows you to test out trading strategies by placing practice trades without risking real money. Use the top Trade Panel to enter simulated trade orders in real-time: Symbol: Type the stock’s symbol here. # Shares: Type the number of shares of that stock you want to trade. Action: Choose whether to Buy, Sell, Sell Short, or Buy to Cover. Short selling involves borrowing shares of a stock you do not own and selling those shares while incurring an obligation to buy back those shares later on (hopefully at a lower price than you sold them at so you can collect the difference). The “Buy to Cover” action exits a short sale trade. Type: There are 4 different order types to choose from: o Market: A market order in Papertrade will execute right away close to the stock’s current Ask price (for Buy orders and Buy to Cover orders) or Bid price (for Sell orders and Sell Short orders). © 2011 Garsworld, Inc. All rights reserved. 34 o Limit: A limit order allows you to specify the maximum price you are willing to pay to buy the stock or the minimum price you are willing to sell a stock for. A limit order might not execute right away (or at all) depending on what limit price you choose compared to what price the stock is trading at. Type your limit price in the “Limit/Stop” textbox. o Stop: A stop order is a market order that will only execute if the stock reaches a certain trigger price. Type your desired trigger price in the “Limit/Stop” textbox. o % Trailing Stop: A stop order with a trigger price that is set a certain % below the current price (for sell orders) or a certain % above the current price (for buy orders). Its trigger price then adjusts higher as the stock moves higher (for sell orders) or its trigger price adjusts lower as the stock moves lower (for buy orders). This type of order is used most often to exit a profitable trade. Type your desired % for the stop in the “Limit/Stop” textbox as a positive number without the %-sign. Duration: A duration of “Day” means that your order will automatically be cancelled if it has not executed prior to the end of regular trading hours that day (e.g., 4:00pm for the U.S. Market). A duration of “GTC” (good ‘till cancelled) means that your order will remain in effect across multiple trading days until either you cancel it yourself or it executes. Submit Order: Click this button once you have finished entering your trade information in the Trade Panel in order to submit your order. Once your order executes your trade will be displayed in the Open Positions section at the bottom of the screen. Note that although your orders will execute in real-time, during regular market hours the Open Positions section updates on a slightly delayed basis. Clear: Only click this button if you want to delete the trade information currently shown in the top Trade Panel. To cancel an open order you can click on its row in the center-right section and then click the “Cancel Order” button. Click the “Trade History” button located on the left to open a pop-up window that list the previous trades you made. You can reset your entire Papertrade account by clicking the “Reset All Balances” button. © 2011 Garsworld, Inc. All rights reserved. 35 THE FORUM TAB The StockVision Forum is a live chat room where you can post messages to the entire group and have private chats with other users. It is a great place to discuss individual stocks and learn about new trading strategies. To post a chat message to the entire group, type your message in the bottom white rectangle and click the “Post Chat” button or press the ENTER key. You can change the color of your messages by clicking the “Chat Color...” button. You can optionally display everyone’s chat in black (so it is easier to read) by clicking the checkbox for “Show in Black.” The font size of the chat messages can be changed in the Preferences tab. Near the top of the window, there are several features: Show: All Countries menu: You can use this to show only posts from users currently following the U.S. Market or only posts from users following the U.K. Market. Archives: Current Chat menu: You can use this to view the chat posts from recent previous days. Find: You can use this button and textbox to search for particular text in the chat forum. Detach Chat: Click this button to view the chat forum in a separate resizable window. © 2011 Garsworld, Inc. All rights reserved. 36 Suspend Chat Updates: Click this checkbox to stop the chat window from auto-scrolling to the bottom (most-recent) chat messages. It is useful to suspend the chat updates when you want to scroll back up to read the chat messages from earlier in the day. Alternately, you can stop the auto-scroll by clicking the scroll box and holding down (to drag it around). Show Me as Offline: Click this checkbox to prevent your username from showing in the list of Who is Online. You can change your displayed username in the Preferences tab. To initiate a private chat with another user, click his/her username in the Who is Online box and then click the “Chat with ___” button below. To hide the chat posts of a particular user, click his/her username in the Who is Online box and then click the “Block ___” button below. Once you have done so, the button will change to “Unblock,” and you can click it to show that user’s chat posts again. © 2011 Garsworld, Inc. All rights reserved. 37 THE PREFERENCES TAB Here, you can change your username for the forum. If “Always remember username and password” is checked, you won’t have to type them in each time you open the program. Here, you can choose what sounds (if any) to play for new chat posts. You can also select a sound to play whenever a stock alert is triggered or a new stock appears in an active filter that has its “Sound alert” setting turned on. Here you can change the font size for posts in the Forum. If “Snap to Stocks tab upon sounded alerts” is checked, whenever a stock alert is triggered or a new stock appears in an active filter that has its “Sound alert” setting turned on in Filter Manager, the program will automatically switch over to the Stocks tab. When a stock has appeared in an active filter but then later no longer satisfies that filter’s requirements, you can specify here how many minutes to keep showing that stock anyway. © 2011 Garsworld, Inc. All rights reserved. 38 FEEDBACK / TECH SUPPORT We love hearing from our users and prospective users. If you have any questions, comments, or suggestions, feel free to email us at [email protected]. We also have a frequently asked questions page located at www.garsworld.com/FAQ.htm. We often include user recommendations in future upgrades of the software! TESTIMONIALS & REVIEWS Here are just some of the many positive comments users have written about our software: “The true power of this software is what I've always wanted [but] never could find... If you love using technicals, this is the scanner for you!” “StockVision is among the best, love the real time indicators and the ease of use. Great forum, among best on the net.” “Everyone else that sells stock screening software pumps their product up with hype. This is truly the best one I have come across. Trading is scary enough for me... but this gives me confidence. I love the live forum too. A++++++” “Best Trading Software I have used. Screens that list Breakouts, Breakdowns, Gap up, gap down, big volume, cheap action, shorts… sudden plunges, – I could go on and on…” “Great screening software. The forum is good too. This should help your trading. Definitely take the free trial, only email required. Very affordable too!” © 2011 Garsworld, Inc. All rights reserved. 39 “You can't beat this anywhere. It's just THE BEST! Very short learning curve. Find out for yourself. Try the one-week trial for free. You've got nothing to lose, and everything to gain. My trading has improved EXPONENTIALLY since using this service. My profits have increased exponentially. Why trade alone if you don't have to? Bounce your ideas off other traders. Get ideas from other traders. For the price, StockVision is THE BEST on the net!!” “I had lost lots of money when I bought & held during ‘the bubble’ and then decided to trade. I had lots of offers from high-priced trading ‘schools’ but none that I saw were honest. I found [the G]arsworld site and subscribed…I'm SOLD on it – made my cost back the first day I used money to trade and have been profitable ever since.” “Probably one of best-kept secrets in the industry. StockVision isn't just a stock screener but so much more. I purchased StockVision a little over 2 years ago, and I love it… Overall, it's simple enough on the surface for beginners to use, yet there are also powerful features that more advanced traders can take advantage of. The creator of the software is in the chat room daily and takes feature requests and provides free updates. It has increasingly become more customizable, which is particularly useful for intermediate and advanced traders… All in all, I don't think there's anything else out there that even remotely comes close, especially considering the low price.” “Best Value out there!!!!!!!! I've used this product for years… It’s not a clunky java based chat room, web based charts, or some other thrown together tool. It’s a marvel of software engineering that runs on your desktop (mac or pc!). The founder is there every day and welcomes suggestions for software improvement. Read Gar's story (the founder), understand his passion for what he does and then try a free trial and see the fantastic community of traders.” “In my 20 years of investing I've never seen anything like it. I have paid for the product one hundred fold [and with the free trial] you receive full service for a week absolutely free. Warning! If you do the trial you'll be hooked for life. Simply put! [This is] the master of all stock screeners and…you can talk to the mastermind behind the product most days in the chat room. AMAZING!” © 2011 Garsworld, Inc. All rights reserved. 40 © 2011 Garsworld, Inc. All rights reserved. 41