1
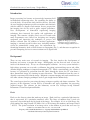
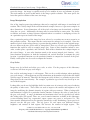
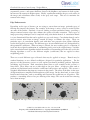
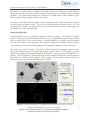
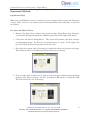
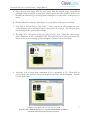
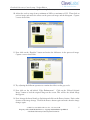
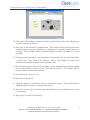
CleveLabs Laboratory Course System – Teacher Edition
Image Processing Laboratory
2006 Cleveland Medical Devices Inc., Cleveland, OH.
Property of Cleveland Medical Devices. Copying and distribution prohibited.
CleveLabs Laboratory Course System Version 5.0
CleveLabs Laboratory Course System - Teacher Edition
Image Processing Laboratory
Introduction
Image processing has become an increasingly important field
in biomedical engineering today. By expanding our ability to
view the body, we can better study and treat disease. Not only
do novel imaging techniques provide researchers and clinicians
with the ability to diagnose and monitor disease progression,
but imaging can also be used to guide surgical procedures.
New developments of biomedical engineering imaging
techniques have increased the quality and applications of
imaging. This remains a highly active area of research with
many departments now focused on designing new imaging
equipment and improving the techniques to process and Figure 1. Image processing
analyze collected data. In addition to medical applications, techniques may be applied to
imaging is extremely useful in other areas, including machine automated fingerprint detection.
vision for automatically sorting parts, law enforcement for
identifying biometrics such as facial features or fingerprints (Fig 1), and character recognition in
personal computing devices to convert written text to digital form.
Background
There are two main areas of research in imaging. The first involves the development of
hardware and sensors to acquire the image. Radiography was the first tool used to view the
inside of the human body. X-rays are electromagnetic radiation. An x-ray system includes a
high voltage generator, an x-ray tube, a collimator, the patient, an intensifying screen, and a film.
Another imaging technique is computed tomography (CT). While a conventional x-ray is limited
because it is generated by projection from the source through the object, the CT scan forms a
three dimensional image by scanning in many directions. The information from the scans is
digitally reconstructed to form the image. Magnetic resonance imaging and nuclear medicine are
two other advanced imaging techniques used to gain insight into the human body.
The second aspect involves processing the image to improve quality and feature extraction. The
purposes of this laboratory session will be to introduce and apply algorithms for processing
acquired images. The software for this laboratory session was developed using National
Instruments Vision Development Module.
Pixels
Pixels are the discrete points that make up an image. Each pixel has a particular light intensity
that is represented by a particular numerical value. The range of numbers that a pixel can
represent is dependent upon the bit depth of the image. For example, if it is an 8-bit image, the
pixel number may range from 0-255 while if it is a 16-bit image the number could range from 0
– 65,535. The spatial resolution of an image refers to the number of pixels that were used to
2006 Cleveland Medical Devices Inc., Cleveland, OH.
1
Property of Cleveland Medical Devices. Copying and distribution prohibited.
CleveLabs Laboratory Course System Version 5.0
CleveLabs Laboratory Course System - Teacher Edition
Image Processing Laboratory
create the image. An image is typically made up of a number of rows and columns of pixels.
The total number of pixels in that matrix is the image spatial resolution. The more pixels, the
better the spatial resolution of the same size image.
Image Manipulation
One of the simplest processing techniques that can be completed with images is translation and
rotation. This is fairly simple in the two dimensional example, however, it gets more complex in
three dimensions. In two dimensions, all of the pixels of an image can be translated, or shifted,
along the x or y-axis. Additionally, the image may be rotated about its center point. The ability
to translate and rotate an image becomes important when a researcher is attempting to focus in
on a particular aspect or feature of the image.
Once a particular portion of the image has been selected, a researcher may want to zoom in on
that particular section. This means that the section must be enlarged or re-sampled. Since the
number of pixels in the enlarged image is greater than the number of pixels in the original image,
the area between the true pixels must be interpolated. There are several types of interpolation
functions that could be used to resample image data. Some of these functions include a zeroorder, a cubic spline, a quadratic, and a bi-linear. Each of these functions has a unique impact on
the resized image. A zero order function rounds to the nearest integral pixel location. A bilinear function interpolates in both the horizontal and vertical direction to compute the pixel
location. A quadratic function uses the quadratic formula to compute the location of the pixel.
Finally, cubic splines are also used to compute the location.
Gray Scales
Images may be in black and white, gray scale, or color. For the purposes of this laboratory
session we will focus on gray scale images.
One tool for analyzing images is a histogram. This can be a useful technique when analyzing
gray scale images. A histogram can provide information on the number of pixels that fall within
specific ranges of intensity. Therefore, the histogram yields if there is a particular region of the
image that has the same intensity. For example, a particular type of noise may show up in one
area of the histogram.
Lookup tables can be used to highlight details in certain areas of an image at the cost of reducing
the quality of other areas. These tables are used to improve the contrast and brightness of an
image by modifying the dynamic intensity of regions with poor contrast. When a lookup table
transformation is applied in a particular transfer function, it changes the value of each pixel in
the gray scale image. A range of minimum and maximum values can be specified over which
this lookup table will operate. There are several transfer functions available in this laboratory
session including linear, log, exponential, square, square root, power x, and power 1/x. The
linear transfer function increases the intensity dynamic by evenly distributing a given gray-level
interval over the full gray scale. The log, power 1/x, and square root functions increase
brightness and contrast in dark regions, but decrease the contrast in bright regions. The
2006 Cleveland Medical Devices Inc., Cleveland, OH.
Property of Cleveland Medical Devices. Copying and distribution prohibited.
CleveLabs Laboratory Course System Version 5.0
2
CleveLabs Laboratory Course System - Teacher Edition
Image Processing Laboratory
exponential, power x, and square functions decrease the brightness and contrast in dark regions,
but increase the contrast in bright regions. Finally, equalization modifies the gray scale values in
the image and redistributes them evenly in the gray scale range. This acts to maximize the
contrast in the image.
Edge Enhancements
Depending on the type of feature you are trying to extract from an image, particular types of
filtering may improve the features. For example, if the image is noisy, it may be useful to filter
out some of the artifact. Similarly, if you are looking to extract particular features, providing a
sharper contrast between edges may enhance the quality of feature extraction. These types of
image processing techniques can be completed using convolution kernels. A convolution kernel
is a two dimensional filter that can be applied to a gray scale image. Convolution kernels can be
used to remove noise from an image, smooth an image, or enhance the edges. There are
particular types of convolution kernels each with their own properties that produce different
results when applied to an image. The different types of convolution kernels are distinguished by
their particular coefficients. When an image is filtered, the new resulting pixel is a function of
itself and the weighted combination of surrounding pixels prior in the original image. Variables
in the convolution kernel algorithm include the number of surrounding pixels that are used in the
filtering algorithm as well as the different weights (coefficients) that are applied to those
neighboring pixels.
There are several different types of kernels that may be applied to images. Kernels may be
standard functions or user defined coefficients designed for particular applications. For the
purposes of this laboratory session, we will explore four kernels including gradient, Laplacian,
smoothing, and Gaussian. Each convolution kernel that we will examine in this session is a
linear filter. These filters can act as either high or low pass filters. A high pass filter such as
gradient and Laplacian kernels includes coefficients both positive and negative. This creates a
weighted differentiation that improves contrast in the picture. The effect of the filter is that areas
of high transition are amplified and brought out of the image. On the other hand, in some of the
kernel transfer functions, such as smoothing and Gaussian, the coefficients are all positive. This
produces a smoothing effect or low pass filtering of the image. This can be useful for removing
noise from an image.
Figure 2. The edges of the original image (left) can be enhanced by spatial filtering techniques (right).
2006 Cleveland Medical Devices Inc., Cleveland, OH.
Property of Cleveland Medical Devices. Copying and distribution prohibited.
CleveLabs Laboratory Course System Version 5.0
3
CleveLabs Laboratory Course System - Teacher Edition
Image Processing Laboratory
Specifically, a gradient filter is a high pass filter that sharpens the differences in light intensity
along a specific direction. This can be useful for enhancing edges in an image along a particular
direction. A Laplacian filter sharpens the differences in light intensity that surround a pixel.
This is useful for sharpening the contour of an object.
In contrast, a smoothing filter attenuates variations in light intensity. This smoothes the shape of
an object and can remove details. The low pass kernel functions basically tend to act as an
averaging filter. Finally, the Gaussian filters also smooth; however the effect of blurring is not
as prominent as in the smoothing filter.
Image Quantification
Several methods exist to automatically quantify features of images. One method is particle
analysis. In general, the aim of particle analysis is to use an algorithm that detects regions where
there are many pixels of the same intensity. Specific particles in an image can be measured
based on their location, area, and shape. One example of where this technique could be useful is
a researcher that wants an automated technique for counting the number of cells in an image.
One method is a particle analysis. A particle is defined as group of contiguous nonzero pixels.
The spatial characteristics of the group must satisfy specific criteria. For example, you may
define the minimum and maximum intensity that defines a group of pixels that qualifies as a
particle. Once the particle is defined and located, other statistics and measures can be applied to
the particle for a more complete analysis. For example, you may want to further separate the
particles based on a maximum and minimum size criteria.
Figure 3. Automated techniques for counting particles in an image can be used to save time.
2006 Cleveland Medical Devices Inc., Cleveland, OH.
Property of Cleveland Medical Devices. Copying and distribution prohibited.
CleveLabs Laboratory Course System Version 5.0
4
CleveLabs Laboratory Course System - Teacher Edition
Wavelets
Image Processing Laboratory
Wavelet theory has been around since the early 1900’s. It was designed as a way to improve the
resolution that a standard fast Fourier transform (FFT) can provide. In general, an FFT can
provide good frequency resolution over a long time period. However, this comes at the expense
of not knowing when during that time interval that particular frequencies occurred. On the other
hand, short time FFT’s can provide a better indication of when a particular frequency occurred,
but at the cost of a reduced frequency resolution.
In very general terms, wavelets provide a function that can be stretched and shifted in time.
They can be applied in time steps over an entire signal. A wavelet function can improve the
ability to detect when particular frequencies occur in time. They are applied in a wide variety of
applications. While it is typically thought of as time frequency, this is spatial frequency and
many of the same techniques apply. Wavelet transforms allow an infinite number of basis
functions to be used in an analysis. There are many existing wavelet waveforms that can be used.
Additionally, an individual can design a unique wavelet function.
A common application of wavelets in image processing is to de-noise an image. This can be
completed using a 2D wavelet transform. Users can select wavelet functions that best match the
spatial characteristics of the image. The wavelet transform of the signal is taken and the
coefficients below a certain threshold are set to zero, inverting the transform then reconstructing
the original signal. The image can be reconstructed with a significantly less percentage of the
original data.
When reconstructing an image using wavelets, there are several parameters to select. The first is
to select the wavelet basis function. The next is to select the extension type. Zero padding adds
zeros at the beginning and end of the original data. Symmetric folds the original signals at the
beginning and end. Periodic treats the original data as a periodic signal, and spline
symmetrically folds the original signal at the beginning and end and then smoothes with spline.
You also must specify the percent of coefficients to be used in the reconstruction. The number
of levels specifies the number of levels of the wavelet packet decomposition. The swap control
specifies whether the analysis filter is swapped with the synthesis filter.
Figure 4. Wavelet analysis is useful for reconstructing an image to remove noise.
2006 Cleveland Medical Devices Inc., Cleveland, OH.
Property of Cleveland Medical Devices. Copying and distribution prohibited.
CleveLabs Laboratory Course System Version 5.0
5
CleveLabs Laboratory Course System - Teacher Edition
Experimental Methods
Image Processing Laboratory
Experimental Setup
Make sure your BioRadio receiver is connected to your computer before starting this laboratory
session. If the receiver is not connected most of the functionality in the laboratory session will
be disabled.
Procedure and Data Collection
1. Run the CleveLabs Course software. Log in and select the “Image Processing” laboratory
session under the Engineering Basics subheading and click on the “Begin Lab” button.
2. Click on the tab labeled “Manipulation”. This section will examine some basic concepts
in manipulating images. To the left is the original image of a spine. To the right is the
processed image based on the parameters that you select.
3. First adjust the rotation angle of the image to examine the effects on the processed image.
Then adjust the offsets to examine their effect on the processed image.
4. Next, reset the angle and offsets to 0. Now we will adjust the resolution and interpolation
methods of the processed image. Set the x resolution to 200 and the y resolution to 300.
This will increase the size of the image.
2006 Cleveland Medical Devices Inc., Cleveland, OH.
Property of Cleveland Medical Devices. Copying and distribution prohibited.
CleveLabs Laboratory Course System Version 5.0
6
CleveLabs Laboratory Course System - Teacher Edition
Image Processing Laboratory
5. Since the processed image now has more pixels than the original image, interpolation
techniques must be applied to interpolate between pixels that exist and those that do not.
Examine the different types of interpolation techniques to see the effects on the processed
image.
6. Finally, adjust the symmetry of the image to see the effects on the processed image.
7. Now click on the tab labeled “Gray Scales”. In this section you will examine how gray
scale techniques can be utilized to improve the contrast of an image. We will once again
use the image of the spine for this example.
8. The range of 0 – 255 represents the gray scale color of a pixel. Adjust the scale to range
from a minimum of 0 to a maximum of 50. Then click on process image and notice the
effects on the processed image and the histogram. Capture a screen shot of this.
9. Adjust the scale to range from a minimum of 0 to a maximum of 255. Then click on
process image and notice the effects on the processed image and the histogram. Capture
a screen shot of this.
2006 Cleveland Medical Devices Inc., Cleveland, OH.
Property of Cleveland Medical Devices. Copying and distribution prohibited.
CleveLabs Laboratory Course System Version 5.0
7
CleveLabs Laboratory Course System - Teacher Edition
Image Processing Laboratory
10. Adjust the scale to range from a minimum of 100 to a maximum of 255. Then click on
process image and notice the effects on the processed image and the histogram. Capture
a screen shot of this.
11. Now click on the “Equalize” button and notice the difference in the processed image.
Capture a screen shot of this.
12. Try adjusting the different operators to examine the effects on the gray scale.
13. Now click on the tab labeled “Edge Enhancement”. Click on the “Reload Original
Image” button to load the original image on the screen. This will be the default image
that appears.
14. Next, change the kernel family to Laplacian and click on the Process button. Notice what
features of the image change. Click on the Process button again and notice how the image
changes again.
2006 Cleveland Medical Devices Inc., Cleveland, OH.
Property of Cleveland Medical Devices. Copying and distribution prohibited.
CleveLabs Laboratory Course System Version 5.0
8
CleveLabs Laboratory Course System - Teacher Edition
Image Processing Laboratory
15. Click on the “Reload Image” button to load the original image on the screen. Repeat step
14 for the other kernel families.
16. Now click on the tab labeled “Quantification”. This section will provide insight on how
automated image processing algorithms are implemented to quantify specific features of
an image. Two algorithms will be examined including a particle algorithm and a circle
algorithm.
17. Under the particle algorithm, set the minimum and maximum gray scale levels that define
a particle area. Then click on the “Process” button. The number of particles will
automatically be displayed based on the algorithm results.
18. Now define parameters for the circle algorithm. Set the minimum and maximum number
that a radius should be to define a circle. Then click on “Process”. The number of circle
particles will be automatically calculated.
19. Now click on the “Wavelet” tab.
20. Select the cell image file.
21. Adjust the number of coefficients used to reconstruct the image. Find the threshold at
which the image no longer is accurately represented.
22. Adjust the wavelet type to examine what effect different wavelet functions have on the
reconstruction.
23. Repeat steps 21 and 22 for all images
2006 Cleveland Medical Devices Inc., Cleveland, OH.
Property of Cleveland Medical Devices. Copying and distribution prohibited.
CleveLabs Laboratory Course System Version 5.0
9
CleveLabs Laboratory Course System - Teacher Edition
Discussion Questions
Image Processing Laboratory
1. Why is imaging important in biomedical engineering?
applications of imaging?
What are some practical
Imaging is an important area in biomedical engineering. It can provide insight into many
functions of the body that cannot be seen with the naked eye. Imaging can be used to diagnose
tumors and abnormal heart conditions. Additionally, it can be used to guide decisions during
surgery.
2. Discuss how image translation, rotation, and re-sampling can be important in biomedical
imaging. What impact does the interpolation technique have on the processed image?
Using these functions can help a researcher zoom in on a particular part of an image for analysis.
Different types of interpolation techniques can affect the degree of smoothing that occurs
between original pixels.
3. What are the different gray scale operators that can be used to process an image?
Describe the impact of each on the processed image.
There are several transfer functions available in this laboratory session including linear, log,
exponential, square, square root, power x, and power 1/x. The linear transfer function increases
the intensity dynamic by evenly distributing a given gray-level interval over the full gray scale.
The log, power 1/x, and square root functions increase brightness and contrast in dark regions,
but decrease the contrast in bright regions. The exponential, power x, and square functions
decrease the brightness and contrast in dark regions, but increase the contrast in bright regions.
4. What is the difference between a high pass and low pass spatial filter?
particular applications for each?
What are
These filters can either act as high or low pass filters. A high pass filter such as gradient and
Laplacian kernels includes coefficients both positive and negative. This creates a weighted
differentiation that improves contrast in the picture. The effect of the filter is that areas of high
transition are amplified and brought out of the image. On the other hand, in some of the kernel
transfer functions such as smoothing and Gaussian, the coefficients are all positive. This
produces a smoothing effect or low pass filtering of the image. This can be useful for removing
noise from an image.
5. Why would someone want to enhance the edges that are in an image?
By enhancing the image edges, specific particles can be easier picked out.
6. Explain the benefits of using a wavelet analysis instead of a traditional FFT.
2006 Cleveland Medical Devices Inc., Cleveland, OH.
Property of Cleveland Medical Devices. Copying and distribution prohibited.
CleveLabs Laboratory Course System Version 5.0
10
CleveLabs Laboratory Course System - Teacher Edition
Image Processing Laboratory
A wavelet analysis increases the time resolution in a spectral analysis. A traditional FFT must be
completed over a long time period to increase the spectral resolution. This limits the ability to
detect at what particular point in time a frequency occurred.
7. What is the effect of the number of coefficients that are used to reconstruct an image
using wavelet analysis?
A minimum number of coefficients must be used to accurately represent an image. However, the
total number of coefficients may be much less that 100% of the number used in the original
image.
8. Describe a novel method that you could create to automatically quantify particles in an
image.
This answer will depend on the creativity of the students.
2006 Cleveland Medical Devices Inc., Cleveland, OH.
Property of Cleveland Medical Devices. Copying and distribution prohibited.
CleveLabs Laboratory Course System Version 5.0
11
CleveLabs Laboratory Course System - Teacher Edition
References
Image Processing Laboratory
1. National Instruments Corporation. NI Vision, IMAQ Vision Concepts Manual. January
2005.
2. National Instruments Corporation. LabVIEW and LabWindows/CVI Signal Processing
Toolset User Manual. December 2002.
3. Webster, John G. Medical Instrumentation Application and Design, Third Edition. John
Wiley and Sons, New York, 1998.
2006 Cleveland Medical Devices Inc., Cleveland, OH.
Property of Cleveland Medical Devices. Copying and distribution prohibited.
CleveLabs Laboratory Course System Version 5.0
12