1
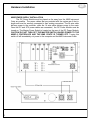
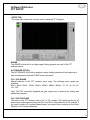
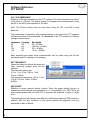
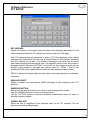
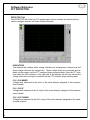
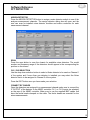
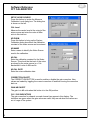
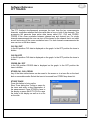
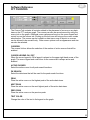
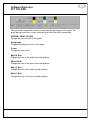
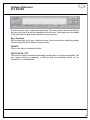
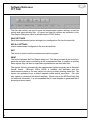
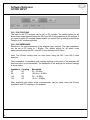
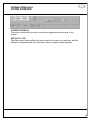
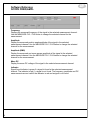
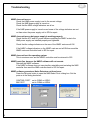
NMSC-2
User Manual
SDI
2
SDI
Table of Contents
Introduction ………...……...…………………………………………..
Hardware Installation …...…………………………………………….
NMSC Power On ……………………………………………………..
Overview ……………………………………………………………...
FFT Measurement Screen .………………………………………….
FFT Setup ..…….……………………………………………………..
FFT Detector ...………………………………………………………..
FFT Calibration …….…...…………………………………………….
FFT Traces ……..……………………………………………………..
FFT Cursors ….………………………………………………………..
FFT Colors .………………………………...………………………….
FFT Spurs ..…….……………….……………………………………..
FFT File ...………………….…………………………………………..
FFT Print Report …….….……………….…………………………….
SCOPE Measurement Screen …………..…………………………..
SCOPE Trigger ………………………………………………………..
SCOPE Input ………………….…………..…………………………..
SCOPE Cursors ….………….………………………………………..
SCOPE Freq/Ampl …………….…………..…………………………..
SCOPE CAL/KD ………………………………………………………..
Troubleshooting ………………….………..…………………………..
4
5
8
9
10
11
14
17
21
23
24
25
26
27
28
31
32
33
34
35
36
3
Introduction
The Noise Measurement System is a modular instrument that may be
customized to implement a versatile dual-channel noise measurement system. The
measurement system may be used to make both AM and PM noise measurements on
signals in the frequency range of 1 MHz to 45 GHz. Custom detector modules may be
added to extend the carrier frequency measurement range. The measurement system
is composed of modules that plug into the measurement system instrument crate. The
instrument crate dimensions are 5U X 19” X 16”. The instrument crate is included with
the purchase of a Noise Measurement System Controller (NMSC).
The NMSC-2 module contains a dual-channel spectrum analyzer. Dual channel
cross-correlation measurement techniques can be used to measure signals that are
lower than the system noise floor. The front panel has a 6.4 inch XGA color touchscreen display. An external keyboard, monitor and printer can also be connected to the
controller. Remote measurements or monitoring are possible using the Windows XP
remote desktop software and an Ethernet connection.
There are six slots available on the noise measurement crate for the various
measurement modules. Two noise detector module series are currently offered that
cover the frequency range of 1 MHz to 45 GHz. The ND-1 series of modules covers
the frequency range of 1 MHz to 1 GHz. The ND-3 series of modules covers the
frequency range of 1 GHz to 45 GHz. Custom modules may be ordered to extend the
frequency range or implement special measurement topologies. All the noise detector
modules are designed to facilitate the measurement of sources as well as passive and
active components. For source measurements, the reference and device under test
are phase locked with programmable PLL bandwidth to accommodate measurements
of wide tuning voltage controlled oscillators to very stable ultra-low noise oven
stabilized oscillators. Noise in amplifiers, multipliers, mixers and other active and
passive components can be measured easily with the addition of one of the
programmable delay line modules.
Calibration of the Noise Measurement System can be accomplished easily
using a noise source module, NS-NM or a tone calibration module, TC-NM. The
system can also be calibrated by using the traditional beat note calibration method.
Calibrated noise source modules and tone calibration modules can be ordered for any
frequency range of interest.
4
SDI
Hardware Installation
SDI
NMS INSTRUMENT CRATE DESCRIPTION
The NMS Instrument Crate is a NIM (Nuclear Instrumentation Module) standard
crate that has been configured to provide communication busses and power for the
Noise Measurement System Controller (NMSC) and Noise Detector Modules. Using
NIM modules not specifically designed for the Crate is not recommended and could
result in damage to the system.
The left front mounting plate of the crate contains the crate power switch and
power LED. Modules are installed onto the front of the crate by means of 12 nylon
guiding rails. There are 12 module spaces, however the NMS controller will occupy the
first six spaces, leaving six spaces for various Detector modules. Each module has two
or more thumb screws that secure it to the NMS Instrument Crate. The NMS Modules
are not “hot swappable”. This means that NMS Instrument Crate DC power supply
needs to be turned off, before removing or inserting any modules. This can be done by
turning the front panel power switch to the off position.
The NMS Controller must be installed into leftmost six spaces. Not doing so will
result in damage to the modules, and or controller. The rest of the spaces on the NMS
Crate can contain any of the detector, or synthesizer modules provided by
SpectraDynamics Inc.
The back of the NMS Instrument Crate has two circular power connectors and
LED indicators. The 14 pin connector delivers power to the NIM Modules while the 24
pin connector delivers power to the NMSC-2 controller.
NMS RACKMOUNT INSTALLATION
The NMS is designed to be rack mounted on standard 19" wide racks. The
NMS Crate has 5U non-removal rack mount handles, while the external power supply
has removable 2U rack handles. It is important that there is enough clearance behind
the NMS Crate and DC Power Module for proper air circulation. Blocking any fan
exhaust could cause the system to fail due to a thermal overload.
NMS BENCHTOP INSTALLATION
The NMS also supports tabletop operation. Four rubber feet are included with
the NMS Crate. These attach to the bottom of the crate and should only be used for
tabletop operation. Enough clearance behind the NMS Crate and DC Power Module is
necessary for proper air circulation. Blocking any fan exhaust could cause the system
to fail due to a thermal overload.
5
Hardware Installation
NMS POWER SUPPLY INSTALLATION
The DC Power Module must be placed as far away from the NMS Instrument
Crate as possible. The power cables that are provided with the system are 8 feet in
length and must be securely connected to their mating connectors. The 24 wire cable
delivers power to the controller, while the 14 wire cable delivers power to the crate.
Once the DC and ATX power cables are connected, the DC Power Module must be
turned on. The Master Power Switch is located on the rear of the DC Power Module.
CAUTION! DO NOT TURN OFF THE MASTER SWITCH UNLESS POWER TO THE
NMSC-2 CONTROLLER AND THE NMS CRATE IS TURNED OFF. Turning this
switch off will immediately cut power to the computer and the NMS Instrument Crate.
6
SDI
Hardware Installation
SDI
NMSC MODULE INSTALLATION
The NMS Controller is the heart of the noise measurement system. It is
composed of a Pentium Dual Core based computer and a high-speed digitizer. It also
has a resistive touch screen LCD. The Windows XP operating system was chosen
because of its popularity. The front panel also contains a standard USB 2.0 connector
and the NMSC power button. It is important not to use the NMSC controller as a
general-purpose computer since processor intensive applications will not allow the
noise measurement software to execute properly.
The back panel contains most of the input/output ports. There are four USB, two
serial, one firewire, one keyboard ,one mouse, one LAN and one parallel port that can
be used to connect to other peripherals such as printers, portable hard drives, etc.
There are also VGA, optical and audio connectors that can be used to connect to
external multimedia devices. The digitizer input and output ports are also located at the
back of the module. The Detector module output ports need to be connected to the
digitizer input ports before any measurement can be made.
The NMS Controller module slides into the first six module spaces of the NMS
Instrument Crate. There are 4 thumb screws that bolt the module in place. If a mouse,
keyboard or external display are to be used, these must be connected to the module
before turning the power on. Once the NMS Controller is in place, pressing the power
button will turn the computer on. Please be aware that turning the Master Power
Switch off while the computer is running could cause the computer hard drive to fail.
NOISE DETECTOR MODULE INSTALLATION
A variety of noise detector modules are available from SpectraDynamics Inc.
These modules can be installed into any of the six spaces to the right of the NMS
Controller. To install a module, slide the module into any of the six guiding rails and
bolt the module in place using the thumb screws attached to the front panel of the
module.
Once all modules are installed power may be applied to the NMS Crate by
turning on the "DC POWER" switch located on the front of the NMS Crate.
7
NMSC Power On
INTRODUCTION
The user may decide to follow the quick start guide first and then come back to
the user manual for more in depth coverage of the software and hardware capabilities
of the measurement system. The quick start guide describes the steps necessary to
make a single channel measurement. Most of the major functions in the software have
a quick description explaining their function. To access the quick description just point
the mouse or pointer to the button or tab and leave the pointer on the object for a few
seconds. Most of the system setup information in the quick start guide is repeated here
in the next few pages.
NMSC POWER ON
The NMSC-2 Controller has a POWER ON button on the front panel just below
the screen. The NMSC POWER ON button only powers the NMSC controller and will
not turn on power to the instrument crate. To apply power to any of the detectors you
must turn on the Chassis DC POWER SWITCH located on the lower left hand corner
of the chassis.
To turn on the NMSC controller press the POWER ON button. The NMSC
controller will boot up to a Windows XP screen. The measurement software
executables are under the C:\Program Files\NMSC3 directory. There will be a NMSC
shortcut icon on the desktop. Click on the icon to run the measurement system
software. The user may also locate the executable file in the NMSC3 directory.
NMSC CHASSIS POWER ON
The power to the noise detectors is supplied through the instrument crate. Make
sure that the crate power is OFF when a noise detector is inserted or extracted from
the system. THE NOISE DETECTORS ARE NOT HOT PLUGGABLE. The chassis
power is independent of the NMSC controller power and this power may be switched
on/off even when the measurement system software is running.
8
SDI
Software Reference
Overview
SDI
The Measurement System Software has two modes of operation FFT mode and
SCOPE mode. In FFT mode the NMSC software works in conjunction with a fast 14 bit
data acquisition card and the underlying dual core PC processor to create a
proprietary FFT analyzer that can produce an FFT analysis plot from 0.1 Hz to 40 MHz.
The FFT analysis combines the standard block FFT processing with real-time filtering
and decimation of the data stream to generate the result which is displayed on a plot
of amplitude vs frequency. Once the decimation and filtering for the last programmed
FFT SPAN is calculated the data is plotted in the time domain and that amplitude vs
time plot is available to the user as an overlay display on the FFT plot . A simplified
flow chart of the data processing for one input channel is displayed below.
The FFT analyzer always processes data on both channels simultaneously. If
single channel measurements are being taken, the unused channel can be hidden
from view as it will contain invalid data.
All the hardware settings and analysis parameters can be set using controls and
dialog boxes on the FFT Window. In SCOPE mode the noise signals are analyzed in
the time domain and the digitized data is displayed in a plot of amplitude vs time. The
hardware setting and measurement parameters and options are set using controls and
dialog boxes on the SCOPE Window.
The measurement results can be saved to ascii data files, saved to a report in
Microsoft Word format, or saved as measurement trace files. The ascii data can readily
be imported into other spreadsheet programs. The reports contain all the measurement
data in a chart as well as a data table that are easily modified or formatted. The
measurement trace files are in a special format that allows a user to recall into the
measurement system software previously saved data. This feature allows for
comparison of past measurement with measurements that are currently being taken.
Analysis Flowchart for one channel of data.
9
Software Reference
FFT Measurement Screen
The NMSC software will load to an initial screen with the name of the software
and the company name. Once the system initializes it will change to the FFT
measurement screen shown below. From this initial screen the user can control all the
functions of the measurement system. Most of the measurement system functions are
accessed from the tab control panel in the bottom section of the FFT measurement
screen. The next section of the manual describes all the controls of the FFT mode of
operation.
On the upper left corner of the screen there are four indicators.
RUN
DONE
OVLD1
OVLD2
Indicates that a measurement is in progress.
Indicates that a measurement completed successfully.
Indicates an input overload on channel 1.
Indicates an input overload on channel 2.
FFT ON
Pressing the FFT ON button will change the NMSC measurement mode to SCOPE
mode.
START
Pressing the START button initiates the acquisition of data on both measurement
channels.
10
SDI
Software Reference
FFT SETUP
SDI
SETUP TAB
The setup tab contains the controls used to setup the FFT analyzer.
RANGE
The RANGE button will do a single range finding operation on each of the FFT
analyzer inputs.
AUTORANGE OFF/ON
The AUTORANGE ON function enables a range finding operation at the beginning of
each measurement after the START button is pressed.
CH1 / CH2 RANGE
Manual selection of the FFT analyzer input range. The following input ranges are
available:
20mV, 40mV, 50mV, 100mV, 200mV, 400mV, 500mV, 800mV, 1V, 2V, 4V, 5V, 8V,
10V, HIFI.
Note: The HIFI connection bypasses all gain stages and is reserved for testing and
calibration purposes.
CH1 / CH2 COUPLING
The input to the FFT analyzer can be AC or DC coupled. The default setting for all
phase noise measurements using the ND-1 and ND-3 noise detectors is DC coupled. If
you need to make AC coupled measurements you should first try setting up the Noise
Detector to AC coupled operation.
11
Software Reference
FFT SETUP
CH1 / CH2 IMPEDANCE
Selection of the input impedance of the FFT analyzer. The input impedance can be set
to 50 ohms or 1 M-ohm. The default setting for all phase noise measurements using
the ND-1 and ND-3 noise detectors is 50-ohms.
Note: The 50-ohm setting must be used when using the ND-1 and ND-3 noise
detectors.
The combination of impedance and coupling settings on the input of the FFT analyzer
will have and effect on the bandwidth. The bandwidth of the FFT analyzer for different
settings is shown below.
Impedance
50
50
1M
1M
Coupling
DC
AC
DC
AC
Bandwidth
DC - 40 MHz
100 kHz – 40 MHz
DC – 40 MHz
10 Hz – 40 MHz
Most amplitude and phase noise measurements can be made using the 50-ohm
impedance and DC coupling on the analyzer.
SET FREQUENCY
Opens the dialog box where the upper and
lower frequency analysis limits can be
selected.
The lower limit options are:
0.1 Hz, 1 Hz, 10 Hz, 100 Hz, 1 kHz,
10 kHz, 100kHz.
The upper limit options are: 100 Hz, 1 kHz
10 kHz, 100 kHz, 1 MHz, 10 MHz,
40 MHz.
PSD ON/OFF
Selection of power spectral density function. When the power density function is
enabled the measurements are normalized to a 1 Hz bandwidth. Use PSD ON for all
noise measurements and use PSD OFF to measure the amplitude of spurs or bright
lines.
The amplitude units will change from dBVrms to dBVrms/Hz when the PSD function is
enabled. With the gain correction of the system enabled the amplitude units are
expressed as dBc or dBc/Hz.
12
SDI
Software Reference
FFT SETUP
SDI
SET AVERAGE
Opens the Number of Averages dialog box where the averaging parameters for the
measurement are selected. The dialog box is shown at the top of the page.
The FFT measurements are processed in spans of 512 bins beginning at the highest
frequency limit selected by the user and processed down to the minimum frequency
limit also selected by the user. The number of averages to be taken can be set for
each span beginning with the highest span. The keypad is used to enter the number of
averages desired. Pressing the SPAN 1 button will use the number entered with the
keypad as the number of averages that must be taken for SPAN 1. Each of the
numbered SPAN buttons performs this function for their respective span number.
SPAN1 is always the highest span and each span covers approximately one decade in
frequency.
RMS AVG ON/OFF
Enable or disable root mean-square (RMS) averaging of data acquired by the FFT
analyzer.
WINDOW FUNCTION
Selection of the window function to be used on each acquired block of data.
Use the HANNING window for all noise measurements.
Use the FLATTOP window to minimize amplitude measurement errors on spurs or
discrete frequency signals.
LINEAR / EXP AVG
Select the type of weighting for the averages taken by the FFT analyzer. The two
options are Linear and Exponential.
13
Software Reference
FFT DETECTOR
SDI
DETECTOR TAB
The DETECTOR tab under the FFT measurement screen contains all controls that are
used to configure and use the Noise Detector Modules.
INDICATORS
The detector tab contains three voltage indicators for measurement channel one and
three voltage indicators for channel two. These voltage levels are monitored and updated on the screen until the FFT analyzer begins acquiring data. Once the FFT analyzer starts the LED indicator on the right side of the detector tab will turn red and the
voltage levels will no longer be updated until the FFT analyzer stops acquiring data.
CH1 / CH2 MIXER
Voltage level measured at the mixer of the noise detector assigned to this measurement channel.
CH1 / CH2 IF
Voltage level measured at the IF output of the noise detector assigned to this measurement channel.
CH1 / CH2 TUNING
Voltage level measured at the PLL output of the noise detector assigned to this measurement channel.
14
Software Reference
FFT DETECTOR
SDI
ASSIGN DETECTOR
Press the ASSIGN DETECTOR button to assign a noise detector module to one of the
analyzer measurement channels. The assign detector dialog box will open and the
user can scan for installed noise detector modules and make a selection for each
measurement channel.
SCAN
Press the scan button to scan the chassis for available noise detectors. The model
number and frequency range of the detectors should appear in the corresponding bin
position on the screen.
CH1 / CH2 SELECTION
Use the drop down selection button to select a Noise detector to be used on Channel 1
of the system and if more than one detector is installed you may select the Noise
detector that is to be assigned to Channel 2 of the system.
Press the EXIT button once you have made your selection.
CONNECT RF CABLES
Once the detectors are assigned to a measurement channel make sure to connect the
IF OUTPUT of the detector to the NMSC controller CH 1 or CH 2 inputs (as selected)
on the rear of the NMSC controller. Make sure to use the supplied BNC cables that
have the ferrite beads clamped on the cable. The ferrite beads are essential for low
noise measurements.
15
Software Reference
FFT DETECTOR
CH1 / CH2 DETECTOR
Press the CH1 / CH2 DETECTOR button to
open the Noise Detector Control Panel on the
assigned measurement channel. The Noise
Detector Control Panel functions depend on
the characteristics of the installed module.
Please go to the hardware section for the
noise detector that is installed in the system,
for a complete description of the functions that
are available for that device.
On the right is the control panel for an ND-1NM module that is assigned to CH1 of the
measurement system.
TIME
The TIME button opens a window where the data that is being acquired can be viewed
in the time domain (amplitude vs time). This window will appear in the upper right hand
corner of the FFT graph. The time traces for each measurement channel are plotted in
this window. The data will correspond to the real-time data for the last FFT span.
16
SDI
Software Reference
FFT CALIBRATION
SDI
The Calibration Tab has a different view for each mode of calibration. The NMSC
software currently supports three methods of system gain calibration. The first method
is Manual calibration, where the user measures the system gain with an independent
calibration method and then enters the measured calibration constants. The second
method is the KD method where a beat signal is used to measure the system gain. The
third method is the Noise method where a known level of noise is injected into the
system and used to obtain the system gain. Other calibration methods may be
supported in the future.
CAL TYPE
The CAL TYPE drop down list contains the calibration methods that can be selected by
the user to calibrate the measurement system. The three choices are: MANUAL, KD,
and NOISE.
CAL TYPE MANUAL
The CALIBRATION TAB controls for the MANUAL setting are shown in the screen shot
below.
SET CH1 / CH2 GAIN
The user enters the measured gain value into the text box. The up and down buttons
on the right side of the text box may be used to increment the value in the text box.
Once the desired value is entered in the text box, the CORRECTION ON button should
be toggled to load the new value. The current gain values appear in the gain indicators
on the right side of the control panel labeled CH1 and CH2.
CORRECTION ON/OFF
The CORRECTION BUTTON is used to enable or disable the gain correction. New
values are loaded by toggling the current correction off and then turning the correction
back on.
GAIN dB ON/OFF
The gain is in dB units when this button is in the ON position.
CH1 / CH2 INDICATORS
The gain correction for channel one and channel two appear in this display. The
indicators are green when the gain values are valid, they are red when the values are
out of range of the system.
17
Software Reference
FFT CALIBRATION
CAL TYPE KD
The CALIBRATION TAB controls for the KD setting are shown in the screen shot below. The KD gain calibration method is the measurement of the sensitivity of the phase
detector and IF amplifier in the Noise Detector Module. This measurement is performed in the time domain using the SCOPE mode of the noise measurement system
controller. This measurement will require a beat signal to be generated between the
two inputs to the noise detector module.
CALIBRATE
The CALIBRATE button will bring up the SCOPE mode of operation where the KD
measurement functions are located.
CORRECTION ON/OFF
The CORRECTION BUTTON is used to enable or disable the gain correction. New values are loaded by toggling the current correction off and then turning the correction
back on.
GAIN dB ON/OFF
The gain is in dB units when this button is in the ON position.
CH1 / CH2 INDICATORS
The gain correction for channel one and channel two appear in this display. The indicators are green when the gain values are valid, they are red when the values are out of
range of the system.
18
SDI
Software Reference
FFT CALIBRATION
SDI
CAL TYPE NOISE
The CALIBRATION TAB controls for the NOISE setting are shown in the screen shot
below. The noise calibration method requires the user to have a calibrated noise
source at the RF carrier frequency of the signals to be measured. The calibration
constants for the noise source must be typed into the System Calibration dialog box
before any measurements are made. The noise source is then turned on, and a known
level of noise is summed with one of the RF carriers. The noise measurement system
is then used to measure the level of the calibrated noise source. This noise
measurement is performed with the desired number of averages. Once the NOISE ON
data has been taken, the user must press the CALIBRATE BUTTON. A correction
curve is then calculated and the mean system gain is displayed in the CH1 and CH2
indicators.
MODEL
The NOISE ON measurement is used to generate a gain correction curve. This curve
can be generated by applying a POINT model to the data, a best-fit LINE model or a
smoothed TRACE model.
POINT MODEL
The noise on amplitude data that is between the CAL START and CAL STOP
frequency is averaged to generate a single NOISE ON amplitude measurement.
LINE MODEL
A line is fit to the noise on amplitude data between the CAL START and CAL
STOP frequency. This line model is then used as the gain correction curve.
TRACE MODEL
The noise on amplitude data is smoothed using a moving average window. The
resulting smoothed data is used as the gain correction curve.
CALIBRATE
After the NOISE ON data is done averaging, press the CALIBRATE button to generate
the gain correction curve using the selected MODEL TYPE.
SAVE
Press the SAVE button to save the gain correction curve.
19
Software Reference
FFT CALIBRATION
SETUP NOISE SOURCE
Press this button to invoke the Measure
Calibration Level dialog box. The dialog box
is shown on the left.
CAL Level
Measure the carrier level at the output of the
noise source and enter the value in dBm
units in this text box.
ND PARM
Press this button to bring up the System
Calibration dialog box where the calibration
constant of the noise source can be entered.
NS NAME
Enter a name to identify the Noise Source
used in the calibration.
NS CAL
Enter the calibration constant for the Noise
Source. This should be the level of the noise
produced by the noise source in a 1 Hz
bandwidth in units of dBVrms/Hz.
NS CAL DATE
Enter the noise calibration date.
CORRECTION ON/OFF
The CORRECTION BUTTON is used to enable or disable the gain correction. New
values are loaded by toggling the current correction off and then turning the correction
back on.
GAIN dB ON/OFF
The gain is in dB units when this button is in the ON position.
CH1 / CH2 INDICATORS
The gain correction for channel one and channel two appear in this display. The
indicators are green when the gain values are valid, they are red when the values are
out of range of the system.
20
SDI
Software Reference
FFT TRACES
SDI
The FFT Analyzer simultaneously processes the input from the two measurements
channels regardless whether there are valid data on one or both of the channels. This
processing will generate three active data traces called CH1, CH2 and CROSS.
CROSS is the cross correlation between channel one and channel two. For single
channel measurements the user can turn off the traces for the channel that is not used
as well as turning off the cross-correlation trace. For dual channels measurements the
user can turn on all three traces.
CH1 ON / OFF
In the ON position CH1 data is displayed on the graph. In the OFF position the trace is
hidden.
CH2 ON /OFF
In the ON position CH2 data is displayed on the graph. In the OFF position the trace is
hidden.
CROSS ON / OFF
In the ON position CROSS data is displayed on the graph. In the OFF position the
trace is hidden.
STORE CH1, CH2, CROSS
Any of the three active traces can be saved to the screen or to a trace file on the hard
disk or removable media. Select the trace to be saved from STORE drop down list.
STORE TRACE
Press this button to bring up the
Store Trace dialog box. Assign a name for
the trace and enter a short description of
the measurement. Press STORE to save to
the display or press SAVE TO FILE to save
the trace to the display as well as to a file
on the disk.
21
Software Reference
FFT TRACES
TRACE LIST BOX
Traces that are stored to the display or recalled from the hard disk are listed by name
in this list box. Click on a name in the list to select a trace for deletion.
DELETE
Press this button to delete a selected trace from the display. Note that the data traces
CH1, CH2 and CROSS cannot be deleted from the screen. Use the CH ON/OFF
buttons to hide those data traces.
LOAD TRACE
Press this button to load data traces from the disk to the current measurement screen.
Once the traces are loaded they will appear on the screen and the trace name should
appear in the trace list box.
22
SDI
Software Reference
FFT CURSORS
SDI
The Cursors Tab contains all controls related to the placement of cursors on any data
trace on the FFT analyzer graph. The cursors can also be moved around by using the
cursor tool on the graph. Additional cursor options are found on the cursor legend and
control box on the cursors tab. Clicking on the lock icon will bring up the cursor modes
selection box. The cursors can be locked to a data trace, snap to a point or a cursor
can be allowed to be moved freely. Other cursor options such as appearance and size
can also be selected.
CURSORS
The cursors list box allows the selection of the number of active cursors that will be
enabled.
CURSOR LEGEND ON / OFF
When the cursor legend is ON a legend is placed on the upper right hand corner of the
graph. The cursor legend and control box on the cursors tab is always active and
enabled.
ACTIVE CURSOR
Select the active cursor for all peak search functions.
PK SEARCH
Select the data trace that will be used for the peak search functions.
PEAK
Place the active cursor on the highest peak of the active data trace.
NEXT PEAK
Place the active cursor on the next highest peak of the active data trace.
PREV PEAK
Place the active cursor on the previous peak.
TEXT COLOR
Change the color of the text in the legend on the graph.
23
Software Reference
FFT COLORS
The colors tab contains the controls to customize the appearance of the graph. The
graph background colors, cursor colors and grid colors can all be customized.
SCREEN / PRINT COLORS
Change the color scheme for the graph.
Background
Change the background color of the graph.
Cursor
Change the cursor color.
Major X Grid
Change the color of the major horizontal gridlines.
Minor X Grid
Change the color of the minor horizontal gridlines.
Major Y Grid
Change the color of the major vertical gridlines.
Minor Y Grid
Change the color of the minor vertical gridlines.
24
SDI
Software Reference
FFT SPURS
SDI
The spurs tab is used to generate a spur table. The spur locating function will identify
any spur level that is above the threshold set by the user. These spurs are then added
to the table and can be sorted by amplitude or by frequency.
Spur Threshold
Set the threshold for the spur locating function. Spurs that have an amplitude greater
than the threshold will be added to the spur table.
UPDATE
Click on this button to update the table.
SPUR PSD ON / OFF
This button is used to disable the bandwidth normalization for the spur amplitudes. The
spur levels should be measured in dBVrms and the amplitude should not be
normalized to 1 Hz bandwidth.
25
Software Reference
FFT FILE
The files tab controls are used to save the measurement system settings, as well as
reports and exported data files. All report and data file options are contained in the
Print Report Dialog box which is activated by the PRINT button.
SAVE SETTINGS
Save the measurement system settings into a configuration file onto the hard disk.
RECALL SETTINGS
Load a measurement configuration file from the hard disk.
EXIT
This button is used to exit the measurement system program.
PRINT
This button activates the Print Report dialog box. This dialog box has all the controls to
generate and print reports containing all the measurement data. In addition to printing
these reports they can also be exported to spreadsheets and ascii data files.
The reports that are generated by the measurement system program are in Microsoft
Word® format.
Microsoft Office 2007® is installed and delivered with the
measurement system so the user should not have a problem opening these files. The
reports are generated from a default template called default_report.dotx. The user
may change or customize this default template. Please refer to the MS Word help files
for additional information. It is recommended that if a new template is generated that it
be assigned a new name.
26
SDI
Software Reference
FFT Print Report Dialog Box
SDI
USER TAB
Under this tab the user may enter information that will
appear in the report that is generated by the software.
MEASUREMENT TAB
Under this tab the user may enter the desired title for the
graph as well as a detailed description of the
measurement.
SYSTEM TAB
There are various options available under this tab. The
radio button are both indicators and controls. When
green the options are enabled. Click on the radio button
to toggle ON or OFF.
Spur Table
Include the spur table in the report.
Calibration Info
Include the calibration information in the report.
Open report
Launches MS Word and opens the report.
Save to File
Save the report to a file on the hard disk.
Print
Sends the report to the printer. A printer options
dialog box will open.
Save Ascii File
The data in the report will be saved to an ascii
file.
OPTIONS TAB
The measurement system software uses a default
template to generate report. The user may also use a
customized report template. The path and filename of
the custom report template is entered in the Report
Template input field. Click on folder icon to browse for a
file. Leave this input field blank to use the defaulte
template.
27
Software Reference
SCOPE Measurement Screen
SCOPE MODE
In SCOPE mode the noise signals are analyzed in the time domain and the digitized data
is displayed in a plot of amplitude vs time. The hardware setting and measurement
parameters and options are set using controls and dialog boxes on the SCOPE Window.
INDICATORS
ARM
A green color indicates that the hardware is armed and awaiting a
trigger to begin acquisition.
TRIG
A green color indicates that the acquisition has been triggered.
OVLD1 A red color indicates an input overload on channel 1.
OVLD2 A red color indicates an input overload on channel 2.
28
SDI
Software Reference
SCOPE Measurement Screen
SDI
SCOPE ON
Pressing the SCOPE ON button will change the NMSC measurement mode to FFT
mode.
START
Pressing the START button initiates the acquisition of data on both measurement
channels.
TIME/DIV
Select the horizontal scaling in time per division from the drop down list. The options
are: 10ns, 20ns, 50ns, 100ns, 200ns, 500ns, 1us, 2us, 5us, 10us, 20us, 50us, 100us,
200us, 500us, 1ms, 2ms, 5ms, 10ms, 20ms, 50ms, 100ms, 200ms.
AMPL/DIV
Select the vertical scaling in Volts per division from the drop down list. The options are:
1mV, 2mV, 5mV, 10mV, 20mV, 50mV, 100mV, 200mV, 500mV.
29
Software Reference
SCOPE Measurement Screen
RANGE
The RANGE button is used to perform a single range finding operation on each of the
input channels.
MEASURE CH1 / CH2
This button is used to select the channel to be used for automated measurements such
as: Frequency , Amplitude or KD.
FIND SIGNAL
This function performs ranging and time-base changes to try to find a signal. If the
signal amplitude is too small or the signal is not periodic the algorithm will not find a
signal and an error message will be displayed.
CH1 / CH2 DETECTOR
Press the CH1 / CH2 DETECTOR button to open the Noise Detector Control Panel on
the assigned measurement channel. The Noise Detector Control Panel functions
depend on the characteristics of the installed module. Please go to the hardware
section for the noise detector that is installed in the system, for a complete description
of the functions that are available for that device.
30
SDI
Software Reference
SCOPE TRIGGER
SDI
TRIGGER CH1 / CH2 / EXT / OFF
Selects the trigger source. The options are CH1, CH2, an external trigger EXT and
OFF which disables the trigger.
TRIGGER AUTO / NORMAL / SINGLE
Selects the triggering mode.
AUTO
In this mode the trigger system generates an automatic trigger
signal after waiting for a specified length of time (Timeout) for a hardware
trigger.
NORMAL
In this mode the trigger system waits indefinitely for a trigger to occur.
SINGLE
In this mode the trigger system waits indefinitely for one trigger to occur.
The system stops after the first trigger event and does not re-arm.
TRIGGER FALLING / RISING
Selects whether the trigger occurs on the falling or rising edge of the signal.
FORCE TRIGGER
Press this button to generate a software trigger.
Timeout
Sets the trigger timeout value for the automatic trigger generation.
Trig Level
Sets the voltage threshold for the trigger system.
Triggered Indicator
Indicates the trigger source for the last trigger event.
31
Software Reference
SCOPE INPUT
CH1 / CH2 COUPLING
The input to the FFT analyzer can be AC or DC coupled. The default setting for all
phase noise measurements using the ND-1 and ND-3 noise detectors is DC coupled. If
you need to make AC coupled measurements you should first try setting up the Noise
Detector to AC coupled operation.
CH1 / CH2 IMPEDANCE
Selection of the input impedance of the analyzer input channel. The input impedance
can be set to 50 ohms or 1 M-ohm. The default setting for all phase noise
measurements using the ND-1 and ND-3 noise detectors is 50-ohms.
Note: The 50-ohm setting must be used when using the ND-1 and ND-3 noise
detectors.
The combination of impedance and coupling settings on the input of the analyzer will
have and effect on the bandwidth. The bandwidth of the analyzer for different settings
is shown below.
Impedance
50
50
1M
1M
Coupling
DC
AC
DC
AC
Bandwidth
DC - 40 MHz
100 kHz – 40 MHz
DC – 40 MHz
10 Hz – 40 MHz
Most amplitude and phase noise measurements can be made using the 50-ohm
impedance and DC coupling on the analyzer.
32
SDI
Software Reference
SCOPE CURSORS
SDI
CURSOR CONTROLS
The cursor controls allow the user to modify the appearance and behavior of the
cursors.
DELTA CH1 / CH2
The Delta cursor function allows the user to place two cursors on a waveform and the
difference in amplitude and time of the two cursors is measured and displayed.
33
Software Reference
SCOPE FREQ/AMPL
Frequency
Displays the measured frequency of the signal in the selected measurement channel.
Use the MEASURE CH1 / CH2 button to change the selected channel for the
measurement.
Amplitude
Display the measured peak-to-peak amplitude of the signal in the selected
measurement channel. Use the MEASURE CH1 / CH2 button to change the selected
channel for the measurement.
Amplitude (RMS)
Display the measured root mean square amplitude of the signal in the selected
measurement channel. Use the MEASURE CH1 / CH2 button to change the selected
channel for the measurement.
Mean DC
Display the mean DC voltage of the signal in the selected measurement channel.
Indicator
Signal found indicator is green if a signal is found in the selected measurement
channel. The indicator is red if a signal is not found. The frequency, amplitude and DC
measurements are not valid if the indicator is red and a signal is not found.
34
SDI
Software Reference
SCOPE CAL/KD
SDI
MEASURE KD ON / OFF
Enable or disable the measurement of the system gain, KD of the selected
measurement channel. Make sure that there is a beat signal present and that the
SIGNAL OK LED is green indicating a valid measurement. Try using the FIND SIGNAL
button if you do not see a signal on the scope display.
AVG ON / OFF
Enable or disable averaging of the KD measurements.
SAVE KD
Saves the measured KD mean as the system gain for the selected measurement
channel.
KD Mean
The real-time average or mean of the KD measurements is displayed.
Period
The period of the beat signal is displayed.
Slew Rate
The slew rate of the signal in the selected measurement channel is displayed.
Number of Samples
The number of KD measurements that have been averaged.
CH1 KD Gain
Displays the current saved system gain for channel one.
CH2 KD Gain
Displays the current saved system gain for channel two.
Indicator
This is the valid KD measurement indicator. Green indicates that a valid measurement
has been taken. Red indicates that the measurement results may be invalid.
35
SDI
Troubleshooting
NMSC does not turn on.
Check that NMS power supply is set to the correct voltage.
Check the NMS power supply is turned on.
Check that the NMS voltage indicators are all on.
If the NMS power supply is turned on and some of the voltage indicators are not
on then return the power supply unit to SDI for repair.
NMSC does not turn on but power supply is working properly.
Check that the ATX and DC power cables connecting the NMSC crate to the
NMS power supply are installed properly and tightened.
Check that the voltage indicators on the rear of the NMSC crate are all ON.
If the NMSC voltage indicators on the NMSC crate are not all ON then send the
NMSC crate and controller back to SDI for repair.
NMSC does not boot the operating system.
This is a serious error and the NMSC controller must be returned to SDI.
NMSC boots fine, however the NMSC software will not execute.
Reinstall the NMSC software.
If the NMSC software does not execute after reinstalling and restarting the NMS
controller then send the NMS controller back to SDI for repair.
NMSC software generates a Noise Detectors not found error.
Press the Set ports button to open the NMS Select Ports dialog box. Set the
ports as in the dialog box below:
CONTROL PORT
BIN PORT
36
set to COM3 or ASRL3
set to COM4 or ASRL4
Troubleshooting
SDI
If the NMSC software cannot find the ports and the software exits, the problem is
with the serial communications drivers. Please consult with SDI on how to
reinstall the hardware drivers.
If the NMSC software finds the ports then follow the instructions given that ask
you to save the default configuration file default.set. This file is normally located
at c:\program files\nmsc3\default.set.
The NMSC software generates the error message NO ATS BOARD FOUND.
The data acquisition drivers are not found. Try powering down the measurement
system and restarting. If the same error message appears contact SDI for
instructions on how to reinstall the data acquisition drivers.
The NMSC software starts normally but the SCAN function does not detect any
installed noise detector modules.
Make sure that the NMS crate power switch is in the ON position and that the
noise detector modules are properly inserted into the crate. Reset the noise
detector modules by turning the NMS crate power switch OFF and then back
ON. Press the SCAN button after resetting the noise detector modules.
If this does not work try having only one module installed. Contact SDI for further
assistance.
SpectraDynamics, Inc.
1849 Cherry Street Unit 2
Louisville, CO 80027
USA
Phone: (303) 665-1852
Fax: (303) 604-6088
WEB: www.spectradynamics.com
37
SDI
38
SDI
39