1
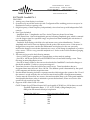
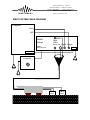
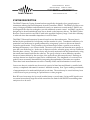
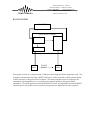
170 Granada Drive, Suite D
San Luis Obispo, California 93401
PH: 805-545-0675
FAX: 805-545-0374
of
Sonic Sensors
EMAT Ultrasonics Inc.
www.sonicsensors.com
USER MANUAL
EMAT SYSTEM
FOR
GUIDED WAVE
ULTRASONIC INSPECTIONS
December 11, 2002
Revision 4.0
Prepared For:
Professor Young Hwan, Kim
Sung Kyun Kwan University
South Korea
Prepared By:
Ron Alers
Sonic Sensors
of EMAT Ultrasonics Inc.
170 Granada Drive,
San Luis Obispo, CA 93401
PH: 805-545-0675, FAX: 805-545-0374
[email protected]
Serial Number: EMAT10K-11-PTB34
1
170 Granada Drive, Suite D
San Luis Obispo, California 93401
PH: 805-545-0675
FAX: 805-545-0374
of
Sonic Sensors
EMAT Ultrasonics Inc.
www.sonicsensors.com
2
TABLE OF CONTENTS
SPECIFICATIONS: ..........................................................................................................................................3
Transmitter: ..............................................................................................................................................3
Receiver:....................................................................................................................................................3
SOFTWARE: OmnEMAT 4.3 .................................................................................................................4
EMAT SYSTEM CABLE DIAGRAM ............................................................................................................5
SYSTEM DESCRIPTION ................................................................................................................................6
BLOCK DIAGRAM .................................................................................................................................7
Timing Diagram.......................................................................................................................................8
TONE BURST GENERATION TAB..........................................................................................................9
A-D Card TAB............................................................................................................................................11
GATE FUNCTION ................................................................................................................................12
SCAN TYPES..................................................................................................................................................13
AMPLITUDE SCAN..................................................................................................................................14
Amplitude Scan Gate Definition .........................................................................................................15
FLAW DETECT SCAN .............................................................................................................................16
Flaw Detect Scan Gate Definition........................................................................................................17
STACKED A-SCAN ..................................................................................................................................18
MOTION CONTROL....................................................................................................................................20
System Specific Configuration.....................................................................................................................21
Scanner Encoder – Encoder Based Scanning .........................................................................................21
Increasing Scan Speed:..........................................................................................................................21
TETHER PIN OUT ........................................................................................................................................22
Spare Parts ..................................................................................................................................................23
Appendix ........................................................................................................................................................24
170 Granada Drive, Suite D
San Luis Obispo, California 93401
PH: 805-545-0675
FAX: 805-545-0374
of
Sonic Sensors
EMAT Ultrasonics Inc.
www.sonicsensors.com
3
EMAT Pulser Receiver Chassis
EMAD10K-11-PTB
SPECIFICATIONS:
Transmitter:
1.
2.
3.
4.
5.
Frequency Range: 100 KHz - 9.99MHz
Load Impedance: 30 - 50 Ohms
Tone Burst is defined by number of cycles and frequency
Tone Burst Cycles from 1 to 255 with software duty cycle limitation to 0.1%
PRF, Pulse Repetition Frequency: 1 Hz - 1000Hz in 1 Hz increments, software duty cycle limit
to 0.01% duty cycle as calculated with the number of cycles in the tone burst.
6. Dual Frequency Mode: The system can be operated in single frequency mode or dual
frequency mode. In two frequency mode, two frequencies are definable with the same number
of cycles in each tone burst. The two tone bursts are generated alternatively switching from
one to the other and synchronized with the hardware and software.
Receiver:
1.
2.
3.
4.
5.
Non-linear gain control. Two independent gain levels switched anywhere from 0-255 usec.
Dual Frequency Mode can provide a different filter for each frequency.
Four filters available, or 2 pairs of filters for each frequency.
0 - 40dB of gain in the chassis with 60 dB of gain in the EMAT probe.
MBB, Main Bang Blanking turns off the receiver during the Tone Burst and displays an
attenuated view of the transmitter output. Controllable from 0 - 255 usec.
170 Granada Drive, Suite D
San Luis Obispo, California 93401
PH: 805-545-0675
FAX: 805-545-0374
of
Sonic Sensors
EMAT Ultrasonics Inc.
www.sonicsensors.com
4
SOFTWARE: OmnEMAT 4.3
FEATURES:
1. Analog wave form display in real time.
2. System Set-Up stored and retrieved with Configuration Files enabling previous set-ups to be
duplicated as easily as opening a file.
3. Single frequency or dual frequency independently viewed and set-up with independent TAB
controls.
4. Scan Types Included:
- Amplitude Scan: 2 Amplitudes and Two Arrival Times are plotted in real time.
- Flaw Detect Scan: One fixed amplitude gate and a floating amplitude gate, which is centered
over the largest signal in a specified range, are plotted real time including the arrival time of
the searched for peak.
- Stacked A-Scan display with 8 bit color and mouse cursor point identification. Position ,
Amplitude and Arrival Time are displayed for the point of the mouse cursor. If the mouse is
dragged from one point to another the differentials are displayed so the user can easily
measure the change in arrival time between two waves, or the change in amplitude or position
of two waves. This is a very powerful analytical tool. It also works well for thickness gauging
applications.
5. All scans can be saved in the following manner:
- Save to ASCII Text for graphing in a spread sheet or other analysis package.
- Save RF to ASCII text which saves the ENTIRE RF wave forms taken during a scan. These
files may be many MegaBytes in size.
- Save RF in binary format so the scan can be reloaded in OmnEMAT 4 and scales changes or
thresholds modified. Useful as a post-processing tool.
6. Timer based scans or Encoder based scans can be set-up. Timer based takes data at a
designated time interval from 1 Hz to 100 Hz. The ultimate speed is determined by the speed
of the computer and the data acquisition time.
7. Encoder Based Scanning: includes a separate encoder which triggers the system to fire. Even if
the scanner is rough and jerky the scan will be smooth and capable of length measurements.
Caution must be exercised to not scan too fast and exceed the duty cycle of the gated amplifier.
An adjustable hardware safety is included to protect the hardware, where as excessive scan
speed will only result in lost data.
8. Supports all ISA 8 bit GAGE A-D cards.
GAGE Compu Scope 225 dual channel A-D card capable of 50 MS/sec of 8 bit data was used.
Available Digitization Rates: 1, 2, 5, 10, 25, 50 MS/s (Mega Samples/sec)
8000 point data transfer block per acquisition
Sample Rate (MS/sec)
1
5
10
25
50
Data Acquisition Depth (usec)
8,000
4,000
800
320
160
170 Granada Drive, Suite D
San Luis Obispo, California 93401
PH: 805-545-0675
FAX: 805-545-0374
of
Sonic Sensors
EMAT Ultrasonics Inc.
5
www.sonicsensors.com
EMAT SYSTEM CABLE DIAGRAM
Computer
CH A
EXT
EMAD
Chassis
EMAT
Pulser Receiver
High
Power
Rcvr1 IO Signal Trigger
COM
COM 2
Scanner
Controller
RCVR
EMAT
XMTR
EMAT
170 Granada Drive, Suite D
San Luis Obispo, California 93401
PH: 805-545-0675
FAX: 805-545-0374
of
Sonic Sensors
EMAT Ultrasonics Inc.
www.sonicsensors.com
6
SYSTEM DESCRIPTION
The EMAT Ultrasonic Testing System has been specifically designed to be a general purpose
instrument utilizing the Electromagnetic Acoustic Transducer, EMAT. The EMAT provides a vast
array of design possibilities and unmatched control over numerous acoustic modes. EMATs can
be designed with a fixed wavelength to provide additional acoustic control. An EMAT can also be
designed to be broad banded and excite waves based on the frequency driven. The EMAT Pulser
Receiver Chassis can drive any EMAT with in the specified frequency range. Peak drive efficiency
is achieved when the transmitter impedance is near 50 Ohms.
This EMAT Ultrasonic Inspection System is based on tone burst ultrasonics. The tone bust is
defined by the specification of a frequency and the number of cycles. Transduction efficiency of a
particular wave mode may be greatly enhanced by using many cycles in a driven tone burst to
excite the specific mode. Using a multi-cycle tone burst helps isolate a specific wave mode by
defining the frequency over a narrow band. The more cycles in the tone burst the more precise or
pure the wave mode may be. In the case of dispersive modes, when the group velocity is different
than the phase velocity. The phase velocity may be easily measured with this instrument by using
the transit time feature built into the software. The group velocity is more difficult to measure,
because a feature defined by the envelope of the received tone burst must be used. Defining an
envelope feature in a dispersive signal can be a difficult task. The Amplitude of a received wave
packet is most accurately determined by integrating the amplitudes of the entire wave packet.
These three basic measurements account for virtually all the useful information in a tone burst.
Once a tone burst is excited it may be received a period of time later and filtered or rectified with
velocity or amplitude information extracted. Included are many Scan Types enabling a multitude
of measurements to be made and displayed in real time. The results may be saved in binary form
or ASCII text for post processing in a spread sheet or other program.
Raw RF wave forms may also be saved in either binary or text format. Saving an RF signal in text
can create horrendously large files which exceed the size limit for MS EXCEL necessitating other
analysis tools to be used.
170 Granada Drive, Suite D
San Luis Obispo, California 93401
PH: 805-545-0675
FAX: 805-545-0374
of
Sonic Sensors
EMAT Ultrasonics Inc.
www.sonicsensors.com
7
BLOCK DIAGRAM
COMPUTER
Pulser Receiver Chassis
u-Controller
Receiver
Transmitter
Xmtr
EMAT
SOUND
WAVE
Rcvr
EMAT
The system consists of a computer with a COM port and a high speed data acquisition card. The
computer communicates through a RS232 COM port to a microcontroller which operates all the
routine functions of the pulser receiver chassis. The microcontroller sends a tone bust to the
transmitter which amplifies it to a very high power signal capable of driving the EMAT
transmitter. The small signals received by the EMAT receiver are amplified on board the EMAT
and than sent to the pulser receiver chassis for preparation for digitization by the computer.
170 Granada Drive, Suite D
San Luis Obispo, California 93401
PH: 805-545-0675
FAX: 805-545-0374
of
Sonic Sensors
EMAT Ultrasonics Inc.
www.sonicsensors.com
8
Timing Diagram
Magnet
On
Magnet
Off
Trigger
Tone Burst
Freq1
DT
DT Gain 1
Sig Gain 1
RF Display
Freq 1
Tone Burst
Freq 2
Sig Gain 2
Freq 2
DT Gain 2
RF
Display
TIMING DIAGRAM 1: Shows the sequence of events during a dual frequency pulsing cycle. Note
a Dual Frequency Scan takes twice as long to complete because there are two pulse cycles for each
data point. A single Frequency cycle provides a data point every pulse.
170 Granada Drive, Suite D
San Luis Obispo, California 93401
PH: 805-545-0675
FAX: 805-545-0374
of
Sonic Sensors
EMAT Ultrasonics Inc.
www.sonicsensors.com
9
TONE BURST GENERATION TAB
Figure 1: Tone Generation TAB: pulser and receiver parameters are adjusted in this TAB
PULSE: Starts the system firing the transmitter and acquiring wave forms.
DUAL FREQUENCY: Turns on the frequency toggle. Alternating Tone Burst firing Freq.1 then
Freq.2 then Freq.1 then Freq.2 etc. Permits two acoustic tests to be performed
simultaneously.
TIME BASED / ENCODER BASED: The check box defines if an internal clock generates the
trigger or an external encoder generates the trigger.
ENCODER BASED => A scan will ONLY proceed when an external encoder moves and
supplies a trigger. The encoder step size and units may be entered in these txt boxes.
Pulse (Hz): PRF, Pulse Repetition Frequency, Number of wave Acquisitions per cycle
Cycles: Number of Cycles in the tone burst
DT: DT Time is a time period the DT Gain is active, permits lower gain during the large Direct
Transmission Signal FOR FREQUENCY 1 ONLY. See “Magnet Off”
Tone Amp: Transmitter Output Level from 0 - 255
DT Gain1: adjusts the gain from 0-255 for the period up to the DT Time
Sig Gain1: Gain level from 0 - 255 for time after DT Time
170 Granada Drive, Suite D
San Luis Obispo, California 93401
PH: 805-545-0675
FAX: 805-545-0374
of
Sonic Sensors
EMAT Ultrasonics Inc.
www.sonicsensors.com
10
DT Gain2: DT Gain for Frequency 2
Sig Gain2: Signal Gain for Frequency 2
Magnet Off: For use in Dual Frequency Mode only. This time value controls the DT time of FREQ
2 only independently of DT Time for FREQ 1. This option is selected by the jumper on the analog
board JP1. If the same DT Time is desired for both FREQ 1 and FREQ 2 pull (open) JP1 and insert
(short) JP2. These jumpers are surface mount devices located near IDC1 (one of the ribbon
connectors).
170 Granada Drive, Suite D
San Luis Obispo, California 93401
PH: 805-545-0675
FAX: 805-545-0374
of
Sonic Sensors
EMAT Ultrasonics Inc.
www.sonicsensors.com
11
A-D Card TAB
Figure 2: A/D Card, Analog to Digital Conversion Card parameter TAB: Time Gates are specified to
perform various graphing functions in the assorted Scan Types.
The A-D Card Tab defines all the parameters of the Analog to Digital Converter Card.
Sample Rate => sets the digitization rate in Mega Samples per Second MS/s.
Trigger Depth => determines how many samples are taken each pulse, (8000 is hard coded).
Trigger Level => sets the level to trigger te acquisition process. (must be > 128)
GATE DEFINITIONS
First Box = Start of the Gate, Second Box = Duration of the Gate, Third Box = End of Gate
(either the duration or end of gate may be entered and the other will be calculated)
Each Scan Type has a unique number and style of Gates. Shown in Fig.2 are the five gates needed
for the Amplitude Scan. There are two transit time gates and two Amplitude gates and the bottom
gate is an optional ZERO REFERENCE Gate for the Transit Time Gates.
170 Granada Drive, Suite D
San Luis Obispo, California 93401
PH: 805-545-0675
FAX: 805-545-0374
of
Sonic Sensors
EMAT Ultrasonics Inc.
www.sonicsensors.com
12
GATE FUNCTION
Amplitude Gates: Amplitude gates are used to measure the size of the acoustic signal received.
In the case of tone burst ultrasonics there are numerous peaks in a tone burst which define the
amplitude. Instead of measuring the single highest peak the signal can be rectified and integrated
to incorporate the amplitude of the entire tone burst. An amplitude gate rectifies the signal
bounded by the gate and sums all amplitudes values with in the gate. To normalize the sum is
divided by the width of the gate, providing essentially a “Fill Factor” of the gate. This is an
effective way to measure amplitude of a tone burst and benefit by some noise immunity.
Zcross or Time Gate: The arrival time of a signal can be precisely measured by the point where
the RF signal passes through zero. We call this point a zero-crossing or Zcross for short.
Measuring the zcross is a measure of the phase velocity of a signal. Non-dispersive modes have
identical phase and group velocity.
Precision time measurements are made by interpolating the zero-crossing between data points on
a negative going slope. The Zero-Crossing is located by finding the largest peak in the first (left)
half of the gate and then moving to the right until the signal passes through zero. The exact point
of crossing is calculated by interpolation using data points on both sides of the zero.
TIPS!! When setting up the Zcross gate be anticipate which direction the zero crossing will move
during the scan. If the velocity will only speed up during the scan place the left edge of the Zcross
gate just to the right of the earlier peak. This way the same peak will be chosen during the Zcross
calculation. If there is only one predominate peak in the wave packet a very large gate may be
used and the computer can find the peak anywhere in the first half of the gate.
170 Granada Drive, Suite D
San Luis Obispo, California 93401
PH: 805-545-0675
FAX: 805-545-0374
of
Sonic Sensors
EMAT Ultrasonics Inc.
www.sonicsensors.com
13
SCAN TYPES
There are five scan types available in OmnEMAT. These scan types have different methods of
graphing to enhance certain acoustic features. These scan types are described individually below.
1. Amplitude Scan: Plots the integrated amplitude of two separate gates and the transit times of
two additional gates. Typically used to plot the amplitude and arrival time of two different
wave packets.
2. Flaw Detect Scan: Plots the integrated amplitude of a fixed gate and searches a larger gate for
the greatest amplitude above a threshold. The peak amplitude in the large gate is integrated
around by a fixed time period and the arrival time of the peak is displayed. The integration
time around the peak may be set to be the same as the initial fixed integrated amplitude gate or
the integration period may be typed in.
3. Stacked A-Scan: creates a colored 3-dimensional view of an acoustic signal. The amplitude fo
the entire wave form is displayed as a function of color. The horizontal axis represents the
arrival time of the wave. Successive acoustic acquisitions are displayed adjacent to each other
forming the vertical axis, acquisition number or if scanning the scan position. THe phase
features show up as vertical lines as successive wave forms have the same peaks and vallies
which appear as red (high) or blue (low) with green as the baseline of zero amplitude.
Two styles of color tables are available to view the data. Rectified and non-rectified.
Sometimes the phase features of a wave form are not important and only amplitude is of
interest. Rectification of the wave essentially doubles the frequency of the peaks and high
amplitudes become all red and low amplitudes are blue making the rainbow color spectrum
concentrated from zero amplitude to full screen height. The rectified color table offers twice
the amplitude resolution of the non rectified color table because the color differences are
concentrated over half the range.
Quantitative Analysis Tool: The mouse pointer displays the amplitude, position, and arrival
time when it is placed on the graph. Two points can be compared by dragging the mouse
pointer between two points. The difference between the start point and end point will be
displayed on the lower right hand side of the screen. The display reads as follows:
A = amplitude, P = position, T = arrival time
dA = change in amplitude, dP = change in position, dT = change in arrival time
170 Granada Drive, Suite D
San Luis Obispo, California 93401
PH: 805-545-0675
FAX: 805-545-0374
of
Sonic Sensors
EMAT Ultrasonics Inc.
www.sonicsensors.com
14
AMPLITUDE SCAN
Figure 3: Amplitude Scan: Amplitude and Arrival Time of a wave packet is displayed with a Red,
Amplitude Line, and a Blue Arrival Time Line. An additional graph of the same features are displayed
on the lower graph. This graph shows the amplitude of the two received signals stayed constand but the
phase velocity changed as the distance between the transducers changed.
The scale of each graph is defined in the text boxes in the upper right. The amplitude graph
requires a MINimum and MAXimum value. The arrival time graph is typically a high resolution
scale, to facilitate this a full scale SPAN is required and a CENTER button is provided to center the
time scale at the defined resolution around the last data point taken.
LENGTH OF SCAN: is determined by entering the number of pulses, or data points, to save in a
scan. If the Save After ## Pulses is NOT checked the scan will run continuously and wrap around
over the previous data. Timer Based scanning will use the PRF to determine the number of
seconds in a scan.
Scan Length (pulses) = Scan Duration (seconds) x PRF (pulses per second)
170 Granada Drive, Suite D
San Luis Obispo, California 93401
PH: 805-545-0675
FAX: 805-545-0374
of
Sonic Sensors
EMAT Ultrasonics Inc.
www.sonicsensors.com
15
Amplitude Scan Gate Definition
Figure 4: Amplitude Scan A-D Card Set-Up: Shown are two different wave packets one at 20 usec. and
the other at 55 usec. Each wave packet has two gates defined: an Amplitude and a Zero-Crossing gate
labeled Amp1, Z-Cross1, Amp2, Z-Cross2, respectively, and colored as noted.
Amp1
Z-Cross2
BLACK
YELLOW
Integrated Amplitude of Top Graph #1
Zero-Crossing in the Top Graph #1
Amp2
Z-Cross2
RED
BLUE
Integrated Amplitude of Bottom Graph #2
Zero-Crossing in the Bottom Graph #2
Zero Ref
GREEN
Bottom Gate with blank label.
Use in Tone Burst as a reference to measure the transit times from. This increases resolution by
removing the digitization error from the start of acquisition.
170 Granada Drive, Suite D
San Luis Obispo, California 93401
PH: 805-545-0675
FAX: 805-545-0374
of
Sonic Sensors
EMAT Ultrasonics Inc.
www.sonicsensors.com
16
FLAW DETECT SCAN
Figure 5: Flaw Detect Scan: Displays three features. The BLUE marks show the arrival time of the
PEAK amplitude in the search gate. The RED line in the upper graph shows the integrated amplitude of
the PEAK signal in the search gate. The displayed scan shows echos from five cracks at different
distances. The first crack on the left was the furthest away with the echo arriving at 100 usec. The last
crack was the closest arriving at 50 usec.
170 Granada Drive, Suite D
San Luis Obispo, California 93401
PH: 805-545-0675
FAX: 805-545-0374
of
Sonic Sensors
EMAT Ultrasonics Inc.
www.sonicsensors.com
17
Flaw Detect Scan Gate Definition
Figure 6: A-D Card Set-Up for Flaw Detect Scan: There are only two gates to set for the Flaw Detect
Scan. The DT Amp gate captures the reference Direct Transmission signal. The Peak Find gate is large
and defines the period of time to search through to locate the highest peak signal. The integrated
amplitude around the peak is performed for every acquired signal.
170 Granada Drive, Suite D
San Luis Obispo, California 93401
PH: 805-545-0675
FAX: 805-545-0374
of
Sonic Sensors
EMAT Ultrasonics Inc.
www.sonicsensors.com
18
STACKED A-SCAN
Figure 7: Stacked A-Scan display of a scan past two large cracks and a smaller crack in between. 600
acquisitions are displayed on the screen from top to bottom with the gated time slice in the horizontal
axis. The default color table displays a rainbow over the range of 0 – 255 showing peaks as red and
valleys as blue.
170 Granada Drive, Suite D
San Luis Obispo, California 93401
PH: 805-545-0675
FAX: 805-545-0374
of
Sonic Sensors
EMAT Ultrasonics Inc.
www.sonicsensors.com
19
Figure 8: The rectified color table shows a rainbow of colors from blue to red over the range of 128
(center screen, no signal amplitude) to 0 and conversely to 255. This rectification shows twice the
frequency as the normal display. The color table may be changed in the color table Pull Down menu in
the top of the screen.
Mouse Pointer Scale: The values associated with the mouse pointer position is displayed
continuously while the mouse is over the graph. Differential measurements may be made by
dragging the mouse from one point to another. The change of “dP” position, “dT” time, and “dA”
amplitude are displayed in the lower right after a mouse drag is performed.
170 Granada Drive, Suite D
San Luis Obispo, California 93401
PH: 805-545-0675
FAX: 805-545-0374
of
Sonic Sensors
EMAT Ultrasonics Inc.
www.sonicsensors.com
20
MOTION CONTROL
Control of the scanner may be performed in software using the <Motion Control Tool bar> located
in the menu in the top of the screen. The software control permits the scanner to be started and
stopped automatically during an Encoder Based Scan. This is a convenient feature for automated
scanning. The tool bar may be placed anywhere on the desk top by dragging it with the mouse.
An automated scan will run in the direction last set in the motion control tool bar.
The scan velocity is determined by the voltage level manually set on the Motion Control Power
Supply.
Acoustic measurements are triggered by the encoder during encoder based scanning.
The scan can be jerky or intermittent and the encoder will smooth ou the data aquision
for precise lacations. If the scanner moves too fast and attemps to trigger the acoustic
system faster than 100 Hz a hardware limit will skip the pulse exceeding the 100 Hz
period. Each missed pulse is logged and displayed at the end of the scan as:
ERROR COUNTS: The Error counter only counts up to 255 and can roll over if the scan
is run excessively fast. This should never occur because the operator should know the
maximum scan speed. If the encoder based scan travels further than it should the scan
rate is probably missing points and counting errors.
Run the system at a conservative scan rate
which matches the step size increment.
170 Granada Drive, Suite D
San Luis Obispo, California 93401
PH: 805-545-0675
FAX: 805-545-0374
of
Sonic Sensors
EMAT Ultrasonics Inc.
www.sonicsensors.com
21
System Specific Configuration
Scanner Encoder – Encoder Based Scanning
The step size of the scanner is set on a DIP switch in the Pulser Receiver chassis. The DIP switch is
accessible by removing the bottom cover of the Pulser Receiver chassis. The DIP switch is located
in the rear near the fan.
Encoder Dip Switch = Set at #5 = step size of 0.134 inches / pulse
Maximum pulse repetition rate of computer = 100 pulse/second
(computer bus and processor dependent)
Error Counter Set at 100 Hz
The computer speed limits the maximum pulse repetition rate. The computer has been measured
to process up to 100 measurements, pulses, per second. A step size of 0.067 inches per pulse at 100
Hz PRF permits the scanner to be run at 6.7 inches per second, or 33 feet per minute.
Exceeding this rate will create missed data points which will be displayed on the Amp-Time Scan
as errors. The error count only goes up to 255 errors per scan. This assumes the operator will
minimize errors by keeping the scan rate below these limits.
ENCODER RESOLTION = 0.008 inches per pulse
Switch
÷
0
2
4
8
16
32
64
128
256
1
2
3
4
5
6
7
8
9
Inches /
pulse
0.0084
0.0167
0.0335
0.067
0.134
0.268
0.536
1.072
2.144
Increasing Scan Speed:
If higher speed scans are desired simply increase the step size to not exceed the PRF limit of 100
Hz. The table above shows the step sizes resulting from the DIP switch setting. For example DIP
switch #3 would provide 0.134 inch steps enabling a scan speed one foot per second.
The motor drives a chain with a 3:1 speed reduction. For academic / research use torque was
considered more important than speed. The easiest way to increase the speed is by changing the
drive sprocket and possibly lengthening the chain.
170 Granada Drive, Suite D
San Luis Obispo, California 93401
PH: 805-545-0675
FAX: 805-545-0374
of
Sonic Sensors
EMAT Ultrasonics Inc.
22
www.sonicsensors.com
TETHER PIN OUT
Tether has a HIROSE 12 pin connector on the Pulser Receiver Chassis to house system IO. The
Scanner has a Burndy, TrimTrio 16-19 connector for a single connector quick release of all
connections. These connectors were wired with respect to the following table.
P-R Chassis
'Buckeye Box'
HI ROSE
(12pin)
Male Cable
(both ends)
Female Scanner
TrimTrio (18pin)
Pin #
Color
Pin #
Description
RG174
BNC
K
RCV Sig
L
RCV gnd
1
RED
A
MOTOR
2
WHITE
M
MOTOR
3
YELLOW
E
+5V ENCODER
4
WHITE
F
SIG A ENCODER
5
BROWN
J
6
WHITE
V
GND PRE AMP
SHIELD GND
(CHASSIS)
7
GREEN
D
GND ENCODER
WHITE
NC
8
BLACK
G
+8V PRE AMP
9
WHITE
H
-8V PRE AMP
10
NC
11
NC
12
NC
RG58
TNC
P
XMT (SIG)
RG58
TNC
C&B
XMT (SHIELD)
CONNECTOR
HI ROSE (12pin) CABLE PLUG
TRIM TRIO Plug (cable)
TRIM TRIO Pins
PART #
RM-15TPD-12P
G6F19-195NE
RM24M 9D28
VENDOR
DIGI-KEY
CTI
CTI
PHONE #
1-800-344-4539
1-800-458-5646
1-800-458-5646
TRIM TRIO Receptacle (Chassis)
TRIM TRIO Socket
GOF16-19PNE
RC24M 9D28
CTI
CTI
1-800-458-5648
1-800-458-5649
170 Granada Drive, Suite D
San Luis Obispo, California 93401
PH: 805-545-0675
FAX: 805-545-0374
of
Sonic Sensors
EMAT Ultrasonics Inc.
www.sonicsensors.com
23
TETHER:
The 100 foot tether with RG58, 50 Ohm cable was tuned to provide efficient power transfer to the
Transmitter EMAT. If other transmitter cables are used less than optimal power will reach the
transmitter and smaller signals will be realized.
NOTICE: If shorter tethers are used with this system the transmitter power will be less than
optimal. Best performance may only be achieved with the 100’ tether supplied.
Spare Parts
EMAT
Part Number
Description
Quantity
(Original Order)
M440-2020
M340-2020
M300-1520
M260-1520
M200-1520
M180-1515
M160-1520
2020CART-Xmtr
2020CART-Rcvr
F2020CART
EMAT
EMAT
EMAT
EMAT
EMAT
EMAT
EMAT
Transmitter cart with 2”x2” magnet
Receiver cart with 2”x2”magnet
Foil Wear Surface
2
2
0
2
2
0
0
2
2
6
170 Granada Drive, Suite D
San Luis Obispo, California 93401
PH: 805-545-0675
FAX: 805-545-0374
of
Sonic Sensors
Appendix
Sample Data File
EMAT Ultrasonics Inc.
www.sonicsensors.com
24
170 Granada Drive, Suite D
San Luis Obispo, California 93401
PH: 805-545-0675
FAX: 805-545-0374
of
Sonic Sensors
EMAT Ultrasonics Inc.
www.sonicsensors.com
25
Sample Data File of a DUAL FREQUENCY SCAN as saved by: SAVE TO TEXT
These Text files are designed to be read by a spread sheet program .
FORMAT:
1. All configuration values are stored, frequency, gates etc.
2. Results of Gates, Amplitude or Zero-Crossing value
3. RF wave form if selected, CAUTION these files get VERY large VERY quickly.
4. DUAL FREQUENCY scans repeat # 1,2 and 3 for the second frequency. Single Frequency
scans only include #1, 2 and 3 once.
Pitting M160 S0 and S1
START MODEL
TypeID 55
Version 1
START TONEGEN
TypeID 21
Version 1
FrequencyMultiplier
Frequency1
Frequency2
RepeatRate
ToneCount
MBBUsec
DTUsec 40
AnalogOut1
AnalogOut2
AnalogOut3
AnalogOut4
AnalogOut5
AnalogOut6
AnalogOut7
AnalogOut8
MagnetOn
MagnetOff
OutPort 0
OutPort2
PulseMode
Enable 0
Filter
0
ClockMHz
DutyCycle
PercentDutyCycle
ScanTimerBased
EncoderBasedStart
EncoderBasedStep
3
550
700
21
5
14
87
125
65
100
0
0
0
222
0
31
0
1
1
1000
19
1
0.0000
1.0000
170 Granada Drive, Suite D
San Luis Obispo, California 93401
PH: 805-545-0675
FAX: 805-545-0374
of
Sonic Sensors
EncoderBasedStart
END TONEGEN
START ATODCARD
TypeID 22
Version 1
SampleRate
ChannelMode
BoardNumber
BaseHz 3
TriggerSource
TriggerExtCoupling
TriggerExtGain
TriggerSlope
TriggerLevel
TriggerDepth
TriggerTimeout
InvertStatus
TriggerShouldTimeout
TriggerOffset
UnbusyTimeout
UnbusyShouldTimeout
END ATODCARD
START SCAN
TypeID 19
Version 1
START SIGNALSET
Board 1
Channel 1
BufferOffset
START GATE
UsecStart
UsecDuration
Operation
END GATE
START GATE
UsecStart
UsecDuration
Operation
END GATE
START GATE
UsecStart
UsecDuration
EMAT Ultrasonics Inc.
www.sonicsensors.com
Units
25
0
1
4
1
3
0
180
4096
96
0
1
-64
100
1
0
30.00
10.00
0
2.00
3.00
0
86.00
10.00
26
170 Granada Drive, Suite D
San Luis Obispo, California 93401
PH: 805-545-0675
FAX: 805-545-0374
of
Sonic Sensors
Operation
END GATE
www.sonicsensors.com
0
START GATE
UsecStart
UsecDuration
Operation
END GATE
34.20
4.00
0
START AMPTIME2F DATA
START DATA
ItemStart
ItemDuration
ItemFinish
NumBitsPerItem
MaxBuffers
BiggestCapturedIndex
ChangeDataIndex
FirstBufferIndex
WrapAround
HasWrappedAround
END DATA
AAmpMin
AAmpMax
AZSpan 30.00
AZCenter
BAmpMin
BAmpMax
BZSpan 30.00
BZCenter
SaveSeconds
AutoSave
START RESULTS DATA
Gate0
Gate1
Gate2
Amp1 Zcross1
Amp2
64.57
3.24
63.04
66.89
3.24
62.82
65.37
3.24
63.24
0
4000
4000
8
700
451
451
0
true
false
0.00
80.00
36.02
0.00
80.00
19.68
60
false
Gate3
Zcross2
36.07
36.06
36.06
******* TRUNCATED *******
64.45
64.89
65.51
3.28
3.24
3.28
61.91
63.81
61.52
EMAT Ultrasonics Inc.
36.12
36.06
36.09
27
170 Granada Drive, Suite D
San Luis Obispo, California 93401
PH: 805-545-0675
FAX: 805-545-0374
of
Sonic Sensors
www.sonicsensors.com
END RESULTS DATA
END AMPTIME2F DATA
END SIGNALSET
START SIGNALSET
Board 1
Channel 1
BufferOffset
START GATE
UsecStart
UsecDuration
Operation
END GATE
0
16.00
8.00
0
START GATE
UsecStart
UsecDuration
Operation
END GATE
1.50
3.00
0
START GATE
UsecStart
UsecDuration
Operation
END GATE
45.00
8.00
0
START GATE
UsecStart
UsecDuration
Operation
END GATE
18.50
3.00
0
START AMPTIME2F DATA
START DATA
ItemStart
ItemDuration
ItemFinish
NumBitsPerItem
MaxBuffers
BiggestCapturedIndex
ChangeDataIndex
FirstBufferIndex
WrapAround
HasWrappedAround
EMAT Ultrasonics Inc.
0
4000
4000
8
700
451
451
0
true
false
28
170 Granada Drive, Suite D
San Luis Obispo, California 93401
PH: 805-545-0675
FAX: 805-545-0374
of
Sonic Sensors
www.sonicsensors.com
END DATA
AAmpMin
AAmpMax
AZSpan 30.00
AZCenter
BAmpMin
BAmpMax
BZSpan 30.00
BZCenter
SaveSeconds
AutoSave
START RESULTS DATA
Gate0
Gate1
Gate2
Amp1 Zcross1
Amp2
63.71
2.84
60.11
62.89
2.81
60.54
62.35
2.78
61.33
62.05
2.78
60.27
0.00
80.00
36.02
0.00
80.00
19.68
60
false
Gate3
Zcross2
19.76
19.72
19.69
19.69
*****TRUNCATED*********
63.23
2.81
60.04
52.33
2.77
55.64
53.18
2.82
54.38
52.68
2.84
56.57
END RESULTS DATA
END AMPTIME2F DATA
END SIGNALSET
END SCAN
END MODEL
EMAT Ultrasonics Inc.
19.72
20.15
20.19
20.21
29