1
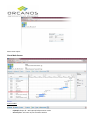
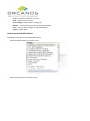
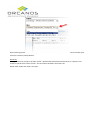
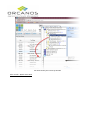
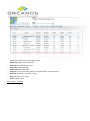
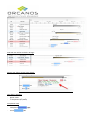
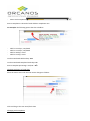
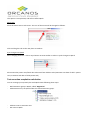
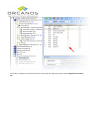
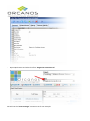
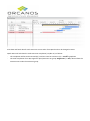
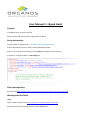
User Manual for Qpack Gantt
Purpose
View QPack filters on Gantt Timeline.
Edit item start/end date and sync changes back to QPack
Setup instructions
Create a folder on QPack server: C:\Program Files\Qpack\QpackGantt
Extract QPack Gantt zip file to newly created QPackGantt folder
Enter IIS, and create virtual directory named Gantt under QPack virtual directory.
If required – change the URL’s in web.config file:
Client prerequisites
Please review http://www.anychart.com/products/anygantt/docs/users-guide/index.html
Working with the Gantt
Login
Open browser and type URL: http://[QPack server]/qpack/Gantt/login.aspx
Enter QPack user name and password, and click Login button
Main screen opens.
Gantt Main Screen
Gantt toolbar
-
Expand/Collapse all – Will expand/collapse Gantt results
Zoom in/out – will zoom in/out the Gantt timeline
-
Fit all – Fit Gantt information to screen
Print – export Gantt to printer
Save as image – export Gantt to image file
Refresh – will refresh Gantt results from QPack database
Sync – will sync dates changes into QPack database
Logout – logout Gantt
How to work with QPack Gantt
Following are the steps to work with QPack Gantt:
-
Select the QPack project you wish to track
-
Select the project filter you wish to track
Upon selecting the filter, QPack will populate the results on the timeline. QPack Gantt can show all item types
that were retrieved, except defects.
Hierarchy
As long as hierarchy is kept in the filter results – QPack Gantt will maintain the hierarchy. If a parent is not
found for specific item in filter results – the item will be located in the Gantt root.
QPack order within each level is not kept.
The Gantt shows filter results of the SRS
Filter results – QPack Gantt Grid
-
QPack Gantt Grid shows following item data:
QPack key: QPack unique identifier
Task name: the QPack item name
Start date: QPack start date
Finish date: QPack due date
Progress: 0% for active item, 100% for completed item, set by the status
Duration: Due date – Start date, in days
Assign to: QPack user name
Status: QPack status
Filter results – Timeline
Selected item will be marked in Orange:
Mouse over allows viewing item details:
Item data in timeline
-
QPack status
% completion (0%/100%)
Completion mark
-
Completed:
-
Active
-
Parent task completion:
Parent completion is derived of total children completion rate.
For example: the following parent that has 4 children
-
Child 1: 18.5 days, completed
Child 2: 23.5 days, completed
Child 3: 38 days, active
Child 4: 22 days, active
Total accumulated children days: 102
Total accumulated completed tasks days: 42
Parent complete percentage = 42/102 = 41%
Changing task start or finish date
Place the mouse over task until the mouse changes as follows:
Click and drag to the new start/finish date
Changing task completion
This option is not operative, and will not affect QPack
Move task
Place the mouse over a task center. The icon of the mouse will be changed as follows:
Click and drag the task to the new place on timeline
Sync changes into QPack
After changing the dates – click on Sync button on Gantt toolbar in order to synch changes in QPack:
Please note that parent start/finish date is derived from children tasks (minimum start date of child = parent
start, maximum end date of child=parent end)
Test execution completion calculation
You can manage your QA work plan with QPack Gantt following these steps:
-
Build execution group in QPack, called “Regression”
Add execution set/s in QPack under the created execution group:
-
Add test cases to execution sets
Run tests in QPack
-
Create filter in QPack to retrieve all execution sets under the regression group, called “Regression execution
set”:
-
Open QPack Gantt and select the filter “Regression execution set”
We will use the “Items manager” execution set for our example.
Start date and finish date for each execution set are taken from QPack and can be changed in Gantt.
QPack Gantt will calculate the total execution completion (run/No run) as follows:
-
The completion will be total executed (8) / Total test cases in execution (11) = 72.73% completion
The total completion of our QA regression plan (Execution set group “Regression”) is 70%, derived from the
execution sets under the execution group.