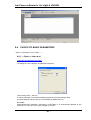
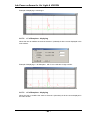
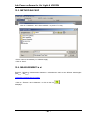
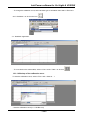
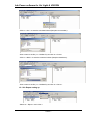
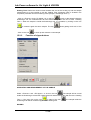
1
LAB POWER software for Uvi Light & UVIKON XL/XS User’s manual Manual version: 1.0 Software version: 3.20 Lab Power software for Uvi Light & UVIKON SUMMARY 1. REMARKS ........................................................................................................................................... 7 2. WARRANTY ....................................................................................................................................... 9 3. INFORMATION................................................................................................................................ 11 4. HOW TO USE THE MANUAL ....................................................................................................... 13 PART I 5. 15 INSTRUCTIONS OF USE................................................................................................................ 17 5.1. MINIMUM CONFIGURATION RECOMMANDED..................................................................... 17 5.2. SOFTWARE INSTALLATION FROM THE CD-ROM ................................................................. 17 5.3. SPECTROPHOTOMETERS CONNECTION ►◄........................................................................ 17 5.3.1. UVI LIGHT XS......................................................................................................................... 18 5.3.2. UVI LIGHT PC ........................................................................................................................ 18 5.3.3. UVI LIGHT XT AND XTDimension......................................................................................... 18 5.3.4. UVIKON XL/XS ....................................................................................................................... 19 5.4. INITIALIZATION........................................................................................................................... 20 5.4.1. Starting..................................................................................................................................... 20 5.4.2. System autotest and initialization............................................................................................. 20 5.4.3. Stopping of the unit ►◄ ......................................................................................................... 21 5.4.4. Baseline ►◄........................................................................................................................... 21 PART II 6. START UP COMMON FUNCTIONS 23 GENERAL FUNCTIONS ................................................................................................................. 25 6.1. DISPLAY SCREEN ........................................................................................................................ 25 6.2. CHOICE OF ACQUISITION PARAMETERS ............................................................................... 26 6.3. CHOICE OF CALCULATION PARAMETERS............................................................................. 26 6.4. CHOICE OF BASIC PARAMETERS ............................................................................................. 27 6.4.1. « Optics » index ►◄............................................................................................................... 27 6.4.2. « Automation » index ............................................................................................................... 29 6.4.3. « Printout » index..................................................................................................................... 30 6.5. CHOICE OF ACCESSORIES ►◄................................................................................................. 30 6.6. STARTING A MEASUREMENT ................................................................................................... 31 6.7. DOING A CALCULATION............................................................................................................ 31 6.8. DATA DISPLAYING...................................................................................................................... 31 6.9. DATA BACKUP ............................................................................................................................. 32 6.10. DATA FILE OPENING............................................................................................................... 32 6.11. DATA EXPORT .......................................................................................................................... 33 6.11.1. ASCII (*.asc) format ................................................................................................................ 33 6.11.2. EXCEL (*.xls) format............................................................................................................... 33 6.11.3. « UV-PRO » format ................................................................................................................. 33 6.11.4. Bitmap (*.bmp) format............................................................................................................. 34 6.11.5. Towards clipboard ................................................................................................................... 34 6.12. USER’S METHODS.................................................................................................................... 35 6.12.1. Backup ..................................................................................................................................... 35 6.12.2. Downloading............................................................................................................................ 35 6.13. STOP OF MEASUREMENT....................................................................................................... 35 6.14. DELETING OF DISPLAYING DATA ....................................................................................... 36 6.15. CALCULATOR FUNCTION...................................................................................................... 36 6.16. REPORT EDITING ..................................................................................................................... 37 6.17. PRINTING OF THE RESULTS .................................................................................................. 38 -3- Lab Power software for Uvi Light & UVIKON PART III MEASURING METHOD 39 7. FLOW SHART .................................................................................................................................. 41 8. « FIXED WAVELENGTH » METHOD ......................................................................................... 43 8.1. CHOICE OF THE METHODE........................................................................................................ 43 8.2. CHOICE OF ACQUISITION PARAMETERS ............................................................................... 43 8.3. FILE OPENING............................................................................................................................... 44 8.4. CHOICE OF CALCULATION PARAMETERS ............................................................................ 44 8.4.1. Linear regression..................................................................................................................... 45 8.4.2. Quadratic regression ............................................................................................................... 45 8.4.3. Interpolation ............................................................................................................................ 46 8.4.4. Concentration .......................................................................................................................... 46 8.4.5. Functions ................................................................................................................................. 47 8.5. METHOD BACKUP ....................................................................................................................... 47 8.6. MEASUREMENT ►◄ .................................................................................................................. 48 8.7. RESULTS BACKUP ....................................................................................................................... 49 9. WAVELENGTH SCAN .................................................................................................................... 51 9.1. CHOICE OF THE METHOD .......................................................................................................... 51 9.2. CHOICE OF ACQUISITION PARAMETERS ............................................................................... 51 9.3. FILE OPENING............................................................................................................................... 52 9.4. CHOICE OF CALCULATION PARAMETERS ............................................................................ 52 9.4.1. Peak detection.......................................................................................................................... 53 9.4.2. Curve operations...................................................................................................................... 54 9.4.3. Functions ................................................................................................................................. 54 9.4.4. Derivative ................................................................................................................................ 55 9.4.5. Smoothing ................................................................................................................................ 55 9.5. METHOD BACKUP ....................................................................................................................... 56 9.6. MEASUREMENT ►◄ .................................................................................................................. 56 9.7. RESULTS BACKUP ....................................................................................................................... 57 9.8. CURVES OPERATIONS ................................................................................................................ 58 9.8.1. Curves merging........................................................................................................................ 58 9.8.2. Slitting of a multi curves files................................................................................................... 59 9.8.3. « Cursor » function .................................................................................................................. 60 9.8.4. « Zoom » function .................................................................................................................... 60 9.8.5. « Absorbance/Transmittance » function .................................................................................. 61 9.8.6. « Graphics/Table » function .................................................................................................... 61 9.8.7. « Display Scale » function ....................................................................................................... 62 9.8.7.1. 9.8.7.2. 9.8.7.3. 9.8.7.4. 9.8.8. 9.8.9. 9.8.10. 9.8.11. « Autorange » displaying..................................................................................................................... 62 « Y all Samples » displaying ............................................................................................................... 63 « X all Samples » displaying ............................................................................................................... 63 « Y variable » displaying ..................................................................................................................... 64 « Label » function .................................................................................................................... 65 « Heading » function................................................................................................................ 66 « Display Samples » function................................................................................................... 66 « Baseline range » function ..................................................................................................... 67 10. TIME DRIVE..................................................................................................................................... 69 10.1. CHOICE OF THE METHODE.................................................................................................... 69 10.2. CHOICE OF ACQUISITION PARAMETERS ........................................................................... 69 10.3. FILE OPENING........................................................................................................................... 70 10.4. CHOICE OF CALCULATION PARAMETERS......................................................................... 70 10.4.1. Peak detection.......................................................................................................................... 71 10.4.2. Curve operations...................................................................................................................... 71 10.4.3. Activity ..................................................................................................................................... 71 10.4.4. Functions ................................................................................................................................. 72 10.4.5. Derivative ................................................................................................................................ 72 10.4.6. Smoothing ................................................................................................................................ 72 10.5. METHOD BACKUP ................................................................................................................... 73 10.6. MEASUREMENT ►◄ .............................................................................................................. 73 -4- Lab Power software for Uvi Light & UVIKON 10.7. 10.8. RESULTS BACKUP ................................................................................................................... 74 CURVES OPERATIONS ............................................................................................................ 75 11. AUTO RATE ASSAY........................................................................................................................ 77 11.1. CHOICE OF THE METHODE .................................................................................................... 77 11.2. CHOICE OF ACQUISITION PARAMETERS ........................................................................... 77 11.3. FILE OPENING........................................................................................................................... 78 11.4. CHOICE OF CALCULATION PARAMETERS......................................................................... 78 11.4.1. Peak detection.......................................................................................................................... 79 11.4.2. Activity ..................................................................................................................................... 79 11.4.3. Functions ................................................................................................................................. 79 11.4.4. Derivative................................................................................................................................. 79 11.4.5. Smoothing ................................................................................................................................ 79 11.5. METHODE BACKUP ................................................................................................................. 80 11.6. MEASUREMENT ►◄ .............................................................................................................. 80 11.7. RESULTS BACKUP ................................................................................................................... 81 11.8. CURVES OPERATIONS ............................................................................................................ 82 12. WAVELENGTH PROGRAM .......................................................................................................... 83 12.1. CHOICE OF THE METHOD ...................................................................................................... 83 12.2. CHOICE OF ACQUISITION PARAMETERS ........................................................................... 83 12.3. FILE OPENING........................................................................................................................... 84 12.4. CHOICE OF CALCULATION PARAMETERS......................................................................... 84 12.4.1. Difference measurement .......................................................................................................... 85 12.4.2. Ratio measurement................................................................................................................... 87 12.4.3. Concentration measurement .................................................................................................... 87 12.4.4. Base point use .......................................................................................................................... 90 12.4.5. Functions use ........................................................................................................................... 90 12.5. METHOD BACKUP ................................................................................................................... 91 12.6. MEASUREMENT ►◄ .............................................................................................................. 91 12.7. RESULTS BACKUP ................................................................................................................... 93 13. CALIBRATION................................................................................................................................. 95 13.1. CALIBRATION IN FIXED WAVELENGTH ............................................................................ 95 13.1.1. Calibration curve ..................................................................................................................... 95 13.1.1.1. 13.1.1.2. 13.1.1.3. 13.1.1.4. 13.1.1.5. 13.1.1.6. 13.1.1.7. 13.1.1.8. 13.1.1.9. 13.1.1.10. 13.1.2. Unknown samples measurement ............................................................................................ 103 13.1.2.1. 13.1.2.2. 13.1.2.3. 13.1.2.4. 13.1.2.5. 13.1.2.6. 13.1.2.7. 13.1.2.8. 13.1.2.9. 13.1.2.10. 13.1.2.11. 13.1.2.12. 13.2. 13.3. Choice of the method.......................................................................................................................95 Choice of acquisition parameters.....................................................................................................95 File opening .....................................................................................................................................96 Choice of calculation parameters.....................................................................................................97 Choice of calculation mode .............................................................................................................97 Backup of the calibration method ....................................................................................................98 Standards measurement ►◄...........................................................................................................98 Displaying of calibration curve........................................................................................................99 Backup of the calibration curve .....................................................................................................100 Deleting of a value.........................................................................................................................101 Choice of the method.....................................................................................................................103 Choice of acquisition parameters...................................................................................................103 File opening ...................................................................................................................................103 Choice of calculation parameters...................................................................................................104 Method backup ..............................................................................................................................105 Samples measurement ►◄...........................................................................................................106 Calculation of the samples concentration ......................................................................................106 Results backup...............................................................................................................................106 Report setting up............................................................................................................................107 Report backup................................................................................................................................108 Printing ..........................................................................................................................................109 Summary of the backup files .........................................................................................................110 CALIBRATION IN TIME DRIVE ............................................................................................ 110 CALIBRATION IN AUTO RATE ASSAY............................................................................... 110 -5- Lab Power software for Uvi Light & UVIKON PART IV OPTIONS & ACCESSORIES 111 14. CELL CHANGER ►◄ .................................................................................................................. 113 14.1. « SPECIFIC COMMAND FOR UVI LIGHT » ......................................................................... 113 14.1.1. Installation............................................................................................................................. 113 14.1.2. Operating modes of the cell changer ..................................................................................... 113 14.1.3. Manual use............................................................................................................................. 114 14.1.4. Cell changer use inside the various measuring modes .......................................................... 114 14.1.4.1. 14.1.4.2. 14.1.4.3. 14.1.4.4. 14.1.4.5. Fixed wavelength .......................................................................................................................... 114 Wavelength scan ........................................................................................................................... 114 Time drive ..................................................................................................................................... 114 Auto rate assay .............................................................................................................................. 114 Wavelength program ..................................................................................................................... 115 14.2. « SPECIFIC COMMAND FOR UVIKON XL/XS » ................................................................. 115 14.2.1. Installation............................................................................................................................. 115 14.2.2. Activation............................................................................................................................... 115 14.2.3. Operating mode of cell changer............................................................................................. 115 14.2.3.1. 14.2.3.2. 14.2.3.3. 14.2.3.4. 14.2.3.5. 14.2.4. Sample Offsets .............................................................................................................................. 116 6 samples / 1 reference. ................................................................................................................. 116 6 samples / 6 references................................................................................................................. 117 10 samples / 2 references............................................................................................................... 118 Manual operation........................................................................................................................... 119 Cell changer use inside the various measuring modes .......................................................... 120 14.2.4.1. 14.2.4.2. 14.2.4.3. 14.2.4.4. 14.2.4.5. Auto rate assay .............................................................................................................................. 120 Fixed wavelength .......................................................................................................................... 120 Wavelength scan ........................................................................................................................... 120 Time drive ..................................................................................................................................... 120 Wavelength program ..................................................................................................................... 120 15. SIPPER ►◄ .................................................................................................................................... 121 15.1. « SPECIFIC COMMAND FOR UVI LIGHT » ......................................................................... 121 15.1.1. Sipper selection...................................................................................................................... 121 15.1.2. Sipper adjustment .................................................................................................................. 121 15.1.3. Sipper parameters.................................................................................................................. 122 15.1.4. Measurement.......................................................................................................................... 124 15.1.5. Backup of sipper parameters ................................................................................................. 124 15.2. « SPECIFIC COMMAND FOR UVIKON XL/XS » ................................................................. 124 15.2.1. Installation............................................................................................................................. 124 15.2.2. Parameters selection.............................................................................................................. 124 15.2.3. Function of sipper buttons ..................................................................................................... 125 16. STIRRER ►◄................................................................................................................................. 127 16.1. « SPECIFIC COMMAND FOR UVIKON XS/XL » ................................................................. 127 16.1.1. Installation............................................................................................................................. 127 16.1.2. Activation............................................................................................................................... 127 17. TEMPERATURE SENSOR ►◄................................................................................................... 129 17.1. « SPECIFIC COMMAND FOR UVIKON XS/XL » ................................................................ 129 17.1.1. Installation............................................................................................................................. 129 17.1.2. Activation............................................................................................................................... 129 18. THERMOSYSTEM ►◄................................................................................................................ 131 18.1. « SPECIFIC COMMAND FOR UVIKON XS/XL » ................................................................ 131 18.1.1. Activation............................................................................................................................... 131 18.1.2. THERMOSYSTEM displaying ............................................................................................... 132 18.1.3. « Remote control » or « local » mode.................................................................................... 132 18.1.4. THERMOSYSTEM functions ................................................................................................. 132 18.1.5. Alarms.................................................................................................................................... 133 19. THERMOPACK.............................................................................................................................. 135 -6- Lab Power software for Uvi Light & UVIKON 1. REMARKS The Automatic aspiration system kit is manufactured by SECOMAM. The information contained in this document may be the object of patents or patent applications by SECOMAM. The possession of this document does not confer any license to such patents. The following names are SECOMAM’s registered trademarks throughout the world. SECOMAM Lab Power Uvi Light UVIKON This manual is updated periodically. The updates are included in the new editions. All information supplied in this edition of the manual may be amended before the products described herein are available. All reproduction rights reserved. -7- Lab Power software for Uvi Light & UVIKON 2. WARRANTY The new equipment and material sold by SCHOTT INSTRUMENTS is guaranteed against any manufacturing defects for one year (unless otherwise stated by SCHOTT INSTRUMENTS) with effect: − From the technical acceptance of the equipment in the factory by the buyer or his designee, − or failing this : * For Metropolitan France: from the date on the delivery note. * For other destinations: from the date of factory shipment certified by air waybill, consignment note or bill of lading. The SCHOTT INSTRUMENTS company guarantee applies exclusively to defectiveness arising from a design fault or from a concealed defect. It is strictly limited to the free dispatching of replacement parts (except for consumable items) or to the repairing of the equipment in our workshops within a deadline of 10 working days (shipping delay not included). By express agreement, the following are strictly excluded from our guarantee: − All damages, notably for staff costs, loss of earnings, business trouble, etc − Any breakdown due to an incorrect use of the equipment (non adapted mains, fall, attempt at transformation, etc) or to a lack of maintenance by the user or to poor storage conditions. − Any breakdown due to the use of parts not supplied by SCHOTT INSTRUMENTS, on SCHOTT INSTRUMENTS equipment − Any breakdown due to the transporting of the equipment in packaging which is not its original packaging − The lamps, the cells and generally any item which appears in the "accessories" section on the price list. Our customers are kindly asked to apply for our consent before returning any instrument for repair. No return of materials may be accepted without the prior written consent of our Sales Management which will precise the terms of such return. If the above consent is given, articles shall be returned in their original packaging on a prepaid basis to the following address: SCHOTT INSTRUMENTS – Hattenbergstrass 10 – D 55122 Mainz We reserve the right to reship all instruments received collect failing such consent. Whatever method and conditions of transport are chosen for the shipment of the equipment to be repaired under guarantee, in the original packaging, the corresponding costs and the insurance costs will be payable by the customer. Any damage connected to the return transport of the equipment falls within the framework of the guarantee on the express condition that the customer has sent his complaint within forty-eight hours by registered letter with acknowledgement of receipt to the carrier. A copy of the letter should be sent to SCHOTT INSTRUMENTS. For equipment with a guaranty card, this is only applicable if the card delivered with the equipment is returned to SCHOTT INSTRUMENTS duly completed. -9- Lab Power software for Uvi Light & UVIKON SOFTWARE GUARANTEE The software is guaranteed by the designer or the distributor of the software under the conditions specified in the literature accompanying the aforementioned software packages. Under no circumstances whatsoever will SCHOTT INSTRUMENTS supply any type of guarantee for software packages. By express agreement, all damages, notably for staff costs, lost of earnings; business trouble, etc are strictly excluded from our guarantee. The customer is informed that the software cannot be guaranteed exempt from defects or bugs. TRADE SECRET AND PROPERTY RIGHTS This document is protected by a SECOMAM copyright (c) 2003 and the copying rights are explicitly reserved. The software supplied with the equipment or referenced contains trade secrets and confidential information which are SECOMAM's property. It is legally protected by the international copyright (c) laws. SCHOTT INSTRUMENTS grants a license to use its software to the user. This may not be disclosed, used or duplicated with the intention to save it, without SCHOTT INSTRUMENTS's written permission. The beneficiary must attach a copy of this document to all authorized partial or total reproductions. - 10 - Lab Power software for Uvi Light & UVIKON 3. INFORMATION The SCHOTT INSTRUMENTS equipment has been designed, manufactured, tested and inspected according to the ISO 9001 standards. If the unit is not immediately installed, it should be stored in a dry and clean area. The storage temperature should be between 10 and 35°C. SCHOTT INSTRUMENTS equipment is carefully inspected before it is packed. As soon as you receive your equipment, check the condition of the packaging and if you notice any problems, notify your carrier within 48 hours. Then consult the packing list and check that everything is in order. Finally, if you discover that something is missing, or if the goods are damaged immediately notify SCHOTT INSTRUMENTS. SCHOTT INSTRUMENTS Hattenbergstrasse 10 D 55122 Mainz Germany Tel: +49 6131 66 5111 Fax: +49 6131 66 5001 E-mail: [email protected] - 11 - Lab Power software for Uvi Light & UVIKON 4. HOW TO USE THE MANUAL This manual describes the operation of the Lab Power software applied to the Uvi Light XS, XT, XTD, PC spectrophotometers and to UVIKON XS/XL spectrophotometers. It is consisted of the following parts: PART I PART II PART III PART IV Startup - Software installation. - Spectrophotometers connections. - Startup. Common parts - Description of software general functions. Measuring methods - Analysis flow chart. - Description of different measuring modes Accessories - Options and accessories As these apparatuses are different from each other, they can comprise instructions of use different for each type of spectrophotometers. We thus wrote each paragraph in the following way: ¾ Paragraph name and number. If this paragraph is followed by characters ►◄, it is that it comprises particular instructions to one or more types of spectrophotometers. They are located at the end of the paragraph. In the absence of characters ►◄, the instruction described in the paragraph applies in the same way to all the types of spectrophotometers. ¾ A common part for all spectrophotometers. This part has not a specific name. ¾ A part (if necessary) comprising particular instructions to the spectrophotometers Uvi Light XS, XT, XTD, PC. The name of this part is : « Specific command for Uvi Light » ¾ A part (if necessary) comprising particular instructions to the spectrophotometers UVIKON XS. The name of this part is : « Specific command for UVIKON XS » ¾ A part (if necessary) comprising particular instructions to the spectrophotometers UVIKON XL. The name of this part is : « Specific command for UVIKON XL » ¾ A part (if necessary) comprising particular instructions to the spectrophotometers UVIKON XS and XL. The name of this part is : « Specific command for UVIKON XL/XS » - 13 - Lab Power software for Uvi Light & UVIKON PART I Startup - 15 - Lab Power software for Uvi Light & UVIKON 5. INSTRUCTIONS OF USE 5.1. MINIMUM CONFIGURATION RECOMMANDED - Compatible PC computer. - Free memory on the hard disk: 20 Mo minimum. - RAM memory: 256 Mo. - Minimum speed of the processor: 500 MHz. - 1 serial port (RS 232C DB9) or USB port. - Monitor resolution: min. 800 x 600 pixels The Lab Power software is compatible with the following Windows versions: Windows 2000, Windows NT and Windows XP. Windows XP is recommended. 5.2. SOFTWARE INSTALLATION FROM THE CD-ROM WARNING: At the time of the installation of the software, the operator will select a working language (French or English). Once the software is installed in this language, the operator will not be able, any more, to change it. A new installation of the software will be necessary to change the working language. - Insert the software CD-ROM in the CD-ROM reader. The installation of Lab Power starts automatically. - Follow the instructions displaying on the screen. The Lab Power software will settle automatically according to the version of installed Windows. When the installation is finished, an icon Lab Power is created on the desk of Windows. The Lab Power software is installed by default in the C:\SECOMAM directory. 5.3. SPECTROPHOTOMETERS CONNECTION ►◄ « Specific command for Uvi Light » - 17 - Lab Power software for Uvi Light & UVIKON 5.3.1. UVI LIGHT XS - Connect on the main, the power cable of Uvi Light XS - Connect the spectrophotometer to the computer through the RS232 cable. - Switch on the Uvi Light XS - Let run the autotest. - Enter in the « Configuration » sub menu. - Select “RS232” with left and right arrows of the keyboard - Press key « ENT » Uvi Light XS spectrophotometer is ready to communicate with the computer. - Run Lab Power software. It automatically detects the spectrophotometer. 5.3.2. UVI LIGHT PC - Connect on the main, the power cable of Uvi Light PC - Connect the spectrophotometer to the computer through the RS232 cable. The Uvi Light PC spectrophotometer is ready to communicate with the computer. - Run Lab Power software. - Switch on the spectrophotometer when the computer requests it. The software detects automatically the Uvi Light PC and runs the autotest. 5.3.3. UVI LIGHT XT AND XTDimension - Connect on the main, the power cable of Uvi Light XT or XTD - Remove cable between the spectrophotometer base and internal computer (inside the cover). - Connect the spectrophotometer base to the computer through the RS232 cable. The Uvi Light XT/XTD spectrophotometer is ready to communicate with the computer. - Run Lab Power software. A dialog box requests to switch the unit on. - Switch on the Uvi Light XT/XTD. - Press immediately “OK” in the software dialog box (There are around 5 seconds before the Uvi Light closes the communication port). The spectrophotometer is automatically detected and then starts its autotest. - 18 - Lab Power software for Uvi Light & UVIKON « Specific command for UVIKON XL/XS » 5.3.4. UVIKON XL/XS - Connect on the main, the power cable of UVIKON. - Connect the spectrophotometer to the computer through the RS232 cable. - Switch on the spectrophotometer. System failure Measure Halogen lamp Deuterium lamp Power on - Wait until the « Power on » light is flashing - Run Lab Power software. It detects automatically the UVIKON and starts the autotest. - 19 - Lab Power software for Uvi Light & UVIKON 5.4. INITIALIZATION 5.4.1. Starting According to the type of spectrophotometer, follow the procedure previously described. 5.4.2. System autotest and initialization During the autotest we can see the following picture. The autotest lasts approximately 2 minutes (max) and carries out following controls: • Data memory. • The switching on of the Tungsten halogen lamp. • The switching on of the Deuterium lamp. • Data transfer • Run of wavelength. When the unit is detected, the main window appears on the screen. A message on the bottom of the screen indicates the unit status. « Initialization » during autotest « Ready » when autotest is over. When the autotest is finished, the following window appears on the screen. - 20 - Lab Power software for Uvi Light & UVIKON 5.4.3. Stopping of the unit ►◄ « Specific command for Uvi Light » - Click on « File » and « Exit » or press ALT+F4. - Switch off the spectrophotometer. « Specific command for UVIKON XL/XS » - Click on the icon in the tools bar ((Top right of the screen). - Switch off the spectrophotometer. - Click on « File » and « Exit » or press ALT+F4. 5.4.4. Baseline ►◄ « Specific command for UVIKON XL/XS » Before all other operations, it is advised to make a base line - Click on the icon or enter in « Execute » and « Baseline ». The following window appears: - 21 - Lab Power software for Uvi Light & UVIKON - Select the wavelength range and the scan speed. - Click on « Close ». It displays: - Do not put anything inside the cell holder. The unit will do a baseline correction on the air - Click on « OK ». The spectrophotometer then executes the recording of the baseline with the selected parameters. - 22 - Lab Power software for Uvi Light & UVIKON PART II Common functions - 23 - Lab Power software for Uvi Light & UVIKON 6. GENERAL FUNCTIONS 6.1. DISPLAY SCREEN The screen display is identical in all the system methods and all the user’s methods. The screen is presented as follows: Title bar Contains the name of the currently open document. A document is a data file loaded or measured with any user or standard method. Menu bar Contains the list of the commands allowed for the currently open document. Commands which are not allowed are displayed in grey. Main Tool bar Displays the current method and the optional user method name. Contains buttons as shortcuts for different menu commands. Calculation Tool bar Displays the current calculation mode and contains shortcuts for menu commands regarding calculations. Parameter bar Displays the current acquisition parameters and the instant measure. - 25 - buttons as Lab Power software for Uvi Light & UVIKON Document windows Each measure employs a different child window that contains measured data in table or graph format. The format can be changed selecting the menu “View-Table” or “View-Graph” or clicking the corresponding button of the main tool bar. Status bar The status line always shows the current instrument status, error messages and a short help text. 6.2. CHOICE OF ACQUISITION PARAMETERS The way to reach the programming of acquisition parameters is identical whatever the method of measurement used. On the other hand the acquisition parameters, themselves, are specific to each method of measurement. Refer to each one of them for more explanations. To have access to these parameters acquisition, select “Parameters” and “Acquisition”. 6.3. CHOICE OF CALCULATION PARAMETERS The way to reach the programming of calculation parameters is identical whatever the method of measurement used. On the other hand the calculation parameters, themselves, are specific to each method of measurement. Refer to each one of them for more explanations. To have access to these parameters acquisition, select “Parameters” and “Calculation”. - 26 - Lab Power software for Uvi Light & UVIKON 6.4. CHOICE OF BASIC PARAMETERS - Select « Parameters » and « Basic… ». 6.4.1. « Optics » index ►◄ « Specific command for Uvi Light » The dialog box which displays the parameters appears: Lamp Change (290 – 400 nm): It is the wavelength of commutation between deuterium lamp and halogen lamp. All values between 290 and 400 nm are available (by default 338 nm). Bandwidth: Spectrophotometer bandwidth, expressed in nanometers. It is automatically detected by the software (2 or 5 nm) and can not be changed by the user. - 27 - Lab Power software for Uvi Light & UVIKON « Specific command for UVIKON XS » The dialog box which displays the parameters appears: Lamp Change (290 – 400 nm): It is the wavelength of commutation between deuterium lamp and halogen lamp. All values between 290 and 400 nm are available (by default 338 nm). Bandwidth: Spectrophotometer bandwidth, expressed in nanometers. It is automatically detected by the software (1,8 nm) and can not be changed by the user. Response Time It is the time between two data displaying on the screen. Filter Change Each one of these parameters preset a wavelengths range in which the user can change the point of commutation of the filters which cut the stray light. All the values can be selected between the limits. Under operation, the setting in position of the filters is automatic and transparent for the user. « Specific command for UVIKON XL » The dialog box which displays the parameters appears: - 28 - Lab Power software for Uvi Light & UVIKON Lamp Change (290 – 400 nm): It is the wavelength of commutation between deuterium lamp and halogen lamp. All values between 290 and 400 nm are available (by default 338 nm). Bandwidth: Spectrophotometer bandwidth, expressed in nanometers. It is, by default selected at 2 nm and can be change by the user. The following values are available: 0.2, 0.5, 1.0, 2.0, 4.0 nm Response Time It is the time between two data displaying on the screen. Filter Change Each one of these parameters preset a wavelengths range in which the user can change the point of commutation of the filters which cut the stray light. All the values can be selected between the limits. Under operation, the setting in position of the filters is automatic and transparent for the user. 6.4.2. « Automation » index Automatic Save: Save automatically the data, the methods or the calibrations in the repertories beforehand defined in “Utilities”, “Preferences” and “Directories”. AutomaticPrint: - 29 - Lab Power software for Uvi Light & UVIKON Print automatically the data selected in the index “Printout” when the user closes the active windows of results. 6.4.3. « Printout » index Orientation: Allow the way to print a graphic (Portrait or Landscape). Print Layout: Allows choosing which types of data will be printed Values: row data as absorbances. Parameters: the measurement parameters. Results: the calculation results as concentration, activity,… 6.5. CHOICE OF ACCESSORIES ►◄ « Specific command for Uvi Light » By choosing « Parameters » and « Cell Changer », the user can work with a cell changer. By choosing « Parameters » and « Sipper », the user can work with an aspiration system and select the aspiration parameters (See the use of this accessory at the end of this manual). By choosing « Parameters » and « Sample Changer », the user can work with an external sample changer. « Specific command for UVIKON XL/XS » By choosing « Parameters » and « Cell Changer », the user can work with a cell changer. (See the use of this accessory at the end of this manual). By choosing « Parameters » and « Stirrer », the user can work with a magnetic stirrer and select the rotation speed of the magnet (See the use of this accessory at the end of this manual). By choosing « Parameters » and « Sipper », the user can work with an aspiration system and select the aspiration parameters (See the use of this accessory at the end of this manual). By choosing « Parameters » and « Sample Changer », the user can work with an external sample changer. - 30 - Lab Power software for Uvi Light & UVIKON The operator can permanently display the temperature of a sample thanks to the use a miniaturized temperature sensor (See the use of this accessory at the end of this manual). By choosing « View », « Accessories » and « Thermosystem », the operator can use the accessory named THERMOSYSTEM. This accessory is composed with a Cell Changer which has its 12 positions (6 + 6) thermostated by Peltier effect and includes a magnetic stirrer with an external control box. 6.6. STARTING A MEASUREMENT To click on the icon or to do « Execute » and « Measure » allows running the measurement of one to ten samples, whatever the selected method. The acquisition parameters, the common parameters and the accessory parameters are used for the measurement. The measurement can cancel at every time by clicking on “Ctrl+Alt” or on the icon inside the main tools bar. All the measurements taken until this moment are valid and can be stored and used for secondary treatments. 6.7. DOING A CALCULATION To click on the icon or to do « Execute » and « Calculate » allows running a calculation on one to ten samples whatever the selected method. Only parameters from the calculation and display columns of acquisition parameters are used for the calculation. The calculation can be stopped at every time by clicking on “Ctrl+Alt” or on the icon main tools bar. of the NOTE: The calculation parameters remain active as long as the user does not have selected “Calc. Off” in the menu: That means that same calculation will be carried out with each time a measurement is made 6.8. DATA DISPLAYING This command is used to bring up to date the display of the principal window and the window of results on the screen. By clicking on « View » and « Graphics » or on the icon - 31 - , the graphic is displayed. Lab Power software for Uvi Light & UVIKON By clicking on « View » and « Table » or on the icon , the graphic values are displayed. 6.9. DATA BACKUP The measurement results can be saved on the hard disk by clicking on « File » and « Save » or by pressing « Ctrl+S » or by clicking on « File » then « Save as ». The following dialog box appears: Give a name to the file and click on « Save ». The file extension will depend of the used methods (Wavelength scan, Fixed wavelength,…). 6.10. DATA FILE OPENING If the principal page of a method is opened, and that the line of state indicates “Ready”, it is possible to open a data file safeguarded beforehand. Click on « File » then « Open » or press « Ctrl+O ». The following dialog box appears: - 32 - Lab Power software for Uvi Light & UVIKON The displayed list represents all data files made with the selected method. Select the file to open and click on « Open ». 6.11. DATA EXPORT 6.11.1. ASCII (*.asc) format The files stored on the disc can be converted in ASCII format. Many types of software (text processing, spreadsheets, data bases management, statistical programs) accept data with the ASCII format. - Choose “File”, “Export” and “ASCII… ”. - Choose the directory; give a name to the file and make “Save”. 6.11.2. EXCEL (*.xls) format The files stored on the disc can be converted in Excel® format (*.XLS) to be used by this spreadsheet. - Choose “File”, “Export” and “Excel… ”. - Choose the directory; give a name to the file and make “Save”. 6.11.3. « UV-PRO » format The spectra stored on the disc can be converted in “UV-PRO” format to be used by this software. - Choose “File”, “Export” and “UVPro… ”. - Choose the spectrum to be converted. - Choose a destination folder (by default « WORK ») with the icon directly his spectrum in the folder where is the UV-PRO software. - Click on « Select » to validate the destination folder. . The user can save - Enter the dilution ratio (1/1 = no dilution, 1/2 = 1 volume of sample for 2 total volumes) - Enter the optical path of the cuvette - Enter, if required, information concerning the sample. - Click on “OK”. The spectrum will be exported in the folder thus indicated with the extension (.scn). - 33 - Lab Power software for Uvi Light & UVIKON NOTE: the software adds in the name of the spectrum the suffix (UV-Pro) to avoid any confusion between a raw spectrum acquired by the software Lab Power and this same spectrum converted with the format UV-PRO and which could be possibly found in the same folder. It adds also a sequence number. The user can decide to export a file spectrum gathering several spectra (maximum 10). During conversion, the file is burst in several files (1 per spectrum contained in the origin file). Each new file represents a spectrum converted in UVPRO format. Example: The file “Test.scn” containing two spectra will become after export in UV-PRO format, a whole of two new files with the names of: « Test (UV-Pro) – 01.scn » « Test (UV-Pro) – 02.scn » NOTE: It is possible to export several curves in only one operation, one only needs, after having opened the repertory in which the spectra are, to select them by group with the key “Shift” or individually with the key “Ctrl”. Then enter, for each one of them, information with regard to them. NOTE: If the spectrum acquisition were made with a too small measurement step, it is possible that the number of measurement points, for a given wavelength range, is higher than 850 points. In this case the software displays the following error message: The user can either to use the algorithm proposed by the software in order to recompute the number of points or to make a new acquisition of the spectrum by reducing the number of measurement point or the wavelength range or both. 6.11.4. Bitmap (*.bmp) format The data files in graphic form can be transformed into bitmap files for Windows (*.BMP), for their use in text processing softwares of image processing software. - Choose “File”, “Export” and “Bitmap… ”. - Choose the directory; give a name to the file and make “Save”. 6.11.5. Towards clipboard The data in the form of graphs or of numerical values can be exported towards the clipboard of Windows to be immediately imported in another application by one « copy/paste » - Choose “File”, “Export” and “Clipboard… ”. - 34 - Lab Power software for Uvi Light & UVIKON 6.12. USER’S METHODS 6.12.1. Backup If a document is open in an unspecified method and that the status bar indicates “Ready”, all the parameters (Acquisition parameters, common parameters and accessory parameters) can be saved - Select “Methods” and “Save M… ”. The following dialog box appears: - Select the directory. - Give a name to the method - Click on « Save ». 6.12.2. Downloading A set of parameters (Acquisition, Calculation, Basic….) can be re-used if they are previously saved in a user method. To download a user method: - Click on « Methods » et « Load User Method » or click on the icon - Select the method and click on « Open ». The main tools bar displays the name of the user method in the display area located close to the icon. Following example: FIXED1 6.13. STOP OF MEASUREMENT - To stop the measurements, click on “Ctrl+Alt” or on the icon - 35 - Lab Power software for Uvi Light & UVIKON All the operations of acquisition, calculation, screen actualization, entry of parameter, loading, safeguard, conversion or impression will be stopped. The data measured up to this point are valid and can be stored and used for a later reprocessing. WARNING Leav e a method without saving the data does not allow finding them. A message informs of this situation. 6.14. DELETING OF DISPLAYING DATA - To erase the data displayed with the screen, click on “Execute” and “Clear Display”. If the data had not been previously saved, the user is informed by it by a warning message. 6.15. CALCULATOR FUNCTION The standard program “Calculator” of Windows can be carried out inside the main program by selecting the menu “Utilities” and « Calculator » or by clicking on the icon tools bar. - 36 - in the Calculation Lab Power software for Uvi Light & UVIKON 6.16. REPORT EDITING It is possible to create an ASCII file containing the results of measurements, as well as comments or any other information which the user will wish to add to it. This file could be imported by a text processing to generate a personalized report which will be able to also contain the graphs exported with format BMP. When all measurements, calculations etc are finished, open a new report by selecting “Report” and “New”. A window, presenting a new document, opens: A text can have entered a particular place by clicking on this place with the cursor. Thanks to the options below, the measured values, the computation results, the parameters can be inserted: Click on « Report », « Insert » and « Values » Insertion of the values measured in the form of table (in wavelength scan mode, this option is recommended only if the file contains only some lines). Click on « Report », « Insert » and « Parameters » Insertion of parameters in the report. Click on « Report », « Insert » and « Results » Insertion of the results in the form of table IMPORTANT A report can contain only alphanumeric information; if one wishes to add graphs to it, it is necessary to use an external text processing able to import text and files BMP (exported with the clipboard). To avoid any loss of information for a question of page-setting, click on “File” and “Print Preview”. - 37 - Lab Power software for Uvi Light & UVIKON 6.17. PRINTING OF THE RESULTS - Click on « File » and « Print… » or « Ctrl + P » to print data or results. The following dialog box will be open: - 38 - Lab Power software for Uvi Light & UVIKON PART III Measuring method - 39 - Lab Power software for Uvi Light & UVIKON 7. FLOW SHART Whatever is the method of measurement, the operations are always held in the same order. Refer to the flow chart below. START Choice of the measurement method Choice of the measurement parameters New file opening Choice of calculation parameters Method backup Sample measurement Possible calculation on the results Backup and printout of the results END - 41 - Lab Power software for Uvi Light & UVIKON 8. « FIXED WAVELENGTH » METHOD 8.1. CHOICE OF THE METHODE - Click on « Methods », « New Method » and « Fixed wavelength ». 8.2. CHOICE OF ACQUISITION PARAMETERS - Click on « Parameters » et « Acquisition ». The following dialog box appears: Wavelength: Choice of the measuring wavelength. Delay time: It is the time between the moment where the operator started measurement and the moment where the real measurement will be carried out... Average time: Defines the time (in second) used by the unit to gather the data and to calculate an average value on a reading. During measurements with strong absorbance, to reduce the noise, it is recommended to use a high value. Number of samples: Fix the number of samples to be measured per series. If a cell changer is used, the cuvettes are measured automatically. - 43 - Lab Power software for Uvi Light & UVIKON 8.3. FILE OPENING - Click on « File » et « New ». It displays: A default file will be open and its name will be « Fixed1 Measure » 8.4. CHOICE OF CALCULATION PARAMETERS - Click on « Parameters » and « Calculation ». Several types of calculation can be applied to the values of reading absorbance to calculate the concentrations. • • • • • Linear Regression. Quadratic regression. Linear Interpolation Concentration Functions. - 44 - Lab Power software for Uvi Light & UVIKON 8.4.1. Linear regression Calculation: Y = AX + B Y = Absorbance X = Concentration - Enter values of coefficients A and B if they are known or choose a calibration curve taking again this calculation by clicking on the button « Load » and by choosing the file comprising this curve. - Choose the units. - Click on « Close ». 8.4.2. Quadratic regression Calculation: Y = AX² + BX + C Y = Absorbance X = Concentration - Enter values of coefficients A, B and C if they are known or choose a calibration curve taking again this calculation by clicking on the button « Load » and by choosing the file comprising this curve. - Choose the units. - Click on « Close ». - 45 - Lab Power software for Uvi Light & UVIKON 8.4.3. Interpolation Choose a calibration curve taking again this calculation by clicking on the button “Load” and by choosing the file comprising this curve. - Choose the units. - Click on « Close ». 8.4.4. Concentration Calculation: CONCEch = ABSEch x Conc. Factor - Enter the concentration factor - Choose the units. - Click on « Close ». . - 46 - Lab Power software for Uvi Light & UVIKON 8.4.5. Functions Allow to add or to subtract a constant value from the absorbance values. Allow to multiply or to divide the absorbance values by a constant value. Allow to calculate the logarithm of the absorbance values. - Enter the function. - Enter the constant value - Click on “Close”. The calculation, selected in “Calculation Parameters”, will be executed on the absorbance values by clicking on “Execute” and “Calculate” or by pressing “F3” key or by clicking on the icon 8.5. METHOD BACKUP - Click on « Methods » and « Save method » or press « F4 » key. - Give a name to the method (i.e.: test04.pfx). - Click on « Save ». - 47 - Lab Power software for Uvi Light & UVIKON 8.6. MEASUREMENT ►◄ Measure made with a single cell holder. See chapter 14 to use a cell changer. Example: Samples measurement at 580 nm using a factor of 2.5. « Specific command for Uvi Light » - Insert the blank solution in the single cell holder. - Click on « Execute » and « AutoZero » or click on the icon - Insert the first sample. - Click on « Execute » and « Measure » or click on the icon - Insert samples one by one. « Specific command for UVIKON XL/XS » - Insert blank solution and sample in the respective place in the single cell holder. - Click on « Execute » and « Measure » or click on the icon - Insert samples one by one. It displays: In the left window, there are the absorbance raw values. In the right window, there are the concentration values (absorbance x factor, here 2.5) - 48 - Lab Power software for Uvi Light & UVIKON 8.7. RESULTS BACKUP - Click on « File » and « Save as… ». - Click on « Non » to save the measured values (here raw absorbance values) - Click on « Oui » to save the calculated values (here the concentrations). Example: « ABS.fix » for raw absorbance values. « Conc01.fix » for concentration values. - 49 - Lab Power software for Uvi Light & UVIKON 9. WAVELENGTH SCAN 9.1. CHOICE OF THE METHOD - Click on « Methods », « New method » and « Wavelength Scan ». 9.2. CHOICE OF ACQUISITION PARAMETERS - Click on « Parameters » et « Acquisition ». The following dialog box appears: : Lambda min Minimum wavelength of the wavelength range. Lambda max Maximum wavelength of the wavelength range. - 51 - Lab Power software for Uvi Light & UVIKON Data Interval It is the wavelength gap between two points of measurement. This gap is fixed for the spectrophotometers Uvi Light and UVIKON XS and adjustable for UVIKON XL. Scan speed It is the scrolling speed of the wavelength for the measurement. The proposed speeds (nm/min) are: 100, 200, 400, 600, 850, 1250, 1800, 2400. No of cycles It is the number of times that the measurement of spectrum will be repeated on the same sample (maximum 10). Cycle time It is the time of a cycle, expressed in minutes. This time includes time necessary to measurement. Number of samples: Fix the number of samples to be measured per series. If a cell changer is used, the cuvettes are measured automatically. 9.3. FILE OPENING - Click on « File » and « New ». It displays: A default file will be open and its name will be « WScan1 Measure » 9.4. CHOICE OF CALCULATION PARAMETERS - Click on « Parameters » and « Calculation ». - 52 - Lab Power software for Uvi Light & UVIKON Several types of calculation can be applied to the values of absorbance. • Peak Detection • Curve Operations • Functions • Derivative • Smoothing 9.4.1. Peak detection Peak Mode: Choose peaks and valleys detection in the same time or only peak or valleys detection. Peak Sensitivity: Choose the sensitivity threshold for the detection. Value between 0.0001 and 999.9. Absorbance/Transmission: Indicate on which type of curve the detection will be made (curved in absorbance or curve in transmission). Select the type of curve in agreement with the displayed curve. - 53 - Lab Power software for Uvi Light & UVIKON 9.4.2. Curve operations Allow to add, to subtract, to multiply or to divide all the curves displayed in the main window by another curve selected by the operator. - Select the curve which will be used for this operation by clicking on « Load ». - Select the type of operation (Multiplication, division, subtraction or addition). 9.4.3. Functions Allow to add or to subtract a constant value from the absorbance values (positive or negative shift of the curve). Allow to multiply or to divide the absorbance values by a constant value (increasing or decreasing of the curve). Allow to calculate the logarithm of the absorbance values. Thus allow to increase peaks with low amplitude. - Enter the function. - Enter the constant value - Click on “Close”. - 54 - Lab Power software for Uvi Light & UVIKON 9.4.4. Derivative Calculate directly the 1 to 4 order derivative. Derivative Order: Enter the derivative order (from 1 to 4). Derivative Normalization: Allows aligning the largest peak of derivative on the largest peak of the original curve. Smoothing Level: Allow to smooth, plus or minus, the derivative curve. Three smoothing algorithms are available: Low, medium and high. 9.4.5. Smoothing Allow to smooth, plus or minus, the curve. Three smoothing algorithms are available: Low, medium and high. The calculation, selected in “Calculation Parameters”, will be executed on the curves by clicking on “Execute” and “Calculate” or by pressing “F3” key or by clicking on the icon - 55 - Lab Power software for Uvi Light & UVIKON 9.5. METHOD BACKUP - Click on « Methods » and « Save method » or press « F4 » key. - Give a name to the method (i.e.: test11.psc). - Click on « Save ». 9.6. MEASUREMENT ►◄ Measure made with a single cell holder. See chapter 14 to use a cell changer. Example: Sample spectrum acquisition between 400 and 600 nm. « Specific command for Uvi Light » - Insert the blank solution in the single cell holder. - Click on « Execute » and « Baseline... » or click on the icon - Insert the sample. - Click on « Execute » and « Measure » or click on the icon - Measure samples one by one. « Specific command for UVIKON XL/XS » - Insert blank solution and sample in the respective place in the single cell holder. - Click on « Execute » and « Measure » or click on the icon - Insert samples one by one. It displays: - 56 - Lab Power software for Uvi Light & UVIKON IMPORTANT: Not to forget, in single cell mode, to immediately save the curve before launching following measurement. If the curve is not saved, the new curves will take its place. If the user saves the previous curve, it is the new curve which will not be maintained in memory. 9.7. RESULTS BACKUP - Click on « File » and « Save as… ». - Give a name to the curve (i.e.: Curve01.scn) - Click on « Save » to save the curve. - 57 - Lab Power software for Uvi Light & UVIKON 9.8. CURVES OPERATIONS 9.8.1. Curves merging It is possible to merge curves with other previously saved. - Click on « Open » to download the first curve. - Click on « File » and « Merge… » or click on the icon The following dialog box appears: It is the curves list of wavelength scan method. - Select the curve to merge. - Click on « Open » If the selected file includes only one curve, the following dialog box appears: - Give, to the curve, a different number from that of the already displayed curve. NOTE: It is possible to select several curves to merge by selecting all the files (mouse left click + Shift) or one by one (mouse left click + Ctrl). Enter a different number for each curve. - 58 - Lab Power software for Uvi Light & UVIKON If the selected file includes several curves, the following dialog box appears: - Select one or several curves to merge with the one on the screen. - Give, to the curve, a different number from that of the already displayed curve. - Click on « OK ». 9.8.2. Slitting of a multi curves files The multi-curves files, acquired in particular during the use of a cell changer, can be separate in individual single curve files. This separation is made automatically when the user saves his multi-curves file with the menu “Save as… ”. The software creates a directory with the name of the multi-curves file follow-up of the mention (splitted). Inside this repertory, are saved individually the curves, each one with the name multi-curves file incremented with an index. Example: WORK └ TESTW01 └ TESTW01 – 01.scn └ TESTW02 – 02.scn The operation proceeds in the same way when the user wants to split a multi-curves file already saved. In this case, proceed in the following way: - Open the multi-curves file - 59 - Lab Power software for Uvi Light & UVIKON - Select « File », « Split » or click on the icon - Select the main directory where the curves will be saved. - Click on « Select ». The software creates a secondary directory bearing the name of the multi-curves file followed by the mention (splitted). Inside this directory, the curves are saved individually bearing each one the multi-curves name incremented of an index. 9.8.3. « Cursor » function The “Cursor” function is used to pick up quickly the values on a curve displayed on the screen. When a measurement result is displayed on the screen like a curve, select « View » and « Cursor ». Move the cursor on the screen (it has the shape of cross) and click on the mouse left button when it is placed at the place of the curve which one wants to know the value. It is also possible to use the arrows of the keyboard. The values for all the curves appear in a box, associated with the color with the curves; on the graph, a vertical line materializes the movements of the mouse. The text, in the window associated with the graph indicates the position of the cursor (X =) and the value of the curve to this point (Y1 =). One can leave the mode cursor while again selecting “View” and “Cursor” or more simply by pressing the key “Esc” or the right-hand side button of the mouse... 9.8.4. « Zoom » function The function “Zoom” is used to increase a particular zone of a graph. - Select « View » and « Zoom » or click on the icon . - Move the cursor on the graph and place it on the left upper corner of the zone to be increase. - Press the mouse left button and move it without release the button. One sees a rectangle moving on the screen which represents the area which will be increased. - Reach the right lower corner of the desired area and release the button. Selected surface is increased to occupy the entire graphic zone. - 60 - Lab Power software for Uvi Light & UVIKON The “Zoom” function can be repeated by selecting a new zone until obtaining the maximum resolution. - Select “View” and “Full View” or press on the “Esc” key to cancel the zoom effect. NOTE: It is also possible to cancel the zoom effect while clicking on the icon clicking on the mouse right button. or by 9.8.5. « Absorbance/Transmittance » function This function allows having the curve displayed in absorbance or in transmittance Displayed in absorbance mode: - Select « View°» and « Absorbance ». Displayed in transmittance mode: - Select « View » and « Transmittance ». 9.8.6. « Graphics/Table » function This function makes it possible to display either the spectral curve, or the table of the values which were used to make this curve. - 61 - Lab Power software for Uvi Light & UVIKON Displaying of the curve: - Select « View » and « Graphics » or click on the icon . Displaying of the values table: - Select « View » and « Table » or click on the icon , Example: 9.8.7. « Display Scale » function This function allows modifying the curves scales displayed in the main window... - Select « View » and « Display Scale… ». 9.8.7.1. « Autorange » displaying The software chooses automatic the scales of axes X and Y in such way that all the curves hold in the principal window. The scales correspond roughly to the largest curve. - 62 - Lab Power software for Uvi Light & UVIKON Example of displaying « Autorange »: 9.8.7.2. « Y all Samples » displaying Allows the user to redefine the scale of the axis Y (Ordered) of all the curves displayed in the main window. Example of displaying « Y all Samples » with Y Low 0 Abs and Y High 2.0 Abs: 9.8.7.3. « X all Samples » displaying Allows the user to redefine the scale of the axis X (Abscissa) of all the curves displayed in the main window. - 63 - Lab Power software for Uvi Light & UVIKON Example of displaying « X all Samples » with X Low 400 nm and X High 500 nm: 9.8.7.4. « Y variable » displaying Allows the user independently to define, for each displayed curve, the Y axis scale. - Click on « Set… ». It displays: - Deselect the box « Auto » of curves which one wants to change the Y scale. - Enter for each curve « Y mini » and « Y maxi ». - 64 - Lab Power software for Uvi Light & UVIKON NOTE: It is possible to let the software choose the minimum or the maximum value of the Y scale for each selected curve. The operator selects, at this time, the corresponding box “Auto”. Example of displaying « Y Variable » with: Sample 1: « Y min » = 0 and « Y max » = 2.5 Sample 2: « Y min » = -0.5 and « Y max » = +0.5 9.8.8. « Label » function It is possible to add a comment to any place of a graph to describe the experiment. - Select « View », « Label » and « Add… » when the curve is displaying. The following dialog box appears: Enter the text made up of alphanumeric characters and click on “OK”. A rectangle defining dimensions of the entered text will appear on the graph and will follow displacements of the cursor. Position it at the desired place and press the mouse left button. If the rectangle is entirely contained in the graphic zone, the entered text will be displayed. - 65 - Lab Power software for Uvi Light & UVIKON To delete a comment, click twice on the comment zone with the mouse left button. A rectangle surrounding the comment zone will appear. - Select « View », « Label » and « Clear » to delete the comment. All comments can be deleted by selection « View », « Label » and « Clear All » The added comments are saved with the data file and so can be called back with data. 9.8.9. « Heading » function This function makes it possible to add a heading during the impression of the curve. - Select « View » and « Heading… ». It displays: - Enter the heading and click on « OK ». During the curve printing, the heading will appear on the left top of the page (See below). 9.8.10. « Display Samples » function Allows selecting, when there are several curves on the screen, those which will remain displayed - Select « View » and « Display Samples… ». It displays: - 66 - Lab Power software for Uvi Light & UVIKON - Select the samples will appear on the screen... 9.8.11. « Baseline range » function This function makes it possible the operator to know on which wavelength range the last baseline was made. - Select « View » and « Baseline range… ». It displays: The operator knows that the last baseline was made between 400 nm and 500 nm. - 67 - Lab Power software for Uvi Light & UVIKON 10. TIME DRIVE 10.1. CHOICE OF THE METHODE - Click on « Methods », « New method » and « Time Drive ». 10.2. CHOICE OF ACQUISITION PARAMETERS - Click on « Parameters » et « Acquisition ». The following dialog box appears: Wavelength: Choice of the measuring wavelength. Sampling Rate Fix the number of points measured per minute. High frequencies of acquisition can be used only for short measurements, for example fast reactions where a high resolution is necessary. In other hand, use low frequencies for long durations of measurement what will reduce the noise and the treatment duration. - 69 - Lab Power software for Uvi Light & UVIKON Delay It is the time between the moment where the operator started measurement and the moment where the real measurement will be carried out. Measure time It is the total duration of measurement (in minute). If the time of measurement must be raised, it will be advisable to reduce beforehand the sampling rate before being able to enter the total time of measurement. Number of samples: Fix the number of samples to be measured per series. If a cell changer is used, the cuvettes are measured automatically. 10.3. FILE OPENING - Click on « File » et « New ». It displays: A default file will be open and its name will be « TDRIV1 Measure » 10.4. CHOICE OF CALCULATION PARAMETERS - Click on « Parameters » and « Calculation ». - 70 - Lab Power software for Uvi Light & UVIKON Several types of calculation can be applied to the values of reading absorbance to calculate the concentrations. • Peak Detection. • Curve Operations • Activity • Functions • Derivative • Smoothing 10.4.1. Peak detection See the same function in chapter « WAVELENGTH SCAN » paragraph 9.4.1 10.4.2. Curve operations See the same function in chapter « WAVELENGTH SCAN » paragraph 9.4.2 10.4.3. Activity This function allows calculating an enzymatic activity using the linear regression method. Activity = Slope of the regression line calculated for one minute x Factor - 71 - Lab Power software for Uvi Light & UVIKON Load: Allows using a reference data file. It is always a file of calibration which was created by using the program “Calibration”. These data of calibration automatically define the factor, the units and the value of the blank. Factor: The activity is calculated by multiplying the slope of the linear regression line (in delta of absorbance per minute) by the factor (F). BlanK: The blank value is always subtracted from the sample reaction. It can be enter manually or defined by the data of reference file. Units: The selected activity units appear with the activity results when they are printed. 1 katal (kat) = 1 mol/s 1 U = 1 µmol/min = 16.7 nkat = 16.7 nmol/s Calculation Range: Click on “Set…”. It is possible to exclude from calculation part of the gathered data. These points are not to erase but simply hidden. 10.4.4. Functions See the same function in chapter « WAVELENGTH SCAN » paragraph 9.4.3 10.4.5. Derivative See the same function in chapter « WAVELENGTH SCAN » paragraph 9.4.4 10.4.6. Smoothing See the same function in chapter « WAVELENGTH SCAN » paragraph Fehler! Verweisquelle konnte nicht gefunden werden. The calculation selected in « Calculation Parameters » will be executed on curves by selecting « Execute » and « Calculate », by pressing « F3 » key or by clicking on the icon - 72 - Lab Power software for Uvi Light & UVIKON 10.5. METHOD BACKUP - Click on « Methods » and « Save method » or press « F4 » key. - Give a name to the method (i.e.: TDRIV.ptm). - Click on “Save”. 10.6. MEASUREMENT ►◄ Measure made with a single cell holder. See chapter 14 to use a cell changer. Example: Measure of the activity at 500 nm during 1 mn. « Specific command for Uvi Light » - Insert the blank solution in the single cell holder. - Click on « Execute » and « Autozero » or click on the icon - Insert the sample. - Click on « Execute » and « Measure » or click on the icon - Measure samples one by one. « Specific command for UVIKON XL/XS » - Insert blank solution and sample in the respective place in the single cell holder. - 73 - Lab Power software for Uvi Light & UVIKON - Click on « Execute » and « Measure » or click on the icon - Insert samples one by one. It displays: On the left of the screen is displayed, the curve of the reaction with the linear regression line. On the right of the screen are displayed, the number of the sample, the activity (slope of the straight regression line multiplied by the factor), the standard deviation and the determination coefficient. 10.7. RESULTS BACKUP - Click on « File » and « Save as… ». - Click on « Non » to save the measured values (here the curve) - Click on « Oui » to save the calculated values (here the results: the activity,…). Example: « Curve.tim » » for raw absorbance values versus time. « Results.tim » for the results (activity, standard deviation,….) - 74 - Lab Power software for Uvi Light & UVIKON 10.8. CURVES OPERATIONS The following functions: - Curves merging. - Splitting of a multi-curves file in individual files. - « Cursor » function. - « Zoom » function. - « Absorbance/Transmittance » function. - « Graphic/Table » function. - « Display Scale » function. - « Label » function. - « Heading » function. - « Display samples » function. are identical to those of « Wavelength Scan » mode. See paragraph 9.8 page 58 - 75 - Lab Power software for Uvi Light & UVIKON 11. AUTO RATE ASSAY 11.1. CHOICE OF THE METHODE - Click on « Methods », « New method » and « Autorate Assay ». 11.2. CHOICE OF ACQUISITION PARAMETERS - Click on « Parameters » et « Acquisition ». The following dialog box appears: Wavelength: Choice of the measuring wavelength. Delay time It is the time between the moment where the operator started measurement and the moment where the real measurement will be carried out. Defines the time (in second) used by the unit to gather the data and to calculate an average value on a reading. During Average time: - 77 - Lab Power software for Uvi Light & UVIKON measurements with strong absorbance, to reduce the noise, it is recommended to use a high value. No of Readings It is the number of reading between the beginning and the end of measurement... Reading interval It is time between two consecutive readings on the same sample. Number of samples: Fix the number of samples to be measured per series. If a cell changer is used, the cuvettes are measured automatically. 11.3. FILE OPENING - Click on « File » et « New ». It displays: A default file will be open and its name will be « ARATE1 Measure » 11.4. CHOICE OF CALCULATION PARAMETERS - Click on « Parameters » and « Calculation ». - 78 - Lab Power software for Uvi Light & UVIKON Several types of calculation can be applied to the values of reading absorbance to calculate the concentrations. • Peak Detection. • Activity • Functions • Derivative • Smoothing 11.4.1. Peak detection See the same function in chapter « WAVELENGTH SCAN » paragraph 9.4.1 11.4.2. Activity See the same function in chapter « TIME DRIVE » paragraph 10.4.3 11.4.3. Functions See the same function in chapter « WAVELENGTH SCAN » paragraph 9.4.3 11.4.4. Derivative See the same function in chapter « WAVELENGTH SCAN » paragraph 9.4.4 11.4.5. Smoothing See the same function in chapter « WAVELENGTH SCAN » paragraph Fehler! Verweisquelle konnte nicht gefunden werden. The calculation selected in « Calculation Parameters » will be executed on curves by selecting « Execute » and « Calculate », by pressing « F3 » key or by clicking on the icon - 79 - Lab Power software for Uvi Light & UVIKON 11.5. METHODE BACKUP - Click on « Methods » and « Save method » or press « F4 » key. - Give a name to the method (i.e.: Testcine02.pat). - Click on “Save”. 11.6. MEASUREMENT ►◄ Measure made with a single cell holder. See chapter 14 to use a cell changer. Example: Measure of the activity at 500 nm during 1 mn. « Specific command for Uvi Light » - Insert the blank solution in the single cell holder. - Click on « Execute » and « Autozero » or click on the icon - Insert the sample. - Click on « Execute » and « Measure » or click on the icon - Measure samples one by one. « Specific command for UVIKON XL/XS » - Insert blank solution and sample in the respective place in the single cell holder. - 80 - Lab Power software for Uvi Light & UVIKON - Click on « Execute » and « Measure » or click on the icon - Insert samples one by one. It displays: On the left of the screen is displayed, the curve of the reaction with the linear regression line. On the right of the screen are displayed, the number of the sample, the activity (slope of the straight regression line multiplied by the factor), the standard deviation and the determination coefficient. 11.7. RESULTS BACKUP - Click on « File » and « Save as… ». - Click on « Non » to save the measured values (here the curve) - Click on « Oui » to save the calculated values (here the results: the activity,…). Example: « Curve.aut » for raw absorbance values versus time. « Results.aut » for the results (activity, standard deviation,…). - 81 - Lab Power software for Uvi Light & UVIKON 11.8. CURVES OPERATIONS The following functions: - Curves merging. - Splitting of a multi-curves file in individual files. - « Cursor » function. - « Zoom » function. - « Absorbance/Transmittance » function. - « Graphic/Table » function. - « Display Scale » function. - « Label » function. - « Heading » function. - « Display samples » function. are identical to those of « Wavelength Scan » mode. See paragraph 9.8 page 58 - 82 - Lab Power software for Uvi Light & UVIKON 12. WAVELENGTH PROGRAM WARNING Always save the data AND the methods in mode “Wavelength Program”. The beforehand saved data could be reloaded only if the wavelengths of the file and the current wavelengths are identical. 12.1. CHOICE OF THE METHOD - Click on « Methods », « New method » and « Wavelength Program ». 12.2. CHOICE OF ACQUISITION PARAMETERS - Click on « Parameters » et « Acquisition ». The following dialog box appears: No of wavelength Number of measuring wavelength (max 14). - 83 - Lab Power software for Uvi Light & UVIKON Wavelength values Click on « Set ». Enter the wavelengths values. Delay time: It is the time between the moment where the operator started measurement and the moment where the real measurement will be carried out... Average time: Defines the time (in second) used by the unit to gather the data and to calculate an average value on a reading. During measurements with strong absorbance, to reduce the noise, it is recommended to use a high value. No of cycles It is the number of times that the measurement of spectrum will be repeated on the same sample (maximum 10). Cycle time It is the time of a cycle, expressed in minutes. This time includes time necessary to measurement. Number of samples: Fix the number of samples to be measured per series. If a cell changer is used, the cuvettes are measured automatically. 12.3. FILE OPENING - Click on « File » and « New ». It displays: A default file will be open and its name will be « WPROG1 Measure » 12.4. CHOICE OF CALCULATION PARAMETERS - Click on « Parameters » and « Calculation ». - 84 - Lab Power software for Uvi Light & UVIKON Wavelength Function: Allows doing three types of calculation. Difference (Abs1-Abs2) Ratio (Abs1/Abs2) Concentration [ (Abs1 x Factor 1)- (Abs2 x Factor 2) on pairs of wavelengths WL1, WL2 WL2, WL3 14 Wavelengths maximum. No of Calculations: Enter the number of wavelengths pairs to execute a type of calculation (5 pairs maximum). WL Pairs: Allows defining the wavelengths pairs. Example: 3 WL pairs for a difference calculation. WL1-WL2 WL1-WL3 WL2-WL3 WL Factors: Allows defining a multiplicative factor for each WL and each pair during a concentration calculation. 12.4.1. Difference measurement Example: 3 wavelengths WL1 = 405 nm, WL2 = 360 nm, WL3 = 340 nm Calculation: WL1-WL2 and WL1- WL3 - Enter 3 in « No of wavelength ». - Select « Parameters », « Acquisition » and « Set ». - Enter the wavelength as follows: - 85 - Lab Power software for Uvi Light & UVIKON - Select « Parameters » and « Calculation ». - Select « Difference » for « Function » - Enter 2 for « No of Calculation » - Click on « WL Pairs » - 86 - Lab Power software for Uvi Light & UVIKON - Enter a number (here between 1 and 3) which corresponds to the order of WL choice. NOTE: - To remember the choice order of the WL, click on “View Wavelengths”. - The wavelength corresponding to the number of choice will appear only once the user validated his choice by “OK” - Run the measurement. The results will be displayed as below 12.4.2. Ratio measurement The measurement progress of ratio is made in the same way that the difference measurement. - Select « Ratio » in place of « Difference » for « Function » 12.4.3. Concentration measurement Example: 3 wavelength WL1 = 405 nm, WL2 = 360 nm and WL3 = 340 nm, Calculation: (2,4xWL1)-(0,5xWL2) and (2,4xWL1)-(0,34xWL3) - Enter 3 in « No of wavelength ». - Select « Parameters », « Acquisition » and « Set ». - Enter the wavelength as follows: - 87 - Lab Power software for Uvi Light & UVIKON - Select « Parameters » and « Calculation ». - Select « Concentration » for « Function » - Enter 2 for « No of Calculation » - Click on « WL Pairs » - 88 - Lab Power software for Uvi Light & UVIKON - Enter a number (here between 1 and 3) which corresponds to the order of WL choice. - Validate. - Click on « Wavelength Factors » - Enter the factors and validate. - Valid the whole of parameters. - Run the measurement. - The results will be displayed as follows : - 89 - Lab Power software for Uvi Light & UVIKON 12.4.4. Base point use Allows cutting off, from the read values, data put beforehand in memory in a file and this before carrying out programmed calculation. WARNING : The stored data must relate on the same wavelengths number and on the same wavelengths 12.4.5. Functions use Allows adding or subtracting a constant from the values of absorbance before programmed calculation is carried out. Allows multiplying or dividing the values of absorbance by a constant before programmed calculation is carried out. Calculate the logarithm of the measured values of absorbance before calculation is carried out. - Enter the function. - Enter the constant - Click on “Close”. - 90 - Lab Power software for Uvi Light & UVIKON 12.5. METHOD BACKUP - Click on « Methods » and « Save method » or press « F4 » key. - Give a name to the method.(i.e.: Difference.plp). - Click on “Save”. 12.6. MEASUREMENT ►◄ Example : Difference measurement between 2 absorbances read at two different wavelengths (Abs405nm – Abs360nm) « Specific command for Uvi Light » - Click on « Execute » and « Measure » or click on the icon It displays: - 91 - Lab Power software for Uvi Light & UVIKON - Insert the reference and click on « OK ». - Then, insert the sample and click on « OK ». - Measure samples one by one. « Specific command for UVIKON XL/XS » - Insert blank solution and sample in the respective place in the single cell holder. - Click on « Execute » and « Measure » or click on the icon - Insert samples one by one. It displays: On the left are displayed the absorbances read against the reference at the 2 different wavelengths. On the right, the calculation results are displayed. - 92 - Lab Power software for Uvi Light & UVIKON 12.7. RESULTS BACKUP - Click on « File » and « Save as… ». - Click on « Non » to save the measured values (here the absorbances) - Click on « Oui » to save the calculated values (here the results: the difference of the 2 absorbances read at 2 different wavelengths). Example : « Test101.lpg » for raw absorbance values read against the reference. « Results.lpg » for the calculation results. - 93 - Lab Power software for Uvi Light & UVIKON 13. CALIBRATION 13.1. CALIBRATION IN FIXED WAVELENGTH Example: Development of a calibration curve and measurement of an unknown sample. 13.1.1. Calibration curve 13.1.1.1. Choice of the method - Click on « Methods », « New Method », « Calibration » and « Fixed wavelength ». 13.1.1.2. Choice of acquisition parameters - Click on « Parameters » et « Acquisition ». The following dialog box appears : - 95 - Lab Power software for Uvi Light & UVIKON Wavelength: Choice of the measuring wavelength. Delay time: It is the time between the moment where the operator started measurement and the moment where the real measurement will be carried out.. Average time: Defines the time (in second) used by the unit to gather the data and to calculate an average value on a reading. During measurements with strong absorbance, to reduce the noise, it is recommended to use a high value. Number of samples: Fix the number of samples to be measured per series. If a cell changer is used, the cuvettes are measured automatically. 13.1.1.3. File opening - Click on « File » et « New ». It displays: A default file will be open and its name will be « FWSTD1 Calibration data » - 96 - Lab Power software for Uvi Light & UVIKON 13.1.1.4. Choice of calculation parameters The choice of calculation parameters is initially limited to enter the values of standards concentration. - Select « Parameters » and « Calculation » or « File » and « Edit Standards » - Enter standards values. - Click on « Close ». 13.1.1.5. Choice of calculation mode - Select a calculation mode for the curve « Linear regression, quadratic regression or interpolation ». - 97 - Lab Power software for Uvi Light & UVIKON 13.1.1.6. Backup of the calibration method - Click on « Methods » and « Save method » or press « F4 » key. - Save method parameters (i.e.: CALIB01.pcf) 13.1.1.7. Standards measurement ►◄ Measure made with a single cell holder. See chapter 14 to use a cell changer. « Specific command for Uvi Light » - Verify that the single cell is empty. - Click on « Execute » and « Autozero » or click on the icon - Insert the first standard. - Run the standard measurement by selecting « Execute » et « Measure » or by clicking on the icon . - Renew the operation to measure the other standards. « Specific command for UVIKON XL/XS » - Insert blank solution and standard in the respective place in the single cell holder. - 98 - Lab Power software for Uvi Light & UVIKON - Click on « Execute » and « Measure » or click on the icon - Renew the operation to measure the other standards. - Run the calculation of the calibration curve by selecting « Execute » and « Calculation » or by clicking on the icon . Once calculation carried out, following information is displayed: - the measuring wavelength. - the concentration factor. - the A and B factors of linear regression line (Ax + B). - the A, B, C factors of the quadratic regression curve (Ax² + Bx + C). 13.1.1.8. Displaying of calibration curve - Displayed the curve by selecting « View », « Graphic » or by clicking on - 99 - . Lab Power software for Uvi Light & UVIKON - To change the calibration curve, select another type of calculation then select « Execute » and « Calculate » or click on the icon . - i.e.: Quadratic regression. - To come back to the values table, select « View » and « Table » or click on 13.1.1.9. Backup of the calibration curve To save the calibration curve, select « File » and « Save as… » - Save the calibration curve (i.e.: CALIB01.con) - 100 - . Lab Power software for Uvi Light & UVIKON 13.1.1.10. Deleting of a value If a point were badly measured, it is possible to erase it and to measure it again. This is available for several points. For this operation, proceed in the following way: - Select « File » and « Edit Standards ». - Select the standard to be measure again and click on « Delete line » (i.e.: Standard 3). - 101 - Lab Power software for Uvi Light & UVIKON - Re-register the concentration of the standard which one has just removed, under the concentration of the last standard, in the column « Nominal ». - Click on “Close” The curve is redrawn by taking account of the standard which was removed. - Check if 0,000 Abs is always displayed on the screen, if not do again the zero (Uvi Light spectrophotometer). - Insert, in single cell holder, the standard to be measured again. - Run the standard measurement. - Display again the curve by selecting « View » and « Graphic » or by clicking on - 102 - .. Lab Power software for Uvi Light & UVIKON - This one takes account of the new measured value of the standard. - Select « File » and « Save as… » to save the new calibration curve. 13.1.2. Unknown samples measurement 13.1.2.1. Choice of the method - Select « Methods », « New Method » and « Fixed Wavelength ». 13.1.2.2. Choice of acquisition parameters - Select « Parameters » and « Acquisition ». - Enter same parameters as for the calibration curve. - Click on « Close ». 13.1.2.3. File opening - Select « File » and « New ». - 103 - Lab Power software for Uvi Light & UVIKON 13.1.2.4. Choice of calculation parameters - Select « Parameters » and « Calculation ». - Select the type of calibration curve (i.e. : Linear Regression). - Click on « Load ». - Select the calibration curve previously carried out (i.e.: CALIB01.con) - Click on « Open » - 104 - Lab Power software for Uvi Light & UVIKON - Curve parameters are displayed in windows labeled « coefficient A » and « coefficient B ». - Select the units. - Click on « Close ». 13.1.2.5. Method backup - Select « Methods» and « Save Method ». - Save the method (i.e.: CALIB01.pfx) - 105 - Lab Power software for Uvi Light & UVIKON 13.1.2.6. Samples measurement ►◄ Measure made with a single cell holder. See chapter 14 to use a cell changer. « Specific command for Uvi Light » - Insert the blank solution in the single cell holder. - Click on « Execute » and « AutoZero » or click on the icon - Insert the first sample. - Click on « Execute » and « Measure » or click on the icon - Insert samples one by one. « Specific command for UVIKON XL/XS » - Insert blank solution and sample in the respective place in the single cell holder. - Click on « Execute » and « Measure » or click on the icon - Insert samples one by one. It displays: - Measure the samples. 13.1.2.7. Calculation of the samples concentration - Select « Execute » and « Calculate » or click on the icon - It displays the concentration values of the measured samples. 13.1.2.8. Results backup - Select « File », « Save as… » - 106 - . Lab Power software for Uvi Light & UVIKON - Click on « Oui » to save the calculated values (Samples concentration). - Give a name to the file (i.e.: CALIB01.fix) and click on « Save » - Click on « NON » to save the measured values (Samples absorbance). - Give a name to the file (i.e.: CALIB02.fix) and click on « Save ». 13.1.2.9. Report setting up - Select on « Report » and « New ». - 107 - Lab Power software for Uvi Light & UVIKON - Select « Report » and « Insert ». - Insert in the desired order: - the parameters - the file info. - the measured values. - the results. These data can be inserted on the same report. 13.1.2.10. Report backup - 108 - Lab Power software for Uvi Light & UVIKON - Select « Report », « Save as… ». - Give a name to the file (i.e.: CALIB01.rep) and click on « Save ». 13.1.2.11. Printing - 109 - Lab Power software for Uvi Light & UVIKON - Select the data window to print (Report window in the above example) - Select « File » and « Print ». 13.1.2.12. Summary of the backup files In this example: - File of calibration method: - File of calibration curve: - File of measuring method: - File of results (calculated values): - File of results (read values): - File of report: CALIB01.pcf CALIB01.con CALIB01.pfx CALIB01.fix CALIB02.fix CALIB01.rep 13.2. CALIBRATION IN TIME DRIVE This measuring mode is not available on this software version. 13.3. CALIBRATION IN AUTO RATE ASSAY This measuring mode is not available on this software version. - 110 - Lab Power software for Uvi Light & UVIKON PART IV Options & Accessories - 111 - Lab Power software for Uvi Light & UVIKON 14. CELL CHANGER ►◄ 14.1. « SPECIFIC COMMAND FOR UVI LIGHT » In this example, each series comprising the measurement of two samples (see the acquisition parameters), it is not possible to make other operations. Nevertheless the fact of clicking on the button or making “Execute” and “Break” makes it possible to take again the hand. WARNING : It is not made the average of the results per series. 14.1.1. Installation - Switch off the spectrophotometer. - Connect the cell changer. - Install the cell changer. - Switch on the spectrophotometer and run Lab Power software (see starting procedure paragraph 5.3 page 17). The cell changer is recognized at the time of initialization. 14.1.2. Operating modes of the cell changer The reference (blank) is put in A position of the cell changer. It is read against the air and the samples in position from B to I are read against the reference. When the cell changer is selected (« Parameters », « Cell Changer » and « On » selected), the measurement of the samples will be done by passage of each one of them in front of the measurement beam. When the cell changer is not selected (« Parameters », « Cell Changer » - 113 - Lab Power software for Uvi Light & UVIKON and « On » no selected), the cell changer sets the A position of the cuvette holder in front of the measurement beam and does not move anymore. The spectrophotometer behaves then as if it had one a single cell holder. 14.1.3. Manual use Whether the cell changer is selected or not, it is possible to move it manually to put in the measurement beam one of the positions (from A to I) of the cuvette holder. Select « View », « Accessories » and « Cell Changer – Manual Control » or click on the icon The following dialog box appears: It is then enough to click on the position corresponding to the cuvette to measure. 14.1.4. Cell changer use inside the various measuring modes 14.1.4.1. Fixed wavelength Reference in A position. Samples from B position to I position (8 samples by batch). The measurement starts by the first sample. When the time programmed in « Averaging time » is finished, the cell holder moves on the second sample. Only one measurement is done and displayed per sample. The cell changer can measure also standards in « Fixed Wavelength » in the “Calibration” mode. It is necessary in this case to enter the number of standards in « Parameters », « Acquisition » and « No. of samples ». 14.1.4.2. Wavelength scan Reference in A position. Samples from B position to I position (8 samples by batch). The full spectrum of the first sample is saved, then the cell holder moved until the second sample. This process continuous until the number of samples programmed in “No. of samples” was measured. 14.1.4.3. Time drive The spectrophotometer performs first the zero against the reference (A position) then it moves the cell holder on the B position. Then it records the absorbance development of the first sample during the time programmed in « Measure Time ». Then, it comes back on the A position to perform the zero again. It goes on the second sample (C position) to record the development of its absorbance. This process continuous until the number of samples programmed in “No. of samples” was measured. 14.1.4.4. Auto rate assay In this method the instrument can measure 8 samples simultaneously. The spectrophotometer performs first the zero against the reference (A position) then it moves the cell holder on the B position. It makes the first measurement on the sample 1. Then, it comes back on the A position to perform the zero again. It moves the cell holder on the C position. It makes the first measurement on the sample 2. - 114 - Lab Power software for Uvi Light & UVIKON This operation is repeated until the first measurement is made on the number of samples programmed in “No. of samples” was measured. Then the same process proceeds to take second measurement point on all the samples and this as many times as programmed in “No of Reading”. 14.1.4.5. Wavelength program The reference (A position) and the number of samples programmed in « No. of samples » are measured at the first wavelength. Then the second wavelength is selected. The reference and the samples are measured again. This process is repeated until all samples were measured with all the wavelengths. 14.2. « SPECIFIC COMMAND FOR UVIKON XL/XS » 14.2.1. Installation - Switch off the spectrophotometer and connect the accessory cable on the connector located on the accessory board inside the cuvette well. - Switch on the spectrophotometer. And run Lab Power software. The cell changer is automatically recognized during the initialization. 14.2.2. Activation The cell changer is setting in 6 samples / 1 reference mode during the initialization. 14.2.3. Operating mode of cell changer The cell changer has 3 operating modes. It is possible to select these operating modes by selecting « Parameters » and « Cell Changer » - 115 - Lab Power software for Uvi Light & UVIKON 14.2.3.1. Sample Offsets It is possible to enter, separately, an offset for each sample except for the reference. The data are displayed with the offset directly deducted for each sample. The possibility of deducting an offset can be very useful when the analyzed samples have different levels of absorbance 14.2.3.2. 6 samples / 1 reference. This mode allows measurement of 6 samples in the sample cell holder against 1 reference in position 1 of the reference cell holder. Only the sample cell holder moves during measurement. Figure below shows the cell holder positions at start and end of a measurement if all 6 cells are measured. This mode can also be selected starting from the dialog box of the manual use of the cell changer. - 116 - Lab Power software for Uvi Light & UVIKON 14.2.3.3. 6 samples / 6 references This mode allows measurement of 6 samples in the sample cell holder against 6 references in the reference cell holder. Both holders move simultaneously during measurement (see figure below). This mode can also be selected starting from the dialog box of the manual use of the cell changer. - 117 - Lab Power software for Uvi Light & UVIKON 14.2.3.4. 10 samples / 2 references. This mode allows measurement of 10 samples (5 in the sample cell holder and 5 in the reference cell holder) against 2 references (ref. 1 in position 1 of the ref. cell holder, ref. 2 in position 6 of the sample cell holder). Both holders move independently during measurement (see figure below). If more than 5 samples are selected in the 10 samples against 2 references mode the sample and reference beams are swapped after the fifth sample has been measured. This unique 'Beam switching' is possible due to the fact that both beams have a fully symmetric optical layout as well as symmetrical data acquisition electronics. This mode can also be selected starting from the dialog box of the manual use of the cell changer - 118 - Lab Power software for Uvi Light & UVIKON 14.2.3.5. Manual operation If the cell changer « Off » mode is selected, it can be manually moved by using keys S (Sample) and R (Reference) on the keyboard below. The measurement is done on the cell which has been manually selected. The manually used of the cell changer is activated by selecting « View », « Accessories » and « Cell Changer – Manual Control » or by clicking on the icon NOTE: The cell changer keys (S) and (R) can be used to manually change the cells in the sample and reference beams. The cell changer keys can be used even when a cell changer mode has been selected. In this case both cell holders are moved automatically to position 1 at measurement start. - 119 - Lab Power software for Uvi Light & UVIKON 14.2.4. Cell changer use inside the various measuring modes 14.2.4.1. Auto rate assay In this method the instrument can measure up to ten samples simultaneously when the cell changer is in use. Measurement starts with the first reading on sample 1. The cell changer then moves to the next position and measures the first reading on sample 2. This process continues until all selected samples (parameter No of samples) have been measured once. The instrument will then continue measurement with the second reading on sample 1 and all other samples. The whole process is repeated until the selected number of readings has been measured. Up to ten curves (depending on the selected number of samples) can be displayed on the screen during measurement 14.2.4.2. Fixed wavelength Measurement starts with the first sample. After the selected “Averaging Time” the cell changer will move to the second sample. Only one reading per sample is measured and displayed. The cell changer can also be used to measure standards in the “Calibration” mode. 14.2.4.3. Wavelength scan The complete scan is carried out on the first sample before the cell changer moves to the second position and measurement of sample 2 is carried out. This process continues until all selected samples have been measured. 14.2.4.4. Time drive The complete time drive is carried out on the first sample before the cell changer moves to the second position and measurement of sample 2 is carried out. This process continues until all selected samples have been measured. 14.2.4.5. Wavelength program All samples are measured at the first wavelength, then the wavelength is changed to the second one and all samples are measured again. This process will be repeated until all wavelengths on all samples have been measured. - 120 - Lab Power software for Uvi Light & UVIKON 15. SIPPER ►◄ 15.1. « SPECIFIC COMMAND FOR UVI LIGHT » 15.1.1. Sipper selection Connect the peristaltic pump to the spectrophotometer and select “Auto” on the box Run Lab Power software. - Click on “Parameters” and “Sipper”. - Select “On”. 15.1.2. Sipper adjustment - Click on “Execute” and “Sipper Calibration” - 121 - Lab Power software for Uvi Light & UVIKON - Enter 1 ml for “Calibration volume”. - Enter 150 µl/sec for the “Speed”. - Prepare 5 tubes with each one 2000 µl of distilled water and a sixth with 1000 distilled water µl. It will be used as standard. - Present the first tube with 2000 distilled water µl and to click on “Run test”. The instrument sucks up a certain quantity of liquid. - Compare the remaining volume in the tube with the 1000 µl of the standard tube. - If the remaining volume is different from the volume of the standard tube, change speed (µl/s) with the keys “+” or “- “. NOTE: As the speed of the peristaltic pump is constant, it is the time of sucking up which will change. If the sucked up volume is too large, the operator will increase speed, then the time of sucking up will be decreased and smaller is the sucked up volume. When the remaining volume in the tube is equal to the volume of the standard tube, click on “OK”. 15.1.3. Sipper parameters - Select “Parameters”, “Sipper” and “Sipper parameters…” - 122 - Lab Power software for Uvi Light & UVIKON Sipper Volume: It is the sample volume (expressed in µl). Enter one value between 0.2 and 40 ml. The recommended value for a smoothing outputs flowthrough cell is 700 µl. Lag Time: It is the time (expressed in seconds) between the end of sucking up and the beginning of measurement. This time makes it possible the sample to degas (bubbles) or to be stabilized in the cuvette (watered effect). Enter a value between 1 and 20 seconds. Recommended value = 4 seconds. Dead Volume: This dead volume will be sucked up between each sample in order to separate them and to reduce the contamination inter samples. Enter a value between 0 and 2 ml. Make sure that the beginning of dead volume (end of the sample) is always outside of the flowthrough cell (see the drawing below). This dead volume depends on the length of the aspiration tube. The more important dead volume will be, the more the end of the volume of the sample will be close to the input of the flowthrough cell. .Fig. 1 Dead volume explanation WARNING: Total sucking up volume = Sample volume + Dead volume - 123 - Lab Power software for Uvi Light & UVIKON Also, if the operator wants to separate the samples by air (reduction of the contamination inter samples), it must fill its tube with the exact quantity with sample which it programmed in the parameters of the peristaltic pump. The peristaltic pump will suck up first the sample (sample volume) then the air (dead volume)... 15.1.4. Measurement - Use “MANUAL” position of the peristaltic pump button to fill the flowthrough cell with the blank solution. - Click on the icon to perform the zero. to start the sample automatic - Select « Execute » and “Fill Sipper” or click on the icon sucking up. After the sucking up and the delay, the sample measurement will be automatic. - The operator will be able to measure again the same sample by clicking on the icon There will not be new sucking up. 15.1.5. . Backup of sipper parameters The sucking up parameters will be saved (except the dead volume) with the analysis parameters. 15.2. « SPECIFIC COMMAND FOR UVIKON XL/XS » The automatic sucking up is based on a system of peristaltic pump with a pump of tube cassette and an easy replacement of the pipe. All the functions of the sucking up can be controlled via the tools bar of the Lab Power software 15.2.1. Installation - Switch off the spectrophotometer and connect the item cable on the connector of the accessories board. - Switch on the spectrophotometer and run Lab Power software. The sipper is automatically recognized during the initialization. 15.2.2. - Parameters selection Select « Parameters » and «Sipper» It displays: Sipper Volume: It is the sucking up volume. - 124 - Lab Power software for Uvi Light & UVIKON Settling Time: Define the minimum time between the end of the sucking up and the sample measurement. It is also possible to use the “Settling Time” parameter which is located in the acquisition parameter of each measuring mode (except « Wavelength Scan »). to suck up the sample inside the - Click on « Execute » and « Fill Sipper » or on the icon flowthrough cell; the measurement will start automatically after the end of time « Settling Time ». When the sample is inside the flowthrough cell, it is possible, by clicking on the icon to measure again the same sample. The key sample. - Click on the icon 15.2.3. allows getting back 90% of the to suck up and measure a new sample. Function of sipper buttons ASPIRATION AND MEASUREMENT OF THE SAMPLE . The sample will be moved Select « Execute » and « Fill Sipper » or click on the icon inside the flowthrough cell and the measurement will start automatically after the time « Settling in place of the icon Time ». If the user click on the icon flowthrough cell will be measured again without waiting time. RINSING - 125 - , the sample inside the Lab Power software for Uvi Light & UVIKON Select « Execute » and « Sipper Rinse » or click on the icon . This function is used to rinse the sipper. The peristaltic pump works all the time that the operator pushes the key. RECOVERY OF THE SAMPLE Select« Execute » and « Sipper Return » or click on the icon back 90% of measured sample. - 126 - . This function is used to get Lab Power software for Uvi Light & UVIKON 16. STIRRER ►◄ 16.1. « SPECIFIC COMMAND FOR UVIKON XS/XL » This accessory is made to be installed inside the base of the standard single cell holder. The stirrer consists of two engines with D.C. current which controls small permanent magnets. These magnets involve the rotation of magnetic bars in the tanks. 16.1.1. Installation - Switch off the spectrophotometer and connect the item cable on the connector of the accessories board. - Switch on the spectrophotometer and run Lab Power software. The stirrer is automatically recognized during the initialization. 16.1.2. Activation From the main menu, select « Parameters » and « Stirrer » From the stirrer menu, select the speed of the magnetic bars, from 10% to 100%. Select « Off » to stop the stirrer. With the option « Timed » the stirrer works during 10 seconds with the last selected speed. - 127 - Lab Power software for Uvi Light & UVIKON 17. TEMPERATURE SENSOR ►◄ 17.1. « SPECIFIC COMMAND FOR UVIKON XS/XL » The temperature sensor is a miniature probe with an inert glass body to measure the temperature inside the cuvette. A special support which is provided, can be fixed in the cuvette compartment. 17.1.1. Installation - Switch off the spectrophotometer and connect the item cable on the connector of the accessories board. - Switch on the spectrophotometer and run Lab Power software. The temperature sensor is automatically recognized during the initialization. 17.1.2. Activation From the main menu, select « View » and « Temperature ». The temperature is then displayed on the screen. - 129 - Lab Power software for Uvi Light & UVIKON 18. THERMOSYSTEM ►◄ 18.1. « SPECIFIC COMMAND FOR UVIKON XS/XL » The THERMOSYSTEM consists of a quick lock automatic 6+6 Cell Changer with a Peltier effect thermostating system and magnetic stirring capability. The THERMOSYSTEM must be connected to an external liquid circuit to cool the Peltier elements. 18.1.1. Activation From the main menu, select « View », « “Temperature » and « Thermosystem » or click on the icon . - 131 - Lab Power software for Uvi Light & UVIKON 18.1.2. THERMOSYSTEM displaying When the THERMOSYSTEM is activated, the following screen is displayed : By clicking on this button (Top right), the screen will be in reduced mode. See under: Then, only temperatures are displayed. 18.1.3. « Remote control » or « local » mode The THERMOSYSTEM can be used in « local » mode with the built-in keyboard of the control box or in « Remote control » mode through Lab Power software. « Remote control » mode « local » mode 18.1.4. THERMOSYSTEM functions Temperature programming: The temperature can be program by writing the value or by selecting it with arrow keys This value is taking in account by clicking on Gradient programming: It is programmable in the same way as temperature. It is activated or not by clicking on the button close the display. Temperature gradient is activated. Temperature gradient is not activated The stirring rate is selected using « Min/Max » buttons. - 132 - Lab Power software for Uvi Light & UVIKON 18.1.5. Alarms COMMUNICATION ERROR Check communication between the 6 + 6 cell changer and the control box. OUT OF LIMIT TEMPERATURE The temperature is displayed in red as long as it has not reached its programmed value. TEMPERATURE DETECTION ERROR This message is displayed if there is no communication with the temperature probe if this one is out of order. - 133 - Lab Power software for Uvi Light & UVIKON 19. THERMOPACK The THERMOPACK is a thermostatisation system of an internal liquid by PELTIER which allows the complete compatibility and connection with all thermostatable accessories of UVIKON and Uvi Light spectrophotometers. The THERMOPACK has the same functionalities as the THERMOSYSTEM except the temperature control which is done on only one channel instead of two. NOTE : The stirring system is not available. - 135 -