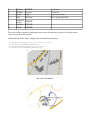
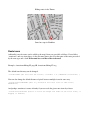
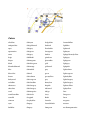
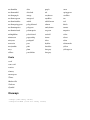
1
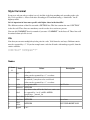
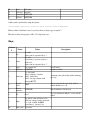
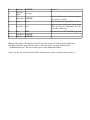
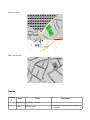
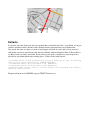
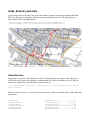
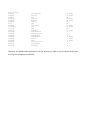
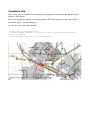
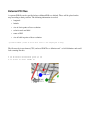
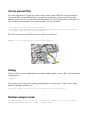
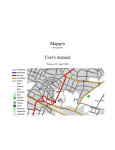
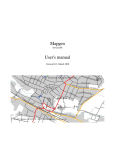
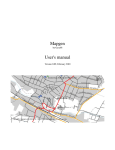
Mapgen by Gary68 User's manual Version 1.09, September 2010 Table of Contents Introduction................................................................................................................................................3 Hints .....................................................................................................................................................3 Installation..................................................................................................................................................3 Basic parameters........................................................................................................................................5 Output.........................................................................................................................................................5 Usage examples..........................................................................................................................................5 Map size and the like..................................................................................................................................6 Advanced parameters.................................................................................................................................7 basedpi...................................................................................................................................................9 Understanding rules and dpi .................................................................................................................9 Setting a scale for rules alone..............................................................................................................10 Style file format........................................................................................................................................11 File.......................................................................................................................................................11 Nodes..............................................................................................................................................11 Ways................................................................................................................................................12 Routes..............................................................................................................................................14 Route icons......................................................................................................................................16 Colors...................................................................................................................................................17 Fonts....................................................................................................................................................18 Oneways....................................................................................................................................................18 Extracts.....................................................................................................................................................19 Declutter...................................................................................................................................................20 Grids, directory and stats..........................................................................................................................21 Street directory.....................................................................................................................................21 Poi and place list..................................................................................................................................22 Street and POI directory in PDF .........................................................................................................22 Statistics...............................................................................................................................................22 Coordinates Grid ................................................................................................................................24 External POI files.....................................................................................................................................25 Circles around POIs.................................................................................................................................26 Debug.......................................................................................................................................................26 Relation analyzer mode............................................................................................................................26 Introduction Mapgen has its roots in osmdiff.pl and osmrender.pl. They were very basic render programs. Once Haiti was hit by the strong earthquake I wanted to provide large png maps for the local help. This proved to be hard since so many things couldn't be done with my programs. So I decided to improve the features of my renderer and give it a new name. So the basic goals became: • • • • • • Fast and easy map generation, different output formats Fast extraction of needed data out of *.osm files (place=*) Easy style file handling Street and place directories Keep it simple (easy invocation with only 2 mandatory parameters) Keep it powerful (by using more parameters) Hints The projection method used is Mercator, ellipsoid is WGS84. Projection used is displayed in footer of map. Be aware that at the edges of the map items may be missing. This may occur when items are not completely contained in the osm file. You can try to prevent this by using the clip parameter with larger values. Installation •Put the mapgen.pl file in a folder •Put dir.pl in the same folder •Put *.pm files in a subfolder called OSM (can also be put into a directory contained in the @INC pathes) •Get Math::Poygon from CPAN and create a subfolder Math (can also be put into a directory contained in the @INC pathes) •(Install osmosis if desired; take care that it can be invoked from command line) •(Install inkscape if desired; take care that it can be invoked from command line) This is necessary when usein SVG files as tile patterns or when converting from SVG to PNG or PDF! •bzip2 installation: sudo aptget install libcompressbzip2perl •GD installation: sudo aptget install libgdgraph3dperl •Geo::Proj4: cpan<enter>, dann install Geo::Proj4 •For the directory in PDF format you'll also need the following: ◦latex: sudo aptget install texlivelatexbase ◦dvips: sudo aptget install texlivelatexbin ◦ps2pdf: sudo aptget install texlivelatexbin Information about Osmosis can be found here: http://wiki.openstreetmap.org/wiki/Osmosis Basic parameters Obviously there are some things that can't be hidden from the user. So the user has to specify at least 2 basic parameters: -in=file.osm -style=style.csv (original can be kept and maintained in OO sheet or MS Excel) in also supports *.osm.bz2 format. Default output name is mapgen.svg. Output Basic and only output format from mapgen itself is SVG. That has the advantage that all further formats contain all elements that mapgen can produce. Disadvantage is a postprocessing done by inkscape. -out=file.svg (png and pdf names are automatic, DEFAULT=mapgen.svg) There are two options specifying additional output formats: -png (also produce png, inkscape must be installed, very big) -pdf (also produce pdf, inkscape must be installed) The names are automatic and derived from the out name. Inkscape must be installed and your system must be able to run it from command line in the current directory. The PNG files are rather big. So maybe some postprocessing is appropriate. Usage examples Most simple form: perl mapgen.pl -in=file.osm -style=mapgenRules.csv Also specify an output name, if you wish perl mapgen.pl -in=file.osm -style=mapgenRules.csv -out=map.svg Also specify size and that you want a PDF additionally: perl mapgen.pl -in=file.osm -style=mapgenRules.csv -size=2048 -pdf Now let's say you have a big osm file but only want a map of a certain city: perl mapgen.pl -in=germany.osm -style=mapgenRules.csv -place=Frankfurt This will probably not cover the whole of Frankfurt because the default radiuses are too small (2km each direction) perl mapgen.pl -in=germany.osm -style=mapgenRules.csv -place=Frankfurt -lonrad=10 -latrad=10 Now we want our map with grid lines and a street directory: perl mapgen.pl -in=file.osm -style=mapgenRules.csv -grid=8 -dir And let's turn off the legend: perl mapgen.pl -in=file.osm -style=mapgenRules.csv -legend=0 Map size and the like The background color can be set according to the given color set. The size of the picture is specified by the width in pixels. Height is automatically calculated. Clipping means that not all of the data given in the osm file will be presented. This is useful to clip incomplete data at the edges of the area in the osm file. Clipping can be done by a percentage or by giving a bounding box, which might be more precise. Giving a bounding box overrides simple clipping. Symmetric clipping Clipping to enable big elements not completely in bbox Padding means to pad the map with an empty border. Useful for islands... Program will output some useful information about map and paper sizes as well as resolution and scale. -bgcolor=TEXT (color for background) -size=<integer> (in pixels for x axis, DEFAULT=1024) -clip=<integer> (percent data to be clipped on each side, 0=no clipping, DEFAULT=0) -clipbbox=<float>,<float>,<float>,<float> (left, right, bottom, top of bbox for clipping map out of data - more precise than -clip; overrides -clip!) -pad=<INTEGER> (percent of white space around data in osm file, DEFAULT=0) Advanced parameters By default a legend is drawn in the upper left corner. This can be switched off. -legend=INT (0=no legend; 1=legend in top left corner; 2 = legend in lower right corner; DEFAULT=1) You can also place the legend in the lower right corner by giving legend=2 The legend will only show elements that would be drawn if present in the current map scale! A ruler is drawn by default in the upper right corner. This can be switched off as well. Additionally a color can be specified. -ruler=INT (0=no ruler; 1=draw ruler; DEFAULT=1) -rulercolor=TEXT (DEFAULT=black) Optionally a scale value can be calculated and added to the map. Of course the color for this text can be set. -scale (print scale) -scalecolor=TEXT (set scale color; DEFAULT = black) A specific scale can be set. i.e. 1:25.000 by adding scaleset=25000 to the command line. To be able to work with this information you have to specify the resolution of the output device in dpi. By default this is set to 300dpi. -scaleset=INTEGER (1:x preset for map scale; overrides -size=INTEGER! set correct printer options!) -scaledpi=INTEGER (print resolution; DEFAULT = 300 dpi) Setting the scale overrides the size parameter! The program will in any case print information on how big the map will be and on what paper size it will fit. basedpi basedpi is the dpi on which the sizes in the rules file are given. So if you i.e. want to use a base resolution of 72dpi you could set this by specifying basedpi=72. You should then also specify scaledpi=72. -basedpi=INTEGER (rule size resolution; DEFAULT = 300 dpi) Understanding rules and dpi First of all: The next paragraphs apply to PNG or other pixel related (unscaled) graphic formats like JPG or BMP. When using PDF or SVG you don't have to care about this too much. Because there is always a bit confusion about sizes of objects and the according rules I want to give some hints. The rules provided in SVN are for a resolution of 300dpi. So the resulting files should be suitable for printing. In the file there are ways that have a thickness of let's say 40px. What does that mean? It means that when printing with 300dpi the way will be displayed using 40 pixels, which is roughly 3mm. If you look at this same map on a screen you will have much larger ways because the resolution of the screen is much lower (90120dpi). What to do? Very simple. To create a map for the screen using the same style file just specify scaledpi=117 (i.e. for my netbook). Everything will be scaled now. Of course you can't send this to the printer now because everything would be too small. If you use the 300dpi rule file and you want to print with a higher resolution, just specify scaleset=600 or 1200. What to do if you want to specify your rule file for another resolution than 300? Just as easy but don't forget: You now have to use basedpi=75 (or whatever you chose) each time you call mapgen. Let's look at our 40px way from above. Assuming a base dpi of 75 this way would have to have a thickness of only 10px! Assuming a base dpi of 600 would mean to specify a thickness of 80px. Some Hints: • my netbook has a resolution of 117 dpi • my 18" monitor has a resolution of 90 dpi • for printing choose a scalable format or a dpi of 300 dpi or more. most laser printers today support 600 or even 1200 dpi Setting a scale for rules alone If you specify a certain scale for rulescaleset then for selecting rules not the actual scale of the map is used but the specified one. This is useful to show more or less details than initially intended by the given ruleset (minScale, maxScale). A similar function can be found in the Garmin GPS receivers: Map details normal/more/most/less/least. -rulescaleset=INTEGER (determines the scale used to select rules; DEFAULT=0, meaning actual map scale is used to select rules) Style file format In any case only one rule per object is used. And this is the first matching rule according to the style file. So it's possible i.e. first to look after all tracktype=XY and then having a “default rule” for all highway=track. So it is important to have more specific rule higher above in the sheet/file! The different sections of the file start with a SECTION line: This line contains the word “SECTION” in the first cell. These lines are mandatory even if no rules for a section are present. You can add COMMENT lines for remarks if you enter “COMMENT” in the first cell. These lines will be omitted when style file is read. File Note that you can enter multiple key/value pairs for a rule. Valid for nodes and ways. Different entries must be separated by a “|”. If you for example want a rule for all tracks with tracktype=grade1, then the entries would be: column key/tag: highway|tracktype column value: track|grade1 Nodes Column # 1 2 3 4 5 6 7 8 9 Name Values Description see wiki values can be separated by a “|”. see above see wiki value an asterisk (*) may be used as a wild card values can be separated by a “|”. see above color see separate table the fill color thickness INTEGER key, where value will be the label text; entries can label be separated by ! or #. !=AND. #=PRIO special keys: _lon and _lat label color see list below label size INTEGER size of text label INTEGER NOT USED RIGHT NOW offset legend 0 or 1 key 10 11 12 13 Icon File name Icon size In pixels FromScale INTEGER ToScale INTEGER A halo can be specified by using the option: -halo=<FLOAT> (white halo width for point feature labels; DEFAULT=0) However then a bold font is used so you also have to adjust ppc to maybe 7. The halo is white and opacity is 90%. Use large font sizes. Ways Column # 1 2 3 4 5 6 7 8 9 10 Name Values see wiki values can be separated by a “|” see wiki an asterisk (*) may be used as a value wild card values can be separated by a “|” color see separate list thickness INTEGER 14: for tracks 1014: relation 1:1 dashes dash style 2023: for borders 3035: for steps (drawn with linecap=BUTT) Border TEXT color Border INTEGER thickness Description key fill 0 or 1 key, where value will be used as label text. entries can be separated label by ! or #. !=AND. #=PRIO special keys: _lon and _lat label color see below the fill color thickness of line determines the style of the dashes forming the way Border color for the way. Only valid if border thickness is > 0 Border thickness for the way 0 = area will not be filled; 1 = area will be filled 11 11 12 label size INTEGER label font see below family 13 label offset INTEGER 14 legend 15 base layer 0 or 1 16 17 16 Icon TEXT FromScale INTEGER ToScale INTEGER 0 or 1 font size offset for label text in ydirection (negative = up, positive = down) entry for automatic legend (0=no, 1=yes) applies for areas (closd ways). areas tagged with 1 are drawn as "background" first. use for landuse, natural etc. Fill icon for area. SVG and PNG supported Mapgen will produce a file that lists all labels that were not placed on the map but should have according to the rules given. The file name is derived from the svg name and ends with "_NotDrawnLabels.txt". The user can then process this information further. Using _lon and _lat you could nicely label a natural=peak, using a second rule for elevation i.e: Using area icons... Ways with borders... Routes Column # Name Values 1 RouteType bus, hiking see wiki 2 Color(s) All valid colors Description A set of colors can be given by using the ; as a delimiter 3 4 5 6 7 8 9 Thickness DashType Opacity Label StopNodeT hickness FromScale ToScale INTEGER See above 0..100 Valid keys ...of the line ...of the line ...opacity in percent Key to get the label from INTEGER INTEGER INTEGER The colors will be assigned to each found route in order of occurrence in style file if no k/v for the colors are present in the osm file. Additionally the labels can be configured by command line parameters: -routelabelcolor=TEXT (color for labels of routes) -routelabelsize=INTEGER (DEFAULT=28) -routelabelfont=TEXT (DEFAULT=sans-serif) -routelabeloffset=INTEGER (DEFAULT=35) Bus routes in Frankfurt Hiking routes in the Taunus Some bus stops in Frankfurt Route icons Aditionally icons for routes can be added to the map if icons are provided as follows. Create folder “routeicons” and save icons there. As the file name choose the ref or the name of the route preceeded by the route type and a dash. If the route has a ref the ref has to be used! Example: ./routeicons/hikingE3.png OR ./routeicons/hikingE3.svg The default icon directory can be changed. -icondir=TEXT (dir for icons for routes; ./icondir/ i.e.; DEFAULT=./routeicons/ ) You can also change the default distance of pixels between multiple icons for same way. -routeicondist=INTEGER (dist in y direction for route icons on same route; DEFAULT=75) And perhaps sometimes it comes in handy if you can scale the given route icons by a factor. -routeiconscale=FLOAT (factor to scale the height and width of the route icons; >1 bigger; <1 smaller) Colors aliceblue darkcyan dodgerblue lemonchiffon antiquewhite darkgoldenrod firebrick lightblue aqua darkgray floralwhite lightcoral aquamarine darkgreen forestgreen lightcyan azure darkgrey fuchsia lightgoldenrodyellow beige darkkhaki gainsboro lightgray bisque darkmagenta ghostwhite lightgreen black darkolivegreen gold lightgrey blanchedalmond darkorange goldenrod lightpink blue darkorchid gray lightsalmon blueviolet darkred green lightseagreen brown darksalmon greenyellow lightskyblue burlywood darkseagreen grey lightslategray cadetblue darkslateblue honeydew lightslategrey chartreuse darkslategray hotpink lightsteelblue chocolate darkslategrey indianred lightyellow coral darkturquoise indigo lime cornflowerblue darkviolet ivory limegreen cornsilk deeppink khaki linen crimson deepskyblue lavender magenta cyan dimgray lavenderblush maroon darkblue dimgrey lawngreen mediumaquamarine mediumblue olive purple snow mediumorchid olivedrab red springgreen mediumpurple orange rosybrown steelblue mediumseagreen orangered royalblue tan mediumslateblue orchid saddlebrown teal mediumspringgreen palegoldenrod salmon thistle mediumturquoise palegreen sandybrown tomato mediumvioletred paleturquoise seagreen turquoise midnightblue palevioletred seashell violet mintcream papayawhip sienna wheat mistyrose peachpuff silver white moccasin peru skyblue whitesmoke navajowhite pink slateblue yellow navy plum slategray yellowgreen oldlace powderblue slategrey Fonts •serif •sansserif •cursive •fantasy •monospace •Times •Baskerville •Verdena •Symbol Oneways -oneways (add oneway arrows) -onewaycolor=TEXT (color for oneway arrows) Extracts If you don't wan't the whole osm data to be printed that is contained in the file – no problem. As long as you have installed osmosis and this can be invoked from the current directory by command line. Just specify the name of a place or a node id and mapgen will look for such a place. Upon success it will invoke osmosis to extract the needed data. By default a width and height of 4km (2*2km radius) is set. But of course it can be overridden. If you want to speed up the search process you can provide a placefile in osm format which only contains places. Can be created with osmosis. -place=TEXT (Place to draw automatically; quotation marks can be used if necessary; node id can be given alternatively; OSMOSIS REQUIRED!) -lonrad=FLOAT (radius for place width in km, DEFAULT=2) -latrad=FLOAT (radius for place width in km, DEFAULT=2) -placefile=<TEXT> (file in which to look for places; can be produced with osmosis; speeds up search process) Program will print used OSMOSIS string to STDOUT for later use... Declutter Usually when drawing maps (especially with lots of details) clutter may occur. •mapgen will register an used area for each drawn label and won't use this area again. •mapgen will register an used area for each drawn icon and won't use this area again. •mapgen registers a polygon for each drawn way label and will prevent collision Icons will be placed at the given location. Using option allowiconmove you can permit the program to slightly move icons if they don't fit the original position. Labels are drawn afterwards and will be placed accordingly. Using this option will significantly increase the number of drawn icons in cluttered areas! (In Frankfurt using a scale of 1:50.000 150 more icons could be drawn.) -allowiconmove (allows icons to be moved if they don't fit the exact position) Text labels for nodes and areas will be placed on a default position and orientation. If this is not possible other positions and alignments will be tried. So labels might me moved and/or omitted at all. At the end of map drawing program will show how many labels and icons were omitted or moved. To prevent a special form of clutter caused by certain parallel ways the following option may be specified: -declutter (declutter text; WARNING: some labels might be omitted; motorway and trunk will only be labeled in one direction) •Motorways and trunks will be labeld only in one direction mapgen tries not to put labels on ways that are too short. To do so it calculates the length of the way and the length of the text. This is done by assuming a need of 6 pixels per character for a 10pt font. Other font sizes are calculated automatically. If you find out that 6 ppc doesn't suit your used font, please reconfigure the value using the following option. -ppc=<float> (pixels needed per label char using font size 10, DEFAULT=6) Grids, directory and stats A grid can be laid over the map. Just specify the number of squares you want in longitude direction. The other dimension is automatic. Of course you can specify the grid color. The grid squares are labeled numerically and alphabetically. -grid=<integer> (number parts for grid, 0=no grid, DEFAULT=0) -gridcolor=TEXT (color for grid lines and labels (DEFAULT=black) Street directory mapgen can even create a street directory. It will do so including the grid squares where the street is located if the grid is turned on. Output is an unformatted street list to be further processed. The grid squares are separated by a tab. File name is name_streets.txt. -dir (create street directory in separate file. if grid is enabled, grid squares will be added) In the next table you can see a section of the street directory. On the left without grids, on the right with grid squares: Burgstraße Cohausenstraße Crufterostraße Elisabethenstraße Eschborner Weg Feldbergstraße Burgstraße......................B1 Cohausenstraße............A1 A2 B1 Crufterostraße..................D2 Elisabethenstraße. . .B2 C1 C2 D1 E1 Eschborner Weg..................C1 Feldbergstraße...............A1 B1 Poi and place list You can print a poi and place list like the street directory. Grid option applies as well. -poi (create list of pois) Delkenheim.................C5 Diedenbergen...............F4 Eddersheim.................G5 Edeka Kundenparkplatz......G7 Falkenberg (Keramag).......E7 Flörsheim..................F6 Geldautomat................C1 Street and POI directory in PDF You can create a formatted street and POI directory in PDF format. To be able to do so you need some programs installed (see installation): latex dvips ps2pdf Also necessary is to also specify the options to create street and POI directories with dir and/or poi and a grid created by grid=x. -dirpdf (creates directory of streets and POIs if according options for generation are set) -dircolnum=INTEGER (number of columns for PDF directory of streets and POIs; DEFAULT=3) -dirtitle=TEXT (title for PDF directory of streets and POIs; DEFAULT="mapgen map") Statistics You can print a tag statistic about the usage of the keys and values. To keep the list short unimportant keys are omitted. This must be adapted in the code if desired. The idea is to see what keys are used mostly. So you can decide for which features rules are needed. Mapgen will print an alphabetical list of keys and values as well as a list of the most used k/v combinations. At the end of each line the program prints if it knows a rule for that k/v. Output is separated for nodes and ways and will be written in a file called name_tagstat.txt -tagstat (lists keys and values used in osm file; program filters list to keep them short!!! see code array noListTags) TOP 20 LIST: highway highway oneway highway highway highway foot highway building bicycle amenity surface service highway landuse highway highway highway amenity amenity residential footway yes service primary steps yes secondary yes yes parking cobblestone parking_aisle pedestrian residential track path living_street restaurant pharmacy 123 51 38 21 19 14 12 11 10 10 10 9 8 8 6 6 5 5 5 5 RULE RULE RULE RULE RULE RULE RULE RULE RULE RULE - Obviously we should maybe implement a rule for oneway=yes. And we can see that by far the most used tag here is highway=residential. Coordinates Grid You can add a grid of coordinates to your map by specifying the coords option. By default the grid distance is 0.01 degrees. This can be changed by using the coordsexp parameter. The value given here is the power of 10. (2 means 0.01 degrees, 2 means 10 degrees). And of course the color can be changed. -coords (turn on coordinates grid) -coordsexp=INTEGER (degrees to the power of ten for grid distance; DEFAULT=-2 equals 0.01 degrees) -coordscolor=TEXT (set color of coordinates grid) External POI files A separate POI file can be specified where additional POIs are defined. These will be placed on the map according to their positions. The following information is needed: • longitude • latitude • size of dot in points of base resolution • color for node and label • name of POI • size of label in points of base resolution -poifile=<TEXT> (name of file with POIs to be displayed in map) The file must be in text format (CSV) and uses SPACE as a delimiter and " as field delimiters and could look someting like this: 8 50 40 "blue" "confluence point 1" 40 9 50 40 "blue" "confluence point 2" 40 8.45 50.086 40 "red" "HOME" 40 Circles around POIs For some applications it is useful to be able to draw a circle around a POI, like a fire department i.e. Just specify the k/v of the POI with the rad parameter. Add distance in meters, the color and the thickness of the circle. It is possible to have multiple POIs. Just separate them with a semicolon. It is also possible to have multiple circles around one POI! Just use two entries. -circle=key,value,distance,color,thickness -circle=key,value,distance,color,thickness#key,value,distance,color,thickness;... -circle=key,value,distance,color,thickness The value may be an asterisk! Then all values of the key are allowed. Example: -circle=amenity,fire_station,3000,black,30 Debug Verbose will turn on lots of information to be printed while program executes. This is mostly done for debug purposes. -verbose If you want to print a map only containing multipolygons you can specify so. This is also a debug function, although a graphical one. -multionly (draws only areas of multipolygons; for test purposes) Relation analyzer mode -ra=TEXT (TEXT = types and/or ids, separated by commas; add relation analyzer layer; keep normal elements in map in light colors) Displays elements of relations in map. Background should be kept in light colors. Elements are labeled and whole relation will be placed inside a box.